Single-Cell Force Spectroscopy in Bacterial Adhesion: Protocols, Applications, and Future Directions for Antimicrobial Research
This comprehensive review explores single-cell force spectroscopy (SCFS) as a transformative biophysical technique for quantifying bacterial adhesion forces at the single-cell and single-molecule level.
Single-Cell Force Spectroscopy in Bacterial Adhesion: Protocols, Applications, and Future Directions for Antimicrobial Research
Abstract
This comprehensive review explores single-cell force spectroscopy (SCFS) as a transformative biophysical technique for quantifying bacterial adhesion forces at the single-cell and single-molecule level. Tailored for researchers, scientists, and drug development professionals, the article covers foundational principles of AFM-based force spectroscopy, detailed protocols for bacterial probe fabrication, and applications in studying pathogen-host interactions and probiotic mechanisms. It further addresses critical troubleshooting aspects for experimental optimization, validates SCFS against other biomechanical techniques, and highlights its pivotal role in developing novel anti-adhesive therapies and understanding antibiotic resistance from a biophysical perspective. The synthesis of current methodologies and findings provides an essential resource for advancing microbial mechanobiology and therapeutic discovery.
The Biophysical Foundation of Bacterial Adhesion: From Single Molecules to Cellular Interactions
Atomic Force Microscopy (AFM) is a powerful scanning probe microscopy technique that provides ultra-high resolution imaging and quantitative force measurements of surfaces under natural conditions, such as in air or liquid [1]. Its exceptional versatility has made it an indispensable tool in nanotechnology, materials science, and life sciences. A significant extension of AFM, known as force spectroscopy, enables the quantification of interaction forces at the nanoscale, from single molecules to entire living cells [2]. This technical guide details the core principles of AFM and force spectroscopy, with a specific focus on their application in single-cell force spectroscopy (SCFS) for bacterial adhesion research—a critical area for understanding biofilm formation, developing anti-fouling surfaces, and advancing antimicrobial strategies [3].
Fundamental Principles of Atomic Force Microscopy
Basic Operational Mechanism
The fundamental operation of an AFM involves scanning a sharp tip, mounted on a flexible cantilever, across a sample surface [4]. As the tip interacts with the surface, forces cause the cantilever to deflect. A laser beam focused on the back of the cantilever reflects onto a position-sensitive photodetector (PSPD), and nanoscale deflections alter the laser's path, allowing the PSPD to track these changes with high precision [1] [4]. By scanning the tip while maintaining a constant tip-sample interaction via a feedback loop, the AFM constructs a three-dimensional topographic map of the surface with sub-nanometer resolution [4].
Table 1: Key Components of an Atomic Force Microscope
| Component | Function |
|---|---|
| Cantilever & Tip | A flexible lever with a sharp probe that physically interacts with the sample surface. |
| Laser Diode | Emits a beam that reflects off the back of the cantilever. |
| Position-Sensitive Photodetector (PSPD) | Detects the position of the reflected laser beam, translating cantilever deflection into an electrical signal. |
| Piezoelectric Scanner | Precisely moves the tip or sample in three dimensions (x, y, z) with atomic-scale accuracy. |
| Feedback Controller | Maintains a constant interaction force by adjusting the scanner's z-position based on the PSPD signal. |
Primary Imaging Modes
AFM operates in several modes, each suited for different sample types and applications [1] [4].
- Contact Mode: The most basic mode, where the tip scans the surface in constant physical contact. The cantilever's deflection is maintained at a set value, and the Z-scanner's movement directly maps the topography [4]. While simple, this mode can exert high lateral forces, potentially damaging soft biological samples [1].
- Tapping Mode (Intermittent Contact Mode): The cantilever is oscillated at or near its resonant frequency, causing the tip to gently "tap" the surface during scanning [1]. This mode significantly reduces lateral forces compared to contact mode, making it ideal for imaging soft, fragile, or adhesive samples, including biological specimens [1].
- Non-Contact Mode: The cantilever oscillates close to the surface without making contact, sensing attractive van der Waals forces. While it minimizes sample damage, it offers lower resolution and is more challenging to operate in ambient air [1] [4].
Force Spectroscopy and Single-Cell Force Spectroscopy (SCFS)
From Imaging to Force Measurement
Force spectroscopy transforms the AFM from a purely imaging instrument into a quantitative force probe. Instead of scanning, the tip is moved directly towards the sample until contact is made, and then retracted, while the interaction force is continuously recorded as a function of distance, producing a force-distance curve (FDC) [5]. Analyzing these curves reveals a wealth of information about nanomechanical properties, including adhesion, elasticity, and specific binding events [5] [4].
Principles of Single-Cell Force Spectroscopy (SCFS)
SCFS is a specialized application of force spectroscopy designed to measure the adhesion forces of individual living microbial cells [2]. The core protocol involves immobilizing a single living cell on an AFM cantilever to create a cellular probe. This probe is then brought into contact with a substrate—another cell, a surface, or a protein—and retracted, allowing researchers to quantify the forces guiding microbial adhesion at the single-cell level [2]. This method has been instrumental for studying medically important microbes, including the probiotic bacterium Lactobacillus plantarum and pathogens like Staphylococcus epidermidis and Candida albicans [2].
Experimental Protocols for Bacterial SCFS
This section outlines two detailed methodologies for preparing cell probes for SCFS experiments on bacteria.
Protocol 1: Single-Cell Immobilization via Electrostatic Interactions
This protocol describes a robust method for immobilizing bacteria as a monolayer on a polyethylenimine (PEI)-coated bead, which is then attached to the cantilever [3].
Workflow Overview:
Detailed Methodology [3]:
- Bead Coating: Transfer 10 μL of aminated silica beads into a solution of PEI in PBS. Shake the mixture horizontally at 150 rpm for 50 minutes. Sediment the beads and wash three times with PBS.
- Bacterial Immobilization: Incubate approximately 10 μL of the coated (PEI) beads in 1 mL of a concentrated bacterial suspension (e.g., E. coli at OD₆₀₀ = 5) for several minutes. Wash the complex three times with PBS by gentle inversion to remove non-adherent cells, forming an E. coli-PEI-bead complex.
- Quality Control: Use fluorescence microscopy (e.g., for GFP-tagged bacteria) to visualize the distribution of bacteria on the beads. Assess cell viability using a live/dead stain (e.g., propidium iodide). Only beads with a suitable monolayer of viable cells should be selected for experiments.
- Cantilever Functionalization: A tipless cantilever is assembled in the AFM, and its spring constant is calibrated. The apex of the cantilever is dipped into a thin layer of fast-curing epoxy glue for approximately 5 seconds.
- Bead Attachment: Under optical microscope observation, the glue-coated cantilever is moved towards a pre-selected E. coli-PEI-bead and contact is applied with a low force (e.g., 10 nN) for 30 seconds to attach the bead.
- Force Measurement: The cantilever with the attached cell probe is transferred to a chamber containing the substrate surface of interest. Force-distance curves are recorded using defined parameters (e.g., loading force of 10 nN, contact time of 10 s) across multiple randomly chosen areas.
Protocol 2: Direct Single-Bacterium Probing
An alternative method involves the precise handling and immobilization of a single bacterium directly onto a cantilever, often modified with a bio-compatible glue [2] [3]. This method requires a well-trained operator but can provide data from a single, well-defined cell.
Key Steps:
- Cantilever Modification: A tipless cantilever may be functionalized with a concave well or a chemical glue to facilitate single-cell capture.
- Cell Capture: The modified cantilever is carefully positioned over a single, isolated bacterium from a diluted sample and gently pressed against it to achieve immobilization.
- Validation: The successful and proper attachment of a single live cell is confirmed via microscopy.
- Measurement: The single-cell probe is used to perform force spectroscopy as described in Protocol 1.
Table 2: Research Reagent Solutions for Bacterial SCFS
| Reagent / Material | Function in Protocol |
|---|---|
| Aminated Silica Beads | Provides a solid, inert substrate for the initial electrostatic immobilization of bacterial cells via a PEI coating [3]. |
| Polyethylenimine (PEI) | A cationic polymer that coats the beads, creating a positive surface charge for the electrostatic attachment of generally negatively charged bacterial cells [3]. |
| Tipless Cantilever (e.g., PNP-TR-TL-Au) | The platform for the final cell probe; tipless design allows for the gluing of a bead-cell complex [3]. |
| UV-Curable Glue / Epoxy | Used for permanently attaching a silica bead or directly immobilizing a single bacterium to the cantilever [3]. |
| Polyethylene Glycol (PEG) Linker | A flexible, heterobifunctional crosslinker used to tether specific ligand molecules to the AFM tip for single-molecule force spectroscopy studies on membrane receptors [6]. |
Data Analysis in Force Spectroscopy
The primary data output of a force spectroscopy experiment is the force-distance curve (FDC). A standard FDC obtained during SCFS, illustrating the key events during a typical approach (red) and retraction (blue) cycle of a bacterial probe from a surface, is shown below.
Interpreting the Force-Distance Curve:
- Approach Curve (Red):
- (A→B) Non-contact region: The cantilever is free and undeflected.
- (B→C) Jump-to-contact: Attractive forces (e.g., van der Waals, electrostatic) can cause the tip to suddenly snap into contact with the surface.
- (C→D) Contact line: The cantilever deflects upwards as the sample pushes against it; the slope can provide information about the sample's stiffness [5].
- Retraction Curve (Blue):
- (D→E) Adhesion regime: As the cantilever pulls away, adhesion forces can cause it to bend downwards.
- (E) Adhesion Peak: The maximum negative force represents the adhesion or unbinding force required to separate the bacterial cell from the surface [2] [5]. This is a critical measurement in SCFS.
- (E→B) Rupture Event: The bond breaks, and the cantilever snaps back to its neutral position.
Analysis of hundreds of such curves allows for the statistical quantification of adhesion forces, binding probability, and the study of binding kinetics [2] [5] [7]. For single-molecule studies, the sawtooth pattern of force curves can reveal the sequential unfolding of protein domains [1].
Advanced Techniques: TREC-Guided Force Spectroscopy
A powerful advancement combines force spectroscopy with TREC (simultaneous Topography and RECognition imaging). In this technique, an AFM tip functionalized with a specific ligand is oscillated across a surface containing its receptors [6]. Topography and binding sites (recognition) are mapped simultaneously with nanometer resolution. Functional molecules are visually selected from the recognition image, and the AFM is switched to force spectroscopy mode to perform precise force measurements on the pre-identified target [6]. This guided approach overcomes the low-throughput nature of "blind" force mapping, especially when molecules of interest, such as membrane proteins, are sparsely reconstituted into a lipid bilayer [6].
Bacterial adhesion is the critical initial step in biofilm formation, infection, and colonization. For researchers employing single-cell force spectroscopy (SCFS), understanding the interplay between specific and non-specific interactions is fundamental. These forces operate over different spatial scales and involve distinct molecular machineries. Specific interactions are characterized by precise, lock-and-key molecular recognition between adhesins and their target receptors, typically acting at short ranges (up to several nanometers) [8]. In contrast, non-specific interactions are mediated by the overall physicochemical properties of the cell surface—such as charge, hydrophobicity, and elasticity—and exert their influence over longer distances (several tens of nanometers) [8]. This whitepaper provides an in-depth technical guide to these mechanisms, focusing on insights gleaned from SCFS, to inform the work of scientists and drug development professionals.
Core Mechanisms of Bacterial Adhesion
The process of bacterial adhesion is governed by a combination of discrete physical forces and specific biochemical interactions. The following diagram illustrates the hierarchical relationship between these core mechanisms.
Non-Specific Interactions
Non-specific interactions are the first to come into play as a bacterium approaches a surface. They are the summed, collective effect of relatively weak pairwise interactions between all atoms in the adhering bacterium and the substratum [8].
- Lifshitz-Van der Waals Forces: These are attractive forces that originate from electromagnetic fluctuations and operate over distances of several tens of nanometers. They are always present between any two surfaces.
- Electrostatic (EL) Forces: Bacterial surfaces are generally negatively charged due to deprotonated carboxylates and phosphates in their cell wall [9]. When approaching a similarly charged surface, this creates a repulsive energy barrier that must be overcome for adhesion to occur. Attractive electrostatic forces can dominate if the surface is positively charged [8].
- Acid-Base Interactions: Also termed polar interactions, these are primarily linked to hydrophobic and hydrophilic properties. They are Lewis acid-base interactions that can be up to 10–100 times stronger than the combined EL and Lifshitz-Van der Waals forces, playing a decisive role in the final approach [10]. The hydrophobic effect is a major contributor to this interaction type.
The combined effect of these forces is often described by the Derjaguin-Landau-Verwey-Overbeek (DLVO) theory and its extension, the XDLVO theory, which incorporates the critical acid-base component [10] [8]. The transition from reversible to irreversible adhesion is mediated by short-range forces and specific molecular binding [11].
Specific Interactions
Specific interactions are defined by stereochemical complementarity between bacterial adhesins and host or surface receptors. They are responsible for the irreversible locking of bacteria to a surface and are a key virulence factor for pathogens [8] [12].
- Mechanism: These interactions involve highly evolved bacterial surface structures, such as fimbriae, pili, and membrane-anchored proteins (e.g., MSCRAMMs in Gram-positive bacteria), binding to specific ligands like extracellular matrix proteins (fibronectin, collagen), host cell surface glycans, or complementary structures on other bacteria (coaggregation) [9] [13].
- Force Response: A remarkable feature of many specific adhesins is their mechanoresponsive behavior. Some, like the staphylococcal SdrG-fibrinogen complex, form extremely strong "dock, lock, and latch" bonds that can resist forces of 1-2 nN [13]. Others exhibit catch-bond behavior, where bond lifetime increases under applied force, allowing bacteria to resist hydrodynamic shear forces in environments like the gut [13] [14].
Quantitative Force Spectroscopy Data
Single-cell and single-molecule force spectroscopy (SCFS/SMFS) have been instrumental in quantifying the forces involved in bacterial adhesion. The table below summarizes key adhesion force measurements for various bacterial systems.
Table 1: Bacterial Adhesion Forces Measured by Force Spectroscopy
| Bacterial System / Interaction | Specific vs. Non-Specific | Measured Force | Experimental Conditions & Notes | Citation |
|---|---|---|---|---|
| S. aureus to fibrinogen (via SdrG) | Specific | ~1-2 nN | "Dock, lock, and latch" mechanism; extreme mechanical stability. | [13] |
| E. coli to 58S Bioactive Glass | Primarily Non-specific | ~6 nN | Initial transient adhesion (contact time <1s); attributed to more adhesive nanodomains. | [15] |
| S. aureus to 58S Bioactive Glass | Primarily Non-specific | ~3 nN | Initial transient adhesion (contact time <1s); weaker than E. coli under these conditions. | [15] |
| S. mutans with Antigen I/II to salivary pellicle | Specific | Median: -0.4 nN (pH 6.8) | Significant increase vs. non-specific control; wide force distribution indicates heterogeneity. | [8] |
| S. mutans without Antigen I/II to salivary pellicle | Non-specific | Median: -0.1 nN (pH 6.8) | Represents the baseline, non-specific interaction force. | [8] |
| R. champanellensis Dockerin:Cohesin (Doc:Coh) | Specific | ~500 pN (Mode A), ~200 pN (Mode B) | Dual binding modes with catch-bond behavior; role in gut adhesion under flow. | [14] |
| Coaggregation (e.g., Actinomyces & Streptococcus) | Specific | Mean: -3.0 to -4.0 nN | Significantly stronger than non-specific intergeneric aggregation forces. | [8] |
The data reveals that while specific interactions can generate extremely high forces (nN range), non-specific interactions provide a foundational adhesive force that is essential for initial contact. Furthermore, the distribution of forces is often wide and non-parametric, reflecting significant phenotypic heterogeneity within a clonal population [16] [8].
Methodologies for Single-Cell Force Spectroscopy
Core Atomic Force Microscopy (AFM) Techniques
AFM is a versatile platform for probing bacterial adhesion. The heart of the instrument is a nanoscale tip on a soft cantilever, whose deflection is monitored by a laser. Two primary methodologies are employed:
- Single-Cell Force Spectroscopy (SCFS): A single live bacterial cell is chemically attached to the AFM cantilever. This cell is then approached into contact with a substrate (e.g., a protein-coated surface, another cell, or a biomaterial) and then retracted. The force-distance (F-D) curves obtained during retraction quantify the total adhesion force between the entire cell and the substrate, encompassing both specific and non-specific contributions [13] [12]. This method best mimics real-life adhesion conditions.
- Single-Molecule Force Spectroscopy (SMFS): The AFM tip is functionalized with a specific ligand (e.g., a host protein like fibronectin). The tip is then used to probe a surface onto which bacteria or their purified adhesins are immobilized. By analyzing individual rupture events in the F-D curves, the unbinding force and kinetics of a single receptor-ligand pair can be determined with high precision [13] [8].
Detailed SCFS Protocol for Probing Bacteria-Biomaterial Adhesion
The following workflow details a typical SCFS experiment designed to quantify the early-stage adhesion of bacteria to a biomaterial, such as bioactive glass [15].
Key Reagents and Parameters:
- Bacterial Strain: Late exponential phase cultures are typically used to ensure consistent surface properties [10] [15].
- Functionalization Agents: Poly-L-lysine (0.1% w/v) or polyethyleneimine (PEI) are commonly used as non-specific, cationic adhesives to firmly trap the negatively charged bacterial cell on the cantilever [13].
- Buffers: Phosphate-buffered saline (PBS) at physiological pH (7.2-7.4) is standard. Buffer ionic strength is critical as it screens electrostatic non-specific interactions.
- AFM Parameters: A contact force of 200-500 pN is used to ensure gentle but consistent contact. Contact time is a critical variable, often set from milliseconds to seconds to study the dynamics of bond formation [15]. A retraction velocity of 0.5-1.0 µm/s is typical, though varying this parameter allows for the study of kinetic processes.
SMFS Protocol for Single-Molecule Recognition
To isolate specific molecular recognition forces, the protocol is modified:
- Tip Functionalization: The AFM tip is covalently coated with a specific ligand (e.g., fibrinogen) using heterobifunctional crosslinkers like PEG-NHS esters, which provide a flexible tether [14].
- Surface Preparation: Purified adhesins or whole bacteria are immobilized on a solid support (e.g., gelatin-coated glass or mica) [16] [8].
- Data Analysis: Thousands of F-D curves are collected. Specific unbinding events are identified by their characteristic rupture length (related to the PEG tether) and their specific blockade by free ligand in solution (competitive inhibition) [8] [14].
Advanced Concepts: Heterogeneity and Catch Bonds
Phenotypic Heterogeneity in Adhesion
SCFS has revealed that isogenic bacterial populations are not uniform. Individual cells can exhibit vastly different adhesive and mechanical properties. A key factor is the composition of the cell envelope. For instance, in E. coli, partial removal of lipopolysaccharide (LPS) with EDTA homogenizes the outer membrane, rendering it smoother and significantly reducing cell-to-cell heterogeneity in adhesion forces and elasticity [16]. This demonstrates that the structural and chemical diversity of the outer membrane is a primary determinant of phenotypic heterogeneity, which has profound implications for a population's ability to adapt to varied environments and antimicrobial stressors [16].
Catch Bond Mechanisms
Catch bonds are counter-intuitive interactions whose lifetime increases with applied force up to a certain threshold, functioning as a mechanical band-pass filter. They are crucial for bacterial adhesion under shear stress, such as in the gut or urinary tract [13] [14].
Table 2: Molecular Mechanisms of Catch Bonds in Bacterial Adhesion
| Adhesin System | Bacterial Species | Proposed Molecular Mechanism | Functional Role |
|---|---|---|---|
| FimH | Escherichia coli | Force-induced conformational change from a low-affinity to a high-affinity state. | Mediates shear-enhanced adhesion to mannosylated surfaces in the urinary tract. |
| SdrG | Staphylococcus aureus | "Dock, lock, and latch" mechanism; force directs unbinding along a high-energy pathway. | Resists extreme physical stresses during infection. |
| Rc Doc:Coh | Ruminococcus champanellensis | Dual binding modes and mechanical allostery from an adjacent X-module domain. | Anchors bacterial cellulosome to cellulose fibers in the human gut under hydrodynamic flow. |
The Dockerin:Cohesin (Doc:Coh) complex from R. champanellensis provides a sophisticated example. This complex assembles in two discrete binding modes with different mechanical strengths (one breaking at ~500 pN, the other at ~200 pN). A neighboring X-module domain acts as a mechanical switch, allosterically inhibiting the low-force pathway at high loading rates. This results in a net catch bond behavior, where the probability of the strong binding mode increases with force, ensuring firm adhesion under high shear [14].
The Scientist's Toolkit: Essential Research Reagents
Table 3: Key Reagent Solutions for Bacterial Adhesion Research
| Reagent / Material | Function in Experiment | Technical Notes |
|---|---|---|
| Tipless AFM Cantilevers | The base for creating cell- or molecule-functionalized probes. | Typically made of silicon or silicon nitride; require functionalization before use. |
| Poly-L-Lysine (PLL) / PEI | Non-specific adhesives for immobilizing bacterial cells to cantilevers. | PLL is common; PEI provides stronger electrostatic attachment. |
| PEG-based Crosslinkers | For covalent, site-specific attachment of ligands to AFM tips in SMFS. | Provide a flexible tether to isolate single-molecule forces. |
| Ethylenediaminetetraacetic Acid (EDTA) | A chelating agent used to selectively remove Lipopolysaccharides (LPS) from Gram-negative outer membranes. | Tool for studying the role of LPS in adhesion and mechanics [16]. |
| Bioactive Glass (58S Composition) | A biomaterial with known antimicrobial and bioactive properties. | Used as a substrate to study bacteria-biomaterial interactions and design anti-fouling surfaces [15]. |
| Recombinant Adhesins & Ligands | Purified proteins (e.g., Fibrinogen, Fibronectin, Coh, Doc) for SMFS and inhibition assays. | Essential for probing specific interactions and mapping binding pathways. |
| Oleonuezhenide | Oleonuezhenide, CAS:112693-21-7, MF:C48H64O27, MW:1073.0 g/mol | Chemical Reagent |
| IRF1-IN-1 | IRF1-IN-1, MF:C22H24N4O4S, MW:440.5 g/mol | Chemical Reagent |
The Critical Role of Bacterial Adhesion in Infection and Biofilm Formation
Bacterial adhesion represents the critical first step in the establishment of chronic infections and the formation of biofilms, which are structured microbial communities responsible for significant healthcare challenges. This initial attachment determines the success of all subsequent stages of biofilm development, ultimately influencing infection outcomes and therapeutic efficacy. Single-cell force spectroscopy (SCFS) has emerged as a powerful biophysical technique that enables the quantitative investigation of adhesive interactions at the level of individual bacterial cells, providing unprecedented insights into the nanoscale forces governing these processes. Within the context of a broader thesis on SCFS of bacterial adhesion research, this technical guide examines the fundamental mechanisms, measurement methodologies, and implications of bacterial adhesion, offering a comprehensive resource for researchers, scientists, and drug development professionals working to address biofilm-associated infections.
Fundamental Mechanisms of Bacterial Adhesion
The process of bacterial adhesion to surfaces involves a complex interplay of physicochemical forces and specific molecular interactions. Understanding these mechanisms is essential for developing strategies to control biofilm formation.
Physicochemical Interactions in Initial Attachment
Initial bacterial attachment is governed by nonspecific physicochemical interactions that occur before the formation of more specific molecular bonds. These interactions can be categorized as:
Long-range forces (>50 nm): These non-specific forces, including van der Waals and electrostatic interactions, are primarily responsible for transporting bacteria to the surface [15]. The Derjaguin-Landau-Verwey-Overbeek (DLVO) theory is often applied to understand these interactions, which combine both attractive and repulsive components [17].
Short-range forces (<5 nm): These include chemical bonds such as hydrogen bonding, ionic, dipole, and hydrophobic interactions that come into play once the bacterium approaches the surface more closely [15]. The transition from long-range to short-range interactions marks the shift from reversible to irreversible adhesion.
Molecular Determinants of Specific Adhesion
Following initial attachment, specific molecular interactions mediate stronger, more stable adhesion through specialized bacterial surface components:
Gram-positive adhesins: These bacteria express "Microbial Surface Components Recognizing Adhesive Matrix Molecules" (MSCRAMMs) and pilus fibers formed by covalently bonded pilin units [15]. Staphylococcus aureus, a prominent gram-positive pathogen, utilizes fibronectin-binding proteins (FnBPs) and other MSCRAMMs to bind to host matrix proteins that coat implant surfaces [18].
Gram-negative adhesins: These bacteria express fimbrial, non-fimbrial, and discrete polysaccharide adhesins [15]. Their outer membrane composition, particularly lipopolysaccharides (LPS), significantly influences stiffness and adhesion strength [15].
Influence of Surface Properties
Material surface characteristics profoundly impact bacterial adhesion through multiple physical parameters:
Surface charge: Most bacteria possess a net negative charge due to functional groups on their cell wall, typically leading to increased adhesion on positively charged surfaces [19]. However, some bacteria can overcome electrostatic repulsion through surface appendages like fimbriae, and lipopolysaccharides in gram-negative bacteria can facilitate adhesion to negatively charged surfaces [19].
Surface wettability, roughness, and stiffness: These properties collectively influence adhesion outcomes by affecting the thermodynamic compatibility between the bacterial cell and the substrate [19]. Recent research on hydro-softened chitosan demonstrated that reducing stiffness from 85 MPa to 1.8 MPa significantly enhanced bacterial adhesion, highlighting the importance of mechanical properties in adhesion processes [17].
Table 1: Influence of Surface Properties on Bacterial Adhesion
| Surface Property | Effect on Bacterial Adhesion | Underlying Mechanisms |
|---|---|---|
| Surface Charge | Generally increased adhesion to positively charged surfaces | Electrostatic attraction overcoming bacterial net negative charge [19] |
| Wettability | Variable effects depending on bacterial species and surface chemistry | Modulation of hydrophobic interactions and interfacial energy [19] |
| Roughness | Enhanced adhesion to moderately rough surfaces | Increased surface area and protection from shear forces [19] |
| Stiffness | Increased adhesion on softer substrates | Reduced energetic barrier for deformation and interface formation [17] |
| Topography | Can either enhance or inhibit adhesion depending on feature size | Physical confinement or guidance of bacterial cells [19] |
Single-Cell Force Spectroscopy: Methodologies and Protocols
Single-cell force spectroscopy (SCFS) represents a specialized application of atomic force microscopy (AFM) that enables the direct quantification of adhesion forces between individual bacterial cells and surfaces of interest. This section details the experimental protocols and methodological considerations for effective SCFS implementation.
Core SCFS Protocol
The standard protocol for microbial SCFS involves several critical steps that must be carefully optimized for reproducible results [2]:
Cantilever Functionalization: AFM cantilevers are prepared with appropriate chemistry to facilitate bacterial immobilization. Common approaches include coating with polydopamine or concanavalin A, which provide nonspecific adhesion sites while maintaining cell viability.
Single-Cell Immobilization: A single living bacterial cell is attached to the functionalized cantilever using micromanipulation under optical control. Proper immobilization ensures the cell maintains its native surface properties and physiological state throughout force measurements.
Force Curve Acquisition: The cellular probe is brought into contact with the substrate with controlled force and contact time, then retracted while recording the cantilever deflection. This process is repeated multiple times at different locations to gather statistically significant data.
Data Analysis: Force-distance curves are analyzed to extract quantitative parameters including adhesion force (maximum force required for detachment), work of adhesion (area under the retraction curve), and rupture events (discrete unbinding events indicating specific molecular interactions).
With proper training, researchers can typically master this complete protocol within approximately one week, enabling robust and reproducible measurements [2].
Technical Considerations and Optimization
Several technical factors must be carefully controlled to ensure reliable SCFS measurements:
Contact time: Systematic variation of contact time provides insights into bond maturation and the transition from reversible to irreversible adhesion. Studies have shown substantial bonding between bacteria and bioactive glass within the initial one second of contact, with multiple binding events observable at intervals as short as 250 ms [15].
Environmental conditions: Measurements should ideally be performed in physiologically relevant media, as solution chemistry significantly influences electrostatic interactions and molecular binding events.
Cantilever selection: Cantilever spring constant must be appropriately matched to the expected adhesion forces, with softer cantilevers (lower spring constants) providing higher force sensitivity for measuring weak interactions.
Temporal resolution: Recent advancements in cantilever design and detection systems have dramatically improved temporal resolution. Custom-modified cantilevers now enable measurements with approximately 1-μs resolution, allowing observation of previously inaccessible rapid transitions in adhesion processes [20].
Advanced SCFS Applications
Beyond basic adhesion force quantification, SCFS can be extended to more sophisticated investigations:
Bond lifetime studies: By applying constant force and measuring the time until detachment, researchers can probe the kinetic stability of bacterium-surface bonds.
Spatial mapping: Performing force measurements across a grid of points on a surface enables the creation of adhesion maps with nanoscale resolution.
Single-molecule force spectroscopy: Using tips functionalized with specific molecules rather than whole cells allows investigation of individual receptor-ligand interactions involved in bacterial adhesion.
Quantitative Adhesion Forces: Experimental Data
SCFS provides quantitative measurements of bacterial adhesion forces that offer fundamental insights into the interactions between pathogens and biomaterials. The following data represent key findings from recent investigations utilizing this technique.
Adhesion Force Magnitudes
Bacterial adhesion forces measured by SCFS typically fall within characteristic ranges that depend on the specific bacterial strain, surface properties, and environmental conditions:
Gram-positive bacteria: SCFS studies have revealed binding strengths in the range of approximately 0.05 to 2 nN for gram-positive adhesin-ligand interactions [15]. For Staphylococcus aureus adhering to 58S bioactive glass, mean adhesion forces of approximately 3 nN have been recorded [15].
Gram-negative bacteria: Gram-negative species often exhibit stronger adhesion forces compared to gram-positive bacteria. Escherichia coli demonstrated adhesion forces of approximately 6 nN to 58S bioactive glass, roughly double the force measured for S. aureus under identical conditions [15]. This difference may be attributed to the presence of more adhesive nano-domains distributed uniformly on the E. coli surface [15].
Comparative studies: Research comparing adhesion between stainless steel 316 and different bacterial types found higher adhesion for gram-negative bacteria (7.88-8.53 nN) compared to gram-positive bacteria (1.44 nN) over contact times of 0-60 seconds [15].
Table 2: Bacterial Adhesion Forces Measured by Single-Cell Force Spectroscopy
| Bacterial Species | Surface Material | Adhesion Force (mean) | Experimental Conditions |
|---|---|---|---|
| Staphylococcus aureus (Gram-positive) | 58S Bioactive Glass | ~3 nN | Contact time: 0-1 s [15] |
| Escherichia coli (Gram-negative) | 58S Bioactive Glass | ~6 nN | Contact time: 0-1 s [15] |
| Gram-positive bacteria | Stainless Steel 316 | 1.44 ± 0.21 nN | Contact time: 0-60 s [15] |
| Gram-negative bacteria | Stainless Steel 316 | 7.88-8.53 nN | Contact time: 0-60 s [15] |
| Gram-positive adhesin-ligand interactions | Various | 0.05-2 nN | Multiple studies [15] |
Temporal Dynamics of Adhesion
The duration of contact between bacteria and surfaces significantly influences adhesion forces through bond maturation processes:
Rapid bond formation: Studies have detected substantial bonding between bacteria and bioactive glass within the first second of contact, with multiple binding events observable at intervals as brief as 250 milliseconds [15].
Force-time relationship: Adhesion forces increase exponentially with contact time before eventually plateauing according to the function: F(t) = F0 + (F∞ - F0)exp(-t/τk), where F(t) is adhesion force at time t, F0 is initial adhesion force before bond maturation, F∞ is adhesion force after bond strengthening, and τk is the characteristic time constant [15].
Transition to irreversible adhesion: Increased contact time promotes the transition from reversible to irreversible adhesion, characterized by an increase in the number of minor peaks observed in force-distance curves, indicating multiple simultaneous binding events [15].
Impact of Material Composition and Crystallinity
Surface composition and structure significantly influence bacterial adhesion forces:
Bioactive glass 58S: This composition (with high calcium content and absence of sodium) exhibits excellent bioactivity and antibacterial behavior, with amorphous BAG demonstrating greater bacterial inhibition compared to semi-crystalline glass-ceramics [15].
Hydro-softened materials: Reducing the stiffness of chitosan thin films from 85 MPa to 1.8 MPa through hydro-softening resulted in over 5-fold greater bacterial adhesion compared to unsoftened films, primarily through increased single-cell attachment rather than aggregated colonization [17].
From Initial Adhesion to Biofilm Formation
The transition from initial bacterial adhesion to mature biofilm represents a critical developmental sequence that determines the trajectory of infection and therapeutic challenges.
The Biofilm Lifecycle
Biofilm formation follows a defined progression through distinct developmental stages [21]:
Initial attachment: Planktonic cells adhere to surfaces through reversible physicochemical interactions. Recent evidence indicates that initial seeding often occurs through clumps of cells that represent aggregates formed in vivo or fragments dispersed from existing biofilms, rather than single cells [21].
Irreversible attachment: Following initial contact, bacteria commit to the surface through stronger, irreversible attachments mediated by molecular interactions such as adhesin-receptor binding.
Microcolony formation: Attached cells proliferate and aggregate into three-dimensional clusters, initiating intercellular communication and collective behavior.
Biofilm maturation: The developing biofilm architecture becomes more complex with the production of extracellular polymeric substances (EPS) that form a protective matrix. This matrix can comprise over 90% of the biofilm mass and consists of polysaccharides, proteins, extracellular DNA, and other biopolymers [21].
Dispersion: Controlled detachment of cells or biofilm fragments enables colonization of new surfaces, completing the cycle and spreading the infection [21].
Antimicrobial Resistance in Biofilms
The biofilm microenvironment confers remarkable tolerance to antimicrobial agents through multiple interconnected mechanisms [21]:
Physical barrier function: The extracellular matrix acts as a protective barrier that can hinder antibiotic penetration into the biofilm structure. Some antibiotics form complexes with matrix components or are degraded by enzymes within the matrix, reducing effective concentrations at the bacterial cell surface [21].
Altered microbial physiology: Biofilm-embedded cells often exhibit reduced metabolic activity and growth rates, making them less susceptible to antibiotics that target active cellular processes.
Horizontal gene transfer: The close proximity of cells within biofilms facilitates efficient exchange of resistance genes, accelerating the development and spread of antimicrobial resistance [21].
Persister cells: Biofilms typically contain subpopulations of dormant persister cells that exhibit extreme tolerance to antimicrobial treatments and can reseed the infection after therapy cessation.
Research Toolkit: Essential Reagents and Methodologies
This section details critical experimental tools and methodologies employed in bacterial adhesion and biofilm research, providing a practical resource for investigators in this field.
Table 3: Essential Research Tools for Bacterial Adhesion and Biofilm Studies
| Tool/Category | Specific Examples | Research Applications | Key Considerations |
|---|---|---|---|
| Single-Cell Force Spectroscopy | Atomic Force Microscopy with SCFS capability | Quantification of adhesion forces at single-cell level; bond kinetics; spatial mapping of adhesion [2] | Requires specialized instrumentation and expertise; contact time and environmental control critical [2] |
| Advanced Cantilevers | FIB-modified ultrashort cantilevers (L = 9 μm) | High-temporal resolution (1 μs) force measurements; protein folding studies [20] | Challenging detection on commercial AFMs; requires custom detection systems [20] |
| Bioactive Materials | 58S Bioactive Glass (60% SiOâ‚‚, 36% CaO, 4% Pâ‚‚Oâ‚…) | Antimicrobial surface research; bone regeneration studies; dental applications [15] | Amorphous form shows greater bacterial inhibition than crystalline [15] |
| Surface Modification | Hydro-softened chitosan thin films | Studying effect of substrate mechanics on bacterial adhesion; tunable stiffness platforms [17] | 5-fold adhesion increase on softened films (1.8 MPa vs. 85 MPa) [17] |
| Anti-adhesion Agents | Marine Glycomyces sediminimaris extracts (Diketopiperazines) | Dental plaque prevention; anti-adhesion studies without bactericidal effect [22] | 95.1% reduction in S. mutans adhesion; negligible hemolytic activity [22] |
| Analytical Techniques | Scanning Electron Microscopy (SEM) with image analysis | Quantitative adhesion assessment; morphological classification of adherent bacteria [17] | Requires careful sample preparation; enables single-cell vs. aggregate discrimination [17] |
| IRF1-IN-2 | IRF1-IN-2, MF:C18H20N2O4S, MW:360.4 g/mol | Chemical Reagent | Bench Chemicals |
| Urease-IN-6 | N-[2-(1H-Indol-3-yl)ethyl]-N'-(4-methoxyphenyl)thiourea | High-purity N-[2-(1H-indol-3-yl)ethyl]-N'-(4-methoxyphenyl)thiourea for research use only (RUO). Explore its potential in pharmaceutical and biological applications. Not for human consumption. | Bench Chemicals |
Bacterial adhesion represents the critical determinative step in the establishment of biofilm-associated infections, serving as the foundational event upon which all subsequent pathogenic processes build. Single-cell force spectroscopy has revolutionized our understanding of this process by providing quantitative, nanoscale measurements of the forces governing bacterial attachment to surfaces. The integration of SCFS with complementary analytical approaches continues to reveal new insights into the molecular mechanisms, temporal dynamics, and material determinants of bacterial adhesion. As research in this field advances, the ongoing development of high-resolution techniques, combined with innovative anti-adhesion strategies targeting the initial attachment phase, holds significant promise for addressing the persistent challenge of biofilm-associated infections in clinical settings. The continued refinement of these methodologies will undoubtedly yield new opportunities for therapeutic intervention and biomaterial design in the ongoing effort to mitigate the substantial burden of biofilm-related diseases.
Single-cell force spectroscopy (SCFS) has emerged as a pivotal technique in bacterial adhesion research, enabling the quantitative assessment of interaction forces at the single-cell level. This guide explores the fundamental parameters—rupture forces, loading rates, and bond strength—that govern bacterial adhesion, providing researchers and drug development professionals with a technical framework for understanding these critical interactions. Within the broader context of bacterial adhesion research, SCFS offers unprecedented insights into the initial attachment phases of bacteria to both biotic and abiotic surfaces, a process fundamental to biofilm formation, infection, and environmental colonization [23]. The measurement and interpretation of these parameters are essential for developing novel antibacterial surfaces, anti-fouling coatings, and therapeutic interventions that target the earliest stages of bacterial colonization.
The adhesion of bacteria to surfaces is a complex, multi-stage process beginning with reversible attachment mediated by physicochemical forces, followed by irreversible adhesion and eventual biofilm formation [24]. SCFS, typically performed using atomic force microscopy (AFM), allows researchers to probe these initial interactions with high spatial and temporal resolution, providing data that bulk methods often obscure through averaging effects [16]. By quantifying the forces required to detach individual bacterial cells from substrates, researchers can elucidate the molecular mechanisms of adhesion, assess the efficacy of anti-adhesive surfaces, and understand how surface properties influence bacterial behavior—all critical considerations for pharmaceutical and medical device development.
Key Parameters in Single-Cell Force Spectroscopy
Rupture Forces
Rupture force, often referred to as adhesion force, represents the maximum force required to separate a bacterial cell from a substrate after contact. In SCFS experiments, this parameter is directly measured from the retraction curve of force-distance measurements as the minimum force value before complete detachment [23]. Rupture forces arise from the combined contributions of various interactions, including specific ligand-receptor bonds, nonspecific physicochemical interactions, and the mechanical properties of cellular appendages.
The magnitude of measured rupture forces provides insights into the nature and strength of bacterial adhesion. For example, studies of plant growth-promoting rhizobacteria (PGPR) on Arabidopsis thaliana roots revealed adhesion forces following a lognormal distribution with geometric means varying by bacterial species and root zone [23]. Bacillus velezensis exhibited forces of 68.8 ×/÷ 2.0 pN in the cell division zone, 95.6 ×/÷ 2.4 pN in the elongation zone, and 102.3 ×/÷ 2.3 pN in the maturation zone, while Pseudomonas defensor showed different zone-dependent adhesion patterns [23]. These variations highlight how adhesion is influenced by both bacterial surface properties and substrate characteristics.
In studies of bacterial adhesion to biomaterials, significantly higher forces have been observed. Research on 58S bioactive glass demonstrated adhesion forces of approximately 3 nN for Staphylococcus aureus and 6 nN for Escherichia coli after just one second of contact time [15]. These substantial forces, measured in the nanonewton range, indicate strong initial bonding between bacteria and implant surfaces, which may contribute to the development of implant-related infections.
Loading Rates
The loading rate, defined as the rate at which force is applied during detachment, critically influences measured rupture forces in bond strength assessments. In SCFS, the loading rate is controlled by the retraction speed of the AFM cantilever and its spring constant. This parameter is particularly important because many biological bonds exhibit slip-bond behavior, where bond lifetime decreases with increasing force, or catch-bond behavior, where bond lifetime initially increases with force.
The relationship between loading rate and measured adhesion force provides insights into the energy landscape of receptor-ligand interactions. As loading rate increases, the force required to rupture bonds typically increases because the system has less time to dissociate spontaneously under thermal fluctuations. This dependence can reveal the presence of multiple energy barriers in the interaction pathway and provide estimates of bond dissociation rates and potential widths [15].
In bacterial adhesion studies, loading rates must be carefully controlled to enable meaningful comparisons between experiments. Standardized approach and retraction speeds allow researchers to mimic physiological conditions, such as the shear forces bacteria experience in fluid environments, thereby providing biologically relevant data on adhesion strength [24].
Bond Strength
Bond strength in bacterial SCFS encompasses both the adhesion force and the work of adhesion, which represents the total energy dissipated during the detachment process. This parameter is influenced by multiple factors, including the number of bonds formed, their individual strengths, and the mechanical properties of the interacting surfaces.
The strength of bacterial adhesion is not static but evolves over time through a process known as bond maturation. The temporal evolution of adhesion force follows the relationship: F(t) = F0 + (F∞ - F0)exp(-t/τk), where F0 is the initial adhesion force, F∞ is the force after bond strengthening, t is time, and τk is the characteristic time constant [15]. This equation describes the exponential increase in adhesion strength as contact time increases, eventually plateauing as bonds reach their maximum strength.
Bond strength in bacterial systems is governed by various molecular mechanisms, including the stretching of polymeric structures such as adhesins, polysaccharides, and other surface macromolecules. Force curves often exhibit characteristic patterns described by polymer elasticity models, particularly the worm-like chain (WLC) model, which quantifies the forced unfolding of these biomolecules [23].
Quantitative Data in Bacterial SCFS
Adhesion Force Measurements Across Bacterial Systems
Table 1: Measured Bacterial Adhesion Forces in Various Systems
| Bacterial Species | Substrate | Adhesion Force | Distribution | Reference |
|---|---|---|---|---|
| Bacillus velezensis | A. thaliana root division zone | 68.8 ×/÷ 2.0 pN | Lognormal | [23] |
| Bacillus velezensis | A. thaliana root elongation zone | 95.6 ×/÷ 2.4 pN | Lognormal | [23] |
| Bacillus velezensis | A. thaliana root maturation zone | 102.3 ×/÷ 2.3 pN | Lognormal | [23] |
| Escherichia coli | 58S Bioactive glass | ~6 nN | Not specified | [15] |
| Staphylococcus aureus | 58S Bioactive glass | ~3 nN | Not specified | [15] |
| E. coli (untreated) | Gelatin-coated glass | 0.53 nN | Heterogeneous | [16] |
| E. coli (EDTA-treated) | Gelatin-coated glass | 0.28 nN | Reduced heterogeneity | [16] |
Temporal Evolution of Adhesion Forces
Table 2: Time-Dependent Adhesion Parameters in Bacterial Systems
| Parameter | Effect on Adhesion | Experimental Evidence | Reference |
|---|---|---|---|
| Contact time (0-1s) | Rapid increase in adhesion force | Force increased from ~2 nN to ~6 nN for E. coli on bioactive glass | [15] |
| Bond maturation | Exponential strengthening | F(t) = F0 + (F∞ - F0)exp(-t/τk) | [15] |
| Initial adhesion phase | Linear increase in cell attachment | Linear adhesion rates for first 5-9 minutes under flow | [24] |
| Extended adhesion | Rate decrease due to surface coverage | 55% average reduction in adhesion rate after initial phase | [24] |
Experimental Protocols in Bacterial SCFS
Bacterial Immobilization for SCFS
The reliable immobilization of bacterial cells without altering their surface properties is crucial for reproducible SCFS measurements. The following protocol has been successfully used for studying PGPR adhesion to plant roots:
Cantilever Functionalization: Attach a colloidal probe to a tipless AFM cantilever and coat it with positively charged polyethyleneimine (PEI) to promote bacterial attachment [23].
Cell Attachment: Incubate the functionalized cantilever with a bacterial suspension of approximately 10^6 CFU/mL for 30 minutes, allowing a single bacterium to attach to the center of the colloidal probe [23].
Viability Confirmation: Verify bacterial viability and positioning using fluorescence microscopy after staining with appropriate viability markers [23].
Force Spectroscopy: Approach the immobilized bacterium toward the substrate of interest (e.g., root surface) using a controlled indentation force of 500 pN and a contact time of approximately 100 ms to mimic initial encounters during colonization [23].
This immobilization approach preserves bacterial viability and surface properties while providing sufficient stability for force measurements. The use of PEI coating creates a strong electrostatic attachment that withstands the forces applied during measurement without compromising cellular integrity.
Force Curve Acquisition and Analysis
The acquisition and interpretation of force-distance curves form the foundation of SCFS data collection:
Curve Collection: Record approach and retraction curves at multiple locations on the substrate surface (typically 100+ curves per condition) to account for spatial heterogeneity [23].
Curve Categorization: Classify retraction curves into two primary categories: (i) "with specific interaction" showing adhesive events, and (ii) "with noninteraction" showing flat curves or sharp peaks at distances <300 nm indicative of nonspecific interactions [23].
Adhesion Quantification: For curves showing specific interactions, quantify the adhesion force (rupture force), rupture length, and work of adhesion [23].
Polymer Elasticity Modeling: Fit force curves with the worm-like chain (WLC) model of polymer elasticity to analyze the forced unfolding of surface macromolecules [23].
Statistical Analysis: Account for the typically lognormal distribution of adhesion forces by performing logarithmic transformation before statistical testing to meet the assumptions of parametric tests [23].
This systematic approach to data collection and analysis ensures robust quantification of adhesion parameters and facilitates comparisons across different experimental conditions and bacterial systems.
LPS Removal to Assess Membrane Contributions
The role of outer membrane components in bacterial adhesion can be assessed through selective removal of lipopolysaccharides (LPS) in Gram-negative bacteria:
Culture Preparation: Grow Escherichia coli ATCC 25922 in Luria-Bertani broth for 24 hours at 37°C with shaking at 150 rpm [16].
LPS Removal: Harvest cells by centrifugation at 2151 × g for 5 minutes, wash with Milli-Q water, then resuspend in 100 mM EDTA solution (pH 8.0) and incubate at 37°C for 30 minutes with gentle shaking [16].
Post-treatment Processing: Recentrifuge under the same conditions, wash twice with Milli-Q water, and resuspend in 0.01 M phosphate buffer (pH 7.0) for analysis [16].
Viability Assessment: Verify membrane integrity post-treatment through AFM imaging, confirming the absence of structural ruptures and presence of dividing cells [16].
This protocol partially removes LPS without compromising cell viability, allowing researchers to directly investigate the contribution of outer membrane structure to adhesion forces and cellular mechanics. Studies using this approach have demonstrated that LPS removal significantly reduces adhesion forces and cell-to-cell heterogeneity in E. coli populations [16].
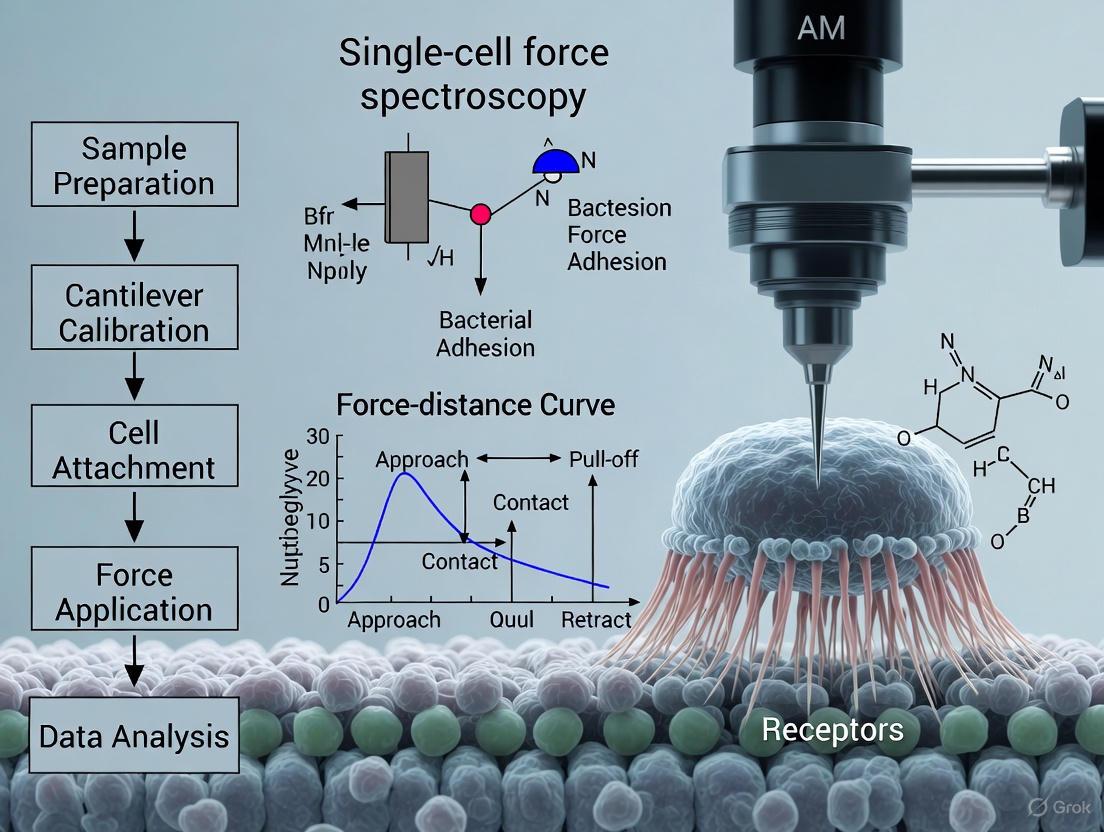
Visualization of SCFS Workflow
This workflow illustrates the comprehensive process from sample preparation to parameter extraction in bacterial SCFS experiments. The visualization highlights how fundamental parameters are derived from specific phases of the force measurement process, particularly during the retraction phase where adhesion events are recorded as force-distance curves.
The Scientist's Toolkit: Essential Research Reagents and Materials
Table 3: Key Research Reagents and Materials for Bacterial SCFS
| Item | Specification/Example | Function in SCFS |
|---|---|---|
| AFM System | Atomic Force Microscope with fluid cell | Core instrumentation for force measurement |
| Cantilevers | Tipless cantilevers with colloidal probes | Bacterial immobilization and force sensing |
| Immobilization Reagent | Polyethyleneimine (PEI) | Positively charged polymer for cell attachment |
| Bacterial Strains | B. velezensis, P. defensor, E. coli, S. aureus | Model organisms for adhesion studies |
| Surface Materials | Plant roots, bioactive glass, polymer coatings | Substrates for adhesion measurement |
| Chemical Treatment | EDTA (100 mM, pH 8.0) | LPS removal for membrane studies |
| Imaging Validation | Fluorescence microscopy with viability stains | Confirmation of cell viability and position |
| Buffer Systems | Phosphate buffer (0.01 M, pH 7.0-7.4) | Physiological maintenance medium |
| Data Analysis Software | Worm-like chain (WLC) model fitting | Polymer elasticity analysis of force curves |
| AM-001 | AM-001, MF:C24H16FN3OS2, MW:445.5 g/mol | Chemical Reagent |
| GSK461364 | GSK461364, CAS:929095-18-1, MF:C27H28F3N5O2S, MW:543.6 g/mol | Chemical Reagent |
The fundamental parameters of rupture forces, loading rates, and bond strength provide critical insights into the nanoscale interactions between bacteria and surfaces. Through standardized SCFS protocols and careful data interpretation, researchers can quantify these parameters to understand the biophysical mechanisms driving bacterial adhesion. This knowledge enables the rational design of anti-fouling surfaces, improved biomaterials, and novel therapeutic strategies that target the initial stages of bacterial colonization. As SCFS methodologies continue to evolve, their application in pharmaceutical and medical device development promises to yield increasingly sophisticated approaches to managing bacterial adhesion and biofilm-related challenges.
Advantages of SCFS Over Traditional Adhesion Assays
Single-cell force spectroscopy (SCFS) is an atomic force microscopy (AFM)-based technique that has emerged as a powerful tool for quantitatively measuring the biophysical forces involved in cell adhesion at the single-cell level. Unlike traditional adhesion assays that provide population-averaged data, SCFS enables researchers to probe the nanoscale interactions between an individual cell and a substrate with piconewton sensitivity [25]. This technical capability is particularly valuable in bacterial adhesion research, where phenotypic heterogeneity within clonal populations can significantly influence colonization and infection outcomes [16]. SCFS employs a single bacterial cell attached to a cantilever to directly quantify adhesion forces, cell elasticity, and the dynamics of bond formation and rupture, providing unprecedented insight into the fundamental mechanisms governing microbial attachment to surfaces [16] [26].
The application of SCFS represents a paradigm shift from traditional ensemble measurements, which often mask cell-to-cell variability, toward a more precise understanding of adhesion heterogeneity. This technical guide examines the specific advantages of SCFS over traditional adhesion assays within the context of bacterial adhesion research, detailing methodological approaches, key findings, and experimental considerations for implementing this cutting-edge technology.
Limitations of Traditional Adhesion Assays
Traditional bacterial adhesion assays, while useful for initial screening, suffer from several significant limitations that restrict their utility for mechanistic studies:
Population averaging effects: Conventional methods such as microbiology adhesion assays and centrifugation-based detachment provide data averaged across thousands to millions of cells, effectively masking the substantial cell-to-cell heterogeneity that exists within clonal populations [16]. This averaging obscures the presence of phenotypic subgroups with distinct adhesive properties that may be critical for understanding infection processes.
Limited quantitative resolution: Traditional approaches typically yield semi-quantitative or qualitative data (e.g., colony-forming unit counts, optical density measurements) rather than precise force measurements, making it difficult to correlate adhesion with specific biophysical properties [25] [26].
Inability to probe kinetic parameters: Standard adhesion assays cannot resolve the dynamics of bond formation and rupture or measure the nanomechanical properties of individual cells, which are increasingly recognized as important factors in bacterial pathogenesis and environmental adaptation [16] [25].
Poor temporal resolution: Most conventional methods capture adhesion at a single endpoint rather than monitoring the real-time evolution of adhesive interactions, missing critical information about the progression of attachment strength over time [25].
Table 1: Key Limitations of Traditional Bacterial Adhesion Assays
| Limitation | Impact on Research | Example Techniques |
|---|---|---|
| Population Averaging | Masks phenotypic heterogeneity; overlooks rare but important subpopulations | Microtiter plate assays, flow chamber assays |
| Qualitative Output | Provides relative rather than absolute measurements; difficult to compare between studies | Staining and counting, optical density measurements |
| Limited Mechanistic Insight | Cannot distinguish specific from non-specific interactions or measure single-bond kinetics | Centrifugation assays, washing and enumeration |
| Endpoint Measurements | Captures static snapshot rather than dynamic process | Colony-forming unit counts after adhesion |
| Bulk Property Measurement | Averages across cells and surface regions | Radiolabeling, spectrophotometric assays |
Methodological Advantages of SCFS
Quantitative Force Measurement at Single-Cell Resolution
SCFS provides direct quantitative measurement of adhesion forces at the fundamental scale of individual cells, typically with piconewton sensitivity and nanometer spatial resolution [25]. This precision enables researchers to:
- Measure absolute adhesion forces between a single bacterium and specific substrates, ranging from abiotic surfaces to host cells [26].
- Characterize the nanomechanical properties of individual cells, including elasticity and deformation, which influence adhesion mechanics [16].
- Map force distributions across cell surfaces to identify localized adhesion hotspots corresponding to specific surface structures or adhesins [16].
For example, in studies of Escherichia coli, SCFS has revealed how lipopolysaccharide (LPS)-mediated heterogeneity influences adhesion at the single-cell level, with individual cells within a clonal population exhibiting markedly different adhesive phenotypes [16]. Similarly, SCFS analysis of Streptococcus pneumoniae has elucidated the distinct roles of capsule phenotype and surface proteins in adhesion to lung epithelial cells and collagen, demonstrating that adhesion is a multiphasic process with different force profiles at various contact times [26].
Analysis of Cell Heterogeneity
A fundamental advantage of SCFS is its ability to resolve phenotypic heterogeneity within genetically identical bacterial populations, which is inaccessible to traditional ensemble methods [16]. This capability has revealed:
- The existence of stiff and highly adherent subpopulations within clonal cultures that may have enhanced colonization potential [16].
- How outer membrane alterations, such as LPS removal by EDTA treatment, reduce cell-to-cell heterogeneity by homogenizing surface properties [16].
- Structural diversity in the cell envelope that correlates with variable adhesion strengths among individual cells [16].
This single-cell resolution is particularly valuable for identifying rare but functionally important subpopulations that may initiate infections or exhibit enhanced resistance to antimicrobial agents.
Dynamic Adhesion Process Monitoring
SCFS enables real-time monitoring of adhesion dynamics, capturing the temporal evolution of adhesive interactions that traditional endpoint assays cannot detect [25] [26]. This dynamic capability allows researchers to:
- Measure adhesion kinetics at biologically relevant timescales, from milliseconds to hours.
- Investigate the multiphasic nature of bacterial adhesion, where short-term and long-term adhesion mechanisms may differ significantly [26].
- Probe the mechanical adaptation of bacteria during surface attachment, including surface-induced changes in adhesive properties.
Research on Streptococcus pneumoniae using SCFS has demonstrated that adhesion profiles at short contact times (<5 seconds) can differ substantially from those at long contact times (~1 hour), suggesting distinct adhesive mechanisms operate at different stages of the adhesion process [26].
Controlled Microenvironment
The SCFS experimental setup provides precise environmental control that enables systematic investigation of factors influencing bacterial adhesion:
- Systematic variation of contact time and force to elucidate their effects on adhesion strength [26].
- Controlled physicochemical conditions including buffer composition, temperature, and flow dynamics.
- Specific surface functionalization to probe interactions with defined chemical groups or extracellular matrix components [27].
Studies utilizing amine plasma polymer (PP) surfaces have demonstrated how SCFS can detect fine differences in cell-adhesion to surfaces with varying chemical compositions, revealing that increased cell adhesion to amine-functionalized surfaces likely involves non-specific electrostatic interactions rather than solely receptor-mediated adhesion [27].
Comparative Experimental Data
Table 2: Quantitative SCFS Measurements in Bacterial Adhesion Studies
| Bacterial Species | Adhesion Force Range | Experimental Conditions | Key Findings | Reference |
|---|---|---|---|---|
| Escherichia coli (ATCC 25922) | Variable within population | Colloidal probe AFM; PBS buffer | EDTA treatment reduced adhesion force heterogeneity; eliminated highly adherent subpopulations | [16] |
| Streptococcus pneumoniae | PspC-dependent forces | AFM with lung epithelial cells | PspC mutation reduced nonspecific and specific interactions; contributed to medium- and long-range interactions (>3000nm) | [26] |
| LF fibroblasts on amine PPs | Significantly increased vs. control | Single-cell force spectroscopy on functionalized surfaces | Amine plasma polymers dramatically increased adhesion force; difference detected between various amine PPs | [27] |
Table 3: Technical Comparison: SCFS vs. Traditional Adhesion Assays
| Parameter | SCFS | Traditional Adhesion Assays |
|---|---|---|
| Force Resolution | Piconewton (pN) | Not applicable (qualitative) |
| Spatial Resolution | Nanometer (nm) | Micrometer (µm) to millimeter (mm) |
| Temporal Resolution | Millisecond to hour timescales | Minute to hour timescales (endpoint) |
| Cell-to-Cell Variability | Directly measurable | Masked by population averaging |
| Single-Bond Kinetics | Accessible via rupture force analysis | Not accessible |
| Mechanical Properties | Elasticity, deformation measurable | Not measurable |
| Throughput | Low (typically <100 cells/experiment) | High (thousands to millions of cells) |
| Experimental Complexity | High (requires specialized expertise) | Low to moderate |
Detailed SCFS Methodology
Bacterial Immobilization for SCFS
Proper immobilization of bacterial cells is critical for reliable SCFS measurements. The following protocol has been successfully applied in bacterial adhesion studies:
- Cell preparation: Centrifuge bacterial culture at 2151 × g for 5 minutes at 24°C and wash cell pellets with Milli-Q water [16].
- Surface functionalization: Immobilize bacteria on gelatin-coated glass surfaces to ensure firm attachment during force measurements [16].
- Cell concentration adjustment: Adjust bacterial suspension to approximately 10ⶠCFU/ml before deposition on functionalized surfaces [16].
- Immobilization incubation: Deposit bacterial suspension on prepared surfaces and allow 30 minutes for attachment [16].
This immobilization approach preserves cell viability and maintains natural surface properties while providing sufficient adhesion to withstand measurement forces.
Force Measurement Protocol
Standard SCFS measurements involve the following steps:
- Cantilever functionalization: Depending on experimental goals, attach a single bacterial cell to a tipless cantilever using a bio-compatible adhesive, or use a colloidal probe to assess whole-cell interactions [16].
- Approach phase: Bring the cell-functionalized cantilever into contact with the substrate surface with controlled force (typically 0.5-2 nN) and duration.
- Retraction phase: Withdraw the cantilever from the surface while recording the deflection, which corresponds to adhesion forces as molecular bonds rupture.
- Data collection: Acquire multiple force-distance curves (typically 100-1000) across different locations on the cell surface or across multiple cells.
- Data analysis: Extract adhesion parameters including maximum adhesion force, work of adhesion (area under retraction curve), and rupture event length and frequency.
For studies investigating outer membrane contributions to adhesion, partial LPS removal can be achieved through EDTA treatment (100 mM EDTA, pH 8.0, 37°C for 30 minutes with gentle shaking), which substantially alters bacterial cell surface properties and reduces heterogeneity [16].
The Researcher's Toolkit: Essential SCFS Reagents and Materials
Table 4: Essential Research Reagents and Materials for SCFS Experiments
| Item | Function/Application | Specific Examples/Notes |
|---|---|---|
| Atomic Force Microscope | Core measurement instrument | With fluid cell for measurements in physiological buffers |
| Tipless Cantilevers | Bacterial cell attachment | Functionalized with bio-compatible adhesive |
| Colloidal Probes | Whole-cell force measurements | Spherical particles attached to cantilevers for assessing overall cell adhesion |
| Gelatin-Coated Surfaces | Cell immobilization | Provides firm attachment while preserving viability [16] |
| EDTA Solution | LPS removal/modification | 100 mM, pH 8.0 for controlled outer membrane alteration [16] |
| Amine Plasma Polymers | Surface functionalization | Surfaces with different amine group densities for adhesion mechanism studies [27] |
| Phosphate Buffer | Physiological measurement conditions | 0.01 M, pH 7.0 for maintaining bacterial viability during measurements [16] |
| Aprotinin | Antilysin Research Grade|Antilysin (Aprotinin) | Research-grade Antilysin, a substance that counteracts lysins. For Research Use Only. Not for human or veterinary diagnostic or therapeutic use. |
| TC14012 | TC14012, MF:C90H140N34O19S2, MW:2066.4 g/mol | Chemical Reagent |
Experimental Workflows and Signaling Pathways
Diagram 1: SCFS vs Traditional Assay Workflows
Diagram 2: Bacterial Adhesion Mechanisms Accessible via SCFS
Single-cell force spectroscopy represents a transformative methodology in bacterial adhesion research, offering significant advantages over traditional adhesion assays through its capacity for quantitative force measurement, resolution of cellular heterogeneity, dynamic process monitoring, and precise environmental control. While the technique requires specialized instrumentation and expertise, its ability to reveal fundamental biophysical mechanisms at the single-cell level makes it indispensable for advanced studies of bacterial pathogenesis, surface colonization, and antimicrobial development.
The integration of SCFS into broader research programs on bacterial adhesion provides a powerful approach to connect molecular-scale interactions with population-level behaviors, ultimately enabling more effective strategies to combat bacterial infections and biofilm-associated diseases. As technical developments continue to improve throughput and accessibility, SCFS is poised to become an increasingly central tool in the microbiologist's arsenal.
Practical Implementation: From Bacterial Probe Fabrication to Diverse Research Applications
Step-by-Step Protocol for Single Bacterial Probe Fabrication
In the field of bacterial biophysics, atomic force microscopy (AFM) has evolved into a standard device, yet its capability as a sophisticated quantitative force sensor is often underutilized [28]. The technique of single-cell force spectroscopy (SCFS) transforms the AFM into a unique tool for quantitative adhesion research in bacteriology by using "bacterial probes"—AFM cantilevers that have a single bacterium or a cluster of bacteria attached as the contact-forming object [28]. This in-depth technical guide provides a detailed, step-by-step protocol for fabricating these bacterial probes, a critical methodology for investigating the biophysical interactions at the interface of microbial cells and surfaces.
The ability to measure adhesion forces at the single-cell level has profound implications for understanding bacterial pathogenesis, environmental adaptation, and responses to antimicrobials [16] [26]. This protocol is framed within the broader context of a thesis on single-cell force spectroscopy, emphasizing how this technique enables researchers to move beyond population-averaged data and uncover the significant phenotypic heterogeneity that exists even within clonal bacterial populations [16].
Theoretical Foundation of Bacterial Probe Spectroscopy
The Role of SCFS in Bacterial Adhesion Research
Bacterial adhesion is a critical step in pathogenesis, biofilm formation, and environmental survival. Traditional microbiology adhesion assays provide qualitative assessment of adhesion but lack the biophysical detail offered by SCFS [26]. SCFS allows for the accurate measurement of the biophysical details of adhesion, including the determination of adhesion forces, cell elasticity, and the dynamics of the adhesion process [16] [26].
Recent research has revealed that bacterial populations exhibit remarkable phenotypic heterogeneity, with subgroups of cells displaying different biophysical properties such as adhesion forces and cellular stiffness [16]. This diversity provides a selective advantage under environmental perturbation and increases population-level fitness [16]. SCFS is particularly valuable for detecting and quantifying this cell-to-cell variability, which is often masked in conventional averaged measurements [16].
Key Biophysical Properties Measured with Bacterial Probes
The fabrication and use of bacterial probes enable the investigation of several fundamental biophysical properties:
- Adhesion Forces: The attractive forces between the bacterial cell and a substrate, which can be specific (e.g., receptor-ligand interactions) or non-specific (e.g., electrostatic, van der Waals) [16].
- Cell Elasticity: A measure of cell deformation under mechanical loading, which provides information about the mechanical integrity of the cell envelope [16].
- Adhesion Dynamics: The evolution of adhesive interactions over time, which may represent a multiphasic process where adhesion profiles at short contact times (<5 seconds) can differ significantly from those at long contact times (~1 hour) [26].
The following diagram illustrates the typical experimental workflow for single-cell force spectroscopy using fabricated bacterial probes:
Detailed Fabrication Protocol
Materials and Equipment
The following table details the essential materials required for the successful fabrication of single bacterial probes:
Table 1: Research Reagent Solutions for Bacterial Probe Fabrication
| Item Name | Function/Application | Specifications/Alternatives |
|---|---|---|
| AFM Cantilevers | Serves as the base for bacterial attachment; the force sensor | Typically tipless, with specific spring constants appropriate for biological samples [28] |
| Bacterial Culture | Provides the microbial cells for probe fabrication | Strain-dependent on research question; E. coli ATCC 25922 used in referenced study [16] |
| UV/Ozone Cleaner or Plasma Cleaner | Cleans and sterilizes cantilevers; enhances surface hydrophilicity | Creates a clean, reactive surface for subsequent chemical modification [28] |
| Polydopamine Coating Solution | Creates a versatile, bio-adhesive layer on the cantilever | Prepared by dissolving dopamine hydrochloride in Tris buffer (pH 8.5) [28] |
| Phosphate Buffered Saline (PBS) | Washing and suspension buffer for biological samples | 0.01 M, pH 7.4, isotonic to maintain bacterial viability [16] |
| Gelatin-Coated Glass Surfaces | For immobilizing bacteria during selection and verification | Provides a non-invasive, non-toxic substrate for temporary immobilization [16] |
| Ethylenediaminetetraacetic acid (EDTA) | Optional: For modifying outer membrane structure | 100 mM, pH 8.0; used to study LPS-mediated effects on adhesion [16] |
Step-by-Step Fabrication Procedure
The fabrication of reliable single bacterial probes requires meticulous attention to detail at each stage. The following workflow outlines the complete process from preparation to quality control:
Step 1: Cantilever Preparation
- Begin with tipless AFM cantilevers appropriate for force spectroscopy.
- Clean the cantilevers thoroughly using UV/ozone treatment or plasma cleaning for 10-15 minutes. This step removes organic contaminants and creates a hydrophilic surface essential for uniform coating application [28].
Step 2: Bio-adhesive Coating Application
- Prepare a fresh polydopamine coating solution by dissolving dopamine hydrochloride (2 mg/mL) in 10 mM Tris-HCl buffer (pH 8.5).
- Immerse the cleaned cantilevers in the polydopamine solution for 20-30 minutes with gentle agitation. This deposits a thin, uniform bio-adhesive layer on the cantilever surface [28].
- Rinse the coated cantilevers gently with Milli-Q water to remove any unbound dopamine and air dry.
Step 3: Bacterial Sample Preparation
- Culture bacterial cells under conditions appropriate for the strain and research question (e.g., E. coli in LB broth for 24 h at 37°C with shaking at 150 rpm) [16].
- Harvest cells by centrifugation (2,151 × g for 5 min at 24°C), wash twice with Milli-Q water, and resuspend in an appropriate buffer (e.g., 0.01 M phosphate buffer, pH 7.0) [16].
- For studies investigating specific surface components, treatments such as partial LPS removal with EDTA may be performed at this stage [16].
- Immobilize a dilute suspension of bacteria (approximately 10^6 CFU/mL) on gelatin-coated glass surfaces for 30 minutes. This provides a sparsely distributed population for individual cell selection [16].
Step 4: Single-Cell Attachment
- Mount a polydopamine-coated cantilever in the AFM holder.
- Using an optical microscope integrated with the AFM, identify a single, well-isolated bacterium of interest on the gelatin-coated surface.
- Carefully approach the cantilever toward the selected cell until contact is established.
- Apply a gentle pre-load force (typically 1-5 nN) and maintain contact for 5-10 seconds to allow for firm attachment via the polydopamine adhesive layer [28].
- Retract the cantilever slowly. Successful attachment will result in the bacterium remaining firmly adhered to the cantilever.
Step 5: Adhesive Curing
- After attachment, incubate the bacterial probe in PBS for approximately 15-20 minutes to allow the polydopamine adhesive to fully cure, ensuring robust attachment during force spectroscopy experiments [28].
Step 6: Quality Control
- Verify the successful fabrication using optical microscopy to confirm that a single bacterium is securely attached to the cantilever apex and properly oriented for force measurements.
- Discard any probes with multiple attached cells or improper orientation.
Critical Experimental Parameters for SCFS
When performing force spectroscopy with bacterial probes, several parameters must be carefully controlled and documented to ensure reproducible and reliable results:
Table 2: Key Experimental Parameters in Single-Cell Force Spectroscopy
| Parameter | Typical Range/Settings | Impact on Measurements |
|---|---|---|
| Approach/Retract Speed | 0.5 - 2.0 µm/s | Affects measured adhesion forces; slower speeds may allow more bond formation [26] |
| Contact Time | 0.1 - 10 seconds | Longer contact times typically increase adhesion through molecular rearrangement and bond formation [26] |
| Applied Load (Force) | 1 - 5 nN | Must be sufficient for contact without causing cell damage; affects cell deformation [16] |
| Spring Constant | 0.01 - 0.1 N/m | Must be calibrated for each cantilever/cell combination for accurate force measurements [28] |
| Retraction Distance | 1 - 5 µm | Must be sufficient to fully separate surfaces after adhesion events [28] |
| Environmental Control | Liquid environment, constant temperature | Minimizes thermal drift and ensures physiological relevance [16] |
| Number of Curves | 50-100 force curves per cell | Provides statistical significance for single-cell heterogeneity analysis [16] |
Data Analysis and Interpretation
Force Curve Analysis
Force-distance curves obtained through SCFS provide rich information about the biophysical interactions between the bacterial cell and the substrate. The analysis typically focuses on:
- Adhesion Force: The maximum force required to separate the bacterium from the substrate, calculated from the minimum of the retraction curve.
- Work of Adhesion: The total energy dissipated during the detachment process, calculated as the area under the retraction curve.
- Cell Stiffness (Elasticity): Determined from the slope of the contact region in the approach curve, often using appropriate contact mechanics models (e.g., Hertz, Sneddon) [16].
- Unbinding Events: Discrete rupture events observed as jumps in the retraction curve, which may correspond to the breaking of individual bonds or bond clusters.
Quantitative Insights from Bacterial Probe Studies
The application of single bacterial probe spectroscopy has yielded significant quantitative insights into bacterial adhesion mechanisms:
Table 3: Representative SCFS Data from Bacterial Adhesion Studies
| Bacterial System / Condition | Measured Adhesion Force | Key Finding | Experimental Context |
|---|---|---|---|
| E. coli ATCC 25922 (Wild type) | High variability (e.g., 0.5 - 8 nN) | Population exhibits significant phenotypic heterogeneity in adhesion [16] | Colloidal probe used on multiple cells; analysis of cell-to-cell variation |
| E. coli after EDTA treatment | Reduced overall (e.g., 0.2 - 3 nR) | LPS removal diminishes adhesion forces and reduces population heterogeneity [16] | Partial LPS removal alters outer membrane organization |
| S. pneumoniae (with PspC) | Multiphasic adhesion profile | Adhesin contributes to medium- and long-range interactions (>3000 nm) [26] | Adhesion to lung epithelial cells; dynamic process observed |
| Capsulated vs. Non-capsulated S. pneumoniae | Capsulated: Generally lower | Capsule may limit surface accessibility of adhesins while providing structural support [26] | Comparison of different phenotypic variants |
Applications and Research Context
The fabrication and use of single bacterial probes enables sophisticated investigation into fundamental microbiological processes:
- Pathogenesis Studies: Research on Streptococcus pneumoniae has demonstrated how capsule phenotype and surface proteins (PspC, PsrP) affect adhesion to host cells and collagen, providing insights into the critical initial stages of infection [26].
- Surface Phenotype Heterogeneity: Studies on E. coli have revealed how lipopolysaccharides (LPS) generate diversity in adhesive and mechanical properties within clonal populations, with important implications for environmental adaptation and antibiotic resistance [16].
- Antimicrobial Development: Understanding the fundamental adhesion mechanisms of bacteria to surfaces and host tissues can inform the development of novel anti-adhesion therapies and surface coatings that resist biofilm formation.
Troubleshooting and Technical Considerations
Successful implementation of bacterial probe fabrication may require addressing these common challenges:
- Weak Cell Attachment: Ensure polydopamine solution is fresh and pH is properly maintained at 8.5. Increase contact time during attachment.
- Multiple Cells Attached: Use more dilute bacterial suspensions for immobilization and carefully select isolated cells.
- Cell Damage During Experiments: Reduce applied load and approach speed. Verify viability after attachment.
- Inconsistent Force Curves: Check for proper curing of adhesive and ensure stable environmental conditions to minimize drift.
- High Variability in Measurements: Distinguish between technical artifacts and genuine biological heterogeneity by testing multiple cells from the same culture and performing appropriate statistical analysis [16].
Critical Steps in Approach-Retract Cycles and Force-Distance Curve Analysis
Atomic force microscopy (AFM)-based force spectroscopy has revolutionized our understanding of bacterial adhesion by enabling the quantification of interaction forces at the single-cell and single-molecule level. This technical guide details the critical steps in performing approach-retract cycles and analyzing the resulting force-distance curves, framed within the context of bacterial adhesion research. As bacterial infections pose a significant public health challenge in the 21st century, with adhesion being the pivotal initial step in infection and biofilm formation, mastering these techniques is crucial for identifying novel targets for anti-infective therapies. This whitepaper provides researchers, scientists, and drug development professionals with comprehensive methodologies, quantitative data comparisons, and standardized protocols to advance research in single-cell force spectroscopy of bacterial systems [12] [29].
Bacterial adhesion to host cells or medical devices is mediated by a multitude of molecular interactions, including both non-specific forces (hydrogen bonding, hydrophobic, van der Waals, electrostatic) and specific ligand-receptor interactions. AFM-based force spectroscopy allows researchers to probe these interactions with unprecedented sensitivity, measuring forces in the piconewton range, which is essential for understanding the fundamental mechanisms of bacterial pathogenesis. The technique's ability to function under physiological conditions with nanometer resolution makes it particularly valuable for studying delicate biological samples without requiring fixation or staining that might alter native biological properties [29].
The growing threat of antibiotic resistance has intensified the need for advanced techniques that can unravel the biophysical mechanisms of bacterial adhesion. According to the World Health Organization, drug-resistant diseases could cause 10 million deaths annually by 2050, making alternative approaches to combat infections increasingly urgent. AFM force spectroscopy provides a powerful platform for identifying new ligand-binding events and assessing their potential as novel targets for anti-infective therapies, particularly those aimed at preventing the initial adhesion stage of infection [12] [29].
Fundamental Principles of Approach-Retract Cycles
The approach-retract cycle forms the fundamental measurement sequence in AFM-based force spectroscopy, enabling the quantification of interaction forces between bacterial cells and surfaces of interest. Each cycle consists of three primary phases that generate force-distance curves containing rich information about the physicochemical interactions at the bio-interface [29].
The Approach Phase
During the approach phase, the AFM probe (which may be functionalized with a single bacterial cell, specific molecules, or a surface mimic) is moved toward the sample surface. As the probe approaches, long-range forces such as electrostatic interactions can be detected before physical contact occurs. When studying bacterial adhesion to clay-sized particles, for example, approach curves have exhibited jump-in events with attractive forces of 97 ± 34 pN between E. coli and goethite, indicating significant non-contact attraction [30].
The Contact Phase
Once contact is established, the probe indents the sample with a defined force and dwell time, allowing molecular interactions to form. The duration of this contact period significantly influences adhesion measurements, as longer contact times permit bond maturation and strengthening. Research on bacterial adhesion to bioactive glass has demonstrated that substantial bonding occurs within the initial second of contact, with multiple binding events detectable in as little as 250 milliseconds [15].
The Retraction Phase
During retraction, the probe is withdrawn from the surface, and the forces required to rupture the adhesive bonds are measured. The retraction curve often exhibits multiple peaks corresponding to the sequential breaking of individual bonds or molecular complexes. These rupture events provide quantitative information about the adhesion strength and the nature of the interactions. For bacterial systems, these curves may reveal the involvement of specific adhesins, surface polymers, or appendages such as pili through their characteristic force signatures [29] [31].
Critical Experimental Parameters and Methodologies
Single-Cell Probe Preparation
The reliable immobilization of single living bacterial cells to AFM cantilevers remains a technical challenge that has spurred the development of various methodologies:
- Polydopamine Adhesive Protocol: A non-destructive protocol for single-bacterial cell force spectroscopy combines colloidal probe cantilevers with bioinspired polydopamine wet adhesive. This minimally invasive approach allows researchers to pick up living cells from species such as Lactobacillus plantarum and quantify adhesion forces to both biotic and abiotic surfaces while maintaining cell viability [32].
- Cell-Tak Coating Method: A simple and versatile method involves using tipless AFM cantilevers coated with commercial cell adhesive Cell-Tak to pick up bacterial cells from glass surfaces. This methodology has been successfully applied to four different bacterial strains, with attachment remaining stable during force measurements for up to 2 hours, as confirmed by Live/Dead fluorescence staining [33].
- Fluidic Force Microscopy (FluidFM): This approach enables reversible immobilization of single bacterial cells at the aperture of a microchanneled cantilever by aspiration, allowing measurement of adhesion forces without permanent chemical fixation. The method has been successfully used to probe adhesion of E. coli, Streptococcus pyogenes, and Caulobacter crescentus [31].
- Modular Bead Probe Technique: For high-throughput screening of diverse bacterial isolates, researchers can reversibly immobilize functionalized silica beads on FluidFM cantilevers to probe hydrophobic interactions. This approach has been used to characterize the adhesion of 28 bacterial strains from the leaf microbiota, revealing adhesion forces spanning three orders of magnitude [31].
Key Experimental Parameters
Several critical parameters must be carefully controlled during approach-retract cycles to ensure reproducible and biologically relevant measurements:
- Loading Rate: The product of the cantilever spring constant and the tip retraction velocity (pulling speed) determines the loading rate, which significantly influences the measured rupture forces. According to the Bell-Evans model, rupture forces increase linearly with the logarithm of the loading rate, making this parameter crucial for comparing studies [29].
- Contact Time: The duration of contact between the probe and sample directly affects bond formation and strengthening. Studies have shown that bond strengthening between E. coli and goethite can occur within 4 seconds, reaching maximum adhesion forces and energies of -3.0 ± 0.4 nN and -330 ± 43 aJ, respectively [30].
- Contact Force: The applied force during the contact phase must be carefully controlled to ensure sufficient interaction without causing cellular damage or excessive deformation.
- Spring Constant: Each cantilever must be individually calibrated to determine its precise spring constant, as this value is essential for converting cantilever deflection into force measurements using Hooke's Law [29].
- Environmental Conditions: Measurements should ideally be performed in physiological buffers at controlled temperature to maintain bacterial viability and mimic relevant biological environments [29].
Table 1: Key Experimental Parameters in AFM Force Spectroscopy
| Parameter | Typical Range | Biological Significance | Measurement Considerations |
|---|---|---|---|
| Loading Rate | 10-100,000 pN/s | Affects measured rupture forces; higher rates yield higher forces | Product of spring constant and retraction velocity |
| Contact Time | 0.1-10 s | Longer times allow bond maturation and strengthening | Critical for transient to irreversible adhesion transition |
| Contact Force | 0.1-5 nN | Must be sufficient for interaction without cellular damage | Varies with cell type and surface stiffness |
| Spring Constant | 0.01-0.1 N/m | Determines force sensitivity | Requires individual calibration for each cantilever |
| Rupture Force | pN to nN range | Reflects strength of individual molecular interactions | Follows Bell-Evans model dependence on loading rate |
Experimental Challenges and Solutions
Several technical challenges can affect the quality and interpretation of AFM force spectroscopy data:
- Cantilever Sensitivity: The cantilever's force sensitivity must be matched to the expected adhesion forces, requiring careful selection of appropriate cantilevers with suitable spring constants [29].
- Hydrodynamic Effects: Hysteresis between the tip and sample surface caused by hydrodynamic forces acting on the cantilever during movement can complicate measurements, especially in fluid environments [29].
- Resonance Frequency Limitations: The frequency of repetitive features in force spectroscopy should be significantly lower than the cantilever's resonance frequency to ensure proper response [29].
- Cantilever Quality Factor: The quality factor (Q), representing the number of oscillation cycles before energy dissipation, affects measurement precision in fluid environments [29].
- Bacterial Viability Maintenance: Ensuring bacterial cells remain viable throughout experiments requires careful handling, appropriate immobilization methods, and physiological measurement conditions [33].
Force-Distance Curve Analysis in Bacterial Systems
Quantitative Analysis of Rupture Events
Force-distance curves obtained from retraction cycles provide rich data on adhesion forces through analysis of rupture events:
- Rupture Force Calculation: The rupture force (F) associated with a binding event is calculated using Hooke's Law: F = kₛ × ΔD, where kₛ is the cantilever spring constant and ΔD is the deflection distance the spring recoils after bond rupture [29].
- Bond Strength Determination: Bond strength is defined as the force that produces the most frequent failure in repeated breakage tests, corresponding to the peak in the distribution of rupture forces. This is a dynamic property dependent upon the loading rate [29].
- Work of Adhesion: The area under the retraction curve provides the work of adhesion, which represents the total energy required to separate the surfaces. Poisson analysis of adhesion work can provide information about the nature of interaction forces [34].
Poisson Analysis of Adhesion Forces
Poisson analysis offers a statistical approach to deconvolute the contributions of individual bonds to the total adhesion force:
- Fundamental Principle: The adhesion force between two surfaces is considered the sum of a finite number of discrete single bonds. Assuming bond formation is random and independent, the number of bonds follows a binomial distribution that can be approximated by a Poisson distribution for large sample sizes [34].
- Mathematical Framework: The total adhesion force (F) is expressed as F = (k × fSR) + FLR, where k is the number of short-range bonds, fSR is the magnitude of a single short-range bond, and FLR represents the long-range force contribution. The variance of F relates linearly to its mean, with the slope representing fSR and the intercept providing information about FLR [34].
- Application to Bacterial Systems: Poisson analysis has revealed that bacterial adhesion to surfaces is generally dominated by short-range, attractive acid-base interactions, combined with long-range, weaker Lifshitz-van der Waals forces. Studies have shown that the number of short-range bonds varies significantly, from approximately 12 bonds between E. coli and silicon nitride to 60 bonds for streptococci adhering to stainless steel [34].
Table 2: Single-Bond Forces from Poisson Analysis of Bacterial Adhesion
| Bacterial Strain | Substratum | Short-Range Single-Bond Force (fSR in nN) | Long-Range Force (FLR in nN) |
|---|---|---|---|
| Escherichia coli JM109 | Silicon nitride | -0.125 | -0.155 |
| Pseudomonas aeruginosa PAO1 | BSA-coated glass | -0.31 | -0.03 |
| Staphylococcus epidermidis 3399 | Glass | -0.24 | -0.07 |
| Staphylococcus epidermidis ATCC 35983 | Glass | -0.79 | -0.33 |
| Streptococcus mitis BMS | Saliva-coated enamel | -1.0 ± 0.2 | -0.3 ± 0.1 |
Gradient Force Analysis
Gradient analysis of approach curves provides additional information about interaction forces prior to contact:
- Non-Contact Phase: Ranging from 28-59 nm for different E. coli strains, this region likely arises from steric repulsion by extracellular polymers on the bacterial surface [35].
- Contact Phase: Spanning 59-113 nm, this region may result from initial pressure of the colloid on the outer membrane of the cell [35].
- Constant Compliance Region: This region reflects the response to the stiff peptidoglycan layer that confers strength and rigidity to Gram-negative bacteria [35].
- Correlation with Adhesion: Sticking coefficients of E. coli strains have been correlated with the length of the non-contact phase but not with parameters from retraction curves, highlighting the importance of approach curve analysis [35].
Advanced Applications in Bacterial Adhesion Research
Quantifying Phenotypic Heterogeneity
Single-cell force spectroscopy has revealed significant phenotypic heterogeneity within clonal bacterial populations:
- LPS-Mediated Variability: Studies on E. coli have demonstrated that lipopolysaccharides (LPS) contribute substantially to cell-to-cell heterogeneity in adhesion forces and cell elasticity. Partial removal of LPS by EDTA treatment reduces this heterogeneity by homogenizing outer membrane organization [16].
- Biophysical Diversity: Research on leaf microbiota isolates has revealed substantial variability in hydrophobic adhesion forces among individual cells within strains, with differences of up to three orders of magnitude observed across 28 bacterial strains [31].
- Ecological Significance: This heterogeneity may provide selective advantages for colonization of diverse surfaces, with subpopulations exhibiting different adhesive properties potentially specialized for different environmental niches [16] [31].
Time-Dependent Adhesion Studies
Investigating the evolution of adhesion forces over time provides insights into bond maturation:
- Early-Stage Transient Adhesion: Research on bacterial adhesion to bioactive glass has quantified bonding within the first second of contact, with multiple binding events observable at 250 ms intervals. Adhesion forces of approximately 6 nN for E. coli and 3 nN for S. aureus have been measured after 1 second of contact [15].
- Bond Strengthening Kinetics: The forces responsible for bond strengthening increase exponentially until plateauing according to the function: F(t) = F0 + (F∞ - F0)exp(-t/τk), where F0 is the initial adhesion force, F∞ is the force after bond maturation, and τk is the characteristic time constant [15].
- Transition to Irreversible Adhesion: With increasing contact time, bacterial adhesion transitions from reversible to irreversible, characterized by an increase in minor peaks in force-distance curves representing multiple simultaneous bond ruptures [15].
Table 3: Experimentally Measured Bacterial Adhesion Forces to Various Surfaces
| Bacterial Strain | Surface Type | Adhesion Force | Experimental Conditions |
|---|---|---|---|
| Escherichia coli | Goethite | -3.0 ± 0.4 nN | 4 s contact time; bond strengthening observed |
| Escherichia coli | C30-functionalized beads (hydrophobic) | Up to 50 nN | Single-cell force spectroscopy |
| Escherichia coli | 58S Bioactive Glass | ~6 nN | 1 s contact time |
| Staphylococcus aureus | 58S Bioactive Glass | ~3 nN | 1 s contact time |
| Staphylococcus epidermidis | Glass | 10-15 nN | Single-cell probes |
| Pseudomonas fluorescens | Glass | 1-2 nN | Single-cell probes |
| Bacillus mycoides spores | Hydrophobic surfaces | Up to 50 nN | Force spectroscopy |
Research Reagent Solutions Toolkit
Table 4: Essential Materials and Reagents for Bacterial Single-Cell Force Spectroscopy
| Item Category | Specific Examples | Function/Application |
|---|---|---|
| Cell Adhesives | Cell-Tak, Polydopamine | Immobilize single bacterial cells to cantilevers |
| Functionalized Beads | C30-functionalized silica beads, C18-functionalized beads | Mimic hydrophobic surfaces like leaf epicuticular waxes |
| Cantilever Types | Tipless cantilevers, Colloidal probe cantilevers, FluidFM cantilevers | Platform for cell immobilization and force measurement |
| Viability Stains | Live/Dead BacLight Bacterial Viability Kit | Confirm maintained cell viability throughout experiments |
| Surface Coatings | Gelatin-coated glass, Polydopamine-coated glass | Immobilize bacteria on substrates without chemical fixation |
| Chemical Treatments | EDTA (ethylenediaminetetraacetic acid) | Partially remove lipopolysaccharides to study membrane effects |
| Ac2-26 | Ac2-26, MF:C141H210N32O44S, MW:3089.4 g/mol | Chemical Reagent |
| CTCE-9908 | CTCE-9908, CAS:1030384-98-5, MF:C86H147N27O23, MW:1927.3 g/mol | Chemical Reagent |
Workflow Visualization
AFM Force Spectroscopy Workflow
Approach-Retract Cycle Analysis
The critical steps in approach-retract cycles and force-distance curve analysis form the foundation of robust single-cell force spectroscopy studies in bacterial adhesion research. Through careful attention to probe preparation, parameter control, and appropriate analytical methods, researchers can extract quantitative information about the fundamental forces governing bacterial interactions with biological and synthetic surfaces. The continued refinement of these techniques promises to advance our understanding of bacterial pathogenesis and contribute to the development of novel therapeutic strategies targeting the initial adhesion stage of infections. As the field progresses toward increasingly high-throughput and multimodal approaches, standardization of methodologies and reporting will be essential for comparing results across studies and building comprehensive models of bacterial adhesion mechanisms.
Single-cell force spectroscopy (SCFS) has emerged as a powerful biophysical technique that enables quantitative measurement of the forces governing pathogen-host interactions at the single-cell and single-molecule levels. This guide focuses on the application of SCFS to study two clinically significant bacterial pathogens: Staphylococcus aureus and Escherichia coli. These organisms employ distinct adhesion strategies that can be precisely quantified using atomic force microscopy (AFM)-based techniques, providing unprecedented insights into the initial stages of infection and colonization [36] [37] [38]. The ability to probe these interactions at the nanoscale has revealed remarkable complexity in bacterial adhesion mechanisms, from the fundamental forces driving attachment to the sophisticated molecular strategies pathogens use to establish infections on host tissues and medical implants.
For researchers investigating bacterial pathogenesis, SCFS offers several distinct advantages over traditional bulk assays. It enables the detection of heterogeneities within clonal populations, reveals the function of individual adhesion molecules, and quantifies the mechanical strength of pathogen-host bonds under conditions that mimic physiological stress [37] [39] [40]. This technical guide provides a comprehensive resource for scientists studying S. aureus and E. coli adhesion mechanisms, with detailed methodologies, quantitative force measurements, and experimental protocols tailored for research in pharmaceutical development and antimicrobial therapeutic design.
Fundamental Adhesion Mechanisms of S. aureus and E. coli
Staphylococcus aureus Adhesion Strategies
S. aureus employs sophisticated surface molecules to establish infections, with the iron-regulated surface determinant protein B (IsdB) representing a key virulence factor. Recent single-molecule force spectroscopy studies have revealed that IsdB binds to toll-like receptor 4 (TLR4) with a unique mechanical signature, exhibiting both weak interactions and extremely strong forces that can withstand up to 2000 pN at loading rates of 10^5 pN/s [37]. This stress-activated adhesion mechanism is particularly significant in bacteremia, where fluid shear stress would typically dislodge pathogens, as IsdB expression is enhanced under iron-starved conditions similar to those found in blood [37].
The distribution of adhesion forces across the S. aureus cell envelope is not uniform but follows a "patchy colloid" model. Single-cell force spectroscopy mapping has identified discrete nanoscale domains (approximately 250 nm in diameter) with enhanced adhesion capability, distributed across the bacterial surface [39]. These patches exhibit significantly stronger adhesion compared to surrounding areas, with the number of adhesive molecules or their individual binding strength increased within these specialized regions. This heterogeneous adhesion architecture likely contributes to the pathogen's ability to maintain attachment under varying mechanical stresses encountered in different host environments [39].
Escherichia coli Adhesion Strategies
E. coli utilizes a different adhesion strategy centered on polyvalent interactions, particularly through type 1 pili containing the FimH adhesin. These pili recognize and bind to mannose groups present on host cell surfaces, with the polyvalent nature of the interaction allowing the bacterium to remain attached under shear stress in fluid environments like the urinary tract [41]. Optical tweezers studies have demonstrated that the force required to break a single pilus-mannose interaction occurs in the pN range, with multiple simultaneous interactions creating a robust adhesive bond [41].
The E. coli cell surface exhibits significant phenotypic heterogeneity in adhesion properties, largely governed by lipopolysaccharide (LPS) composition and organization in the outer membrane. Single-cell AFM studies have revealed that partial removal of LPS by EDTA treatment diminishes both adhesion forces and cell elasticity, while also reducing cell-to-cell heterogeneity within bacterial populations [40]. This suggests that LPS structural diversity is a key determinant of phenotypic heterogeneity, with important implications for bacterial adaptation to varied environments and colonization of different surfaces.
Comparative Analysis of Adhesion Mechanisms
Table 1: Quantitative Comparison of S. aureus and E. coli Adhesion Properties
| Parameter | Staphylococcus aureus | Escherichia coli |
|---|---|---|
| Primary Adhesins | IsdB, FnBPs, ClfA [37] | FimH (type 1 pili) [41] |
| Key Host Receptors | TLR4, vitronectin, αVβ3 integrin [37] | Mannosylated glycoproteins [41] |
| Single-Molecule Rupture Forces | 100 ± 16 pN (IsdB-TLR4) up to 2000 pN under stress [37] | pN range (single pilus-mannose interaction) [41] |
| Adhesion Distribution | "Patchy" pattern with 5-6 strong adhesion sites/cell [39] | More homogeneous distribution, influenced by LPS heterogeneity [40] |
| Influence of Growth Conditions | Enhanced IsdB expression under iron starvation [37] | Altered LPS composition under different environmental conditions [40] |
| Role in Biofilm Formation | Facilitates attachment to implants and host tissue [42] | Initial surface colonization, polymicrobial interactions [42] |
Technical Approaches in Single-Cell Force Spectroscopy
Atomic Force Microscopy Platform Configuration
AFM-based force spectroscopy provides the foundation for single-cell adhesion measurements. The basic configuration involves a precise cantilever with a sharp tip that probes bacterial surface interactions. For single-cell force spectroscopy, bacterial probes are typically prepared by chemically immobilizing individual cells onto tipless cantilevers using biofunctionalization protocols [38]. The most common approach involves using polyethyleneimine (PEI) or poly-L-lysine (PLL) as adhesive molecular linkers that create a strong electrostatic bond between the cantilever surface and the bacterial cell [43] [38].
Two primary measurement modes are employed: single-molecule force spectroscopy (SMFS) and single-cell force spectroscopy (SCFS). SMFS utilizes AFM tips functionalized with specific receptor molecules (e.g., TLR4) to probe individual ligand-receptor interactions on the bacterial surface [37]. In contrast, SCFS measures the overall adhesion forces between a single bacterium and a substrate, providing information about the combined effect of multiple adhesion molecules [36] [38]. Both approaches generate force-distance curves that quantify the rupture forces and binding frequencies of molecular interactions, with measurements typically conducted in biologically relevant buffers at controlled temperatures to maintain cellular viability [38].
Specialized Methodologies for Bacterial Adhesion Studies
Several advanced SCFS methodologies have been developed to address specific questions in bacterial adhesion research:
Bacterial Probes for SCFS: Functionalization of AFM cantilevers with living bacteria enables direct measurement of cell-to-substrate adhesion forces. The protocol involves chemical activation of tipless cantilevers, application of a bioadhesive (usually PEI or glutaraldehyde), and attachment of a single bacterial cell through controlled micromanipulation [38]. Proper functionalization is verified by optical microscopy before force measurements.
Single-Molecule Recognition Imaging: This technique combines topographical imaging with spatial mapping of specific receptor binding sites. AFM tips are functionalized with receptor proteins (e.g., TLR4 for S. aureus studies), allowing researchers to simultaneously image the bacterial surface and identify locations where specific adhesins are expressed [37] [38].
Force Mapping with Patterned Substrates: Recent innovations include the use of sine-shaped surfaces that enable characterization of multiple contact points across nearly a hemisphere of an individual bacterial cell. This approach reveals the distribution of adhesion forces across the cell envelope, providing evidence for the "patchy adhesion" model in S. aureus [39].
Experimental Workflow Visualization
Figure 1: Experimental workflow for single-cell force spectroscopy studies of bacterial adhesion, showing key steps from sample preparation to data interpretation.
Quantitative Force Spectroscopy Data
Single-Cell and Single-Molecule Adhesion Measurements
Table 2: Experimentally Measured Adhesion Forces in S. aureus and E. coli
| Measurement Type | Experimental Conditions | Force Parameters | References |
|---|---|---|---|
| S. aureus IsdB-TLR4 (Single molecule) | Iron-poor medium (RPMI), TLR4-functionalized tip | Rupture force: 100 ± 16 pNBinding frequency: 26%High-force events: up to 2000 pN | [37] |
| S. aureus IsdB-TLR4 (Single molecule) | Iron-rich medium (BHI), TLR4-functionalized tip | Rupture force: 72 ± 11 pNBinding frequency: 7% | [37] |
| S. aureus to endothelial cells (Single cell) | Iron-poor conditions, SCFS | Rupture force: 104 ± 15 pNRupture length: 73 ± 18 nmBinding frequency: 49% | [37] |
| S. aureus patchy adhesion (Single cell) | Multiple surface contacts, SCFS mapping | Strong adhesion sites: 5-6 per cellPatch diameter: ~250 nm | [39] |
| E. coli to mannose surfaces (Single molecule) | Optical tweezers, FimH-mannose interaction | pN range forcesPolyvalent adhesion enhances strength | [41] |
| E. coli LPS-mediated adhesion (Single cell) | Native LPS, colloidal probe SCFS | High heterogeneitySubpopulations with varying adhesion | [40] |
| E. coli LPS-mediated adhesion (Single cell) | EDTA-treated (LPS removal), colloidal probe SCFS | Reduced adhesion forcesDecreased cell-to-cell heterogeneity | [40] |
Technical Considerations for Data Interpretation
When interpreting SCFS data, several technical factors must be considered. The measured adhesion forces depend significantly on the loading rate, as many biological bonds exhibit slip-bond behavior where strength decreases under sustained force but increases with rapid loading [37]. Environmental conditions such as pH, ionic strength, and presence of divalent cations dramatically influence adhesion measurements, particularly for E. coli where LPS structure is cation-dependent [40]. The choice between single-cell and single-molecule approaches represents a trade-off between physiological relevance and molecular specificity—SCFS captures the integrated adhesive response of a whole cell, while SMFS provides precise information about specific molecular interactions [38].
For S. aureus studies, growth conditions critically impact results, as iron availability regulates IsdB expression [37]. Similarly, for E. coli, growth phase and medium composition affect LPS structure and pilus expression, necessitating careful documentation of culture conditions [41] [40]. Statistical analysis must account for the inherent heterogeneity in bacterial populations, with adequate sampling across multiple cells from independent cultures to distinguish true biological variation from experimental noise [39] [40].
Detailed Experimental Protocols
Protocol 1: Single-Cell Force Spectroscopy with Bacterial Probes
Principle: This protocol describes the preparation of AFM cantilevers functionalized with single bacterial cells for measuring overall adhesion forces between a bacterium and substrates of interest [38].
Materials:
- Tipless AFM cantilevers (typical spring constant: 0.01-0.1 N/m)
- Polyethyleneimine (PEI) solution (0.1% w/v in water)
- Bacterial culture in mid-exponential growth phase
- Appropriate growth medium and washing buffers
- AFM instrument equipped with fluid cell
- Nano-positioning system for single-cell attachment
Procedure:
- Cantilever Functionalization:
- Clean tipless cantilevers in UV-ozone cleaner for 15 minutes
- Incubate cantilevers in PEI solution (0.1% w/v) for 30 minutes at room temperature
- Rinse thoroughly with sterile Milli-Q water to remove unbound PEI
- Dry under gentle nitrogen stream
Bacterial Probe Preparation:
- Harvest bacterial cells by gentle centrifugation (2,000 × g for 5 minutes)
- Wash twice in appropriate physiological buffer (e.g., 10 mM phosphate buffer, pH 7.2)
- Resuspend to approximately 10^6 CFU/mL
- Using micromanipulators under optical observation, pick up a single bacterial cell and attach it to the PEI-coated cantilever
- Verify single-cell attachment by light microscopy
Force Spectroscopy Measurements:
- Mount functionalized cantilever in AFM holder
- Approach the substrate surface at constant velocity (typically 0.5-1 μm/s)
- Apply controlled contact force (100-500 pN) for defined dwell time (0.1-1 s)
- Retract cantilever at same velocity while recording deflection
- Repeat approach-retract cycles at multiple locations (typically 256-1024 curves per cell)
- Maintain constant temperature and fluid environment throughout measurements
Data Processing:
- Convert cantilever deflection to force using Hooke's law (F = -k × Δx)
- Calculate adhesion force from retraction curve minima
- Determine rupture length from tip-substrate separation at rupture events
- Analyze binding frequency as percentage of curves showing adhesion events
Technical Notes: Spring constant calibration should be performed for each cantilever using thermal tuning methods. For S. aureus studies, iron-limited growth conditions (RPMI medium) enhance IsdB expression and subsequent TLR4 binding [37]. For E. coli, growth under static conditions promotes type 1 pili expression [41].
Protocol 2: Single-Molecule Force Spectroscopy with Functionalized Tips
Principle: This protocol describes the functionalization of AFM tips with specific receptor molecules (e.g., TLR4) to probe individual adhesion molecules on bacterial surfaces [37] [38].
Materials:
- Sharp AFM cantilevers (typical spring constant: 0.01-0.1 N/m)
- Recombinant human TLR4 extracellular domain
- PEG-based crosslinkers (e.g., NHS-PEG-Maleimide)
- Ethanolamine solution (1 M, pH 8.5) for quenching
- AFM instrument with temperature control
Procedure:
- Tip Functionalization:
- Clean standard AFM cantilevers in UV-ozone cleaner for 15 minutes
- Incubate in ethanol solution containing amine-reactive NHS-PEG-Maleimide crosslinkers (1 mM) for 1 hour
- Rinse with PBS to remove unbound crosslinkers
- Incubate with recombinant TLR4 (10 μg/mL in PBS) for 30 minutes
- Quench unreacted groups with ethanolamine (1 M, pH 8.5) for 10 minutes
- Rinse with PBS and store in appropriate buffer at 4°C until use
Specificity Controls:
- Pre-incubate functionalized tips with anti-TLR4 monoclonal antibodies (10 μg/mL) for blocking experiments
- Use control tips functionalized with non-specific IgG to assess nonspecific binding
- Compare binding to target bacteria versus adhesion-deficient mutants
Single-Molecule Measurements:
- Approach bacterial surface at 0.5-1 μm/s velocity
- Apply minimal contact force (~100 pN) with short dwell time (10-100 ms)
- Retract at varying velocities (0.1-10 μm/s) to study loading rate dependence
- Collect thousands of force curves across multiple cells from independent cultures
Data Analysis:
- Identify specific adhesion events in retraction curves
- Construct force histograms to determine most probable rupture forces
- Plot rupture force versus logarithm of loading rate to characterize bond dynamics
- Use worm-like chain model to analyze polymer extension properties
Technical Notes: Functionalization efficiency can be verified by measuring nonspecific adhesion on control surfaces. For S. aureus IsdB-TLR4 studies, the extremely strong forces (up to 2000 pN) observed under high loading rates suggest a stress-activated adhesion mechanism that may be particularly relevant under physiological flow conditions [37].
The Scientist's Toolkit: Essential Research Reagents and Materials
Table 3: Key Research Reagent Solutions for Bacterial Adhesion Studies
| Reagent/Material | Function/Application | Specific Examples | Technical Considerations |
|---|---|---|---|
| AFM Cantilevers | Force sensing and bacterial/probe attachment | Tipless cantilevers for single-cell studies [38]; Sharp tips for single-molecule studies [37] | Spring constant calibration required; Choice depends on required force sensitivity |
| Bioadhesives | Immobilization of bacteria to cantilevers and substrates | Polyethylenimine (PEI) [38]; Poly-L-lysine (PLL) [43]; Glutaraldehyde [38] | PEI provides strong electrostatic attachment; Concentration and exposure time affect viability |
| Surface Modifiers | Creation of defined surfaces for adhesion studies | Self-assembled monolayers (SAMs) with mannose [41]; Gelatin coatings [40] | SAMs enable precise control of ligand density; Gelatin preserves bacterial viability during imaging |
| Recombinant Receptors | Functionalization of tips for specific interaction studies | TLR4 extracellular domain [37]; Other host receptors | Purity and activity critical for specific binding; Require proper storage conditions |
| Crosslinkers | Covalent attachment of molecules to AFM tips | NHS-PEG-Maleimide [38]; Other heterobifunctional crosslinkers | PEG spacers reduce nonspecific adhesion; Length affects molecular flexibility |
| Culture Media | Control of bacterial adhesion molecule expression | Iron-poor RPMI for S. aureus IsdB induction [37]; Specific media for pilus expression in E. coli [41] | Growth conditions dramatically affect adhesion phenotype; Must be carefully standardized |
| AF12198 | AF12198, MF:C96H123N19O22, MW:1895.1 g/mol | Chemical Reagent | Bench Chemicals |
| MEN 11270 | B2 Receptor Research Peptide | High-purity H-D-Arg-Arg-Pro-Hyp-Gly-2Thi-Dab(1)-D-Tic-Oic-Arg-(1) for bradykinin B2 receptor studies. For Research Use Only. Not for human consumption. | Bench Chemicals |
Pathogen-Specific Signaling Pathways and Molecular Interactions
Staphylococcus aureus IsdB-TLR4 Interaction Pathway
S. aureus has evolved a sophisticated mechanism to adhere to host cells under iron-limited conditions, which are frequently encountered during infection. The iron-regulated surface determinant protein B (IsdB) plays a central role in this process, functioning both in iron acquisition and direct adhesion to host receptors [37].
Figure 2: S. aureus IsdB-TLR4 adhesion and signaling pathway, showing molecular interactions and downstream consequences during infection.
The mechanical properties of the IsdB-TLR4 bond are remarkable, with single-molecule experiments demonstrating that this interaction sustains forces up to 2000 pN at high loading rates (10^5 pN/s) [37]. This stress-activated adhesion represents a sophisticated adaptation to withstand shear forces in the bloodstream, allowing S. aureus to maintain attachment to endothelial surfaces during bacteremia. The essential binding residues include valine189 and tyrosine192 in the NEAT1 motif, along with three glutamic acid residues in the linker segment between NEAT1 and NEAT2 domains [37].
Escherichia coli FimH-Mannose Adhesion System
E. coli employs a different strategy centered on the FimH adhesin located at the tips of type 1 pili. This system enables attachment to mannosylated surfaces in the urinary tract through a polyvalent adhesion mechanism that enhances binding strength through multiple simultaneous interactions [41].
The polyvalent nature of this adhesion system creates a robust attachment strategy particularly adapted to environments with fluid shear stress, such as the urinary tract. Single-molecule measurements using optical tweezers have quantified the forces involved in individual pilus-mannose interactions, which occur in the pN range [41]. The mechanical properties of the pilus structure itself contribute to the adhesion mechanism, with the ability to uncoil under stress and dissipate energy, thereby preventing bacterial detachment under flow conditions.
Applications in Polymicrobial Infections and Therapeutic Development
Polymicrobial Interactions on Implant Surfaces
Recent research has revealed complex interactions between S. aureus and E. coli in dual-species implant-associated biofilms, with significant implications for infection progression and treatment outcomes. When these pathogens co-colonize surfaces, E. coli significantly suppresses S. aureus biofilm viability, observed for both methicillin-susceptible (MSSA) and methicillin-resistant (MRSA) strains [42]. This suppression effect increases over time, with E. coli dominating the biofilm composition by 48 hours despite initial S. aureus predominance.
Single-cell force spectroscopy provides insights into the mechanical basis of these competitive interactions. The differential adhesion capabilities of the two species likely contribute to their temporal dynamics in polymicrobial biofilms. S. aureus exhibits stronger initial attachment mediated by its diverse surface proteins, while E. coli demonstrates superior persistence under flow conditions through its polyvalent pilus-based adhesion system [37] [41] [42]. These adhesion differences translate to altered antibiotic susceptibility profiles, with MSSA exhibiting improved gentamicin susceptibility in dual-species settings while MRSA shows limited change [42].
Applications in Anti-Adhesion Therapy Development
The quantitative insights provided by SCFS are driving innovative approaches to anti-infective therapy focused on disrupting bacterial adhesion rather than killing pathogens. By targeting the initial attachment step, these strategies aim to prevent infection without exerting strong selective pressure for antibiotic resistance [37] [41].
For S. aureus, the IsdB-TLR4 interaction represents a promising target for therapeutic intervention. Single-molecule force spectroscopy enables direct screening of compounds that inhibit this interaction by measuring reductions in binding frequency and rupture forces [37]. Similarly, for E. coli, the FimH-mannose interaction can be targeted with soluble receptor analogs or small molecule inhibitors that block attachment to host tissues [41]. SCFS provides a quantitative platform for evaluating the efficacy of these anti-adhesion compounds by directly measuring their impact on pathogen-host interaction forces.
The development of anti-fouling surfaces for medical implants represents another application benefiting from SCFS insights. By measuring adhesion forces of S. aureus and E. coli to engineered surfaces with controlled chemical and physical properties, researchers can identify surface characteristics that minimize bacterial attachment [44] [45]. These studies have revealed that simple polypropylene mesh grafts attract significantly fewer S. aureus and E. coli cells compared to polyester, expanded polytetrafluoroethylene (ePTFE), or composite prosthetic mesh grafts [44].
Future Perspectives in Bacterial Adhesion Research
The field of single-cell force spectroscopy continues to evolve with technological advancements that enable increasingly sophisticated investigations of pathogen-host interactions. The integration of SCFS with complementary techniques such as fluorescence microscopy, transcriptomics, and microfluidics is creating powerful multimodal platforms for correlating adhesion forces with molecular localization and gene expression patterns in individual bacterial cells [42] [38].
Future directions include the development of high-throughput SCFS platforms to rapidly screen bacterial adhesion phenotypes and anti-adhesion compounds, and the application of SCFS to study bacterial adhesion in more complex, tissue-like environments. There is also growing interest in investigating how mechanical forces experienced during adhesion trigger transcriptional responses in bacteria—a field known as mechanobiology—which may reveal novel targets for anti-infective therapies [40].
As SCFS methodologies become more accessible and standardized, their application in both basic research and pharmaceutical development will continue to expand, providing unprecedented insights into the mechanical forces that govern S. aureus and E. coli infections and enabling the development of novel strategies to combat these clinically important pathogens.
For probiotics to confer health benefits, they must first adhere to the intestinal mucosa, a crucial step that prolongs gut residence time and facilitates host-microbe interactions. The adhesion of probiotic bacteria is a complex process governed by specific ligand-receptor mechanisms and non-specific physicochemical interactions. Lactobacillus plantarum, a species frequently isolated from fermented foods and the human gastrointestinal tract, exhibits remarkable strain-dependent adhesion capabilities, making it an ideal model organism for studying probiotic adhesion mechanisms. This guide examines these mechanisms within the contemporary research context of single-cell force spectroscopy (SCFS), a cutting-edge biophysical technique that allows for the quantitative measurement of adhesion forces at the level of individual bacterial cells. SCFS provides unprecedented insights into the nanoscale interactions and phenotypic heterogeneity that underlie bacterial adhesion, moving beyond the limitations of traditional population-averaged assays [16] [26].
Core Adhesion Mechanisms ofLactobacillus plantarum
The adhesion capability of L. plantarum is not a singular trait but an interplay of multiple surface characteristics and molecular factors. Research has demonstrated that adhesion ability varies significantly among isolates depending on their original habitats, with some strains from infant intestines exhibiting exceptionally high adhesion properties [46].
Surface Characteristics and Physicochemical Properties
Cell Surface Hydrophobicity: A key non-specific determinant of adhesion, hydrophobicity enables bacterial cells to overcome repulsive forces with the mucosal surface. Studies consistently correlate high cell surface hydrophobicity with enhanced adhesion capabilities in L. plantarum [46] [47]. The relationship between hydrophobicity and autoaggregation is particularly important, as autoaggregates can adhere more effectively to mucosal surfaces, increasing probiotic persistence in the intestine [47].
Autoaggregation and Co-aggregation: Autoaggregation (self-clumping) is a phenomenon where bacterial cells of the same strain adhere to each other, while co-aggregation involves clumping between genetically distinct cells, often including pathogens. Both properties are considered desirable for probiotics as autoaggregates enhance mucosal adhesion persistence, and co-aggregation with pathogens can prevent pathogenic colonization by facilitating their removal from the intestinal tract [47].
Molecular Adhesion Mechanisms
Mucus-Binding Proteins: L. plantarum expresses various cell wall-anchored proteins that facilitate adhesion to mucin, the primary glycoprotein component of intestinal mucus. Genomic analyses have identified orthologues of major mucus-binding proteins from the reference strain L. plantarum WCFS1 (including lp0964, lp1643, lp3114, lp2486, lp3127, and lp3059) across different isolates [46].
Mannose-Specific Adhesin: The msa gene encodes a mannose-specific adhesin (lp_1229) that mediates attachment to host tissues. Interestingly, gene-trait matching has revealed that the absence of this adhesin in some highly adhesive infant isolates suggests alternative adhesion mechanisms can compensate for or exceed the function of this specific protein [46].
Flagellin Proteins: A groundbreaking discovery in adhesion research has been the identification of predicted flagellin-encoding genes (fliC) in lp_1643, lp_2486, and lp_3114 orthologues. These may contribute significantly to the highly adhesive property of certain L. plantarum isolates, revealing a previously unrecognized mechanism in this non-flagellated species [46].
Table 1: Key Molecular Adhesion Factors in L. plantarum
| Molecular Factor | Gene/Locus | Function in Adhesion | Research Findings |
|---|---|---|---|
| Mucus-Binding Proteins | lp0964, lp1643, lp3114, lp2486, lp3127, lp3059 | Adhesion to mucin glycoproteins in intestinal mucus | Detected across all studied isolates; core adhesion apparatus [46] |
| Mannose-Specific Adhesin (Msa) | lp_1229 | Specific binding to mannose residues on host surfaces | Absence in some high-adhesion isolates suggests alternative pathways [46] |
| Flagellin-like Proteins | fliC in lp1643, lp2486, lp_3114 orthologues | Potential enhancement of adhesion capacity | Newly predicted role in high-adhesion infant isolates [46] |
| Aggregation-Promoting Factors (Apf) | Species-specific apf genes | Mediate cell-cell aggregation (autoaggregation) | Autoaggregation phenotype correlates with improved adhesion to intestinal cells [47] |
Quantitative Analysis of Adhesion Capabilities
Adhesion capabilities of L. plantarum strains show considerable variation based on their isolation source, with specific strains demonstrating superior performance that makes them promising candidates for probiotic applications.
Table 2: Adhesion Capabilities of L. plantarum from Different Habitats
| Isolation Habitat | Representative Strains | Adhesion Ability (%) | Key Characteristics |
|---|---|---|---|
| Infant Intestine | CIF17A2, CIF17A4, CIF17A5, CIF17AN2, CIF17AN8 | 62.69 - 72.06% | Extremely high adhesion; distinctively high cell surface hydrophobicity [46] |
| Shrimp Intestine | Multiple isolates | 51.06 - 55.04% | High adhesion level, comparable to commercial probiotic 299v [46] |
| Food Isolates | Various dairy and fermented food isolates | Variable (approximately half similar to 299v) | Habitat-specific adaptation; robust adhesion even after GI stress [46] [48] |
| Commercial Probiotics | L. plantarum 299v, IMC510, IMC513 | ~55% (299v) | Benchmark for comparison; well-documented probiotic strains [46] [48] |
Impact of Environmental Stresses on Adhesion
A critical characteristic of potential probiotics is their ability to maintain adhesion capabilities despite environmental challenges. L. plantarum exhibits remarkable resilience, with adhesion ability remaining at high levels even after sequential exposure to gastrointestinal stresses [46]. Furthermore, specific strains demonstrate exceptional survival rates under simulated gastrointestinal conditions:
- Gastric Juice Survival: Lactococcus lactis MKL8 (a related lactic acid bacterium) showed >72% survival rate in simulated gastric juice (pH 3 with pepsin) after 120 minutes [49].
- Bile Salt Tolerance: The same strain exhibited >79% survivability in high bile concentrations [49].
- Acid Resistance: Survival rates ranging from 72-91% in relatively low pH conditions [49].
Single-Cell Force Spectroscopy in Bacterial Adhesion Research
Single-cell force spectroscopy represents a paradigm shift in adhesion studies, moving beyond population-level observations to probe the biophysical properties of individual bacterial cells.
Fundamental Principles of SCFS
SCFS utilizes atomic force microscopy (AFM) to quantify adhesion forces at the single-cell level. A key advantage of this approach is its ability to detect phenotypic heterogeneity within clonal populations, revealing subpopulations of cells with distinct biophysical properties that are masked in conventional bulk measurements [16]. This heterogeneity provides a selective advantage, enabling bacterial populations to colonize diverse surfaces and adapt to varied environments [16].
Technical Considerations for SCFS
Probe Selection: The use of colloidal probes instead of standard conical tips for force spectroscopy allows for the evaluation of cell stiffness and bacteria-surface adhesion forces across the entire cell surface, minimizing the influence of known surface diversity and focusing on heterogeneity among cells within the population [16].
Adhesion Dynamics: SCFS research on Streptococcus pneumoniae has revealed that adhesion is likely a multiphasic process where adhesion profiles at short contact times (<5 seconds) can differ significantly from those at long contact times (~1 hour), highlighting the importance of temporal factors in adhesion mechanics [26].
Surface Molecule Analysis: SCFS enables the precise dissection of roles played by specific surface structures. For example, studies have demonstrated that the polysaccharide capsule might limit surface accessibility of adhesins while providing structural support, and that specific adhesins like PspC may contribute to medium- and long-range interactions (>3000nm) with host cells [26].
Experimental Protocols for Adhesion Assessment
Mucin Adhesion Assay Protocol
Principle: This assay evaluates the ability of L. plantarum strains to adhere to mucin, the primary glycoprotein component of intestinal mucus.
Methodology:
- Mucin Immobilization: Immobilize human intestinal mucus or ileostomy glycoproteins in microtiter plate wells through passive adsorption [50].
- Bacterial Preparation: Grow L. plantarum strains in MRS broth for 18-24 hours at 37°C under microaerophilic conditions. Harvest cells by centrifugation (2,151 × g for 5 minutes), wash twice with phosphate-buffered saline (PBS), and resuspend in appropriate buffer [46] [49].
- Adhesion Phase: Add bacterial suspensions (concentrations typically between 4.4×10^6 and 4.1×10^8 CFU/mL) to mucin-coated wells and incubate at 37°C for 60-120 minutes [50].
- Washing and Quantification: Remove non-adherent bacteria by gentle washing with PBS. Adherent bacteria can be quantified by various methods:
- Radiolabeling: Use bacteria pre-labeled with (methyl,1′,2′-3H) thymidine and measure bound radioactivity by liquid scintillation counting [50].
- Plate Counting: Lyse adherent cells and plate serial dilutions on MRS agar for viable counting [49].
- Microscopic Counting: Fix and stain adhered bacteria for visual counting [48].
Data Analysis: Adhesion ability is typically expressed as the percentage of bacteria from the original inoculum that remain adherent after washing [46].
Caco-2/Intestinal Cell Adhesion Assay
Principle: This method assesses bacterial adhesion to human intestinal epithelial cells, mimicking the in vivo intestinal environment.
Methodology:
- Cell Culture: Maintain Caco-2 cells (human colon adenocarcinoma cell line) or NCM460 cells (normal-derived colon mucosa cell line) in appropriate media (DMEM for Caco-2, M3Base medium for NCM460) supplemented with fetal bovine serum and antibiotics [50] [48].
- Monolayer Preparation: Seed cells in chamber slides or multi-well plates (2.8×10^5 viable cells/mL for Caco-2; 10^5 cells/well for NCM460) and culture until confluent monolayers form (15 days post-confluence for Caco-2) [50] [48].
- Bacterial Co-incubation: Wash cell monolayers with PBS, then add bacterial suspensions in fresh medium and incubate at 37°C in 5% CO₂ for 60 minutes [50].
- Removal of Non-adherent Bacteria: Wash monolayers gently but thoroughly with PBS to remove non-adherent bacteria.
- Fixation and Staining: Fix cells with methanol and Gram stain to differentiate between gram-positive Lactobacillus and any gram-negative contaminants [50].
- Quantification: Examine under microscope and count adherent bacteria on approximately 1,000 intestinal cells across 60 randomly selected microscopic fields [50].
Data Analysis: Express results as number of adherent bacteria per 100 intestinal cells [50].
Single-Cell Force Spectroscopy Protocol
Principle: AFM-based force spectroscopy measures adhesion forces between a single bacterial cell and a substrate at the picoNewton scale.
Methodology:
- Bacterial Immobilization: Immobilize bacteria on gelatin-coated glass surfaces. Centrifuge bacterial culture (2,151 × g for 5 min), wash twice with Milli-Q water, resuspend, adjust to 10^6 CFU/mL, and deposit on gelatin-coated slides for 30 minutes [16].
- Probe Functionalization: For single-cell force spectroscopy, attach a single bacterial cell to the AFM cantilever using a bio-adhesive [26].
- Force Measurement: Approach the bacterial cell toward the substrate (mucin, intestinal cells, or reference surface) until contact is established, maintain contact for a defined dwell time (ranging from milliseconds to seconds), then retract the cantilever while recording deflection [16] [26].
- Data Collection: Collect force-distance curves at multiple locations on the sample surface or for multiple cells to assess heterogeneity.
Data Analysis:
- Adhesion Force: Determine from the maximum force peak during retraction.
- Adhesion Work: Calculate as the area under the force-distance curve during retraction.
- Elasticity: Derive from the slope of the force curve during the approach phase using appropriate contact mechanics models (e.g., Hertz, Sneddon) [16].
The Scientist's Toolkit: Essential Research Reagents and Materials
Table 3: Key Research Reagent Solutions for Probiotic Adhesion Studies
| Reagent/Material | Function/Application | Example Specifications |
|---|---|---|
| MRS Broth/Agar | Culture medium for Lactobacillus strains | Standardized formulation for lactic acid bacteria growth [48] [49] |
| Mucin (Intestinal) | Substrate for adhesion assays; mimics intestinal mucus | Isolated from human feces or ileostomy; immobilized on plates [50] |
| Caco-2 Cell Line | Human intestinal epithelial cell model for adhesion studies | HTB-37; requires 15-day post-confluence differentiation [50] |
| NCM460 Cell Line | Normal-derived colon mucosa cell line | Alternative to tumor-derived lines; healthy phenotype [48] |
| Simulated Gastric Juice | Tests bacterial survival in GI conditions | pH 3.0 with pepsin (0.3 mg/mL), NaHCO₃ (45 mM), KCl (7 mM) [49] |
| Atomic Force Microscope | Single-cell force spectroscopy measurements | With colloidal probes or single-cell functionalized tips [16] |
| Gelatin-Coated Slides | Substrate for bacterial immobilization in AFM | For attaching bacterial cells for single-cell analysis [16] |
| BOC-FlFlF | Boc-Phe-Leu-Phe-Leu-Phe|FPR Antagonist | |
| GRGDSPK | GRGDSPK, CAS:111119-28-9, MF:C28H49N11O11, MW:715.8 g/mol | Chemical Reagent |
The integration of traditional microbiology with advanced biophysical techniques like single-cell force spectroscopy has revolutionized our understanding of L. plantarum adhesion mechanisms. The emerging paradigm recognizes that adhesion is a multiphasic, strain-specific process influenced by an array of surface proteins, physicochemical properties, and phenotypic heterogeneity within bacterial populations. Future research should focus on correlating SCFS-derived adhesion parameters with in vivo colonization efficiency and probiotic functionality. Additionally, exploring the dynamic regulation of adhesion factors in response to gastrointestinal environmental cues will provide a more comprehensive understanding of how probiotic strains establish themselves in the complex gut ecosystem. The continued refinement of SCFS methodologies promises to unlock further insights into the nanoscale world of probiotic-host interactions, guiding the development of more effective probiotic formulations and therapeutic applications.
The initial adhesion of bacteria to host cells is a critical step in the pathogenesis of many infections. This interaction is not solely governed by molecular recognition between bacterial adhesins and host receptors but is also profoundly influenced by the biophysical properties of the microenvironment. Among these properties, osmotic pressure has emerged as a key regulator of bacterial-host interfacial adhesion. This technical guide examines how environmental osmotic stress modulates adhesion forces at the single-cell level, with a specific focus on insights gained through single-cell force spectroscopy (SCFS). Understanding these mechanobiological mechanisms provides new opportunities for developing host-directed antibacterial strategies that operate alongside or potentially bypass traditional antibiotic approaches.
Osmotic Pressure in Host and Pathogen Environments
Osmotic stress is widespread in host environments due to the influence of various physiological and pathological factors. In the intestinal microenvironment, for instance, osmotic pressure can be influenced by diet, while at specific lesion sites, such as in cystic fibrosis airways, osmolarity can increase up to seven-fold compared to normal conditions [51]. Similar perturbations occur in osmotic diarrhea, inflammatory bowel disease, and with the use of osmotic drugs [51].
The biomechanical microenvironment surrounding host cells plays a crucial role in bacterial-cell interactions, influencing adhesin-receptor binding, bacterial infection of epithelial cells, and even intracellular antibiotic accumulation [51]. While hyperosmotic pressure has been shown to modulate vascular barrier function and prevent progression of infectious diseases, it can also impair antimicrobial neutrophil responses and enhance proinflammatory activity in macrophages under certain conditions [51]. This complex interplay establishes osmotic pressure as a significant factor in host-pathogen interactions.
Single-cell force spectroscopy (SCFS) represents a specialized application of atomic force microscopy (AFM) designed to quantify interaction forces at the cellular level. The methodology involves immobilizing a single living cell on an AFM cantilever and measuring the interaction forces between this cellular probe and a substrate or another cell [2]. For microbial adhesion studies, SCFS has been instrumental in measuring the forces controlling bacterial adhesion on a single-cell basis, providing insights not achievable through traditional approaches like electron microscopy or flow chamber experiments [2].
A more advanced implementation of this technology, fluidic force microscopy (FluidFM), integrates atomic force microscopy with nanofluidics, enabling precise liquid delivery and manipulation of single viable cells [51]. This integration allows researchers to capture individual bacterial cells using a probe with a microfluidic channel and position them with exceptional control for adhesion measurements.
Core SCFS Protocol for Bacterial Adhesion
The fundamental protocol for SCFS in bacterial adhesion studies involves several critical stages. For well-trained microscopists, the entire procedure can typically be mastered within one week [2]:
Probe Preparation: AFM cantilevers are functionalized using methods such as polydopamine coating or specific chemical treatments to ensure firm but non-damaging cell immobilization.
Cell Immobilization: A single living bacterial cell is attached to the functionalized cantilever, creating a "cellular probe." The immobilization must preserve cell viability and surface properties.
Force Measurement: The cellular probe is approached toward the target surface (host cell or substrate) at a controlled speed (typically 1 μm/s) until contact is established.
Contact Period: The probe maintains contact with the surface for a defined dwell time (e.g., 30 seconds) to allow adhesive interactions to form.
Retraction: The probe is retracted from the surface at a controlled speed, during which the force required to separate the bacterium from the surface is measured.
Data Analysis: Force-distance curves are analyzed to extract quantitative parameters including adhesion force (maximum force required for detachment), adhesion energy (area under the retraction curve), and rupture event patterns [51] [2].
Table 1: Key SCFS Measurement Parameters in Osmotic Pressure Studies
| Parameter | Typical Value/Range | Experimental Significance |
|---|---|---|
| Approach/Retraction Speed | 1 μm/s | Controls hydrodynamic forces during measurement |
| Contact Time | 30 seconds | Allows bond formation and maturation |
| Adhesion Force Range | 25-112 nN (S. aureus to IEC-6 cells) [51] | Quantifies strength of bacterial-host interaction |
| Bacterial Capture Method | FluidFM micropipette [51] | Enables single-bacterium precision |
| Force Resolution | NanoNewtons (nN) to PicoNewtons (pN) [2] | Detects individual molecular interactions |
Osmotic Pressure Directly Modulates Bacterial-Host Adhesion Forces
Research has demonstrated that environmental osmolarity plays a crucial role in regulating bacterial-host interfacial adhesion, with SCFS providing quantitative measurements of these effects.
Adhesion Force Measurements Under Osmotic Stress
Using FluidFM-based SCFS, studies have revealed that interfacial adhesion force depends nonlinearly on the osmotic prestimulation of host cells but not bacteria [51]. When host cells (rat small intestinal epithelial cell line IEC-6) were prestimulated with hypotonic or hypertonic solutions for 1 hour before adhesion measurements, dramatic increases in adhesion forces were observed compared to isotonic conditions.
Quantitatively, the mean adhesion force between Staphylococcus aureus and IEC-6 cell monolayers increased from 25.98 nN under isotonic conditions to 112.45 nN after host cell treatment with hypotonic solution (0.5×) and 93.10 nN after hypertonic treatment (2×) [51]. This represents an approximately 4.3-fold increase for hypotonic stimulation and 3.6-fold increase for hypertonic stimulation compared to isotonic conditions.
Similar trends were observed across different osmotic intensities, with adhesion forces showing progressive increases as environments deviated further from isotonic conditions: 61.1 nN at 0.75× hypotonic, 55.02 nN at 1.5× hypertonic, and 93.1 nN at 2× hypertonic [51].
Correlation with Bacterial Adhesion and Infection
The measured adhesion forces strongly correlated with functional biological outcomes. Both the number of bacteria adherent/internalized to host cells (NadB) and the number of host cells harboring adherent/internalized bacteria (NadC) increased significantly when host cell prestimulation changed from isotonic to either hypotonic or hypertonic conditions [51].
After prestimulation of host cell monolayers with hypotonic and hypertonic solutions, NadB increased by approximately 3.25-fold and 2.07-fold, respectively, for IEC-6 monolayers, and by approximately 4.87-fold and 2.56-fold for HaCat (human keratinocyte) monolayers [51]. Similarly, NadC increased by approximately 3.02-fold and 2.93-fold for IEC-6 monolayers and by 7.11-fold and 4.00-fold for HaCat monolayers under hypotonic and hypertonic conditions, respectively [51].
These findings demonstrate that osmotic pressure not only modulates fundamental adhesion forces but also functionally impacts bacterial adhesion capacity and potentially subsequent infection processes.
Diagram 1: Osmotic Pressure Modulation of Bacterial-Host Adhesion. This workflow illustrates how hypotonic and hypertonic conditions trigger distinct host cell responses leading to collagen subtype overexpression and ultimately increased bacterial adhesion forces and infection outcomes.
Molecular Mechanisms: Collagen Subtype Regulation
The mechanisms underlying osmotically-regulated adhesion involve specific changes in host cell extracellular matrix components rather than bacterial factors.
Collagen Subtype-Specific Overexpression
RNA sequencing analysis has revealed that enhanced overexpression levels of specific collagen subtypes are responsible for increased interfacial adhesion under different osmotic conditions [51]:
- Under hypotonic conditions, host cells significantly upregulate collagen XV expression
- Under hypertonic conditions, host cells significantly upregulate collagen II expression
This subtype-specific regulation suggests distinct signaling pathways are activated depending on the nature of osmotic stress. The discovery that different collagen isoforms mediate adhesion under different osmotic conditions indicates complex regulatory mechanisms rather than a simple overall increase in collagen production.
Bacterial Adhesin-Collagen Interactions
The upregulated collagen subtypes serve as binding targets for bacterial adhesins. Staphylococcus aureus, for example, expresses specific collagen-binding adhesins (Cna) that contribute to bacterial adhesion to the host and subsequent virulence [51]. The increased availability of their collagen substrates on host cell surfaces under osmotic stress facilitates stronger bacterial attachment.
This mechanism explains why osmotic prestimulation of host cells, but not bacteria, dominates the adhesion response—the host surface is remodeled to present more binding sites for bacterial adhesins that already exist constitutively or are regulated independently.
Experimental Protocols for Osmotic Adhesion Studies
Osmotic Environment Control Protocol
To investigate osmotic pressure effects on bacterial adhesion, researchers must establish precisely controlled osmotic environments:
Solution Preparation:
- Isotonic Control: Regular cell culture medium
- Hypotonic Solutions: Prepared by adding deionized water to regular medium (e.g., 0.5×, 0.75× concentration)
- Hypertonic Solutions: Prepared by adding D-mannitol solution or NaCl to regular medium (e.g., 1.5×, 2× concentration) [51]
Host Cell Prestimulation:
- Culture host cell monolayers (IEC-6, HaCat, or other relevant lines) to appropriate confluence
- Replace culture medium with prepared osmotic solutions for 1-3 hours
- Verify cell viability after osmotic exposure (e.g., via Live/Dead assays) [51]
Bacterial Preparation:
- Culture bacterial strains (e.g., S. aureus, E. coli) to mid-log phase
- Wash and resuspend in appropriate buffers matching osmotic conditions
- Standardize bacterial concentration (typically 100× host cell count) [51]
Integrated SCFS-Osmotic Stimulation Workflow
The core protocol for measuring bacterial adhesion under osmotic stress integrates SCFS with controlled osmotic stimulation:
Probe Functionalization: Prepare FluidFM probes with polydopamine or appropriate chemistry for bacterial capture [51] [2]
Bacterial Immobilization: Apply suction through FluidFM micropipette to capture a single bacterium on the probe tip [51]
Osmotic Equilibration: Immerse both cellular probe and target host cells in the same osmotic environment for system equilibration
Adhesion Measurement:
- Approach bacterium to host cell at 1 μm/s until contact
- Maintain contact for 30 seconds for bond formation
- Retract probe at 1 μm/s while recording force-distance data [51]
Data Collection: Perform minimum 50-100 force measurements per osmotic condition across multiple cells and biological replicates [51]
Parallel Validation: Conduct complementary adhesion assays (microscopy, flow cytometry, colony counting) to correlate force measurements with biological adhesion [51]
Diagram 2: Integrated SCFS-Osmotic Stimulation Workflow. This experimental protocol outlines the key steps for measuring bacterial adhesion forces under controlled osmotic conditions, from solution preparation to data analysis and validation.
The Scientist's Toolkit: Essential Research Reagents and Materials
Table 2: Essential Research Reagents and Equipment for Osmotic Adhesion Studies
| Category/Item | Specific Examples | Function/Application |
|---|---|---|
| Host Cell Lines | IEC-6 (rat small intestinal epithelium), HaCat (human keratinocytes) | Model host cell systems for adhesion studies [51] |
| Bacterial Strains | Staphylococcus aureus, Escherichia coli | Model gram-positive and gram-negative pathogens [51] |
| Osmotic Agents | D-mannitol, NaCl, Polyethylene glycol (PEG 300) | Precise modulation of environmental osmolarity [51] [52] |
| SCFS Platform | FluidFM (Atomic Force Microscopy with microfluidics) | Single-cell force spectroscopy with live bacterium probe [51] |
| Viability Assays | Live/Dead staining, Membrane integrity assays | Assessment of osmotic stress cytotoxicity [51] |
| Molecular Biology | RNA sequencing reagents, Collagen subtype antibodies | Mechanism investigation via gene expression and protein validation [51] |
| Adhesion Validation | Flow cytometry, Colony counting, Immunofluorescence | Correlation of force measurements with biological outcomes [51] |
| AHK | AHK, CAS:126828-32-8, MF:C15H26N6O4, MW:354.41 g/mol | Chemical Reagent |
Discussion and Research Implications
The finding that osmotic pressure significantly modulates bacterial-host adhesion forces has important implications for understanding infection mechanisms and developing therapeutic strategies.
Host-Directed Anti-Adhesion Therapy
Targeting the different collagen isoforms expressed by host cells under osmotic stress represents a promising host-directed antibacterial strategy [51]. Rather than targeting bacterial factors that may develop resistance, modulating host responses to osmotic stress could prevent the initial adhesion step essential for infection. This approach might be particularly valuable for infections in body sites with naturally fluctuating osmolarity, such as the gastrointestinal tract, skin, and respiratory epithelium.
Relationship to Bacterial Dormancy and Persistence
Osmotic pressure effects on bacterial adhesion should be considered alongside its broader impacts on bacterial physiology. Hyperosmotic stress has been shown to induce reversible growth arrest in human metastatic cells [52], and similar effects may occur in bacterial populations. This connection between adhesion modulation and growth arrest suggests complex relationships between environmental osmolarity, bacterial adhesion, and potential persistence mechanisms that warrant further investigation.
Technical Considerations and Limitations
While SCFS provides unprecedented quantification of adhesion forces, several technical considerations merit attention. The large variations in force-distance curves observed even for single extracellular vesicles highlight the importance of sufficient replication and appropriate statistical analysis [53]. Additionally, the specific surface properties of both bacterial and host cells—including hydrophobicity and surface charge—significantly influence adhesion patterns [54]. These factors must be controlled or accounted for in experimental design.
Environmental osmotic pressure serves as a potent modulator of bacterial-host adhesion forces, with both hypotonic and hypertonic conditions dramatically increasing adhesion compared to isotonic conditions. Through precise quantification via single-cell force spectroscopy, researchers have demonstrated that these effects are mediated primarily through host cell responses involving specific collagen subtype overexpression—collagen XV under hypotonic conditions and collagen II under hypertonic conditions. These findings not only advance our fundamental understanding of host-pathogen interactions but also open new avenues for therapeutic intervention by targeting host mechanisms that enhance bacterial adhesion under osmotic stress. Future research should focus on elucidating the precise signaling pathways connecting osmotic sensing to collagen remodeling and exploring translational applications of these findings in anti-infective strategy development.
Robotic Fluidic Force Microscopy (FluidFM) represents a groundbreaking convergence of atomic force microscopy (AFM) and microfluidics, enabling unprecedented high-throughput mechanical investigations of single cells. This technology addresses a critical limitation in traditional single-cell force spectroscopy (SCFS), where conventional AFM methods typically limited researchers to measuring only "a few cells per day," making it impossible to study population-level phenomena due to low throughput [55]. The core innovation of FluidFM lies in its use of micromachined hollow cantilevers featuring apertures at their tips, connected to a precise pressure control system. This design creates a continuous closed fluidic channel that can be filled with chosen liquids and locally dispensed, combining precise force sensing with microfluidic capabilities for single-cell manipulation [56].
Unlike conventional AFM cantilevers that require irreversible biochemical attachment of cells—a labor-intensive process that potentially perturbs cellular function—FluidFM uses gentle suction through the microfluidic channel to immobilize cells or particles [56]. This approach overcomes the critical limitation where "cell-to-cantilever coupling force" must be stronger than the adhesion forces being measured, which previously challenged intercellular adhesion measurements [56]. The robotic implementation further enhances throughput through a motorized large-area XY-stage and partial automation, enabling sequential measurement of hundreds of individual cells under physiological conditions with minimal user intervention [55].
Technical Specifications and System Components
The robotic FluidFM system integrates several sophisticated components to achieve high-throughput single-cell mechanical measurements. Understanding these specifications is essential for proper implementation and data interpretation.
Table 1: Core Technical Components of Robotic FluidFM Systems
| Component | Specification | Function in High-Throughput Applications |
|---|---|---|
| Fluidic Cantilever | Micromachined hollow SiN; typical aperture: 300 nm - 8 µm | Combines force sensing with single-cell manipulation via suction/dispensing |
| Pressure Control System | Precision pressure controller; range: ±800 mbar | Enables gentle cell capture and release without chemical fixation |
| Positioning System | Piezoelectric scanner with robotic XY-stage; travel range: >100 mm | Automated navigation across large samples for sequential cell measurements |
| Detection System | Laser beam with 4-quadrant position-sensitive detector (PSD) | Measures cantilever deflection with sub-nanonewton force resolution |
| Software Control | Automated workflow management with image integration | Correlates optical/fluorescence images with force measurements |
The microfabricated fluidic cantilevers represent a significant advancement over traditional pulled-glass micropipettes, offering superior uniformity and throughput due to mass production using micro-electromechanical system (MEMS) technology [56]. These cantilevers maintain the force sensitivity of conventional AFM probes (typically 0.1-2 nN sensitivity) while incorporating the microfluidic channel. The robotic staging system enables the instrument to "measure a large population of cells in a high-throughput manner," addressing previous limitations in statistical power for single-cell mechanobiology studies [55].
Table 2: Typical Performance Metrics of Robotic FluidFM in Single-Cell Adhesion Studies
| Parameter | Conventional AFM | Robotic FluidFM | Measurement Significance |
|---|---|---|---|
| Throughput (cells/day) | 1-10 cells | 200+ cells | Enables population-level statistical analysis |
| Adhesion Force Range | 0.1-10,000 nN | 0.1-10,000 nN | Quantifies single-cell to strong collective adhesion |
| Force Resolution | <100 pN | <100 pN | Detects subtle biological differences |
| Lateral Resolution | <10 nm | <10 nm | High-resolution surface mapping capability |
| Cell Viability | Variable (chemical attachment) | High (gentle suction) | Maintains physiological relevance |
Application to Single-Cell Adhesion Studies
Robotic FluidFM has revolutionized the study of cellular adhesion by enabling population-level investigations that reveal distributions and subpopulations impossible to detect with low-throughput methods. In a landmark study investigating cell cycle-dependent adhesion, researchers utilized robotic FluidFM to measure 251 individual cells, revealing that critical adhesion parameters follow lognormal distributions rather than normal distributions [55]. This finding has profound implications for experimental design, as "conclusions based on adhesion data of a low number of cells or treating the population as normally distributed can be misleading" [55].
The technology enabled the discovery that cells in mitosis (M phase) and early G1 phase exhibit fundamentally different adhesion characteristics, including significantly smaller cell areas and larger area-normalized maximal adhesion forces compared to cells in other cell cycle phases [55]. Particularly noteworthy was the finding that "reticular adhesion can exert a higher force per unit area than canonical focal adhesions, and cells in this phase are significantly stiffer" [55]. This mechanistic insight was made possible by the high-throughput capabilities of robotic FluidFM, which provided sufficient data to correlate cell cycle phase (identified using Fucci fluorescent markers) with mechanical adhesion parameters.
Beyond single cell-substratum interactions, robotic FluidFM has been extended to investigate cell-cell adhesion forces in both mono- and multilayer assemblies, providing insights into tissue-level mechanical properties [57]. The system can measure both vertical binding forces (VBFs) between heterogeneous cells and lateral binding forces (LBFs) of endothelial or epithelial cells in confluent monolayers, all within appropriate physiological environments [56]. This capability is particularly valuable for studying barrier function and intercellular communication in tissues and microbial communities.
Experimental Protocols and Methodologies
Standardized Single-Cell Adhesion Measurement Protocol
Implementing robust experimental protocols is essential for generating reliable, reproducible data with robotic FluidFM systems. The following workflow has been optimized for high-throughput single-cell adhesion measurements:
System Preparation: Calibrate the cantilever sensitivity using a clean, rigid substrate in fluid. Set the pressure control system to maintain neutral pressure (typically 0 mbar relative to atmospheric) in the microfluidic channel filled with appropriate physiological buffer.
Cantilever Functionalization (optional): For specific ligand-receptor studies, coat the cantilever with relevant molecules using chemical functionalization protocols. Alternatively, attach colloidal probes of defined geometry and chemistry to the cantilever apex.
Cell Preparation: Culture cells on appropriate substrates ensuring optimal viability and expression of native adhesion structures. For time-dependent studies, allow sufficient time for adhesion maturation (typically 2-24 hours depending on cell type).
Cell Selection and Immobilization: Use the integrated optical microscope to identify target cells. Precisely position the cantilever over the cell and apply gentle suction (typically -100 to -300 mbar) to capture and immobilize the cell without internal damage.
Adhesion Measurement:
- Approach the cell toward the substrate at a defined velocity (typically 1-5 µm/s).
- Maintain contact with defined force (0.5-2 nN) and duration (1-60 seconds) to allow adhesion formation.
- Retract the cantilever at constant velocity (typically 1-10 µm/s) while recording force-distance curves.
- For population studies, automatically move to the next cell and repeat.
Data Analysis: Extract key parameters including maximal adhesion force (Fmax), detachment energy (work of adhesion), rupture length, and number of discrete rupture events from force-distance curves.
Integrated Fluorescence and Mechanical Characterization
For studies correlating mechanical properties with cellular state, robotic FluidFM can be integrated with fluorescence imaging. In cell cycle-dependent adhesion studies, researchers used HeLa Fucci cells expressing fluorescent proteins specific to different cell cycle phases, enabling direct correlation of mechanical adhesion parameters with cell cycle position [55]. This protocol extension involves:
- Genetically engineered cell lines expressing fluorescent reporters (e.g., Fucci system with mCherry for G1 phase and Azami Green for S/G2/M phases)
- Epifluorescence or confocal microscopy integrated with the FluidFM platform
- Image-based cell selection prior to mechanical measurements
- Post-measurement fluorescence verification to ensure maintained reporter expression
This multimodal approach revealed that "colorless cells (the mitotic (M) and early G1 phases)" exhibited the smallest cell area but largest area-normalized maximal adhesion force, demonstrating the power of correlative approaches [55].
The Scientist's Toolkit: Essential Research Reagents and Materials
Successful implementation of robotic FluidFM requires specific reagents and materials optimized for high-throughput mechanical measurements.
Table 3: Essential Research Reagents and Materials for Robotic FluidFM
| Item | Specification | Application in FluidFM |
|---|---|---|
| Fluidic Cantilevers | Hollow SiN; 2-8 µm aperture | Core sensing and manipulation component |
| Cell Culture Substrata | Functionalized glass coverslips; ECM-coated surfaces | Controlled adhesion substrates |
| Physiological Buffers | PBS, HBSS, or cell culture media with HEPES | Maintain cell viability during measurements |
| Pressure Control Fluid | Degassed ultrapure water | Transmit pressure without bubble formation |
| Fluorescent Reporters | Fucci constructs, SNAP-tag mimics | Cell cycle staging and protein tracking |
| Calibration Standards | Rigid substrates (glass, silicon) | Cantilever sensitivity calibration |
| Colloidal Probes | Functionalized microspheres (2-10 µm) | Standardized contact geometry |
| Data Analysis Software | Custom algorithms for parameter extraction | Process force-distance curves |
The development of SNAP-tag mimics of fluorescent proteins (SmFPs) provides particularly valuable tools for FluidFM studies, offering bright, rapidly inducible fluorescence that enables real-time tracking of protein expression, degradation, and trafficking [58]. Unlike traditional fluorescent proteins that require hours to mature, SmFPs achieve fluorescence within minutes, enabling faster correlation of mechanical properties with protein dynamics.
Comparative Analysis with Alternative Technologies
Robotic FluidFM occupies a unique niche in the landscape of single-cell manipulation and characterization technologies, complementing rather than replacing existing methods.
When compared with computer-controlled micropipette (CCMP) techniques that offer "high throughput single-cell adhesion force measurements by repeating the pick-up process with an increasing vacuum," FluidFM provides superior force resolution and quantification [56]. Similarly, while optical tweezers enable non-invasive manipulation and integration with capacitance sensing for real-time monitoring of cellular processes like endocytosis, they lack the direct force control and intracellular access capabilities of FluidFM [59].
The integration of robotic FluidFM with other sensing modalities creates powerful multimodal platforms. For example, combining mechanical measurements with resonant waveguide grating (RWG) biosensors enables correlation of adhesion forces with dynamic mass redistribution in living cells, providing complementary information about signaling events [59]. Similarly, coordination with fluorescence lifetime imaging (FLIM) allows investigation of how mechanical forces applied to the nucleus trigger mechanotransduction pathways dependent on lamin composition [60].
Future Perspectives and Concluding Remarks
Robotic FluidFM technology continues to evolve with several promising directions for advancement. Increased automation through machine learning-based cell selection and adaptive measurement protocols will further enhance throughput and data quality. Integration with multi-omics approaches, particularly single-cell RNA sequencing and proteomics, will enable direct correlation of mechanical phenotypes with molecular signatures.
The application of robotic FluidFM to bacterial adhesion research presents particular opportunities, as the technology can address fundamental questions about host-pathogen interactions, antimicrobial mechanisms, and biofilm formation at single-cell resolution. The capacity to measure "lateral binding forces (LBFs) of endothelial or epithelial cells in a confluent cell monolayer in an appropriate physiological environment" directly translates to studying bacterial adhesion to epithelial barriers [56].
As the field progresses, standardization of protocols and data analysis approaches will be crucial for comparing results across laboratories and building comprehensive databases of cellular mechanical properties. The development of benchmark datasets similar to those established for cytometry data analysis will accelerate method development and validation [61].
In conclusion, robotic FluidFM has transformed single-cell mechanobiology by enabling high-throughput, quantitative measurements of adhesion forces with molecular resolution. Its unique combination of precision force sensing, microfluidic manipulation, and robotic automation provides researchers with an unprecedented tool for investigating cellular mechanics in health and disease. As the technology continues to mature and integrate with complementary modalities, it promises to yield fundamental insights into the mechanical dimensions of cellular life.
Overcoming Experimental Challenges: Optimization Strategies for Reliable SCFS Data
In the field of single-cell force spectroscopy (SCFS) of bacterial adhesion research, the initial and most critical step is the effective and reliable immobilization of bacterial cells to a solid substrate, such as an atomic force microscopy (AFM) cantilever, without altering their native surface properties. The method of immobilization directly influences the quality, reproducibility, and biological relevance of the measured adhesion forces. Within this context, chemical glues and the bioinspired polymer polydopamine have emerged as prominent techniques. This technical guide provides an in-depth comparison of these approaches, detailing their methodologies, performance characteristics, and applications to aid researchers and drug development professionals in selecting the appropriate immobilization strategy for their specific investigative needs.
The following table summarizes the key characteristics of the two primary immobilization techniques discussed in this guide.
Table 1: Comparison of Bacterial Immobilization Techniques for Single-Cell Force Spectroscopy
| Feature | Polydopamine Immobilization | Other Chemical Immobilization (e.g., PLL, Glutaraldehyde) |
|---|---|---|
| Core Principle | Bioinspired, oxidative self-polymerization of dopamine to form a strong, adhesive coating on surfaces [62]. | Relies on electrostatic interactions (PLL) or covalent cross-linking (glutaraldehyde) to bind cells. |
| Immobilization Mechanism | Cells are physically anchored to a polydopamine-coated substrate via the polymer's versatile adhesion properties [32]. | Chemical fixation through charge attraction or irreversible chemical bonds with cell surface molecules. |
| Key Advantage | High immobilization strength; broad applicability across diverse bacterial species; considered minimally invasive for living cells [32]. | Strong, irreversible binding (glutaraldehyde); simple and rapid protocol (PLL). |
| Key Limitation | May not be suitable for all bacterial types (e.g., some Gram-positive cells) [63]. | Can be destructive to live cells and alter native surface properties (e.g., glutaraldehyde) [63]. |
| Impact on Cell Viability | Generally preserves viability, allowing force spectroscopy on living cells [32]. | Varies by method; glutaraldehyde typically kills cells, while PLL may preserve it. |
| Typical Applications | SCFS on probiotic bacteria (e.g., Lactobacillus plantarum) [32]; quantification of specific and non-specific adhesion forces [32]. | General cell fixation; used when extremely strong, irreversible binding is required. |
Detailed Methodologies and Experimental Protocols
Polydopamine-Based Immobilization
The polydopamine immobilization protocol leverages a bioinspired wet adhesive to non-destructively attach single live bacterial cells to cantilevers [32].
Table 2: Key Reagents for Polydopamine Immobilization
| Research Reagent | Function in the Protocol |
|---|---|
| Dopamine Hydrochloride | Monomer precursor for polydopamine polymer formation. |
| Tris-Hydrochloride (Tris-HCl) Buffer | Provides a mildly alkaline environment (pH ~8.5) necessary for the oxidative self-polymerization of dopamine [62]. |
| Colloidal Probe Cantilevers | Cantilevers with a spherical tip that facilitates the pickup of a single bacterial cell and provides a well-defined contact geometry [32]. |
| All-In-One-Tipless Cantilevers | An alternative to colloidal probes; the flat surface is coated with polydopamine for cell attachment [63]. |
Step-by-Step Protocol:
- Cantilever Functionalization: A tipless or colloidal probe cantilever is coated with a thin film of polydopamine. This is achieved by immersing the cantilever in a freshly prepared solution of dopamine hydrochloride (typically 2 mg/mL) in Tris-HCl buffer (10 mM, pH 8.5) for 30-60 minutes [62] [32]. The oxygen dissolved in the solution acts as an oxidant, leading to the spontaneous polymerization of dopamine and the deposition of a dark, adherent polydopamine layer on the cantilever surface.
- Cell Pickup: The polydopamine-coated cantilever is precisely positioned and pressed onto a single bacterial cell deposited on a solid surface (e.g., glass). A controlled setpoint force (e.g., 2 nN) is applied for a defined duration (e.g., 3 minutes) to establish a secure bond between the cell and the adhesive coating [63].
- Validation: The successfully immobilized cell is visually confirmed using an inverted optical microscope integrated with the AFM system. The cantilever is then ready for SCFS measurements.
Conventional Chemical Immobilization
This category includes methods using adhesives like poly-L-lysine (PLL) and cross-linkers like glutaraldehyde. The following diagram illustrates the fundamental difference in workflow between chemical fixation and an advanced physical method, FluidFM.
Poly-L-lysine (PLL) Protocol:
- Cantilever Coating: The cantilever is treated with a dilute solution of PLL, a positively charged polymer, for a brief period (e.g., 15-30 minutes).
- Immobilization: The cationic PLL layer electrostatically interacts with the generally anionic bacterial cell surface, facilitating attachment. While simple, this method may not provide sufficient adhesion strength for robust force spectroscopy measurements with some bacterial strains [63].
Glutaraldehyde Protocol:
- Cantilever Activation: The cantilever is functionalized with an amine-reactive group or simply coated with a polymer like PLL.
- Cross-linking: A low-concentration solution of glutaraldehyde is used. This bifunctional cross-linker forms strong covalent bonds between amino groups on the cantilever coating and those on the bacterial cell surface.
- Considerations: Although glutaraldehyde creates a very stable immobilization, it is typically cytotoxic and fixes the cell in a non-native state, which may interfere with the study of living bacterial interactions [63].
Performance Data and Research Context
Quantitative Performance in SCFS
The effectiveness of an immobilization technique is ultimately judged by its performance in actual SCFS experiments. The table below compiles key quantitative findings from the literature.
Table 3: Performance of Immobilization Techniques in Single-Cell Studies
| Bacterial Species | Immobilization Method | Key Quantitative Finding | Research Context |
|---|---|---|---|
| Lactococcus lactis (Gram+) | FluidFM (Physical) | Successful immobilization and measurement of adhesion forces on glass [63]. | This bacterium was difficult to immobilize reliably using chemical methods, demonstrating FluidFM's advantage for challenging cells [63]. |
| Paracoccus seriniphilus (Gram-) | Polydopamine vs. FluidFM | Adhesion force measurements in liquid (0.9% NaCl) yielded comparable results between both methods [63]. | Validates polydopamine as a reliable method, producing data consistent with a physical immobilization technique. |
| Diverse Leaf Microbiota (26 strains) | Polydopamine on substrate | Measured hydrophobic adhesion forces spanning 3 orders of magnitude (from <1 nN to ~50 nN) [31]. | Polydopamine provided strong enough immobilization to measure a wide range of forces without detaching cells, enabling high-throughput screening. |
| Lactobacillus plantarum (Probiotic) | Polydopamine on colloidal probe | Enabled quantification of specific (lectin-mediated) and non-specific (hydrophobic) adhesion forces [32]. | The "minimally invasive" nature of the protocol allowed for novel insight into the forces driving the adhesion of living probiotic bacteria [32]. |
The Role of Surface Charge in Polydopamine Immobilization
The surface charge of polydopamine, which is highly dependent on the pH of the environment, plays a significant role in its interaction with bacteria. Research using electrochemically deposited polydopamine (e-PDA) has shown it has a point of zero charge (PZC) of approximately 5.37 [64]. This means:
- At a pH < 5.37, the e-PDA surface is positively charged.
- At a pH > 5.37, the e-PDA surface is negatively charged.
This property directly influences bacterial adhesion: studies with Escherichia coli have demonstrated that adhesion at a positively charged polydopamine surface (pH 5) is three times higher than at a negatively charged polymer (pH 7), and biofilm formation is subsequently favored on the positively charged surface [64]. This characteristic must be considered when designing experiments, as it can be tuned to either enhance immobilization or study charge-dependent adhesion phenomena.
The choice between chemical and polydopamine-based immobilization techniques for bacterial SCFS is not a matter of one being universally superior, but rather of selecting the right tool for the specific research question. Polydopamine offers a robust, bioinspired, and largely non-destructive method that has proven effective for a wide range of Gram-negative and some Gram-positive bacteria, making it an excellent default choice for studying living cells. Its tunable surface charge adds another dimension of experimental control. Conventional chemical methods like PLL offer simplicity, while glutaraldehyde provides irreversible fixation at the cost of cell viability. For bacteria that are recalcitrant to chemical immobilization, physical methods like FluidFM present a powerful alternative. By understanding the principles, protocols, and performance metrics outlined in this guide, researchers can make an informed decision that ensures the reliability and biological relevance of their single-cell bacterial adhesion studies.
Optimizing Cantilever Selection and Spring Constant Calibration
In single-cell force spectroscopy (SCFS), the atomic force microscope (AFM) cantilever serves as a precision force sensor, directly determining the accuracy and reliability of adhesion force measurements. This is particularly crucial in bacterial adhesion research, where forces can range from piconewtons to nanonewtons. The cantilever's spring constant (k) is the fundamental parameter converting measured deflection into quantifiable force, following Hooke's Law: F = k × x [65]. Inaccurate spring constant calibration directly propagates error into all subsequent adhesion force data, potentially compromising conclusions about bacterial adhesion mechanisms.
The challenge is pronounced in bacterial SCFS, where experiments often employ specialized cantilevers like hollow FluidFM micropipettes to handle individual cells [66] [65]. The unique geometry of these cantilevers, which often include internal pillars, makes their calibration far from trivial and common simplifying assumptions inapplicable [66]. This guide details the principles and protocols for selecting and calibrating cantilevers to generate accurate, reproducible data in single-cell bacterial adhesion studies.
Cantilever Selection Criteria
Choosing the appropriate cantilever is the first critical step in experimental design. The selection involves a balance between force sensitivity, practical handling, and compatibility with the biological system under investigation.
Table 1: Key Considerations for Cantilever Selection in Bacterial SCFS
| Parameter | Considerations for Bacterial SCFS | Typical Options/Values |
|---|---|---|
| Stiffness (Spring Constant) | Must be sensitive enough to measure weak adhesion forces but stiff enough to detach the cell. | ( 0.01 - 2 \ \text{N/m} ) [67] [65] |
| Geometry | Dictates calibration method and suitability for cell attachment. | Tipless (for colloidal probes or cells) [67], Micropipette (FluidFM) [66] [65], Wedged parallel plate [68] |
| Tip/Aperture | Defines the contact area with the cell or substrate. | Colloidal probe [16], Hollow aperture (2, 4, or 8 µm) [66] [65] |
| Surface Functionalization | Method for attaching the bacterium to the cantilever. | Polydopamine coating [67], Poly-L-lysine (PLL) [68], Glutaraldehyde, specific antibodies |
For studies focusing on unspecific bacterial adhesion, such as the role of hydrophobic interactions, cantilevers functionalized with a single bacterial cell (a "bacterial probe") are standard [67]. Alternatively, colloidal probes—where a microsphere is attached to a tipless cantilever—are valuable for assessing population heterogeneity by measuring multiple cells on a substrate, as they average forces over the entire cell surface [16]. For advanced experiments requiring uniaxial compression or adhesion force measurements without cell sliding, wedged parallel plate probes have been developed [68].
Spring Constant Calibration Methods
Calibrating the spring constant is a prerequisite for quantitative force measurements. The complexity of this process escalates with specialized cantilever designs.
The Sader Method and Its Limitations
The Sader method is a widely implemented calibration technique in many commercial AFMs, including FluidFM systems [66]. It determines the spring constant k based on the cantilever's dynamic properties in a fluid, as shown in:
Equation 1: Sader Method [ k = M{e} \frac{\pi}{4} \rho{\text{f}} b^{2} L Q \Gamma{\text{i}}(\omega{\text{f}}) \omega_{\text{f}}^{2} ] where:
- ( M_{e} ) is the normalized effective mass of the cantilever.
- ( \rho_{\text{f}} ) is the fluid density.
- ( b ), ( L ), and ( h ) are the cantilever's width, length, and thickness.
- ( Q ) is the quality factor of the fundamental resonance.
- ( \omega_{\text{f}} ) is the fundamental resonance frequency in fluid.
- ( \Gamma_{\text{i}} ) is the imaginary part of the hydrodynamic function [66].
However, this method presents significant challenges for hollow FluidFM micropipette cantilevers [66]:
- Q-factor Dependency: The method relies heavily on the precise determination of the
Q-factor, which is highly sensitive to noise and the laser positioning on the cantilever, leading to potential errors of ~20% [66]. - Geometric Incompatibility: The original Sader method and its associated hydrodynamic function (( \Gamma )) and normalized effective mass (( M_{e} )) were derived for solid, rectangular beams. These are not directly applicable to the hollow, internally structured geometry of FluidFM cantilevers [66].
An Improved Method: The Two-Frequency Approach
To overcome these limitations, an alternative calibration method has been developed. This approach eliminates the dependency on the noisy Q-factor and relies only on the measurement of resonance frequencies [66].
Equation 2: Two-Frequency Method (Conceptual) This method uses the following inputs to calculate the spring constant:
- ( \omega_{\text{a}} ): The first resonance frequency measured in air.
- ( \omega_{\text{f}} ): The first resonance frequency measured in a fluid (e.g., water).
- ( b, L ): The geometrical width and length of the cantilever.
- ( \rho_{\text{f}}, \eta ): The density and viscosity of the fluid [66].
The core of this method is the use of a newly determined hydrodynamic function specifically calibrated for hollow FluidFM cantilevers. This function, which accounts for the cantilever's unique geometry, relates the measured frequency shift (( \omega{\text{a}} ) to ( \omega{\text{f}} )) to the added mass effect of the fluid, from which the spring constant can be accurately derived without needing the Q-factor [66]. This results in a more reliable and noise-resistant calibration.
Table 2: Comparison of Spring Constant Calibration Methods
| Feature | Sader Method | Two-Frequency Method |
|---|---|---|
| Key Inputs | Resonance frequency, Q-factor, geometrical dimensions [66] | Resonance frequencies in air and liquid, geometrical dimensions [66] |
| Primary Source of Error | Improper determination of the Q-factor due to noise and laser position [66] | Inaccurate measurement of resonance frequencies |
| Geometric Assumptions | Assumes solid, rectangular beam; inaccurate for hollow cantilevers [66] | Uses a hydrodynamic function experimentally determined for hollow FluidFM cantilevers [66] |
| Reported Accuracy | ~20% error for FluidFM micropipettes [66] | Improved accuracy; demonstrated as a more reliable alternative [66] |
Figure 1: A workflow for selecting the appropriate spring constant calibration method based on cantilever type.
Integrated Experimental Protocol for Bacterial SCFS
The following protocol integrates cantilever calibration into a complete workflow for measuring bacterial adhesion forces, drawing from established methods in the field [16] [67] [65].
Preparation of Bacterial AFM Probes
- Cantilever Functionalization: Clean a tipless cantilever (e.g., nominal
k= 0.03 - 2 N/m) using an air plasma. Immerse it vertically in a solution of dopamine hydrochloride (4 mg/mL in 10 mM TRIS buffer, pH 7.9) for 50 minutes at 4°C. Rinse thoroughly with deionized water and dry under laminar flow [67]. - Spring Constant Calibration: Mount the functionalized cantilever in the AFM holder. In liquid, use the thermal tune method to find its resonance frequency and
Q-factor. For hollow FluidFM cantilevers, prefer the two-frequency method (measuring resonance in both air and liquid) to calibrate the spring constant and avoid the inaccuracies of the Sader method [66] [67]. - Cell Attachment: Under an optical microscope, use a micromanipulator to carefully lower the functionalized cantilever onto a single, isolated bacterium from a diluted suspension. Gently tap the cantilever onto the cell and retract it. The polydopamine coating provides a strong, non-specific adhesive layer that immobilizes the bacterium [67]. Ensure the bacterium is attached near the very end of the cantilever for optimal force measurement.
Single-Cell Force Spectroscopy Measurement
- Approach: Position the bacterial probe above the target substrate (e.g., another cell, a functionalized surface, or an abiotic surface like hydrophobic OTS silicon). Approach the surface at a controlled speed (e.g., 1 µm/s) until contact is detected via cantilever deflection [65].
- Contact: Maintain a constant contact force (e.g., 250 pN) for a defined period (seconds to minutes) to allow for bond formation. In FluidFM, a slight negative pressure can be applied to secure the cell during contact [65].
- Retraction: Retract the cantilever from the surface at a constant speed. The cantilever will bend downwards due to adhesive interactions between the bacterium and the surface. Record the voltage deflection of the photodetector throughout the entire retraction cycle [65].
Data Analysis
- Force-Distance Curve: Convert the raw voltage-deflection data into a force-distance (F-D) curve using the calibrated spring constant (
k) and the inverse optical lever sensitivity (InvOLS). The force is calculated asF = k × InvOLS × V[65]. - Adhesion Force: Identify the maximum rupture force (the lowest point in the retraction curve) as the maximum adhesion force (
F_ad) required to detach the bacterium from the substrate [65]. - Work of Adhesion: Calculate the total work of adhesion by integrating the area under the retraction curve. This represents the total energy dissipated during the detachment process.
The Scientist's Toolkit
Table 3: Essential Research Reagents and Materials for Bacterial SCFS
| Item | Function | Example Usage |
|---|---|---|
| Tipless Cantilevers | Base for creating bacterial or colloidal probes. | MLCT-O cantilevers (Bruker) for bacterial probes [67]. NP-O10-B cantilevers (Bruker) for wedged probes [68]. |
| FluidFM Micropipette Cantilevers | Hollow cantilevers for SCFS with pressure control. | Used with Cytosurge OMNIUM system for high-throughput cell adhesion measurements [66] [65]. |
| Dopamine Hydrochloride | Creates a versatile, adhesive polydopamine coating on cantilevers for cell attachment. | Coating cantilevers for immobilizing S. carnosus cells [67]. |
| Poly-L-Lysine (PLL) | Coats surfaces or cantilevers to promote cell adhesion. | Coating coverslips or wedged AFM probes to immobilize eukaryotic cells like Raji or C2C12 [68]. |
| Ethylenediaminetetraacetic Acid (EDTA) | Chelating agent used to perturb the bacterial outer membrane. | Partial removal of lipopolysaccharide (LPS) from E. coli to study its role in adhesion and heterogeneity [16]. |
| Octadecyltrichlorosilane (OTS) | Creates hydrophobic model surfaces for adhesion studies. | Forming self-assembled monolayers (SAMs) on silicon wafers to test the role of hydrophobic interactions in bacterial adhesion [67]. |
Figure 2: An overview of the key parameters and steps in a single-cell force spectroscopy experiment, from cantilever preparation to data analysis.
The path to reliable and quantitative single-cell force spectroscopy data in bacterial adhesion research is built upon meticulous cantilever selection and precise spring constant calibration. Researchers must move beyond treating calibration as a simple, automated step and recognize it as a critical, experiment-defining procedure. The move towards methods specifically designed for complex cantilever geometries, such as the two-frequency approach for hollow FluidFM micropipettes, is essential for minimizing systematic errors. By integrating these optimized protocols—from choosing the right cantilever and functionalizing its surface, to applying a geometrically appropriate calibration and executing a controlled force measurement—scientists can uncover the subtle, single-cell heterogeneity that governs bacterial adhesion, colonization, and survival. This rigorous foundation in force metrology is what will allow the field to build meaningful and predictive models of bacterial behavior.
In single-cell force spectroscopy (SCFS) of bacterial adhesion, the biomechanical interactions between a bacterium and a surface are not measured directly but are probed by controlling the physical manner in which the two surfaces are separated. The parameters of loading rate, dwell time, and retraction velocity are therefore not merely experimental settings but are fundamental controls that shape the measured mechanical response. They determine the kinetic and thermodynamic landscape of the adhesive interaction, transforming the force-distance curve from a simple measurement into a rich source of biophysical data. In the context of bacterial infections, where the initial adhesion event is often the critical first step in pathogenesis, a precise understanding of these parameters is essential for elucidating mechanisms of virulence and for identifying potential anti-adhesive therapeutic strategies [12].
The following diagram illustrates the core experimental workflow of an SCFS experiment, from bacterial probe preparation to data analysis, highlighting where the three critical parameters exert their influence.
Figure 1: Single-Cell Force Spectroscopy Workflow. This diagram outlines the key steps in a typical SCFS experiment, highlighting the phases where the critical parameters—dwell time, retraction velocity, and the resulting loading rate—are controlled and applied.
Defining the Critical Parameters
The Role of Loading Rate
The loading rate (pN/s), defined as the rate at which force is applied to a molecular bond, is a cornerstone of dynamic force spectroscopy. It is not typically set directly but is the product of the retraction velocity and the effective spring constant of the system. The loading rate directly probes the energy landscape of receptor-ligand interactions, determining which energy barriers can be overcome during forced dissociation. At high loading rates, bonds appear stronger because the force is applied faster than the natural lifetime of the bond, while low loading rates allow for spontaneous dissociation under lower forces, revealing the intrinsic bond kinetics [69].
Crucially, the IsdB-TLR4 interaction in Staphylococcus aureus has been shown to sustain forces up to 2000 pN at a loading rate of 10âµ pN/s, demonstrating an extreme mechanostability that is activated by physical stress [37]. This finding underscores that adhesion strength is not an intrinsic, fixed value but a property that must be interpreted in the context of the applied loading rate.
The Influence of Dwell Time
Dwell time (or contact time) is the duration for which the bacterial cell and the substrate are held in contact under a constant applied force before retraction. This parameter allows for the formation and reorganization of adhesive bonds. Longer dwell times can lead to an increase in the number of bonds, the strengthening of existing bonds through cellular responses, or the secretion of adhesive extracellular material, all of which can significantly increase the measured adhesion force and work.
In studies mapping G protein-coupled receptors (GPCRs), a contact time of 200 ms was used to optimize the probability of a single, specific interaction between the functionalized AFM tip and the receptor on the living cell surface [70]. This demonstrates how dwell time is carefully tuned to balance specificity with the biological reality of bond formation.
Controlling Retraction Velocity
Retraction velocity (µm/s or nm/s) is the direct experimental control that, combined with the system's spring constant, primarily governs the loading rate. It determines the timescale on which the bond is loaded and the force on the bond increases. In bacterial SCFS, the choice of retraction velocity can determine whether single-molecule or multi-bond interactions are probed. Lower velocities may allow for the observation of individual bond failures, while higher velocities may probe the collective strength of multiple bonds or the mechanostability of complex polymeric structures.
AFM-based SMFS studies often use rapid stretching protocols, with retraction velocities ranging from 50 nm/s to 5000 nm/s, to circumvent instrument limitations and study non-equilibrium unfolding [69]. The velocity must be chosen based on whether the goal is to observe near-equilibrium behavior or the response to high-speed mechanical stress.
Table 1: Key Parameters and Their Quantitative Ranges in Bacterial SCFS Studies
| Parameter | Typical Range in Literature | Biological/Technical Impact | Exemplary Study Findings |
|---|---|---|---|
| Loading Rate | ( 10^4 - 10^5 ) pN/s [37] | Determines the apparent strength of bonds; probes energy landscape. | IsdB-TLR4 bond sustains ~2000 pN at ( 10^5 ) pN/s [37]. |
| Dwell Time | 200 ms [70] | Allows for specific bond formation; can trigger cellular responses. | Optimized for single-molecule GPCR interaction probability [70]. |
| Retraction Velocity | 50 - 5000 nm/s [69] | Governs loading rate; influences observation of single vs. multi-bond events. | Used in dynamic force spectroscopy to study protein unfolding [69]. |
Experimental Protocols for Parameter Control
Protocol 1: Quantifying Strong, Stress-Activated Bacterial Adhesion
This protocol is adapted from studies on the Staphylococcus aureus IsdB-TLR4 interaction, a model for extremely strong, load-bearing bacterial adhesion [37].
Bacterial Probe Preparation:
- Culture SH1000 Δspa S. aureus in an iron-poor medium (e.g., RPMI) to induce expression of the IsdB adhesin.
- Attach a single, live bacterium to a tipless AFM cantilever using a non-invasive chemical glue (e.g., Poly-L-lysine or a thin layer of polydopamine).
Substrate Functionalization:
- Immobilize recombinant human TLR4 extracellular domain on a clean, solid substrate (e.g., glass or mica). A gold-coated surface can be used with a self-assembled monolayer (SAM) for oriented protein immobilization.
AFM Force Spectroscopy:
- Approach: Bring the bacterial probe towards the TLR4-coated surface at a velocity of 500-1000 nm/s.
- Contact & Dwell: Set a constant applied force of 0.5 nN. Use a dwell time of 200-500 ms to allow for initial bond formation.
- Retraction: Retract the probe at a high, constant velocity (e.g., 1000 nm/s) to achieve a target loading rate on the order of 10âµ pN/s. This high loading rate is critical for revealing the extreme mechanostability of the IsdB-TLR4 bond.
- Data Collection: Acquire a minimum of 1000 force-distance curves from different locations on the substrate to ensure statistical significance.
Data Analysis:
- Measure the rupture force and rupture length for each adhesive event.
- Construct histograms of rupture forces. The presence of a population of events with forces up to 2000 pN indicates the stress-activated adhesion pathway.
- Confirm specificity by repeating the experiment with an anti-TLR4 blocking antibody or using bacteria grown in iron-rich medium (BHI), which should drastically reduce the frequency of high-force events.
Protocol 2: Assessing Population Heterogeneity in Bacterial Mechanics
This protocol, informed by studies on Escherichia coli, focuses on how adhesion parameters vary across a clonal population, which is crucial for understanding bacterial resilience [16] [40].
Sample Preparation:
- Culture E. coli (e.g., ATCC 25922) to mid-log phase.
- Immobilize bacteria on a gelatin-coated glass slide. Ensure a monolayer of cells to allow probing of individual bacteria.
- (Optional: LPS Perturbation) To test the role of the outer membrane, treat an aliquot of cells with 100 mM EDTA (pH 8.0) for 30 minutes at 37°C to partially remove lipopolysaccharides (LPS) [16] [40].
AFM Force Spectroscopy with a Colloidal Probe:
- Use an AFM cantilever functionalized with a colloidal particle (e.g., a silica or polystyrene microsphere) to measure overall cell adhesion and stiffness, averaging over the cell surface.
- Approach: Approach a single bacterium at 1000 nm/s.
- Contact & Dwell: Apply a low constant force (e.g., 0.25 nN) to avoid cell damage. Use a standardized dwell time of 100 ms.
- Retraction: Retract the probe at a slow, constant velocity (e.g., 500 nm/s) to probe the energy of multiple, weaker interactions.
- Data Collection: Perform measurements on a large number of individual cells (n > 50) from both control and EDTA-treated populations.
Data Analysis:
- For each force curve, extract the maximum adhesion force and the adhesion work (area under the retraction curve).
- Plot the distribution of adhesion forces for the population. A broad distribution indicates significant cell-to-cell heterogeneity.
- Compare the distributions and mean values of control vs. EDTA-treated cells. A narrowing of the distribution and a decrease in mean adhesion after EDTA treatment demonstrates the role of LPS in fostering phenotypic heterogeneity and strengthening adhesion [16] [40].
The Scientist's Toolkit: Essential Reagents and Materials
Table 2: Key Research Reagent Solutions for Bacterial SCFS
| Reagent/Material | Function in SCFS | Exemplary Use Case |
|---|---|---|
| Functionalized AFM Cantilevers | The core mechanical sensor; can be tipless for single-cell probes or have colloidal/collagen probes for larger contact areas. | Grafting with anti-HA antibodies to specifically probe HA-tagged GPCRs on living cells [70]. |
| Poly-L-Lysine or Polydopamine | Non-invasive bio-adhesives for firmly attaching single bacterial cells or proteins to AFM cantilevers. | Immobilizing a single S. aureus bacterium to a tipless cantilever for SCFS [37]. |
| Recombinant Host Receptors (e.g., TLR4) | Coated on substrates to create a defined biological surface for studying specific bacterial adhesion mechanisms. | Studying the direct interaction between IsdB on S. aureus and immobilized human TLR4 [37]. |
| Specific Blocking Antibodies | Used in control experiments to confirm the specificity of measured adhesive interactions. | Anti-TLR4 antibody used to block bonding, validating IsdB-TLR4 interaction specificity [37]. |
| EDTA (Ethylenediaminetetraacetic acid) | A chelating agent used to perturb the outer membrane of Gram-negative bacteria by removing lipopolysaccharides (LPS). | Investigating the role of LPS in mediating heterogeneity of E. coli adhesion and mechanics [16] [40]. |
Data Interpretation and Integration with Broader Research
Interpreting force spectroscopy data requires a deep understanding of how the three critical parameters influence the output. The adhesion force is not a single value but a spectrum that depends on the kinetic conditions of the experiment. The Bell-Evans model is frequently employed to analyze data across a range of loading rates, extracting the zero-force dissociation rate ((k_\text{off})) and the transition state barrier width ((Δx^‡)) [69].
Furthermore, force spectroscopy data must be integrated with other modalities to build a complete biological picture. For instance, the discovery of the stress-activated IsdB-TLR4 bond [37] is profoundly significant when viewed in the context of the host environment—specifically, the high fluid shear stress found in the bloodstream. This suggests the bond is exquisitely adapted to promote strong bacterial adhesion to endothelial cells under these conditions, a key step in the pathogenesis of endocarditis and sepsis. Combining SCFS with single-cell -omics techniques, such as transcriptomics, can further reveal how mechanical adhesion triggers downstream genetic programs that facilitate infection and immune evasion [71].
The following diagram synthesizes how the controlled parameters feed into data analysis and are ultimately connected to biological outcomes through specific signaling pathways.
Figure 2: From Parameters to Biological Insight. This diagram outlines the logical flow from the control of experimental parameters to the interpretation of data via biophysical models and, finally, to the connection with specific biological outcomes and signaling pathways, using the IsdB-TLR4 interaction as a concrete example.
Within the broader thesis on advancing single-cell force spectroscopy (SCFS) for bacterial adhesion research, addressing measurement artifacts is paramount for data fidelity. This technical guide details the core artifacts of hydrodynamic effects and thermal noise, which can significantly obscure the true mechanical and adhesive properties of bacterial cells. These forces are critical in studies investigating phenomena such as lipopolysaccharide (LPS)-mediated adhesion heterogeneity in Escherichia coli or the hydrophobic interactions of Staphylococcus carnosus [16] [72]. Imperfect control of these artifacts compromises the resolution of SCFS, potentially leading to erroneous conclusions about single-cell behavior and population heterogeneity. This document provides researchers and drug development professionals with methodologies to identify, quantify, and mitigate these artifacts, ensuring robust and interpretable force spectroscopy data.
Hydrodynamic Effects
Core Principles and Impact on Force Curves
Hydrodynamic effects manifest as a viscous drag force between the AFM cantilever and the surrounding fluid medium during approach and retraction cycles. This force is non-adhesive and is present even when no contact occurs between the probe and the sample. Its magnitude increases linearly with the velocity of the cantilever motion [73]. In SCFS experiments, which are often conducted in liquid environments to mimic physiological conditions, this effect can produce a significant baseline slope in the force-distance curve, potentially obscuring true, short-range bacterial adhesion forces and leading to an overestimation of the work of adhesion if not properly accounted for [73].
Quantitative Analysis of Drag Forces
The following table summarizes the key parameters influencing hydrodynamic drag and their quantitative impact based on experimental data.
Table 1: Impact of Experimental Parameters on Hydrodynamic Forces in SCFS
| Parameter | Typical Range Tested | Observed Effect on Force Measurement | Recommended Mitigation Strategy |
|---|---|---|---|
| Approach/Retract Speed [73] | 1 - 50 µm/s | Increased force curve slope with higher speed; significantly affects detachment work calculations. | Use slower, consistent speeds (e.g., 1-2.5 µm/s) for precise adhesion measurement; characterize drag at high speeds for correction. |
| Cantilever Geometry | N/A (Tipless, TL1-50 used [73]) | Larger surface area increases drag. | Use tipless cantilevers with a lower nominal spring constant (e.g., 0.03 N/m) to minimize fluid interaction [73]. |
| Medium Viscosity | PBS with Ca²âº/Mg²⺠[73] | Higher viscosity linearly increases drag force. | Account for buffer composition in baseline correction; maintain constant temperature. |
Experimental Protocol for Minimization and Correction
- Baseline Acquisition: For every experiment, acquire force-distance curves with no contact between the bacterial probe and the surface (or a non-adherent region). This records the pure hydrodynamic drag force as a function of piezo displacement.
- Speed Calibration: Systematically test a range of approach and retract speeds (e.g., 1, 2.5, 10, 25, and 50 µm/s) to establish a drag profile for your specific experimental setup [73].
- Data Subtraction: During data processing, subtract the baseline drag curve from the corresponding adhesion force curves acquired at the same speed. Most modern AFM data processing software (e.g., JPK Data Processing software) includes functionalities for such baseline corrections [73].
- Low-Speed Measurement: For critical adhesion measurements, use the slowest practically feasible cantilever speed to minimize the magnitude of the hydrodynamic artifact [73].
Thermal Noise
Origin and Consequences for Measurement Precision
Thermal noise, or Brownian motion, arises from the random collision of fluid molecules with the AFM cantilever. This phenomenon is governed by the Equipartition Theorem, which states that each vibrational mode of the cantilever has an average energy of ( \frac{1}{2}kB T ), where ( kB ) is Boltzmann's constant and ( T ) is the absolute temperature. This noise sets the fundamental limit of force detection in AFM, manifesting as a fluctuation in the cantilever's deflection signal [73]. In SCFS, excessive thermal noise can mask weak, specific adhesion events—such as those mediated by single bacterial adhesins—and reduce the accuracy of elastic modulus calculations derived from the indentation curve.
Parameters Influencing Thermal Fluctuations
Table 2: Parameters Affecting Thermal Noise in SCFS and Mitigation Strategies
| Parameter | Physical Principle | Impact on Thermal Noise | Mitigation Strategy |
|---|---|---|---|
| Cantilever Spring Constant (k) | Equipartition Theorem: ( \frac{1}{2}k\langle x^2 \rangle = \frac{1}{2}k_B T ) | Softer cantilevers (lower k) have larger amplitude fluctuations ( \langle x^2 \rangle ), increasing force noise. | Select a cantilever with an appropriate stiffness for the expected force range; avoid excessively soft levers. |
| Quality Factor (Q) | Damping in fluid | The quality factor decreases dramatically in liquid, broadening the thermal noise peak. | Thermal tuning must be performed in the same fluid as the experiment. |
| Temperature (T) | ( \langle x^2 \rangle \propto T ) | Higher temperature increases noise amplitude. | Maintain a stable temperature during experiments (e.g., 37°C) [73]. |
| Detection System Bandwidth | Power Spectral Density | Integrating over a larger frequency bandwidth captures more noise. | Use appropriate electronic and software filters to limit bandwidth to the signal's frequency content. |
Experimental Protocol for Thermal Noise Management
- Accurate Spring Constant Calibration: Prior to each experiment, perform an in-situ thermal noise calibration of the cantilever in the experimental buffer. This is critical as the spring constant can be affected by the fluid environment. This procedure provides both the exact spring constant and the quality factor of the lever in the relevant medium [73].
- Thermal Tuning: Use the AFM software's thermal tuning function to obtain the power spectral density of the cantilever's fluctuations. Fit the fundamental resonance peak to determine the precise spring constant.
- Signal Filtering: Apply a low-pass digital filter to the force curve data during post-processing. The cutoff frequency should be set high enough to preserve the real signal (which is typically low-frequency for SCFS) while attenuating high-frequency thermal noise.
- Averaging: For measurements on static properties, acquiring and averaging multiple force curves (e.g., over 10 curves per condition [73]) at the same location can help average out random thermal noise.
The Scientist's Toolkit: Essential Research Reagents and Materials
The following table details key reagents and materials used in SCFS of bacterial adhesion, as cited in the literature.
Table 3: Research Reagent Solutions for SCFS of Bacterial Adhesion
| Item Name | Function / Application | Example from Literature |
|---|---|---|
| Ethylenediaminetetraacetic acid (EDTA) | Chelating agent used to partially remove Lipopolysaccharides (LPS) from the outer membrane of Gram-negative bacteria, altering surface properties and heterogeneity [16]. | 100 mM EDTA solution (pH 8.0) used to treat E. coli ATCC 25922, resulting in reduced adhesion forces and cell elasticity [16]. |
| Concanavalin A (ConA) | A lectin protein used to functionalize tipless AFM cantilevers for the stable capture of living cells via glycosylated structures on the cell membrane [73]. | Used to attach Chinese Hamster Ovary (CHO) cells to cantilevers for cell-cell force spectroscopy studies [73]. |
| Poly-D-Lysine (PDL) | A synthetic polymer used to coat substrate surfaces (e.g., Petri dishes, glass) to promote cell adhesion and immobilization for AFM experiments [73]. | Used as a coating for Petri dishes in CHO cell culture to ensure surface adherence [73]. |
| Agarose Spot | Creates a non-adhesive surface patch within a culture dish to facilitate the efficient capture of single cells onto a functionalized cantilever [73]. | A 0.15% w/w agarose solution spot used to isolate individual cells for capture [73]. |
| PBS with Divalent Cations | Standard physiological buffer used during SCFS measurements. Divalent cations (Ca²âº, Mg²âº) are often included as they can be critical for the function of many bacterial adhesins [73]. | SCFS experiments conducted in PBS containing 2.0 mM CaClâ‚‚ and 2.0 mM MgClâ‚‚ at 37°C [73]. |
| Gelatin-Coated Glass | A substrate used for the immobilization of bacterial cells for AFM imaging and force spectroscopy, providing a firm attachment while preserving cell viability [16]. | Used to immobilize E. coli cells on glass surfaces for single-cell analysis [16]. |
Experimental Workflow and Signal Pathway Diagrams
SCFS Experimental Workflow for Bacterial Adhesion
The following diagram outlines the core workflow for conducting a single-cell force spectroscopy experiment on bacterial adhesion, integrating the mitigation strategies for hydrodynamic and thermal artifacts.
Force Curve Artifact Identification
This diagram deconstructs a typical force-distance curve, highlighting the regions affected by hydrodynamic drag and thermal noise, and contrasts them with the signal from a true adhesion event.
Ensuring Cell Viability and Functional Integrity During Measurements
In the field of single-cell force spectroscopy (SCFS) of bacterial adhesion, the integrity of cellular structures is not merely a prerequisite for reliable data but the very foundation of biological relevance. Measurements obtained from compromised cells can lead to erroneous conclusions about adhesion forces, mechanical properties, and ultimately, biological function. This technical guide outlines validated methodologies for maintaining bacterial cell viability and functional integrity throughout SCFS procedures, with particular emphasis on the critical role of outer membrane preservation in Gram-negative bacteria. The procedures detailed herein are specifically contextualized for atomic force microscopy (AFM)-based adhesion studies, where nanoscale perturbations can significantly alter phenotypic outcomes. By implementing these protocols, researchers can ensure that their force spectroscopy data accurately reflects native bacterial states rather than experimental artifacts, thereby enhancing the translational value of their findings in drug development and antimicrobial research.
Fundamental Principles of Cell Preservation
Structural Determinants of Bacterial Integrity
The Gram-negative bacterial cell envelope is a structurally complex entity comprising an inner cytoplasmic membrane, a peptidoglycan layer, and an outer membrane containing lipopolysaccharides (LPS). This tripartite structure confers mechanical stability while maintaining selective permeability. Recent single-cell analyses have revealed that the structural and chemical diversity of the outer membrane, primarily conferred by LPS, is a key determinant of phenotypic heterogeneity in bacterial populations [16]. The viscoelastic outer membrane and its connection to the peptidoglycan via Braun's lipoprotein collectively determine cellular stiffness and mechanical strength [16]. When bacterial cells contact surfaces during force spectroscopy measurements, they experience adhesion forces that induce mechanical stress and minor deformation of the cell envelope [16]. Understanding these structural relationships is essential for implementing appropriate preservation strategies during mechanical interrogation.
Critical Parameters Affecting Viability During Force Spectroscopy
Mechanical Stress Management: AFM cantilever interactions impose localized stresses that can disrupt membrane integrity if improperly calibrated. Maximum adhesion force measurements must be balanced against potential membrane damage, particularly when studying delicate mutant strains or antibiotic-treated cells.
Chemical Environment Control: Buffer composition, ion concentration, pH stability, and osmotic pressure must be meticulously maintained to preserve native membrane structures and cellular turgor. Even minor deviations can alter LPS organization and consequently affect adhesion measurements.
Temporal Considerations: Extended measurement sessions risk physiological changes including metabolic degradation, surface molecule redistribution, and division-related alterations. Data collection windows should be optimized to capture representative cellular states without significant temporal drift.
Substrate Interactions: The immobilization strategy must secure cells sufficiently for reproducible force measurements while avoiding disruptive interactions that compromise membrane integrity or artificially alter surface properties.
Experimental Protocols for Viability Assurance
Bacterial Immobilization Protocol
Proper bacterial immobilization is critical for reliable single-cell force spectroscopy while maintaining viability. The following protocol has been specifically optimized for Gram-negative bacteria including E. coli:
Culture Preparation: Grow Escherichia coli ATCC 25922 in Luria-Bertani (LB) broth for 24 hours at 37°C with shaking at 150 rpm [16].
Cell Harvesting: Centrifuge bacterial culture at 2151 × g for 5 minutes at 24°C and wash cell pellets twice with Milli-Q water to remove media components [16].
Surface Activation: Prepare gelatin-coated glass surfaces by treating clean glass slides with 0.1% gelatin solution and allowing them to air dry under sterile conditions.
Cell Deposition: Adjust bacterial suspension to 10^6 CFU/ml and deposit on gelatin-coated slides for 30 minutes to allow attachment [16].
Viability Verification: Following immobilization, verify cell integrity through AFM imaging in liquid to confirm normal cylindrical morphology without visible pores or structural ruptures [16]. The presence of dividing cells further supports maintained viability.
This immobilization approach preserves cellular integrity while providing sufficient adhesion for force spectroscopy measurements. The gelatin coating presents a biocompatible surface that minimizes disruptive chemical interactions while firmly anchoring cells.
LPS Preservation Methodology
Lipopolysaccharides (LPS) are critical components of the Gram-negative outer membrane that significantly influence adhesion properties and mechanical behavior. Their preservation is essential for maintaining native cell surface characteristics:
Chelator Avoidance: Ethylenediaminetetraacetic acid (EDTA) and other chelating agents should be excluded from buffers as they cause substantial LPS removal, leading to smoother, featureless cell surfaces with diminished adhesion forces and cell elasticity [16].
Divalent Cation Maintenance: Calcium and magnesium ions are essential for LPS stability. Include 1-5 mM concentrations of MgClâ‚‚ or CaClâ‚‚ in measurement buffers to preserve outer membrane organization.
Osmotic Balance: Maintain appropriate osmotic pressure using sucrose or NaCl to prevent membrane stress that can disrupt LPS organization and connection to underlying layers.
Mechanical Verification: Post-measurement, verify LPS integrity through adhesion mapping and stiffness measurements, as EDTA-induced disorganization not only diminishes adhesion forces and cell elasticity but also markedly reduces structural diversity of the cell envelope [16].
Viability Assessment Protocol
Rigorous viability assessment throughout the experimental timeline is essential for data validation:
Morphological Integrity Check: Perform AFM imaging before and after force measurements to confirm maintenance of normal cylindrical shape without visible pores or structural ruptures [16].
Division Capacity Verification: Monitor for the presence of dividing cells following measurements as evidence of preserved viability [16].
Membrane Integrity Assay: Combine with fluorescence-based viability staining (e.g., propidium iodide exclusion) when possible to correlate mechanical measurements with membrane integrity.
Adhesion Profile Monitoring: Track changes in adhesion forces over repeated measurements as significant alterations may indicate progressive membrane compromise.
Table 1: Critical Control Parameters for Bacterial Viability During SCFS
| Parameter | Optimal Range | Monitoring Method | Impact on Viability |
|---|---|---|---|
| Temperature | 24-37°C (species-dependent) | Calibrated stage heater | Metabolic rate preservation |
| Buffer Osmolarity | 300-400 mOsm | Osmometer | Membrane turgor maintenance |
| pH Stability | 7.0-7.4 | pH indicator in buffer | Enzyme function preservation |
| Immobilization Strength | 0.5-2 nN adhesion | Force curve analysis | Balance between fixation and membrane stress |
| Measurement Duration | <4 hours per sample | Timed experimental blocks | Prevention of physiological drift |
| Cantilever Load | 0.5-1 nN | Photodetector calibration | Membrane integrity preservation |
Quantitative Assessment of Cellular Properties
Mechanical and Adhesion Parameters
The relationship between outer membrane integrity and measurable biophysical properties provides critical indicators of functional preservation during force spectroscopy experiments. The following quantitative data represent baseline expectations for E. coli ATCC 25922 with preserved LPS structures:
Table 2: Biophysical Properties of E. coli with Intact versus Compromised LPS
| Parameter | LPS-Intact Cells | EDTA-Treated Cells | Measurement Technique |
|---|---|---|---|
| Adhesion Force | Highly variable (heterogeneous) | Substantially diminished | AFM force spectroscopy with colloidal probes |
| Cell Elasticity (Young's Modulus) | Includes stiff subpopulations | Reduced elasticity | AFM indentation measurements |
| Surface Roughness | Varied topography | Smoother, featureless | AFM topographic imaging |
| Population Heterogeneity | High cell-to-cell variability | Markedly reduced | Statistical analysis of single-cell data |
| Strongly Adherent Phenotype | Present | Absent | Adhesion force distribution analysis |
The data illustrate that partial LPS removal via EDTA treatment homogenizes outer membrane organization, consequently reducing phenotypic heterogeneity within bacterial populations [16]. This manifests as the disappearance of strongly adherent and stiff cellular subpopulations, fundamentally altering the population's biophysical characteristics.
Temporal Stability Metrics
Maintaining consistent mechanical properties throughout measurement sessions indicates preserved viability:
Adhesion Force Stability: Variations of less than 15% over 60 minutes of repeated measurements suggest maintained surface integrity.
Elasticity Consistency: Young's modulus fluctuations under 20% indicate stable turgor pressure and envelope integrity.
Morphological Steadiness: Maintenance of characteristic cell dimensions and aspect ratios throughout experiments confirms structural preservation.
Research Reagent Solutions
The following reagents and materials are essential for maintaining bacterial viability during single-cell force spectroscopy studies:
Table 3: Essential Research Reagents for Bacterial Viability Maintenance
| Reagent/Material | Function | Viability Consideration |
|---|---|---|
| Gelatin-coated substrates | Cell immobilization | Biocompatible surface that minimizes chemical stress |
| LB Broth & Agar | Bacterial culture | Standardized growth conditions for reproducible physiology |
| Phosphate Buffer (0.01 M, pH 7.0) | Measurement environment | Physiological pH maintenance |
| MgClâ‚‚/CaClâ‚‚ supplements | Divalent cation source | LPS stabilization and membrane integrity |
| Milli-Q Water | Washing medium | Removal of contaminants without introducing ions |
| EDTA solution (100 mM, pH 8.0) | LPS disruption control | Experimental modifier for comparative studies |
Experimental Workflow Visualization
The following diagram illustrates the complete experimental workflow for ensuring cell viability during single-cell force spectroscopy measurements:
Quality Assurance and Validation Framework
Pre-measurement Validation Checks
Implementing rigorous quality control measures before force spectroscopy measurements ensures consistent results and maintained viability:
Morphological Baseline: Acquire topographic images of multiple cells to establish normal morphological characteristics before adhesion measurements. Cells should exhibit characteristic rod-shaped architecture without surface abnormalities.
Immobilization Strength Test: Perform preliminary force curves to verify secure attachment without excessive loading forces that could compromise membrane integrity.
Buffer Compatibility: Confirm that measurement buffers maintain pH and osmolarity within specified ranges throughout experimental duration.
Control Measurements: Include reference measurements on well-characterized surfaces or cells to validate instrument calibration and performance.
Continuous Monitoring Protocols
Viability assessment must continue throughout the experimental timeframe:
Adhesion Profile Consistency: Monitor for sudden changes in adhesion forces that may indicate membrane compromise or structural failure.
Elasticity Stability: Track Young's modulus values across multiple cells and over time to detect systemic changes suggesting physiological alteration.
Population Heterogeneity: Maintain expected heterogeneity profiles, as reduced variation may indicate selective measurement of only the most robust cells rather than a representative population.
The preservation of cell viability and functional integrity during single-cell force spectroscopy measurements demands meticulous attention to structural preservation, chemical environment, and mechanical stress management. By implementing the protocols and validation frameworks outlined in this technical guide, researchers can ensure that their adhesion force measurements accurately reflect native bacterial properties rather than experimental artifacts. This rigorous approach to viability maintenance is particularly crucial in the context of antimicrobial development and bacterial pathogenesis research, where subtle changes in surface properties can have significant functional implications. The methodologies presented herein provide a foundation for reliable, reproducible single-cell bacterial characterization that maintains biological relevance throughout mechanical interrogation.
Statistical Considerations and Data Reproducibility in Single-Cell Experiments
Within the context of single-cell force spectroscopy (SCFS) of bacterial adhesion research, statistical rigor and data reproducibility are not merely best practices but fundamental necessities. The investigation of bacterial adhesion at the single-cell level reveals profound heterogeneity that population-averaged measurements inevitably mask. As evidenced in recent studies of lipopolysaccharide (LPS)-mediated adhesion in Escherichia coli, even clonal bacterial populations exhibit significant cell-to-cell variability in biophysical properties, creating subpopulations with distinct adhesive phenotypes [16]. This inherent biological variability necessitates specialized statistical approaches to distinguish true phenotypic differences from experimental noise and to ensure that conclusions are both biologically meaningful and reproducible.
The application of SCFS, primarily through atomic force microscopy (AFM), has revolutionized our understanding of the initial attachment of plant growth-promoting rhizobacteria (PGPR) to root surfaces, uncovering distinct attachment strategies employed by different bacterial strains [23]. These single-cell measurements have revealed that adhesion forces are strongly influenced by the structural and chemical diversity of bacterial cell envelopes and can vary significantly along different root zones. Such findings highlight why single-cell techniques are indispensable: they capture the diversity that would be averaged out in bulk measurements. However, this increased resolution comes with increased responsibility in data interpretation. This technical guide outlines the statistical frameworks and experimental protocols essential for ensuring the validity and reproducibility of single-cell experiments in bacterial adhesion research, with direct implications for drug development, antimicrobial strategies, and biofertilizer design.
Statistical Foundations for Single-Cell Data
Data Distribution Characteristics and Appropriate Statistical Tests
A critical first step in analyzing single-cell adhesion data is identifying the underlying distribution of the dataset. Adhesion force measurements in SCFS experiments often do not follow a normal (Gaussian) distribution. For instance, in studies of Bacillus velezensis and Pseudomonas defensor adhesion to Arabidopsis thaliana roots, adhesion forces across all root zones were highly skewed, with approximately 40-60% of forces below 100 pN and the remainder tapering off toward higher values [23]. A distribution test confirmed that a lognormal distribution best described the data [23].
- Lognormal Distribution: When data follows a lognormal distribution, the natural logarithm of the data values follows a normal distribution. This distribution is characterized by a geometric mean (μ, equivalent to the median for lognormal data) and a geometric standard deviation (σ). In this framework, the range μ* ×/÷ σ* encompasses 68.3% of the data, analogous to the mean ± standard deviation (μ ± σ) in a normally distributed dataset [23].
- Statistical Testing: To determine if differences across experimental conditions (e.g., different root zones or bacterial strains) are statistically significant, data must often be transformed to meet the assumptions of parametric tests. For lognormally distributed adhesion forces, a logarithmic transformation (e.g., Log(adhesion force)) generates normally distributed data, which can then be analyzed using standard methods like ANOVA followed by post-hoc tests [23].
- Heterogeneity Quantification: Simply reporting the mean and standard deviation is insufficient. A more comprehensive approach involves calculating a heterogeneity index from single-cell data to quantitatively describe the variability within a clonal population. This is particularly important when studying the effect of treatments, such as LPS removal via EDTA, which has been shown to markedly reduce cell-to-cell heterogeneity by homogenizing the outer membrane organization [16].
Table 1: Key Statistical Parameters for Single-Cell Adhesion Force Data
| Statistical Parameter | Description | Application Example | Considerations |
|---|---|---|---|
| Geometric Mean (μ*) | The median of a lognormal distribution; central tendency measure for skewed data. | B. velezensis adhesion force in root elongation zone: 95.6 ×/÷ 2.4 pN [23]. | More robust than arithmetic mean for data with high outliers. |
| Geometric Standard Deviation (σ*) | Multiplicative factor describing the spread of a lognormal distribution. | The range 95.6 ×/÷ 2.4 pN contains ~68% of adhesion forces [23]. | Describes the fold-change spread of the data. |
| Heterogeneity Index | A quantitative measure of cell-to-cell variability within a population. | LPS removal in E. coli reduced the diversity of adhesive phenotypes [16]. | Essential for identifying subpopulations and treatment effects. |
| Logarithmic Transformation | Converts lognormal data to a normal distribution for parametric statistical testing. | Used to compare adhesion forces across root zones with ANOVA [23]. | Ensures validity of p-values from standard tests. |
Experimental Design and Sample Size Considerations
Robust single-cell experiments require careful planning to ensure that the collected data is representative and statistically powerful.
- Cell Selection and Avoidance of Selection Bias: A common pitfall in single-cell studies is the analysis of only a small number of cells (typically 3 to 10), which severely limits the ability to detect true population-level heterogeneity [16]. Data collected from all cells are often analyzed collectively, masking the contributions of individual cells and potential outlier subpopulations. To mitigate this, researchers should aim for a larger sample size (n) of individual cells measured, reported clearly as the number of cells, not the number of force curves.
- Biological and Technical Replicates: It is crucial to distinguish between technical replicates (multiple measurements on the same cell) and biological replicates (measurements on different cells from independent cultures). Conclusions about population heterogeneity require data from multiple biological replicates grown and prepared independently. Studies have shown significant variability in adhesion forces among individual cells from the same culture, and even more between different cultures [16].
- Reporting Standards: For full reproducibility, publications should explicitly state the number of biological replicates, the number of cells measured per replicate, the total number of adhesion events analyzed, and the criteria for data inclusion or exclusion.
Experimental Protocols for Reproducible SCFS
Single-Cell Force Spectroscopy of Bacterial Adhesion
This protocol describes the procedure for quantifying the initial attachment forces between a single bacterial cell and a substrate, such as a plant root or synthetic surface, using AFM.
- Bacterial Immobilization: A single bacterium is attached to a colloidal probe (e.g., a silica bead) mounted on an AFM cantilever. The bead is typically coated with a positively charged polymer like polyethyleneimine (PEI) to facilitate electrostatic attachment of the cell. The viability and correct positioning of the bacterium should be confirmed via fluorescence microscopy [23].
- Substrate Preparation: The target substrate (e.g., a root segment) is immobilized on a solid support. For root zone-specific studies, the cell division, elongation, and maturation zones are visually identified based on cell density [23].
- Force Curve Acquisition: The immobilized bacterium is brought into contact with the substrate with a defined indentation force (e.g., 500 pN) and for a brief contact time (e.g., ~100 ms) to mimic initial reversible attachment. The cantilever is then retracted, and the force-distance curve is recorded.
- Data Collection Cycle: This approach-retract cycle is repeated hundreds of times across different locations on the substrate to build a statistically robust dataset.
- Curve Analysis: Retraction curves are categorized as either 'with specific interaction' or 'with non-interaction' (the latter includes no interaction and nonspecific hydrophobic/hydrophilic interactions) [23]. Specific adhesion events, often exhibiting characteristic polymer stretching patterns, are fitted with a mechanical model like the Worm-Like Chain (WLC) model to quantify adhesion forces and polymer lengths [23].
SCFS Experimental Workflow for Bacterial Adhesion
Assessing the Role of Surface Molecules via Chemical Perturbation
This protocol is designed to evaluate the contribution of specific surface molecules, such as Lipopolysaccharides (LPS), to bacterial adhesion and mechanics.
- Control Group Preparation: Bacterial cells (e.g., E. coli) are cultured under standard conditions. Cells are centrifuged, washed, and resuspended in an appropriate buffer (e.g., 0.01 M phosphate buffer, pH 7.0) [16].
- Treatment Group Preparation: An aliquot of the bacterial culture is treated with a chemical agent to perturb the surface structure. For LPS removal, cells are resuspended in a solution of Ethylenediaminetetraacetic acid (EDTA) (e.g., 100 mM, pH 8.0) and incubated at 37°C with gentle shaking [16].
- Post-Treatment Processing: Treated cells are centrifuged, washed twice to remove the EDTA and released LPS, and resuspended in buffer for analysis.
- Viability and Integrity Check: AFM imaging is performed to verify that the treatment did not cause visible membrane rupture or lysis, ensuring that observed effects are due to surface alteration and not loss of viability [16].
- Parallel AFM Measurement: Both control and treated cells are immobilized on gelatin-coated glass surfaces and subjected to SCFS using a colloidal probe, as described in Protocol 3.1. This measures adhesion force and cell elasticity.
- Population-Level Assays: Complement single-cell data with bacterial adhesion or aggregation assays in a well-plate format to correlate single-cell biophysical properties with population-level behavior [16].
The Scientist's Toolkit: Essential Research Reagents and Materials
Table 2: Key Reagent Solutions for Single-Cell Bacterial Adhesion Studies
| Reagent / Material | Function / Purpose | Example Usage in Protocol |
|---|---|---|
| Polyethyleneimine (PEI) | A polycationic polymer used to coat AFM probes, enabling electrostatic immobilization of negatively charged bacterial cells [23]. | Coating of colloidal silica beads for single-bacterium attachment in SCFS [23]. |
| Ethylenediaminetetraacetic Acid (EDTA) | A chelating agent that sequesters divalent cations (Mg²âº, Ca²âº), disrupting the outer membrane of Gram-negative bacteria and facilitating partial LPS removal [16]. | Treatment of E. coli suspension (100 mM, 30 min) to study LPS-mediated contributions to adhesion and mechanics [16]. |
| Gelatin-Coated Substrata | A biocompatible surface used to immobilize live bacterial cells for AFM measurements without causing severe deformation or lysis. | Coating of glass slides for immobilization of E. coli cells prior to force spectroscopy with a colloidal probe [16]. |
| Colloidal AFM Probe | A spherical probe (e.g., silica bead) attached to a cantilever, used to measure interactions with the entire bacterial surface rather than a single nanoscale point, providing more representative single-cell data [16]. | Used in place of a sharp tip to measure overall bacterial adhesion forces and cell stiffness. |
| Worm-Like Chain (WLC) Model | A model of polymer elasticity used to analyze force-extension curves, allowing quantification of adhesion forces and the unfolding of polymeric structures on the cell surface [23]. | Fitting retraction force curves to quantify the strength of initial bacterial attachment mediated by long polymeric structures [23]. |
The path to reliable and reproducible conclusions in single-cell bacterial adhesion research is paved with rigorous statistical treatment and meticulously designed experimental protocols. Embracing the non-normal, lognormal nature of adhesion force data, proactively planning for adequate sample sizes to capture true biological heterogeneity, and employing controlled perturbation studies are all critical components of this framework. The methodologies outlined herein—from data transformation and heterogeneity indices to detailed SCFS and chemical perturbation protocols—provide a roadmap for researchers to navigate the complexities of single-cell data. By adhering to these principles, scientists can unlock the full potential of single-cell force spectroscopy, generating insights into bacterial adhesion that are not only profound but also robust, comparable, and reproducible, thereby accelerating progress in antimicrobial development, biofertilizer design, and beyond.
Technique Validation and Comparative Analysis: Establishing SCFS as a Gold Standard
In the field of bacterial adhesion research, understanding the biophysical forces at the single-cell level is crucial for elucidating mechanisms of pathogenesis, biofilm formation, and environmental adaptation. Single-cell force spectroscopy (SCFS) has emerged as a powerful quantitative platform for analyzing cell-to-cell heterogeneity and measuring interaction forces with piconewton sensitivity [16]. The presence of adhesion phenomena across cell biology, mechanobiology, and biomedical engineering has driven the development of sophisticated tools to quantify these forces from the nano- to microscale [74]. Among these techniques, atomic force microscopy (AFM)-based SCFS, optical tweezers, and micropipette aspiration have become cornerstone methodologies, each offering unique capabilities and limitations. This review provides a comprehensive technical comparison of these three principal techniques within the specific context of bacterial adhesion research, offering detailed experimental protocols and performance metrics to guide researchers in selecting appropriate methodologies for their investigative needs.
Technical Principles and Instrumentation
Single-Cell Force Spectroscopy (SCFS)
SCFS describes methods that measure interactions and forces between molecules, cells, or particles by quantifying the behavior of a molecule when exposed to stretching or torsional forces [74]. In standard AFM-based SCFS, one end of a molecule is bound to a surface and the other to a force sensor, with displacement measurements used to determine forces [74]. At the cellular scale, AFM has gained popularity for SCFS due to its high measuring resolution and broad range of detectable forces [74]. AFM-based techniques encompass several approaches:
- Direct force spectroscopy with standard cantilever: The cell analyzed either adheres to a surface and is approached by a standard cantilever, or is attached directly onto the cantilever to probe surfaces or other cells [74].
- Colloidal probe force spectroscopy: A colloidal particle is glued to a tipless cantilever, which is then approached to a cell seated on a surface, providing higher force sensitivity due to broader surface contact [74].
- FluidFM probe force spectroscopy: This technology reversibly immobilizes live cells onto the cantilever by applying and maintaining adequate negative pressure through a fluidic channel, enabling gentle physical immobilization without chemical treatment [74].
The FluidFM technology has significantly advanced SCFS by enabling high-throughput measurements of up to 200 cells per day using semi-automated workflows, accommodating various cell types including mammalian cells and microbes, and providing broad force measurement from pN to µN [74].
Optical Tweezers
Optical tweezers utilize highly focused laser beams to generate gradient forces that trap and manipulate microscopic dielectric particles, including polystyrene beads and biological cells [75] [76]. In typical configurations for cellular mechanics, a laser beam is expanded and focused through a high-numerical aperture objective (NA = 1.4) to form a Gaussian trap that can capture particles [75]. Recent advancements have employed metallic semi-continuous films (SCFs) as transformative platforms for on-chip optical manipulation, where sub-12-nm nanogaps within percolated gold networks concentrate electromagnetic fields via coupled gap-plasmon modes, intensifying optical gradient forces while mitigating thermal instability through interconnected pathways that dissipate localized heating [75].
The trapping stiffness (k) is derived from the power spectral density of displacement fluctuations of the trapped particle, typically calibrated using viscous drag in solutions with known viscosity under fixed laser power [75]. Enhanced platforms have demonstrated peak stiffness of 0.0955 ± 8.0 × 10â»â´ pN/µm, representing significant enhancements over nanoparticle and continuous film substrates [75].
Micropipette Aspiration
Micropipette aspiration techniques measure cellular mechanical properties by applying controlled negative pressure to deform cells partially drawn into a micropipette [77] [78]. The micropipette force sensor (MFS) technique employs the deflection of a glass micropipette to measure and apply force (F = kâ‚šx, where kâ‚š is the spring constant of the cantilever) [78]. This approach has been extensively used to probe biomechanical properties of single cells, microbial flocs, and whole organisms [78].
Recent mesoscopic simulations using dissipative particle dynamics (DPD) have modeled the full process of micropipette aspiration, accounting for subcellular components including membrane/cytoskeleton interactions and the interplay between the liquid environment, the cell, and the solid micropipette wall [77]. DPD serves as a computational bridge between molecular dynamics and continuum-based methods, describing hydrodynamics through conservation of mass and momentum by assigning appropriate forces between non-bonded particles [77].
Comparative Performance Analysis
Table 1: Technical specifications and performance metrics of single-cell force measurement techniques
| Parameter | SCFS (AFM-based) | Optical Tweezers | Micropipette Aspiration |
|---|---|---|---|
| Force Range | pN to µN [74] | 0–300 pN [79] | 0–700 Pa [79] |
| Force Resolution | High (pN) [74] | ~5 pN [79] | ~0.1 Pa [79] |
| Displacement Resolution | 1–5 nm [79] | ~1 nm [79] | ~25 nm [79] |
| Throughput | Up to 200 cells/day (FluidFM) [74] | Low to moderate | Low |
| Sample Environment | Native conditions possible [74] | Liquid environment | Liquid environment |
| Key Advantages | Broad force range, multiple configurations | Non-contact, high precision | Direct visualization, established methodology |
| Limitations | Can be low-throughput (traditional AFM) | Thermal effects, limited force range | Surface contact required, lower resolution |
Table 2: Applications in bacterial adhesion research
| Application | SCFS | Optical Tweezers | Micropipette Aspiration |
|---|---|---|---|
| Single bacterium adhesion | Excellent [16] [26] | Good with bead coupling | Moderate |
| Bacterial heterogeneity studies | Excellent [16] | Good | Limited |
| Biofilm formation studies | Good [74] | Limited | Good for aggregates [78] |
| Bacterial response to antibiotics | Good [16] | Possible | Limited |
| Bacterial-surface interaction kinetics | Excellent [26] | Good | Limited |
| Bacterial aggregation | Good | Limited | Excellent [78] |
Experimental Protocols
SCFS for Bacterial Adhesion Measurements
Bacterial Sample Preparation for AFM-based SCFS [16]:
- Culture bacteria (e.g., Escherichia coli ATCC 25922) in appropriate medium (e.g., Luria-Bertani broth) for 24 hours at 37°C with shaking at 150 rpm.
- Centrifuge bacterial culture at 2151 × g for 5 minutes at 24°C.
- Wash cell pellets with Milli-Q water.
- Resuspend cells in appropriate buffer (e.g., 0.01 M phosphate buffer, pH 7.0) for analysis.
- Immobilize bacteria on gelatin-coated glass surfaces by depositing adjusted suspension (10ⶠCFU/ml) on coated slides for 30 minutes.
Force Spectroscopy with Colloidal Probe [16]:
- Use a colloidal particle attached to a tipless cantilever for broader surface contact.
- Approach the cantilever to the bacterial cell seated on the surface at controlled velocity.
- Record force-distance curves during approach and retraction cycles.
- Analyze adhesion forces, detachment distance, and binding energy from retraction curves.
- For population heterogeneity studies, perform measurements on multiple individual cells.
FluidFM SCFS Protocol [74]:
- Reversibly immobilize live cells onto the FluidFM cantilever by applying and maintaining adequate negative pressure.
- Approach the cell-loaded probe to the substrate or other cells of interest.
- Perform approach-retract movements to record force curves.
- Release cell after measurement via short surge of positive pressure.
- Absorb another cell for subsequent measurements, enabling serial quantification.
Optical Tweezers Protocol for Bacterial Mechanics
Sample and Substrate Preparation [75]:
- Prepare 500-nm polystyrene beads or bacterial samples in appropriate buffer.
- Engineer gold film substrates across morphological regimes (discontinuous nanoparticles, semi-continuous films, or continuous films) through controlled sputter deposition.
- Mount substrates on microscope stage for trapping experiments.
Optical Trapping and Measurement [75] [76]:
- Expand and focus a 1064-nm laser beam through a high-NA objective (NA = 1.4) to form a Gaussian trap above the substrate.
- Capture 500-nm PS spheres or bacteria directly in the optical trap.
- Record Brownian motion at 38 Hz via CCD imaging.
- Derive trapping stiffness from power spectral density of displacement fluctuations.
- Calibrate system using viscous drag in glycerol-water solutions (viscosity 1.2 mPa·s, 20°C) under fixed laser power (1.2 mW at sample plane).
Force-Feedback Application [76]:
- Implement force-feedback system to apply constant piconewton-range forces to cells.
- Quantify deformation, cell stiffness, and creep response from single measurement.
- Use drug-induced perturbations of the cytoskeleton to detect changes in cellular mechanical properties.
Micropipette Aspiration of Cellular Aggregates
T-cell Aggregate Stretching Protocol [78]:
- Isolate primary T-cells from mice and activate using PMA and ionomycin or anti-CD3 to induce aggregation.
- Mount buffer solution containing T-cell aggregates between two glass slides in custom holder on inverted microscope.
- Position straight holding micropipette on linear motor and L-shaped, force-calibrated MFS at 90° angle on manual xyz-micromanipulator.
- Hold aggregate with gentle suction using both micropipettes.
- Stretch aggregate by moving straight micropipette at constant speed (20 µm/s), causing deflection in L-shaped micropipette.
- Measure deflection (x) and calculate force (F = kâ‚šx, where kâ‚š is spring constant).
Mechanical Property Calculation [78]:
- Model aggregate as cylinder with initial radius (Râ‚€) and length (Lâ‚€).
- Calculate engineering stress as σ = F/πR₀² = kₚx/πR₀².
- Determine strain as ε = ΔL/L₀, where ΔL is change in length.
- Compute Young's modulus from stress-strain relationship.
Methodology Selection Framework
Diagram 1: Methodology selection framework for bacterial adhesion studies
Research Reagent Solutions
Table 3: Essential research reagents and materials for single-cell mechanics
| Reagent/Material | Application | Function | Technical Considerations |
|---|---|---|---|
| FluidFM Probes | SCFS | Reversible cell immobilization via negative pressure | Enables high-throughput measurements; multiple cell types [74] |
| Colloidal Probes | AFM-based SCFS | Broader surface contact for force measurements | Higher force sensitivity; requires gluing to cantilevers [74] [16] |
| Gold SCF Substrates | Optical Tweezers | Enhanced field concentration for trapping | Sub-12-nm nanogaps improve efficiency; reduces thermal effects [75] |
| Gelatin-coated Surfaces | Bacterial Immobilization | Sample preparation for AFM | Maintains cell viability; appropriate for bacterial adhesion studies [16] |
| Polystyrene Beads | Optical Trapping | Force application and calibration | 500-nm size common; functionalization possible for specific binding [75] [76] |
| Polyacrylamide Gels | Traction Force Microscopy | Tunable stiffness substrates | Stiffness control for mechanotransduction studies [80] |
| EDTA Solution | LPS removal studies | Bacterial outer membrane alteration | Modifies surface properties; 100 mM, pH 8.0 typical [16] |
The comparative analysis of SCFS, optical tweezers, and micropipette aspiration reveals complementary strengths that can be strategically leveraged in bacterial adhesion research. SCFS, particularly AFM-based approaches with FluidFM technology, offers the broadest force range and highest throughput, making it ideal for detailed studies of single-bacterium adhesion and population heterogeneity. Optical tweezers provide exceptional non-contact manipulation capabilities with high precision in the piconewton range, well-suited for controlled force application studies. Micropipette aspiration remains valuable for investigating larger cellular aggregates and tissues where single-cell resolution is less critical. The ongoing development of these technologies, including enhanced substrates for optical trapping and reversible immobilization methods for SCFS, continues to expand their capabilities for elucidating the biophysical mechanisms underlying bacterial adhesion, with significant implications for understanding pathogenesis, antibiotic development, and biofilm control strategies.
Correlating SCFS Data with Fluorescence Microscopy and Flow Cytometry
Scanning Fluorescence Correlation Spectroscopy (SFCS) represents a powerful evolution of traditional FCS, enabling multiple, simultaneous fluorescence correlation measurements across a sample. Unlike conventional FCS, which analyzes fluctuations at a single stationary point, SFCS involves rapidly moving the excitation laser beam in a defined pattern (such as a circular or raster scan) across the region of interest [81]. This approach is particularly valuable for studying dynamic processes in complex biological systems where spatial heterogeneity is significant, such as in single-cell force spectroscopy of bacterial adhesion research. By correlating SFCS data with complementary techniques like fluorescence microscopy and flow cytometry, researchers can obtain a multidimensional understanding of molecular interactions, diffusion characteristics, and binding events at the bacterial-surface interface with unprecedented spatial and temporal resolution.
The fundamental principle underlying SFCS involves analyzing the temporal autocorrelation of fluorescence fluctuations detected at specific points along the scan path. When the scan rate exceeds the diffusion rate of the molecules being studied, this technique generates a "carpet" of timed fluorescence intensity fluctuations that can be analyzed to determine diffusion coefficients, concentrations, and interaction parameters at multiple locations simultaneously [81]. For bacterial adhesion studies, this capability allows researchers to map heterogeneities in molecular binding events across bacterial membranes or at the bacterium-substratum interface, providing critical insights into the mechanisms governing initial bacterial attachment and subsequent biofilm formation.
Theoretical Foundations of SFCS
Core Principles of Fluorescence Correlation Spectroscopy
Fluorescence Correlation Spectroscopy analyzes spontaneous fluorescence intensity fluctuations arising from minute changes in the concentration of fluorescent particles within a defined observation volume. These fluctuations are quantified through a temporal autocorrelation function (ACF), which provides information about diffusion coefficients, concentrations, molecular interactions, and dynamic processes [82]. The ACF is mathematically represented as:
$$G(\tau) = \frac{\langle \delta F(t) \delta F(t+\tau) \rangle}{\langle F(t) \rangle^2}$$
where δF(t) represents the fluorescence fluctuation at time t, τ is the lag time, and the angle brackets denote time averaging [82]. The amplitude of the ACF at τ = 0 is inversely proportional to the average number of particles in the observation volume, while the temporal decay of the ACF characterizes the dynamics of the processes causing the fluctuations.
For three-dimensional diffusion of a single fluorescent species through a Gaussian observation volume, the ACF takes the form:
$$G(\tau) = G(0) \cdot \frac{1}{1 + \frac{4D\tau}{w0^2}} \cdot \frac{1}{\sqrt{1 + \frac{4D\tau}{z0^2}}}$$
where G(0) is the ACF amplitude at Ï„ = 0, D is the diffusion coefficient, wâ‚€ is the lateral radius, and zâ‚€ is the axial radius of the observation volume [82]. In scanning FCS variations, this equation is modified to account for the moving observation volume.
Scanning FCS Modalities
Several scanning FCS modalities have been developed to address different experimental needs:
- Raster Image Correlation Spectroscopy (RICS): Analyzes both spatial and temporal correlations inherent in the raster-scanning pattern of a laser scanning microscope to measure diffusion coefficients and molecular concentrations in solutions and cells [82].
- Segmented FCS: Divides continuously acquired data into short temporal segments, with each segment generating its own ACF. These ACFs can be sorted based on additional parameters (e.g., intensity thresholds) and averaged to produce correlation functions corresponding to different sample regions [82].
- Spinning Disk Confocal FCS: Utilizes a spinning disk confocal microscope with approximately 10,000 pinholes to perform FCS measurements at up to ~10âµ independent locations simultaneously, offering significantly higher speed at high spatial resolution compared to laser scanning microscopy [83].
- Circular Scanning FCS: Directs the excitation laser beam in a uniform circular scan across membranes or interfaces in a repetitive fashion, enabling multiple FCS measurements simultaneously along the scan path [81].
Table 1: Comparison of Scanning FCS Modalities
| Modality | Spatial Resolution | Temporal Resolution | Primary Applications |
|---|---|---|---|
| Segmented FCS | Subcellular | Milliseconds to seconds | Measuring molecular mobility in different subcellular regions [82] |
| RICS | Diffraction-limited | Microseconds to seconds | Mapping diffusion coefficients in cells and solutions [82] |
| Spinning Disk FCS | Pixel-level (128×128) | Up to 1000 Hz | Spatially mapping hindered diffusion in complex media [83] |
| Circular Scanning SFCS | Diffraction-limited | Sub-millisecond | Studying protein-membrane interactions in model membranes [81] |
Experimental Integration and Workflows
Correlative Experimental Setup
Integrating SFCS with fluorescence microscopy and flow cytometry requires careful consideration of instrumentation and experimental design. A typical correlative setup involves a laser scanning confocal microscope equipped with high-sensitivity detectors (such as avalanche photodiodes or hybrid detectors), a high-numerical aperture objective (NA ≥1.2), and precise scanning controls. For bacterial adhesion studies, this system can be combined with a microfluidic flow cell that enables controlled introduction of bacterial suspensions and manipulation of shear forces.
The instrumental workflow begins with sample preparation, where bacteria expressing fluorescent fusion proteins or stained with fluorescent dyes are introduced to functionalized surfaces in the flow cell. Initial characterization using widefield or confocal fluorescence microscopy identifies regions of interest based on bacterial attachment patterns. Subsequently, SFCS measurements are performed at these specific locations to quantify molecular dynamics. Finally, flow cytometry can be employed to analyze population-level characteristics of the bacterial cells, providing complementary data to the single-cell measurements obtained through SFCS and microscopy.
Segmented FCS Acquisition and Processing Protocol
Segmented FCS on a commercial laser scanning microscope follows a detailed acquisition and processing protocol [82]:
Data Acquisition:
- Configure the laser scanning microscope (e.g., Leica SP8) for continuous scanning along a single line or a small region of interest.
- Set appropriate scanning parameters: pixel dwell time (0.1-10 μs), line length (64-512 pixels), and total acquisition time (10-60 seconds).
- Use low laser power (0.1-1 μW at the sample) to minimize photobleaching while maintaining sufficient signal-to-noise ratio.
Data Export and Segmentation:
- Export fluorescence intensity traces along the scan path with corresponding temporal information.
- Divide the continuous dataset into short temporal segments (typically 0.1-5 seconds duration, depending on the dynamics of interest).
- For each segment, calculate the spatial autocorrelation function along the scanning axis: $$Gj(\xi) = \frac{\langle I(k) I(k+\xi) \ranglej}{\langle I(k) \rangle_j^2} - 1$$ where I(k) is the fluorescence intensity at pixel position k, ξ represents the spatial lag in pixels, and the brackets indicate averaging over segment j [82].
Segment Sorting and Selection:
- Apply selection criteria to segments based on intensity thresholds, presence of artifacts, or other quality parameters.
- Sort segments into populations corresponding to different sample regions (e.g., nucleoplasm vs. nucleolus in eukaryotic cells, or different regions of bacterial adhesion).
- Average ACFs within each population to improve signal-to-noise ratio while preserving region-specific dynamic information.
ACF Fitting and Parameter Extraction:
- Fit the averaged ACFs to appropriate diffusion models using non-linear least squares algorithms.
- For Brownian diffusion with a stationary laser spot, use: $$G(\tau) = G(0) \cdot \frac{1}{1 + \frac{4D\tau}{w_0^2}}$$
- Extract diffusion coefficients (D) and particle numbers (N) from the fitted parameters.
Diagram 1: Segmented FCS Data Processing Workflow
Spinning Disk Confocal FCS Protocol
Spinning disk confocal microscopy offers distinct advantages for FCS measurements, particularly for studying hindered diffusion in complex environments relevant to bacterial adhesion research [83]:
System Configuration:
- Utilize a spinning disk confocal microscope with a disk containing approximately 10,000 pinholes and corotating microlenses.
- Select an appropriate camera with high quantum efficiency and frame rates up to 1000 Hz.
- Match the pinhole size to the magnification to achieve optimal sectioning while maintaining sufficient signal.
Data Acquisition:
- Acquire image time series at the maximum practical frame rate for the system.
- For diffusion measurements of proteins in bacterial membranes, typical frame rates of 100-500 Hz are appropriate.
- Ensure adequate sampling by acquiring sufficient frames (typically 10,000-50,000) to achieve good statistics in the correlation analysis.
Pixel Size Correction:
- Account for the pixel size effect encountered with spinning disk confocal FCS, which is not present in standard or scanning FCS.
- Calculate the effective observation volume using correction factors that depend on the ratio wâ‚€/L, where wâ‚€ is the eâ»Â² radius of the illumination and L is the pixel length.
- Apply the appropriate β factor to determine the effective eâ»Â² radius: w_eff = βwâ‚€ [83].
Photobleaching Correction:
- Implement empirical methods to minimize the effect of photobleaching, which can be particularly severe for slowly diffusing fluorescent species in bacterial adhesion zones.
- Use background subtraction or fitting algorithms that account for the gradual loss of signal due to photodamage.
Spatial Mapping of Diffusion Coefficients:
- Calculate the temporal autocorrelation function for each pixel or small region of interest.
- Fit the ACFs to appropriate models for normal or anomalous diffusion.
- Construct spatial maps of diffusion coefficients at pixel resolution (e.g., 128 × 128) to visualize heterogeneity in molecular mobility.
Data Integration and Analysis
Correlative Data Analysis Framework
The integration of SFCS with fluorescence microscopy and flow cytometry generates multidimensional datasets that require a structured analytical framework. This framework should account for the complementary strengths of each technique: fluorescence microscopy provides spatial context, SFCS quantifies molecular dynamics, and flow cytometry offers statistical power through population-level analysis.
For bacterial adhesion studies, begin with fluorescence microscopy images to identify spatial patterns of bacterial attachment and surface coverage. These images guide the placement of SFCS measurement locations, targeting specific regions such as the periphery of bacterial clusters, single-cell attachment points, or bare surface areas. SFCS data acquired at these locations provide quantitative information about molecular diffusion rates, binding constants, and local concentrations of fluorescently tagged molecules (e.g., adhesins, membrane proteins, or signaling molecules).
Flow cytometry data collected from parallel experiments with similar bacterial populations under identical surface conditions offer validation at the population level. By comparing SFCS-derived parameters with flow cytometry measurements of bacterial surface markers or functional assays, researchers can establish correlations between single-molecule dynamics and population-level phenotypes.
Quantitative Parameters from SFCS
SFCS measurements yield several key quantitative parameters that are essential for understanding bacterial adhesion mechanisms:
Diffusion Coefficient (D): Characterizes the mobility of molecules in the bacterial membrane or adhesion interface. Changes in diffusion coefficients can indicate molecular interactions, binding events, or alterations in membrane fluidity.
Anomalous Diffusion Exponent (α): Describes deviations from normal Brownian diffusion, with α < 1 indicating subdiffusion (common in crowded environments like bacterial adhesion zones) and α > 1 indicating superdiffusion [83].
Concentration and Particle Number: Provides information about the local density of molecules, which can reveal clustering or sequestration at adhesion sites.
Binding Fractions and Residence Times: For molecules that alternate between bound and free states, SFCS can quantify the fraction of molecules in each state and their characteristic transition times.
Table 2: Key Parameters from Integrated Techniques in Bacterial Adhesion Research
| Parameter | SFCS Measurement | Fluorescence Microscopy | Flow Cytometry |
|---|---|---|---|
| Molecular Diffusion | Diffusion coefficient (D) from ACF analysis | FRAP, single-particle tracking | Not directly measured |
| Binding Interactions | Changes in D, binding fractions from cross-correlation | Colocalization coefficients, proximity assays | Population-level binding assays |
| Local Concentration | Particle number from ACF amplitude | Intensity quantification | Fluorescence intensity per cell |
| Spatial Distribution | Spatial heterogeneity of parameters | Direct visualization | Not spatially resolved |
| Population Heterogeneity | Limited to measured locations | Field of view statistics | High-throughput single-cell statistics |
Addressing Technical Challenges in Correlative Measurements
Several technical challenges must be addressed when correlating SFCS with fluorescence microscopy and flow cytometry:
Photobleaching Correction: Implement robust algorithms to correct for photobleaching effects, which can artificially distort ACFs, particularly for slowly diffusing species in bacterial adhesion zones. Empirical methods include subtracting an exponential decay function from the intensity trace before correlation analysis [83].
Background Fluorescence: Account for background fluorescence through careful measurement and subtraction, as background signals can significantly affect the amplitude and shape of ACFs, particularly in heterogeneous environments like bacterial biofilms.
Cross-Talk Between Techniques: Ensure that experimental conditions (e.g., dye selection, excitation wavelengths) are compatible across all correlative techniques to prevent interference or artifacts.
Data Registration and Alignment: Develop precise methods for registering SFCS measurement locations with fluorescence microscopy images, particularly when measurements are performed sequentially rather than simultaneously.
Diagram 2: Correlative Data Integration Framework
Research Reagent Solutions
Table 3: Essential Research Reagents for SFCS in Bacterial Adhesion Studies
| Reagent Category | Specific Examples | Function in SFCS Experiments |
|---|---|---|
| Fluorescent Labels | Alexa Fluor 488, GFP, RFP, Cy5 | Tagging of bacterial surface proteins, adhesins, or membrane components for detection in SFCS measurements [82] [81] |
| Model Membranes | Giant Unilamellar Vesicles (GUVs) | Simplified membrane systems for studying protein-membrane interactions using circular scanning SFCS [81] |
| Surface Functionalization | Type I Collagen, Fibronectin, Poly-L-Lysine | Coating of substrates to study bacterial adhesion to specific surface chemistries and structures [83] |
| Fixation Agents | Paraformaldehyde, Glutaraldehyde | Sample stabilization for correlative microscopy, though with potential effects on molecular mobility |
| Oxygen Scavenging Systems | Protocatechuate dioxygenase, Trolox | Reduction of photobleaching and triplet state effects during prolonged SFCS measurements |
| Mounting Media | ProLong Diamond, Mowiol | Sample preservation and refractive index matching for optimal optical performance |
Applications in Bacterial Adhesion Research
The integration of SFCS with fluorescence microscopy and flow cytometry provides unique insights into bacterial adhesion mechanisms across multiple scales:
Molecular-Scale Interactions
At the molecular level, SFCS enables quantification of diffusion dynamics for bacterial adhesins and membrane proteins during surface attachment. For instance, circular scanning SFCS has been used to detect protein incorporation into model membranes by measuring the significant reduction in diffusion coefficient (approximately 200-fold) when antibodies bind to membrane proteins compared to their free diffusion in solution [81]. This approach provides a sensitive method to study protein-membrane interactions even when fluorescence imaging shows marginal contrast enhancement.
In segmented FCS applications, molecular mobility can be compared between different cellular compartments or regions of interest. This capability has been demonstrated in eukaryotic systems where the diffusion coefficient of GFP was measured separately in nucleoplasm (29 ± 4 μm²/s) and nucleolus (9.5 ± 3 μm²/s), revealing the impact of molecular crowding on mobility [82]. Similar approaches can be applied to bacterial systems to compare protein dynamics in different membrane domains or at various stages of adhesion.
Mesoscale Spatial Heterogeneity
Spinning disk confocal FCS enables spatial mapping of diffusion coefficients at high resolution, revealing complex patterns of molecular mobility in heterogeneous environments. This capability is particularly valuable for studying bacterial adhesion in complex matrices such as hydrogels or extracellular polymeric substances. For example, applying spinning disk FCS to fluorescent microspheres diffusing in Type I collagen revealed complex spatially varying diffusion caused by hydrodynamic and steric interactions with the collagen matrix [83].
The spatial heterogeneity observed in these systems often deviates from simple Brownian diffusion, showing characteristics of anomalous diffusion that can be quantified through the anomalous diffusion exponent α. These spatially resolved measurements provide direct insight into how local environmental features—such as polymer density in hydrogels or matrix composition in bacterial biofilms—influence molecular transport and accessibility.
Correlative Insights Across Scales
By combining SFCS with fluorescence microscopy and flow cytometry, researchers can establish connections between molecular dynamics, cellular behavior, and population-level characteristics in bacterial adhesion:
Single-Molecule to Population Correlations: SFCS measurements of adhesion protein dynamics can be correlated with flow cytometry data on bacterial surface composition to understand how molecular mobility influences adhesion strength and specificity.
Spatiotemporal Dynamics of Adhesion Development: Time-lapse fluorescence microscopy captures the overall progression of bacterial attachment and biofilm formation, while SFCS provides snapshots of molecular dynamics at critical stages of this process.
Microenvironmental Influences: The impact of surface chemistry, topography, and mechanical properties on bacterial adhesion can be quantified through SFCS measurements of molecular mobility and clustering, complemented by fluorescence microscopy visualization of attachment patterns and flow cytometry analysis of population responses.
This multiscale, correlative approach enables a comprehensive understanding of bacterial adhesion mechanisms, from the nanoscale dynamics of individual adhesins to the population-level consequences of surface colonization.
Within the broader context of single-cell force spectroscopy (SCFS) research on bacterial adhesion, the generation and analysis of adhesin-deficient mutants represents a cornerstone technique for moving beyond correlation to establish direct causal relationships. SCFS provides exquisitely sensitive, quantitative measurements of the biophysical forces governing bacterial attachment at the single-cell level. However, without genetic manipulation, it is impossible to definitively assign specific adhesive functions to particular surface macromolecules. The construction of isogenic mutant strains, differing only in a single adhesin gene, allows researchers to precisely deconvolute the contribution of individual factors to the overall adhesion process. This guide details the experimental and analytical frameworks for integrating genetic manipulation with SCFS to validate the functional role of bacterial adhesins, providing technical protocols and data interpretation standards for researchers in microbiology, biophysics, and drug development.
The Role of Genetic Mutants in SCFS Adhesion Research
Single-cell force spectroscopy has revolutionized the study of bacterial adhesion by allowing the quantification of force parameters—such as adhesion force, work of adhesion, and rupture events—on a single cell basis. When a bacterium is brought into contact with a surface and then retracted, the resulting force-distance curve encodes rich information about the molecule-surface interaction. Genetic mutants serve as the critical experimental control in these studies; by comparing the force spectra of a wild-type strain to an isogenic mutant lacking a specific adhesin, the specific contribution of that adhesin can be isolated and quantified.
This approach has been successfully applied to a range of pathogenic bacteria. For instance, in Staphylococcus aureus, the construction of knock-out mutants in the srtA, tagO, and dltA genes, which affect cell wall proteins and teichoic acids, has revealed how different surface macromolecules contribute differentially to adhesion on hydrophobic versus hydrophilic surfaces [84]. Similarly, studies with Streptococcus pneumoniae mutants lacking surface adhesins like PspC and PsrP have quantified the role of these proteins in adhesion to lung epithelial cells and collagen [85]. The power of this method lies in its ability to connect a specific genetic alteration to a quantifiable change in a biophysical property, thereby bridging molecular biology and nanomechanics.
Experimental Protocols for Key Adhesin-Deficient Mutant Studies
Generation of Adhesin-Deficient Mutants
The first step is the construction of isogenic mutant strains where the gene encoding the target adhesin is inactivated.
- Gene Inactivation via Insertional Mutagenesis: A common strategy involves disrupting the target gene by inserting an antibiotic resistance cassette. For example, to study fibronectin-binding proteins (FnBPs) in Staphylococcus aureus 8325-4, a tetracycline resistance gene was inserted into the fnbA gene and an erythromycin resistance gene into the fnbB gene to create single mutants. A double fnbA fnbB mutant was also constructed through sequential inactivation [86].
- Validation of Mutant Phenotype: The successful generation of mutants and the absence of the target protein must be confirmed. Techniques include:
- Immunological Assays: Using monospecific antibodies directed against the non-conserved N-terminal regions of the adhesins to confirm the lack of expression in the mutant strains [86].
- Functional Complementation: Introducing the wild-type gene back into the mutant on a multicopy plasmid. This should fully or partially restore the adhesion phenotype, confirming that the observed defect is due to the specific gene deletion and not secondary mutations. This was demonstrated when wild-type fnbA and fnbB genes cloned separately restored adhesion in the double mutant [86].
Single-Cell Force Spectroscopy (SCFS) Measurement
Once mutants are validated, SCFS is used to probe their adhesive properties.
- Bacterial Probe Preparation: Individual bacterial cells are attached to a tipless, functionalized AFM cantilever. This is typically done using a bio-adhesive like polydopamine or a specific chemical crosslinker. The preparation creates a single-cell probe where the bacterium is the terminus of the cantilever [84] [85].
- Surface Preparation: Abiotic surfaces with defined properties are used to understand the fundamental adhesion mechanisms. Commonly used surfaces include:
- Hydrophobic Surfaces: Prepared by coating silicon wafers with octadecyltrichlorosilane [84].
- Hydrophilic Surfaces: Consist of bare, plasma-cleaned silicon wafers [84].
- Protein-Coated Surfaces: Surfaces can be coated with relevant host proteins like fibronectin [86] or collagen [85] to mimic biological interfaces.
- Force Curve Acquisition: The bacterial probe is approached into contact with the substrate with a defined force (typically 200-500 pN) and held for a set contact time (e.g., 0.1-1 second) to allow bond formation. The cantilever is then retracted while laser deflection is recorded, generating a force-distance curve. This process is repeated for multiple cells (typically 30-100) per strain to achieve statistical significance [84] [87].
Data Analysis of Force Spectroscopy Curves
The raw force-distance curves are processed and analyzed to extract quantitative adhesion parameters.
- Pre-processing: The curves undergo baseline correction, calibration to convert deflection to force (using the cantilever's spring constant), and distance conversion [88] [87].
- Adhesion Parameter Extraction:
- Adhesion Force: The maximum negative force encountered during cantilever retraction. This represents the strongest single pull-off event required to separate the bacterium from the surface.
- Work of Adhesion: The area under the negative portion of the retraction curve. This represents the total energy dissipated during the detachment process.
- Rupture Length: The distance at which the final adhesive bond detaches, indicating the length and extensibility of the surface molecules involved [84].
- Analysis of Complex Events: For adhesins that unfold under force (e.g., the multi-modular MUB protein in Lactobacillus), the retraction curve shows a characteristic "sawtooth" pattern. Each peak corresponds to the unfolding of an individual protein domain. These events can be fitted with the Worm-Like Chain (WLC) model to determine the contour length and persistence length of the unfolded domains, providing insights into the protein's mechanical stability and unfolding pathway [89] [88].
The following diagram illustrates the workflow from mutant preparation to data analysis.
Key Quantitative Findings from Adhesin Mutant Studies
The integration of genetic manipulation with SCFS has yielded precise, quantitative data on the function of specific adhesins. The table below summarizes key findings from seminal studies in the field.
Table 1: Quantitative Adhesion Parameters Measured by SCFS for Various Bacterial Mutants
| Bacterial Species | Genetic Modification | Functional Deficit | Key Adhesion Findings (vs. Wild-Type) | Reference |
|---|---|---|---|---|
| Staphylococcus aureus | Double mutant fnbA fnbB | Lacks fibronectin-binding proteins A & B | â–º Complete defect in adhesion to fibronectin-coated surfaces.â–º Defective adhesion to coverslips from in vivo tissue cages. | [86] |
| Staphylococcus aureus SA113 | Mutant ΔsrtA | Lacks covalently bound cell wall proteins | ► Strongly reduced adhesion on hydrophobic surfaces.► Minor reduction on hydrophilic surfaces. | [84] |
| Staphylococcus aureus SA113 | Mutant ΔtagO | Lacks wall teichoic acids (WTA) | ► Reduced adhesion on hydrophobic surfaces.► Significantly higher adhesion on hydrophilic surfaces. | [84] |
| Staphylococcus aureus SA113 | Mutant ΔdltA | Lacks D-alanylation of teichoic acids (increased negative charge) | ► Drastically reduced adhesion on hydrophobic surfaces.► No significant difference on hydrophilic surfaces. | [84] |
| Escherichia coli ATCC 25922 | EDTA treatment | Partial removal of lipopolysaccharide (LPS) | â–º Reduced adhesion forces and cell elasticity.â–º Marked reduction in cell-to-cell heterogeneity. | [16] |
| Pseudomonas aeruginosa PAO1 | wapR mutant | Altered lipopolysaccharide structure | ► Adhesive pressure of early biofilm: 332 ± 47 Pa (vs. 34 ± 15 Pa for wild-type). | [90] |
The data reveal that the functional consequence of deleting an adhesin is highly context-dependent, influenced by the surface chemistry of the substrate. This is further illustrated by the following diagram comparing the adhesion mechanisms on different surfaces.
Table 2: Essential Research Reagents and Materials for Mutant Adhesion Studies
| Reagent/Material | Function/Application in Study |
|---|---|
| Atomic Force Microscope (AFM) | Core instrument for performing single-cell force spectroscopy to quantify adhesion forces and nano-mechanical properties. |
| Tipless Cantilevers | Serve as the platform for chemically functionalizing and attaching a single bacterial cell to create a SCFS probe. |
| Chemical Crosslinkers (e.g., Polydopamine, BS³) | Used to firmly immobilize live bacterial cells onto the tipless cantilevers for robust force measurements. |
| Defined Surfaces (e.g., Silanized Si, bare Si) | Hydrophobic and hydrophilic substrates used to dissect the fundamental, non-specific adhesion mechanisms of bacterial cells. |
| Recombinant Host Proteins (e.g., Fibronectin, Collagen) | Coated onto surfaces to create biologically relevant substrates and study specific ligand-receptor mediated adhesion. |
| Antibiotic Resistance Cassettes (e.g., Tetâ±, Ermâ±) | Used as selectable markers for the insertional mutagenesis and creation of isogenic knock-out mutant strains. |
| Monospecific Antibodies | Critical for validating the absence of the target adhesin protein in the mutant strain via immunoassays. |
| Multicopy Plasmid Vectors | Used for functional complementation assays to reintroduce the wild-type gene and confirm genotype-phenotype linkage. |
The targeted creation of adhesin-deficient mutants, coupled with their biophysical interrogation via single-cell force spectroscopy, provides an unambiguous method for validating the function of specific bacterial surface molecules in adhesion. The protocols and data summarized in this guide underscore the power of this combined approach to move from observational data to mechanistic understanding. The findings reveal a complex landscape where the contribution of an individual adhesin is modulated by the physical and chemical nature of the surface, an insight critical for developing anti-adhesion therapies or designing anti-fouling materials. As SCFS technology continues to advance, enabling higher throughput and the study of more complex, conditioned surfaces, its integration with genetic manipulation will remain a fundamental strategy for deconstructing and ultimately controlling the initial stages of bacterial colonization and infection.
This technical guide explores the critical role of lognormal distribution in characterizing population heterogeneity within single-cell force spectroscopy (SCFS) of bacterial adhesion. Adhesion parameters such as maximum adhesion force (Fmax) and adhesion energy (Emax) do not follow normal distributions; instead, they exhibit right-skewed lognormal distributions, making this understanding essential for accurate data interpretation in drug development and basic research [55]. This whitepaper provides an in-depth analysis of the mathematical principles, experimental evidence, and methodological protocols for analyzing lognormally distributed adhesion data, framed within the context of high-throughput robotic fluidic force microscopy (FluidFM) [55].
In single-cell force spectroscopy, the adhesion forces measured across a population of bacterial cells are not uniform. Traditional analysis often assumes a normal distribution, but empirical evidence consistently demonstrates that parameters like single-cell adhesion force and adhesion energy follow lognormal population distribution [55]. This right-skewed distribution arises because adhesion forces are bounded at zero but can extend over a wide positive range, influenced by heterogeneous factors such as cell cycle stage, surface protein expression, and environmental conditions.
Failure to recognize this distribution can lead to significant misinterpretations of data. Conclusions based on low cell numbers or treating the population as normally distributed can be misleading for both basic research and drug development applications where adhesion phenomena are crucial [55]. Understanding lognormal distribution is therefore not merely a statistical exercise but a fundamental requirement for accurate mechanobiological insight.
Mathematical Foundations of Lognormal Distribution
Definition and Probability Density Function
A lognormal distribution describes a random variable whose logarithm is normally distributed. The probability density function (PDF) for a lognormally distributed variable x > 0 is defined by two parameters, μ and σ:
$$f(x)=\frac{1}{x\sqrt{2\pi \sigma^2}} e^{-\frac{1}{2\sigma^2}(\ln(x)-\mu)^2}$$
where μ is the location parameter (mean of the logarithmic values) and σ is the scale parameter (standard deviation of the logarithmic values) [91]. These parameters differ from the more familiar mean and standard deviation of the untransformed data.
Relationship to Normal Distribution
The lognormal distribution relates to the normal distribution through a logarithmic transformation [91] [92]. If a variable X follows a lognormal distribution, then Y = ln(X) follows a normal distribution. Conversely, if Y is normally distributed, then X = exp(Y) follows a lognormal distribution. This relationship enables analysis using normal distribution methods on logarithmically transformed data.
Table 1: Key Properties of Lognormal Distribution
| Property | Formula | Explanation |
|---|---|---|
| Median | $e^{\mu}$ | The median is the exponential of the location parameter |
| Mean | $e^{\mu + \sigma^2/2}$ | The mean exceeds the median due to right-skewness |
| Mode | $e^{\mu - \sigma^2}$ | The mode is less than both median and mean |
| Variance | $(e^{\sigma^2} - 1)e^{2\mu + \sigma^2}$ | Variance increases with both parameters |
Parameter Estimation from Data
For a dataset assumed to be lognormally distributed, parameters are estimated using maximum likelihood estimation (MLE) on the logarithmically transformed data points [91] [92]:
$$\mu\approx\bar{y}=\frac{1}{N}\sum{i=1}^{i=n}ln(x)i$$
$$\sigma^2\approx sy^2=\frac{1}{n-1}\sum{i=1}^{n}[ln(x_i)-\mu]^2$$
These estimators provide the most likely parameters that would generate the observed data under the lognormal assumption.
Experimental Evidence in Single-Cell Adhesion
High-Throughput Robotic Fluidic Force Microscopy
Robotic FluidFM technology has enabled the high-throughput measurement of single-cell adhesion parameters, producing sufficient data for population-level distribution analysis [55]. This platform addresses limitations of traditional atomic force microscopy (AFM), which typically measures only a few cells per day, insufficient for robust population distribution analysis.
In a landmark study utilizing robotic FluidFM, researchers investigated adhesion parameters of HeLa Fucci cells at various cell cycle stages [55]. The study collected 251 cell adhesion force-distance curves, with 225 meeting quality criteria for final analysis. This large dataset enabled the first characterization of single-cell adhesion distributions across cell cycle stages.
Lognormal Distribution of Adhesion Parameters
The study demonstrated that key adhesion parameters follow lognormal distributions [55]:
- Maximum adhesion force (Fmax)
- Adhesion energy (Emax)
- Cell area (Acell)
This finding has profound implications for experimental design and data interpretation. Researchers must account for this distribution when determining sample sizes and performing statistical tests, as traditional parametric tests assuming normality may yield invalid results.
Table 2: Experimental Parameters and Their Distributions in Single-Cell Adhesion
| Parameter | Symbol | Distribution Type | Biological Significance |
|---|---|---|---|
| Maximum Adhesion Force | Fmax | Lognormal | Peak force during cell detachment |
| Adhesion Energy | Emax | Lognormal | Total work required for detachment |
| Cell Area | Acell | Lognormal | Projected area of cell contact |
| Travel Distance at Fmax | Dmax | Lognormal | Elongation at maximum force |
Cell Cycle Dependence of Adhesion Properties
The study revealed significant variations in adhesion parameters across the cell cycle [55]:
- Colorless cells (M and early G1 phases): exhibited significantly smaller cell area but larger area-normalized maximal adhesion force
- Mitotic (M) phase cells: demonstrated unique "reticular adhesions" exerting higher force per unit area than canonical focal adhesions
- Spring coefficient (maximal adhesion force divided by maximal elongation): was significantly larger for colorless cells, indicating increased stiffness
These findings illustrate how biological heterogeneity manifests in mechanical properties and underscores the importance of population-level analysis.
Methodological Approaches
Data Analysis Protocols
Lognormal Probability Plotting
Lognormal probability plots provide a visual method to assess distribution fit [92]:
- Sort data from lowest to highest: $x1, x2, ..., x_n$
- Assign index numbers: $i = 1$ to $n$
- Calculate median ranks: $MR(x_i) = (i-0.3)/(n+0.4)$
- Compute vertical coordinates: $F(i) = \text{norm.inv}(P(i))$
- Plot $F(i)$ versus $\ln(x_i)$
If data follows a lognormal distribution, the plot will approximate a straight line. Deviations from linearity indicate departures from lognormality.
Confidence Interval Estimation
For lognormally distributed data, confidence intervals for parameters are calculated using these equations. The interval containing the population mean is [92]:
$$ \bar{y}-\frac{s}{\sqrt{n}}t{n-1,\alpha{LL}} <\mu< \bar{y}-\frac{s}{\sqrt{n}}t{n-1,\alpha{UL}} $$
The interval containing the population standard deviation is [92]:
$$\frac{(n-1)s^2}{\chi{n-1,\alpha{UL}}} <\sigma^2 < \frac{(n-1)s^2}{\chi{n-1,\alpha{LL}}}$$
These intervals quantify the uncertainty in parameter estimates due to sampling variation.
Experimental Workflow for High-Throughput SCFS
Figure 1: Experimental workflow for high-throughput single-cell force spectroscopy incorporating distribution analysis.
Statistical Analysis Protocol
Figure 2: Statistical analysis protocol for lognormally distributed adhesion data.
The Scientist's Toolkit: Essential Research Reagents and Materials
Table 3: Key Research Reagent Solutions for Single-Cell Adhesion Studies
| Item | Function/Application | Experimental Context |
|---|---|---|
| Robotic Fluidic Force Microscopy (FluidFM) | High-throughput single-cell force spectroscopy | Enables measurement of hundreds of cells for population distribution analysis [55] |
| Genetically Engineered HeLa Fucci Cell Line | Fluorescent cell cycle indicator | Expresses fluorescent proteins specific to G1 (mCherry) and S/G2/M (Azami Green) phases [55] |
| Hollow Silicon-Nitride Cantilevers | Cell manipulation and force sensing | Allows fluidic suction for cell capture and precise force measurement during detachment [55] |
| Computer-Controlled Micropipette (CCMP) | Alternative adhesion measurement | Provides complementary adhesion data; can be calibrated with FluidFM [55] |
| Resonant Waveguide Grating (RWG) Biosensors | Real-time adhesion kinetics | Measures dynamic mass redistribution during adhesion; calibrated with robotic FluidFM [55] |
Implications for Research and Drug Development
Understanding the lognormal distribution of adhesion forces has significant implications for both basic research and pharmaceutical development:
Experimental Design: Studies require sufficient sample sizes to characterize population distributions accurately, not just mean values [55]
Data Interpretation: Statistical analyses must account for lognormal distribution to avoid false conclusions about treatment effects
Biological Insight: The lognormal distribution itself may reflect underlying biological processes, such as heterogeneous expression of adhesion molecules
Drug Discovery: Compounds targeting cellular adhesion should be evaluated for their effects on population distributions, not just average responses
This understanding enables more rigorous mechanobiological studies and more effective development of therapeutic agents targeting adhesion processes in cancer, infectious diseases, and other conditions.
Population heterogeneity in bacterial adhesion forces manifests as lognormal distributions, requiring specialized analytical approaches distinct from traditional normal-distribution-based statistics. High-throughput robotic fluidic force microscopy has revealed that parameters such as maximum adhesion force and adhesion energy follow lognormal distributions across cell populations, with significant variations throughout the cell cycle. The methodologies and principles outlined in this technical guide provide researchers with the framework needed to properly design experiments, analyze data, and interpret results in single-cell adhesion research, ultimately advancing both basic scientific knowledge and therapeutic development.
The field of bacterial pathogenesis is increasingly recognizing that the physical interactions between a bacterium and a host cell, particularly the adhesion forces measured by Single-Cell Force Spectroscopy (SCFS), are not merely a preamble to infection but a central regulatory event. These mechanical interactions can dictate downstream molecular responses in both the pathogen and the host. Consequently, the integration of SCFS data with transcriptomic and proteomic datasets has emerged as a powerful, multidisciplinary approach. It creates a unified model that connects physical mechanics with molecular biology, offering a more complete understanding of the infection process. This integrated perspective is crucial for developing novel host-directed therapeutic strategies, especially in an era of escalating antimicrobial resistance [51] [93]. This technical guide outlines the methodologies and frameworks for the cross-platform validation of SCFS findings with multi-omics data, providing a robust pipeline for researchers in bacterial adhesion and drug development.
Core Concepts and Quantitative Foundations
The Mechanobiological Role of Bacterial-Host Adhesion
The initial adhesion of bacteria to host cells is a critical, force-dependent step that initiates infection. Staphylococcus aureus, for example, expresses specific adhesins like collagen adhesins (Cna) and fibronectin-binding proteins (FnBPs) that bind to host extracellular matrix components such as collagen and fibronectin [51] [93]. The biomechanical microenvironment of the host cell, including factors like extracellular matrix stiffness and environmental osmolarity, profoundly regulates these interactions [51].
Quantitative SCFS studies have revealed that bacterial-host adhesion is dynamically regulated. For instance, environmental osmotic pressure can induce a nonlinear, dramatic increase in adhesion force, shifting from 25.98 nN under isotonic conditions to 112.45 nN or 93.10 nN under hypotonic or hypertonic stimulation, respectively [51]. This demonstrates that physical cues can directly modulate the infectious potential of a pathogen.
The Imperative for Multi-Omics Integration
While SCFS provides crucial quantitative biomechanical data, it operates in a data vacuum without molecular context. Transcriptomic and proteomic analyses are essential for explaining the molecular mechanisms behind the observed adhesion forces.
- Transcriptomics (e.g., scRNA-seq) reveals changes in gene expression profiles of host cells in response to bacterial adhesion, such as the upregulation of specific collagen subtypes under osmotic stress [51].
- Proteomics identifies and quantifies the actual proteins expressed, such as fibronectin or collagen, which directly mediate the adhesive interaction [93] [94].
The core challenge, and the focus of this guide, is the robust horizontal integration of these disparate data types—biophysical force measurements, gene expression matrices, and protein abundance data—to generate validated, biologically significant conclusions.
Methodologies for Data Generation and Integration
Experimental Protocol: Quantifying Bacterial-Host Adhesion with SCFS
The following protocol details the measurement of bacterial-host adhesion forces using Fluidic Force Microscopy (FluidFM) [51].
1. Probe Preparation: Use a FluidFM probe with a microfluidic channel. Apply a slight underpressure to capture a single bacterial cell (e.g., S. aureus) onto the cantilever. 2. Cell Monolayer Preparation: Culture a monolayer of host cells (e.g., rat IEC-6 or human HaCat keratinocytes) on a sterile, rigid substrate suitable for AFM. 3. Osmotic Stimulation (Optional but Informative): To explore microenvironmental effects, treat the host cell monolayer with hypotonic (0.5x, 0.75x), isotonic (1x), or hypertonic (1.5x, 2x) solutions for 1 hour prior to measurement. Viability assays should confirm treatments are non-cytotoxic. 4. Force Spectroscopy Measurement: - Approach: Position the probe over a single host cell. Approach the cell monolayer at a constant speed of 1 µm/s until contact is established with a set contact force. - Contact: Pause for a set dwell time (e.g., 30 seconds) to allow for the formation of adhesive bonds. - Retraction: Retract the probe at the same speed of 1 µm/s. The adhesion force is determined from the maximum negative peak in the force-distance curve during retraction. 5. Data Collection: Record a minimum of 100-200 force curves from multiple cells and biological replicates to ensure statistical power.
Experimental Protocol: Transcriptomic and Proteomic Profiling
Following SCFS, parallel samples should be prepared for transcriptomic and proteomic analysis to link adhesion forces to molecular changes.
- RNA Sequencing (Bulk or Single-Cell): Lyse host cells after bacterial adhesion under different experimental conditions (e.g., hypotonic, isotonic, hypertonic). Extract total RNA and prepare libraries for sequencing. This protocol identified the upregulation of collagen XV under hypotonic conditions and collagen II under hypertonic conditions in host cells, explaining the increased adhesion [51].
- Proteomic Profiling (CITE-seq or Antibody-based Technologies): For techniques like CITE-seq, which simultaneously measures transcriptome and surface proteome in single cells, create a single-cell suspension. Incubate cells with antibody-derived tags targeting proteins of interest (e.g., adhesion molecules). Proceed with sequencing according to established CITE-seq protocols [95].
Table 1: Key Quantitative Findings from Integrated SCFS and Omics Studies
| Experimental Condition | Mean Adhesion Force (nN) | Key Upregulated Molecular Findings | Impact on Bacterial Infection |
|---|---|---|---|
| Isotonic (Control) | 25.98 | Baseline expression | Baseline resistance |
| Hypotonic | 112.45 | Overexpression of Collagen XV | Increased adhesion/internalization |
| Hypertonic | 93.10 | Overexpression of Collagen II | Increased adhesion/internalization |
| RGDS Peptide Treatment | Significant decrease | Inhibition of host Fibronectin (Fn) | Reduced adhesion; antibiotic adjuvant effect |
Computational Integration of Multi-Omics Data
Integrating transcriptomic and proteomic data is a non-trivial computational challenge. Two advanced deep-learning frameworks are particularly suitable for this task:
1. The scTEL Framework: scTEL uses Transformer Encoder layers and LSTM cells to map scRNA-seq data to protein expression levels. This is especially valuable when full CITE-seq is cost-prohibitive. The model learns the complex, non-linear relationships between gene expression and protein abundance, effectively imputing missing protein data from transcriptomic inputs [95].
- Application: Use scTEL to predict the expression of key adhesion proteins (e.g., collagens, fibronectin) in host cells from your scRNA-seq data, creating a unified cell-by-protein matrix for downstream analysis.
2. The SCPRO-HI Algorithm: This algorithm is explicitly designed for horizontal integration of low-dimensional, antibody-based single-cell proteomic datasets. It uses a hierarchical cell anchoring technique to match cells across different batches or experiments based on "distinctive proteins," effectively removing batch effects without transforming protein abundances into a new domain [94].
- Application: If your data combines multiple proteomic datasets (e.g., from different experimental days or slightly different antibody panels), SCPRO-HI can integrate them into a single, coherent dataset for joint analysis with your SCFS data.
Integrated Data Analysis Workflow
The following diagram illustrates the logical workflow for correlating SCFS measurements with multi-omics data to validate findings and generate biological insights.
The Scientist's Toolkit: Research Reagent Solutions
Table 2: Essential Reagents and Models for Integrated SCFS-Omics Studies
| Reagent / Model | Function / Purpose | Example Application |
|---|---|---|
| IEC-6 Cell Line | Rat small intestinal epithelial cell line; model for gut epithelium. | In vitro host model for studying bacterial adhesion in intestinal context [51]. |
| HaCaT Cell Line | Human keratinocyte cell line; model for skin epithelium. | In vitro host model for studying dermal bacterial infections [51] [93]. |
| RGDS Peptide | Arg-Gly-Asp-Ser peptide; inhibits fibronectin-based bacterial adhesion. | Mechanobiological tool to disrupt Fn-FnBP interactions, validating the role of specific host proteins [93]. |
| CITE-seq Antibody Panels | Antibodies conjugated to oligonucleotide tags for simultaneous protein and RNA detection. | Profiling surface protein (e.g., collagen, Fn) and mRNA expression in the same single cell [95]. |
| Osmotic Modulators | Agents like D-mannitol or NaCl to create hypertonic/hypotonic conditions. | Investigating the role of host mechanical microenvironment on bacterial adhesion forces [51]. |
The integration of SCFS with transcriptomic and proteomic data represents the forefront of mechanobiological research in bacterial pathogenesis. This cross-platform validation strategy moves beyond correlation to establish causative links between physical forces and molecular changes. The experimental and computational protocols outlined here provide a robust framework for deconstructing the complexity of bacterial-host interfaces. The insights generated from this integrated approach are pivotal for pioneering novel host-directed antimicrobial strategies, such as those targeting host fibronectin with RGDS peptides, offering a promising path to combat drug-resistant infections [93].
Within the context of single-cell force spectroscopy (SCFS) of bacterial adhesion research, benchmarking refers to the critical process of validating quantitative, biophysical adhesion measurements against functionally relevant biological outcomes. SCFS techniques, such as atomic force microscopy (AFM) and fluidic force microscopy (FluidFM), provide precise quantification of the piconewton-level forces governing bacterial attachment [32] [55]. However, the biological significance of these measurements remains limited unless correlated directly with downstream infection and colonization models. This integration establishes a functional hierarchy, determining which adhesion parameters—such as maximum adhesion force (Fmax), adhesion energy (Emax), and detachment work—most accurately predict successful colonization in a host or host-mimicking environment. For researchers and drug development professionals, this benchmarking is a prerequisite for translating in vitro mechanobiological data into predictive models for infection risk, pathogenicity, and therapeutic targeting.
The necessity for this approach is underscored by high-throughput studies revealing that single-cell adhesion parameters, including Fmax and Emax, follow lognormal distributions across cellular populations [55]. This distribution means that conclusions drawn from a low number of cell measurements can be misleading, and population-level studies are essential to understand the relationship between adhesion and biological success. This guide details the methodologies and frameworks for robustly linking SCFS data with infection and colonization outcomes, thereby enabling the development of more predictive and clinically relevant models.
Core Principles: From Adhesion Forces to Biological Success
Key Adhesion Parameters from Force Spectroscopy
SCFS experiments generate force-distance (F-D) curves, from which specific quantitative parameters are extracted. These parameters form the basis for correlation with biological outcomes.
- Maximum Adhesion Force (Fmax): The highest negative force recorded during the retraction of the probe from the cell surface. It represents the strength of the strongest specific or nonspecific bond within the adhesive contact [32] [55].
- Adhesion Energy (Emax): The total work required to detach the cell, calculated as the area under the F-D curve during the retraction phase. This parameter integrates both the strength and the elasticity of the adhesive contacts [55].
- Detachment Steps: Discrete, sudden decreases in the retraction force on the F-D curve, often indicative of the sequential rupture of individual molecular bonds or adhesion complexes.
Defining Biological Outcomes for Benchmarking
The biological endpoints against which adhesion parameters are benchmarked must be quantifiable and clinically relevant.
- Colonization Efficiency: A measure of the ability of a bacterial population to establish a stable presence on a host surface. This is often quantified in vitro as the number of adhered cells per unit area after a specified incubation period and washing steps, or in vivo as the bacterial load recovered from a host organism after a set time [32].
- Infection Severity: In clinical or animal model contexts, this can be scored using pathological indices, host mortality rates, or biomarkers of inflammation and immune response.
- Biofilm Formation: The transition from initial adhesion to mature biofilm can be quantified by measuring biomass accumulation (e.g., via crystal violet staining) or by assessing the expression of biofilm-related genes.
Table 1: Core Single-Cell Force Spectroscopy (SCFS) Parameters for Benchmarking
| Parameter | Description | Biological Significance | Typical Measurement Technique |
|---|---|---|---|
| Maximum Adhesion Force (Fmax) | Peak force during cantilever retraction; indicates strongest bond rupture. | Correlates with the presence of high-affinity adhesins and initial attachment strength. | AFM, FluidFM [32] [55] |
| Adhesion Energy (Emax) | Total work of detachment; area under the force-distance curve. | Reflects the combined contribution of bond strength and cellular deformation. | AFM, FluidFM [55] |
| Detachment Work | The work required to fully separate the cell from the substrate. | Integrates the totality of adhesive interactions; may predict colonization stability. | AFM, FluidFM |
| Adhesion Spring Coefficient | Ratio of Fmax to maximal cell elongation; a measure of cellular stiffness. | Can indicate the state of the cell (e.g., mitotic phase in eukaryotes) and adhesion maturity [55]. | Robotic FluidFM [55] |
Experimental Protocols for Benchmarking Studies
Protocol 1: Single-Cell Force Spectroscopy of Bacterial Adhesion
This protocol is adapted from high-throughput methodologies for quantifying bacterial adhesion forces at the single-cell level [32] [55].
A. Sample and Substrate Preparation
- Bacterial Culture: Grow the bacterial strain of interest (e.g., Lactobacillus plantarum or a pathogenic species) under conditions relevant to the study.
- Substrate Functionalization: Prepare biotic or abiotic surfaces that mimic the host environment. This could involve coating AFM substrates with purified host proteins (e.g., collagen, fibronectin), mucosal layers, or bacterial ligands (e.g., lectin monolayers) [32].
- Cell Immobilization: For AFM, bacterial cells are typically immobilized on a solid substrate or a porous filter. For FluidFM, a single live cell is attached to a polydopamine-coated colloidal probe cantilever using a combination of physical pressure and wet adhesion, ensuring minimal cellular damage [32].
B. Force Spectroscopy Measurement
- Approach and Contact: Bring the cell-functionalized cantilever into contact with the target substrate with a defined force (typically 200-500 pN) and a set contact time (e.g., 1-10 seconds) to allow for bond formation.
- Retraction and Detachment: Retract the cantilever at a constant velocity while recording the deflection. This generates the force-distance curve. For statistical robustness, a minimum of 100-1000 force curves should be collected per condition across multiple cells and biological replicates, acknowledging the lognormal distribution of adhesion parameters [55].
C. Data Analysis
- Curve Processing: Use dedicated software (e.g., BFPTool for Biomembrane Force Probe data, or other AFM analysis packages) to process F-D curves, correct for baseline drift, and extract parameters like Fmax and Emax [96].
- Population-Level Analysis: Plot the distributions of Fmax and Emax. Given their lognormal nature, use geometric means and medians for population comparisons rather than arithmetic means [55].
Protocol 2: Correlating SCFS with In Vitro Colonization Assays
This protocol describes how to directly benchmark SCFS data against a standard colonization efficiency assay.
A. Parallel Adhesion Workflow
- SCFS Measurement: Perform SCFS as described in Protocol 1 on a defined bacterial strain or condition.
- Macroscopic Adhesion Assay: In parallel, incubate the same bacterial preparation with the identical substrate used in SCFS in a multi-well plate. After a set time (e.g., 1-2 hours), gently wash the substrate to remove non-adhered cells.
- Quantification of Colonization: Lyse the adhered cells and quantify the bacterial load through colony-forming unit (CFU) plating, fluorescence measurement, or ATP-based assays. The result is the "colonization efficiency" (e.g., CFU/mm²).
B. Data Correlation and Modeling
- Statistical Analysis: Perform a correlation analysis (e.g., Pearson or Spearman correlation) between the SCFS parameters (e.g., median Fmax from the population) and the measured colonization efficiency.
- Regression Modeling: Use linear or non-linear regression to model colonization efficiency as a function of one or more SCFS parameters. This generates a predictive equation that can benchmark the biological impact of adhesion force.
Advanced Applications and Multi-Model Validation
Integration with Clinical Prediction Models
The predictive models developed through in vitro benchmarking can be further validated against clinical outcomes. For instance, studies aiming to predict multidrug-resistant organism (MDRO) colonization or infection have developed diagnostic and prognostic models using clinical parameters [97]. Key predictors identified in these models—such as age, recent invasive procedures, antibiotic usage, and prior hospitalization—can be used to stratify patient-derived bacterial strains for SCFS analysis [97]. By measuring the adhesion forces of strains from high-risk versus low-risk patients, researchers can determine if biophysical adhesion parameters add predictive value to existing clinical models, thereby creating a more robust, multi-scale benchmarking framework.
High-Throughput and Population-Level Analysis
Traditional AFM-based SCFS is low-throughput, limiting its ability to capture population heterogeneity. The advent of robotic fluidic force microscopy (FluidFM) has revolutionized this by enabling the detachment and measurement of hundreds to thousands of single cells in a high-throughput manner [55]. This capability is crucial for accurate benchmarking, as it allows for the comprehensive characterization of the lognormal distribution of adhesion parameters within a population. Linking specific subpopulations of cells (e.g., those in the top quartile of Fmax) to increased colonization efficiency in a subsequent assay provides a much more powerful and nuanced benchmark than population averages.
Table 2: Research Reagent Solutions for SCFS and Benchmarking Experiments
| Reagent / Material | Function in Experiment | Example Application |
|---|---|---|
| Polydopamine Wet Adhesive | A bioinspired, nondestructive adhesive for attaching single live bacterial cells to AFM/FludiFM cantilevers. | Enables SCFS on probiotic Lactobacillus plantarum and other bacterial species [32]. |
| Functionalized Substrates | Surfaces coated with biotic (e.g., lectins) or abiotic (e.g., hydrophobic monolayers) molecules to mimic host environments. | Used to quantify specific and nonspecific adhesion forces of bacteria to different surfaces [32]. |
| Fluorescent Ubiquitination-Based Cell-Cycle Indicator (Fucci) | A genetically encoded construct that labels live cells with fluorescent proteins based on their cell-cycle phase. | Allows correlation of single-cell adhesion parameters with the cell cycle in eukaryotic host cells (e.g., HeLa cells) [55]. |
| Colloidal Probe Cantilevers | AFM cantilevers with a spherical tip, often used in FluidFM for gentle cell handling and precise force application. | Facilitates the high-throughput picking up and measurement of single bacterial or eukaryotic cells [32] [55]. |
| Normalized Cross-Correlation Software (e.g., in BFPTool) | Algorithm for precise tracking of pipette position in video microscopy recordings of BFP experiments. | Improves the accuracy and reliability of force calculation from video data, especially in suboptimal recording conditions [96]. |
Visualization of the Integrated Benchmarking Workflow
The following diagram synthesizes the complete experimental and analytical pathway for benchmarking SCFS data against biological outcomes, from single-cell measurement to clinical relevance.
Benchmarking SCFS-derived adhesion parameters against biological outcomes in infection and colonization models is not merely an optional validation step but a fundamental requirement for endowing biophysical data with biological and clinical meaning. The protocols and frameworks outlined in this guide—ranging from basic correlation studies to integration with high-throughput robotic FluidFM and clinical prediction models—provide a roadmap for this critical process. By systematically implementing these approaches, researchers can transform single-cell force measurements into powerful, predictive indicators of bacterial pathogenicity and colonization potential, ultimately accelerating the development of novel anti-infective therapies and diagnostic tools.
Conclusion
Single-cell force spectroscopy has revolutionized our quantitative understanding of bacterial adhesion, providing unprecedented resolution of the biophysical forces governing host-pathogen interactions, biofilm formation, and probiotic functionality. The integration of robust methodological protocols with high-throughput platforms like robotic FluidFM now enables researchers to capture population heterogeneity and rare cellular events. Looking forward, SCFS is poised to drive innovative therapeutic strategies targeting initial bacterial adhesion—a critical step in infection—thus offering promising alternatives in the face of growing antibiotic resistance. Future directions should focus on correlating single-molecule binding events with whole-cell adhesion dynamics, developing standardized cross-laboratory protocols, and applying SCFS to microbiome research and the rational design of anti-infective biomaterials. This powerful technique will continue to provide fundamental insights bridging microbial biophysics with clinical applications.
References
- 1. An Introduction to AFM [https://hansmalab.physics.ucsb.edu/afmhistory.html]
- 2. Quantifying the forces guiding microbial cell adhesion ... [https://www.nature.com/articles/nprot.2014.066]
- 3. A novel protocol to prepare cell probes for the quantification of ... [https://pmc.ncbi.nlm.nih.gov/articles/PMC6999235/]
- 4. How AFM Works - Atomic Force Microscopy [https://www.parksystems.com/en/learning-center/how-afm-works]
- 5. Tech Note: A Practical Guide to AFM Force Spectroscopy ... [https://www.bruker.com/en/products-and-solutions/microscopes/bioafm/resource-library/a-practical-guide-to-afm-force-spectroscopy-and-data-analysis.html]
- 6. AFM-Based Force Spectroscopy Guided by Recognition ... [https://pmc.ncbi.nlm.nih.gov/articles/PMC6481044/]
- 7. AFM image analysis: a comprehensive guide [https://www.digitalsurf.com/blog/demystifying-afm-image-analysis-a-comprehensive-guide/]
- 8. Specific Molecular Recognition and Nonspecific ... [https://pmc.ncbi.nlm.nih.gov/articles/PMC2394898/]
- 9. Multiple bacteria recognition mechanisms and their ... [https://www.sciencedirect.com/science/article/abs/pii/S0010854524003710]
- 10. Unlocking Probiotic Potential [https://pmc.ncbi.nlm.nih.gov/articles/PMC12410510/]
- 11. Biofilms: structure, resistance mechanism, emerging ... [https://pubs.rsc.org/en/content/articlehtml/2025/pm/d5pm00094g]
- 12. The biophysics of bacterial infections: Adhesion events in ... [https://www.sciencedirect.com/science/article/pii/S2468233021000013]
- 13. How Microbes Use Force To Control Adhesion - PMC [https://pmc.ncbi.nlm.nih.gov/articles/PMC7253613/]
- 14. High force catch bond mechanism of bacterial adhesion in ... [https://www.nature.com/articles/s41467-020-18063-x]
- 15. Quantitative study of early-stage transient bacterial ... [https://www.nature.com/articles/s41598-024-67716-0]
- 16. Single-cell analysis of lipopolysaccharide-mediated ... [https://pmc.ncbi.nlm.nih.gov/articles/PMC12535489/]
- 17. Enhancing Bacterial Adhesion with Hydro-Softened ... [https://pmc.ncbi.nlm.nih.gov/articles/PMC12369014/]
- 18. Emerging Issues and Initial Insights into Bacterial Biofilms [https://pmc.ncbi.nlm.nih.gov/articles/PMC10885942/]
- 19. Implication of Surface Properties, Bacterial Motility, and ... [https://pmc.ncbi.nlm.nih.gov/articles/PMC7907602/]
- 20. Optimizing 1-μs-Resolution Single-Molecule Force ... [https://pmc.ncbi.nlm.nih.gov/articles/PMC4663051/]
- 21. Mechanisms of antimicrobial resistance in biofilms [https://www.nature.com/articles/s44259-024-00046-3]
- 22. Anti-bacterial and anti-adhesion effects of marine ... [https://www.sciencedirect.com/science/article/pii/S2950194625002559]
- 23. Singleâ€Cell Force Spectroscopy Uncovers Root Zone [https://pmc.ncbi.nlm.nih.gov/articles/PMC12051759/]
- 24. Analysing the Initial Bacterial Adhesion to Evaluate ... [https://www.mdpi.com/2079-6382/9/7/421]
- 25. A Review of Single-Cell Adhesion Force Kinetics and ... [https://pmc.ncbi.nlm.nih.gov/articles/PMC8000588/]
- 26. A single-cell force spectroscopy analysis of the effects of ... [https://discovery.ucl.ac.uk/id/eprint/10213973]
- 27. Cell type specific adhesion to surfaces functionalised by ... [https://www.nature.com/articles/s41598-020-65889-y]
- 28. A detailed guideline for the fabrication of single bacterial ... [https://link.springer.com/article/10.1140/epje/i2015-15140-2]
- 29. The biophysics of bacterial infections: Adhesion events in the ... [https://pmc.ncbi.nlm.nih.gov/articles/PMC7898176/]
- 30. Atomic force microscopy measurements of bacterial ... [https://www.nature.com/articles/srep16857]
- 31. A modular atomic force microscopy approach reveals ... [https://www.nature.com/articles/s41396-019-0404-1]
- 32. Article Single-Cell Force Spectroscopy of Probiotic Bacteria [https://www.sciencedirect.com/science/article/pii/S0006349513003858]
- 33. Single-cell force spectroscopy of bacteria enabled by ... [https://pubmed.ncbi.nlm.nih.gov/24654836/]
- 34. and Short-Range Forces Involved in Bacterial Adhesion to ... [https://pmc.ncbi.nlm.nih.gov/articles/PMC3147456/]
- 35. Analysis of bacterial adhesion using a gradient force ... [https://pubmed.ncbi.nlm.nih.gov/15379512/]
- 36. - Single Uncovers Root Zone- and... Cell Force Spectroscopy [https://pubmed.ncbi.nlm.nih.gov/40014612/]
- 37. Force Nanoscopy Demonstrates Stress-Activated Adhesion ... [https://pmc.ncbi.nlm.nih.gov/articles/PMC11752402/]
- 38. Probing Bacterial at the Single-Molecule and Adhesion - Single ... Cell [https://link.springer.com/protocol/10.1007/978-1-4939-8591-3_24]
- 39. The adhesion capability of Staphylococcus aureus cells is ... [https://pubs.rsc.org/en/content/articlelanding/2024/sm/d3sm01045g]
- 40. Single-cell analysis of lipopolysaccharide-mediated ... [https://link.springer.com/article/10.1007/s00203-025-04529-3]
- 41. Measuring the forces involved in polyvalent adhesion of ... [https://pmc.ncbi.nlm.nih.gov/articles/PMC27183/]
- 42. Characterizing interactions of Staphylococcus aureus and ... [https://www.nature.com/articles/s41522-025-00754-2]
- 43. Comparison of Escherichia coli surface attachment ... [https://www.nature.com/articles/s41598-019-55798-0]
- 44. Comparison of the adherence of E.Coli and S. Aureus to ... [https://pmc.ncbi.nlm.nih.gov/articles/PMC3452635/]
- 45. Factors influencing initial bacterial adhesion to antifouling ... [https://www.sciencedirect.com/science/article/pii/S2589004224000245]
- 46. Variation of mucin adhesion, cell surface characteristics, and molecular mechanisms among Lactobacillus plantarum isolated from different habitats - PubMed [https://pubmed.ncbi.nlm.nih.gov/28891023/]
- 47. Adhesion abilities of dairy Lactobacillus plantarum strains showing an aggregation phenotype - ScienceDirect [https://www.sciencedirect.com/science/article/abs/pii/S0963996914000143]
- 48. Adhesion Properties of Food-Associated Lactobacillus plantarum Strains on Human Intestinal Epithelial Cells and Modulation of IL-8 Release - PMC [https://pmc.ncbi.nlm.nih.gov/articles/PMC6186789/]
- 49. Probiotic evaluation, adherence capability and safety ... [https://www.nature.com/articles/s41598-024-66597-7]
- 50. Quantitative Approach in the Study of Adhesion of Lactic ... [https://pmc.ncbi.nlm.nih.gov/articles/PMC92208/]
- 51. Bacterial–host adhesion dominated by collagen subtypes ... [https://www.nature.com/articles/s41522-024-00600-x]
- 52. Osmotic pressure modulates single cell cycle dynamics ... [https://www.nature.com/articles/s41598-021-92054-w]
- 53. Force spectroscopy reveals membrane fluctuations and ... [https://pmc.ncbi.nlm.nih.gov/articles/PMC12037009/]
- 54. Adhesion potential of bacteria retrieved from intake ... [https://www.sciencedirect.com/science/article/pii/S1944398624151661]
- 55. Population distributions of single-cell adhesion ... - Nature [https://www.nature.com/articles/s41598-022-11770-z]
- 56. Extending applications of AFM to fluidic AFM in single living ... [https://pmc.ncbi.nlm.nih.gov/articles/PMC9378449/]
- 57. and multilayer assemblies from robotic fluidic force ... [https://www.sciencedirect.com/science/article/pii/S0171933522000760]
- 58. Design of a palette of SNAP-tag mimics of fluorescent ... [https://www.nature.com/articles/s41421-023-00546-y]
- 59. Quantitative comparison of EGFR expression levels ... [https://www.sciencedirect.com/science/article/abs/pii/S0956566323002622]
- 60. Quantifying Intracellular Mechanosensitive Response upon ... [https://elifesciences.org/reviewed-preprints/107220/reviews]
- 61. Comparative analysis of dimension reduction methods for ... [https://www.nature.com/articles/s41467-023-37478-w]
- 62. Recent progress of polydopamine nanoparticles as ... [https://www.frontiersin.org/journals/bioengineering-and-biotechnology/articles/10.3389/fbioe.2025.1678136/full]
- 63. FluidFM as a tool to study adhesion of forces ... | PLOS One bacteria [https://journals.plos.org/plosone/article?id=10.1371/journal.pone.0227395]
- 64. Atomic force and infrared spectroscopic studies on the role ... [https://pmc.ncbi.nlm.nih.gov/articles/PMC10079710/]
- 65. High-Throughput Single-Cell Adhesion Force ... [https://bio-protocol.org/exchange/minidetail?id=19076755&type=30]
- 66. Hydrodynamic function and spring constant calibration of ... [https://www.nature.com/articles/s41378-023-00629-6]
- 67. Hydrophobic interaction governs unspecific adhesion of ... [https://www.beilstein-journals.org/bjnano/articles/5/163]
- 68. Single-cell parallel plate mechanics by side-view optical ... [https://pubs.rsc.org/en/content/articlehtml/2025/na/d5na00012b]
- 69. Optimizing force spectroscopy by modifying commercial ... [https://www.sciencedirect.com/science/article/abs/pii/S1047847716300089]
- 70. Atomic force microscopy-single-molecule ... [https://pmc.ncbi.nlm.nih.gov/articles/PMC8913689/]
- 71. Best practices for single-cell analysis across modalities [https://pmc.ncbi.nlm.nih.gov/articles/PMC10066026/]
- 72. Hydrophobic interaction governs unspecific adhesion of ... [https://www.sciencedirect.com/org/science/article/pii/S2190428614001610]
- 73. Impact of Experimental Parameters on Cell–Cell Force ... [https://pmc.ncbi.nlm.nih.gov/articles/PMC7915634/]
- 74. An Overview of Cell Force Spectroscopy [https://www.cytosurge.com/applications/force-spectroscopy]
- 75. Enhanced optical trapping by concentrated local fields in ... [https://link.springer.com/article/10.1186/s11671-025-04383-8]
- 76. Robust quantification of cellular mechanics using optical ... [https://www.sciencedirect.com/science/article/pii/S2667074725000047]
- 77. The full model of micropipette aspiration of cells [https://www.sciencedirect.com/science/article/abs/pii/S1742706122008273]
- 78. Soft matter mechanics of immune cell aggregates - PMC [https://pmc.ncbi.nlm.nih.gov/articles/PMC12312570/]
- 79. Techniques to stimulate and interrogate cell–cell adhesion ... [https://pmc.ncbi.nlm.nih.gov/articles/PMC6181239/]
- 80. A Review of Single-Cell Adhesion Force Kinetics and ... [https://www.mdpi.com/2073-4409/10/3/577]
- 81. Scanning Fluorescence Correlation Spectroscopy (SFCS) [https://www.sciencedirect.com/science/article/pii/S000634950473605X]
- 82. Segmented fluorescence correlation spectroscopy (FCS) ... [https://www.nature.com/articles/s41598-024-68317-7]
- 83. Spatially Resolved Fluorescence Correlation Spectroscopy ... [https://pmc.ncbi.nlm.nih.gov/articles/PMC1635679/]
- 84. Using Knock-Out Mutants to Investigate the Adhesion of ... [https://www.mdpi.com/1422-0067/22/21/11952]
- 85. A single-cell force spectroscopy analysis of the effects of ... [https://discovery.ucl.ac.uk/id/eprint/10213973/]
- 86. properties of Adhesion of Staphylococcus aureus defective in... mutants [https://pubmed.ncbi.nlm.nih.gov/8594333/]
- 87. A Practical Guide to AFM Force Spectroscopy and ... [https://www.bruker.com/es/products-and-solutions/microscopes/bioafm/library-assets/a-practical-guide-to-afm-force-spectroscopy-and-data-analysis.html]
- 88. Force Curve Analysis Module - Mountains® optional module [https://www.digitalsurf.com/optional-modules/afm-force-curves/]
- 89. Use of Atomic Force Microscopy to Study the Multi-Modular ... [https://pmc.ncbi.nlm.nih.gov/articles/PMC5133854/]
- 90. Article Absolute Quantitation of Bacterial Biofilm Adhesion ... [https://www.sciencedirect.com/science/article/pii/S0006349509004226]
- 91. Log-normal Distribution – A simple explanation [https://towardsdatascience.com/log-normal-distribution-a-simple-explanation-7605864fb67c/]
- 92. Lognormal Probability Plots [https://accendoreliability.com/lognormal-probability-plots/]
- 93. Harnessing RGDS peptides to regulate bacterial-host ... [https://www.sciencedirect.com/science/article/abs/pii/S0168365925005425]
- 94. Integration of single-cell proteomic datasets through ... [https://pubmed.ncbi.nlm.nih.gov/38135888/]
- 95. A joint analysis of single cell transcriptomics and ... [https://www.nature.com/articles/s41540-024-00484-9]
- 96. BFPTool: a software tool for analysis of Biomembrane Force ... [https://bmcbiophys.biomedcentral.com/articles/10.1186/s13628-016-0033-2]
- 97. a systematic review, critical appraisal, and meta-analysis [https://pubmed.ncbi.nlm.nih.gov/38992430/]