Absolute Quantification in Biomarker and Microbiome Research: A Digital PCR Anchoring Guide
This article provides a comprehensive guide for researchers and drug development professionals on using Digital PCR (dPCR) for absolute abundance measurements.
Absolute Quantification in Biomarker and Microbiome Research: A Digital PCR Anchoring Guide
Abstract
This article provides a comprehensive guide for researchers and drug development professionals on using Digital PCR (dPCR) for absolute abundance measurements. It covers the foundational principles that give dPCR an advantage over relative quantification methods, detailed methodological workflows for applications in microbiome profiling and liquid biopsy, practical troubleshooting and optimization strategies to enhance data accuracy, and a critical validation of dPCR against other quantitative techniques. The content synthesizes the latest research to empower scientists in implementing robust, absolute quantification in their biomedical and clinical studies.
Beyond Relative Abundance: The Core Principles of Digital PCR for Absolute Quantification
The standardization of molecular diagnostics and microbiome research has long relied on relative quantification methods, including quantitative PCR (qPCR) and 16S rRNA gene amplicon sequencing. While these techniques are foundational, their inherent limitations—such as dependence on reference genes and the compositional nature of relative data—can obscure true biological changes and introduce quantification biases. This application note details the critical "quantification gap" created by these relative methods and demonstrates how digital PCR (dPCR) anchoring provides a robust framework for obtaining absolute abundances, thereby enabling more accurate and reliable results in research and drug development.
Relative quantification methods measure the abundance of a target nucleic acid in proportion to a reference gene or to the total microbial community. While widely used, these approaches present significant limitations for rigorous scientific and clinical applications.
- Dependence on Stable Reference Genes: Relative qPCR requires the use of stably expressed reference genes (e.g., 18S rRNA) for data normalization using the 2−ΔΔCT method [1]. However, reference gene expression can vary significantly under different experimental conditions, such as inflammation, leading to biased results and inaccurate conclusions [1].
- Compositional Nature of Relative Data: In microbiome studies based on 16S rRNA sequencing, an increase in the relative abundance of one taxon necessitates an artificial decrease in all others [2]. This property can lead to high false-positive rates in differential abundance analyses and makes it impossible to determine whether an observed change is due to an actual increase in one taxon, a decrease in others, or a combination of both [2].
- Susceptibility to Amplification Biases and Inhibitors: qPCR quantification depends on standard curves, which can introduce variability and limit precision, particularly in the presence of PCR inhibitors commonly found in complex sample matrices like respiratory secretions or gut mucosa [3].
Comparative Performance: Quantitative Data
The following table summarizes key comparative studies highlighting the performance differences between relative quantification methods and absolute quantification using digital PCR.
Table 1: Comparative Performance of qPCR and Digital PCR
| Study Focus | qPCR Performance | Digital PCR Performance | Key Finding |
|---|---|---|---|
| CNV Enumeration (2025) [4] | 60% concordance with PFGE gold standard; underestimated copy numbers; 22% average difference from PFGE. | 95% concordance with PFGE; accurate across a wide CNV range; 5% average difference from PFGE. | ddPCR is a superior high-throughput method for accurate clinical CNV testing. |
| Respiratory Virus Detection (2025) [3] | Effective for detection but quantification varies with amplification efficiency and inhibitors. | Superior accuracy for high/medium viral loads; greater consistency and precision independent of standard curves. | dPCR enhances diagnostic accuracy, especially for quantifying intermediate viral levels. |
| Gene Expression under Inflammation [1] | Consistent effect direction for 6/8 genes; effect size deviations for genes with low abundance. | Consistent effect direction for 7/8 genes; more reliable quantification for low-abundance targets. | Discrepancies are pronounced for targets at the extreme edges of the dynamic range. |
| Microbiome Analysis [2] | Provides only relative abundances, obscuring true population dynamics. | Enables absolute quantification via dPCR anchoring, revealing true changes in microbial loads. | Absolute quantification is essential to correctly interpret diet-induced microbiome changes. |
Bridging the Gap with Digital PCR Anchoring
Digital PCR (dPCR) overcomes the limitations of relative quantification by providing an absolute count of target DNA molecules without the need for standard curves or reference genes [5]. The core principle involves partitioning a PCR reaction into thousands of nanodroplets or microchambers, so that each contains zero, one, or a few target molecules. After end-point PCR amplification, the fraction of positive partitions is counted, and the absolute concentration of the target is calculated using Poisson statistics [5] [6].
dPCR Anchoring for Microbiome Sequencing: This powerful application combines the high-throughput advantage of 16S rRNA gene sequencing with the absolute quantification power of dPCR.
- Principle: dPCR is used to quantify the total number of 16S rRNA gene copies in a sample prior to sequencing. This "anchor" value is then used to convert subsequent relative abundances from sequencing into absolute abundances for each taxon [2].
- Impact: This method revealed that a ketogenic diet in mice led to an overall decrease in total microbial loads—a finding that was masked by relative abundance analysis alone [2].
Experimental Workflow for Absolute Quantification in Microbiome Studies
Table 2: Protocol for Absolute Microbial Abundance via dPCR Anchoring
| Step | Procedure | Key Considerations |
|---|---|---|
| 1. Sample Processing | Homogenize samples (stool, mucosa). Use defined input mass/volume. | Validate extraction efficiency across different sample types (e.g., lumen vs. mucosa) [2]. |
| 2. Nucleic Acid Extraction | Extract total DNA using a column-based kit. Perform extracellular DNase treatment if required. | Assess and account for the presence of host DNA, which can saturate columns in mucosal samples [2]. |
| 3. dPCR "Anchor" Setup | Partition the DNA sample into a dPCR reaction with 16S rRNA gene primers/probes. | Follow dMIQE guidelines [6]. Ensure optimal partitioning (aim for >10,000 droplets) and clear positive/negative thresholding. |
| 4. dPCR Analysis | Calculate the absolute concentration of 16S rRNA gene copies/µl from the fraction of positive partitions using Poisson distribution. | Use this value as your "anchor" or scaling factor [2]. |
| 5. 16S rRNA Gene Sequencing | Amplify the V4 region of the 16S rRNA gene from the same DNA extract. Follow standard library prep protocols. | Monitor amplification with real-time qPCR and stop reactions in the late exponential phase to limit chimera formation [2]. |
| 6. Data Integration | Multiply the relative abundance of each taxon from sequencing data by the absolute 16S rRNA gene copies/µl from dPCR. | This yields the absolute abundance of each taxon per unit of sample [2]. |
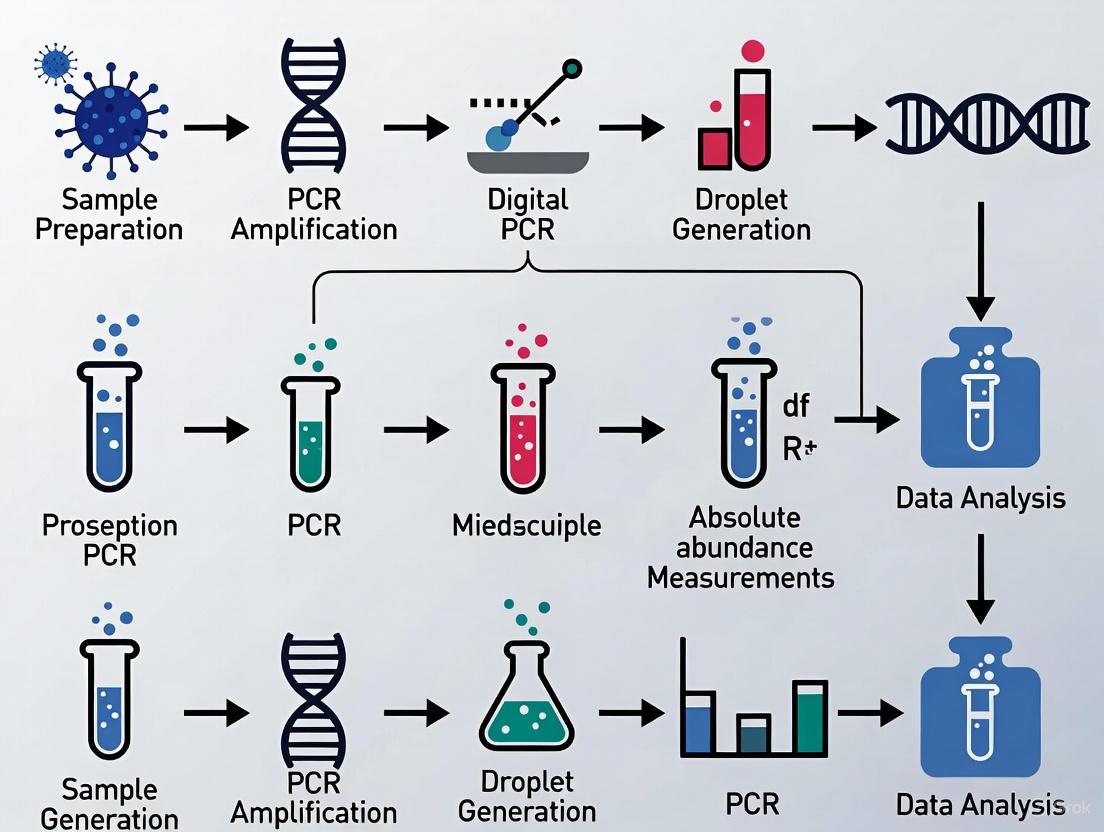
The logical relationship and workflow for this methodology is outlined below.
Diagram Title: dPCR Anchoring Workflow for Absolute Microbiome Quantification
The Scientist's Toolkit: Essential Reagents and Materials
Table 3: Key Research Reagent Solutions for dPCR-based Absolute Quantification
| Item | Function | Example & Notes |
|---|---|---|
| dPCR System | Partitions samples and performs absolute quantification. | QIAcuity (Qiagen), QX200 Droplet Digital PCR System (Bio-Rad), QuantStudio Absolute Q (Thermo Fisher). Nanowell- and droplet-based systems are available [5] [3]. |
| Nucleic Acid Extraction Kit | Isolates high-quality DNA/RNA from complex matrices. | Kits with validated efficiency for diverse sample types (e.g., stool, mucosa, viral concentrates) are critical [2] [7]. |
| dPCR Supermix | Optimized reaction mix for partition-based amplification. | Should include DNA polymerase, dNTPs, and optimized buffers. Probes/primers are often added separately by the user. |
| Target-Specific Assays | Primers and fluorescent probes for the gene of interest. | TaqMan-style hydrolysis probes are common. Assays must be highly specific and optimized for dPCR conditions [4]. |
| Microbiome Standards | Defined microbial communities to validate extraction and analysis. | Used to confirm even lysis of Gram-positive and Gram-negative bacteria and the accuracy of the overall quantitative workflow [2]. |
Critical Experimental Considerations for dPCR
- Optimize Input DNA Concentration: For ddPCR, target concentrations in the low three-digit copies/µl range are recommended for optimal performance [1]. Samples with very low target abundance (near the detection limit) show greater measurement uncertainty with any PCR method [1].
- Ensure Proper Partitioning and Thresholding: Adhere to the dMIQE (Minimum Information for Publication of Quantitative Digital PCR Experiments) guidelines [6]. This includes using a sufficient number of partitions (≥10,000), ensuring equal partition volume, and setting clear thresholds between positive and negative populations to minimize "rain" and ensure accurate counting.
- Validate Specificity and Account for Off-Target Amplification: Despite high specificity, non-target amplification can occur. For example, in viral quantification, amplicon sequencing of dPCR products can reveal and help correct for off-target amplification that leads to overestimation [7].
- Evaluate Economic and Workflow Factors: While dPCR provides superior quantification, researchers should note that it can involve higher costs per sample and less automation compared to standard qPCR, which may impact its use in very high-throughput routine screening [3].
Core Principles of Digital PCR
Digital PCR (dPCR) is a third-generation polymerase chain reaction technology that enables the absolute quantification of nucleic acid targets without the need for a standard curve [5] [8]. Its fundamental operation relies on three key principles: sample partitioning, end-point detection, and statistical analysis based on the Poisson distribution [5]. This calibration-free approach provides significant advantages in sensitivity, accuracy, and reproducibility over earlier PCR generations, making it particularly valuable for applications requiring precise molecular counting, such as detecting rare genetic mutations, monitoring minimal residual disease, and quantifying microbial abundance in complex samples [5] [9].
The core dPCR workflow begins with the partitioning of a PCR mixture containing the sample into thousands to millions of discrete compartments [5]. This step randomly distributes individual nucleic acid molecules across the partitions, with each compartment ideally containing zero, one, or a few target sequences [8]. Following amplification through thermal cycling, each partition undergoes end-point fluorescence analysis to determine whether amplification occurred [5]. The ratio of positive to negative partitions then enables absolute quantification of the original target concentration through Poisson statistical modeling, which accounts for the random distribution of molecules during partitioning [5] [8].
Technical Components and Workflow
Partitioning Methodologies
Two primary partitioning methods have been developed for dPCR systems, each with distinct characteristics and advantages:
Droplet Digital PCR (ddPCR): This method disperses the sample into nanoliter-sized droplets within an immiscible oil phase, typically generating 20,000 or more partitions through microfluidic systems [5] [10]. The water-in-oil emulsion requires precise stabilization with surfactants to prevent coalescence during thermal cycling [5]. ddPCR offers greater scalability and cost-effectiveness but requires careful emulsification control [5].
Chip-Based/Microchamber dPCR: This approach utilizes solid chips containing fixed arrays of microscopic wells or chambers [5]. Systems like the QIAcuity (Qiagen) and QuantStudio Absolute Q (Thermo Fisher Scientific) create 20,000 or more partitions in nanoliter volumes [5] [10]. Microchamber systems provide higher reproducibility and ease of automation but are typically limited by the fixed number of partitions and often have higher per-sample costs [5].
Detection Systems and Readout Technologies
Following amplification, dPCR systems employ one of two primary readout methods for end-point analysis:
In-line detection: Used predominantly in ddPCR systems, this method flows droplets sequentially through a microfluidic channel or capillary where they pass by a detection system that measures fluorescence one droplet at a time [5]. This allows for analysis of a large number of droplets but requires precise flow control [5].
Planar imaging: Used in microchamber-based systems, this approach captures a static snapshot of all partitions simultaneously using a fluorescence microscope or scanner [5]. This method provides a comprehensive view of all reactions at once and is typically faster for systems with fixed partition arrays [5].
Figure 1: Digital PCR Workflow. The dPCR process involves partitioning a sample into thousands of individual reactions, amplifying target nucleic acids, detecting fluorescence endpoints, and analyzing the binary data using Poisson statistics for absolute quantification [5] [8].
Poisson Statistics and Data Analysis
The mathematical foundation of dPCR relies on Poisson statistics to determine the absolute concentration of target nucleic acids in a sample. This statistical approach accounts for the random distribution of molecules that occurs during the partitioning process [5]. According to Poisson distribution principles, the probability of a partition containing one or more target molecules can be calculated, enabling precise quantification without reference standards [8].
The fundamental Poisson equation used in dPCR is:
λ = -ln(1 - p)
Where:
- λ represents the average number of target molecules per partition
- p is the proportion of positive partitions (positive/total)
- ln is the natural logarithm
This calculation assumes that nucleic acid molecules are randomly distributed among partitions according to Poisson statistics, with some partitions containing zero, one, or multiple target molecules [5]. The accuracy of quantification increases with higher partition numbers, as this provides better statistical resolution for distinguishing between positive and negative reactions [8].
Figure 2: Poisson Statistics in dPCR. The calculation of absolute target concentration in dPCR relies on determining the ratio of positive to negative partitions and applying the Poisson distribution equation to determine the initial nucleic acid concentration [5] [8].
Experimental Protocol: Absolute Quantification of 16S rRNA Genes for Microbial Abundance
Background and Application
This protocol describes the absolute quantification of 16S ribosomal RNA (rRNA) gene copies to determine prokaryotic abundance in complex samples, with applications in gut microbiome studies, environmental microbiology, and clinical diagnostics [9] [11]. The method combines the precision of dPCR with the high-throughput potential of subsequent sequencing analyses, enabling researchers to overcome the limitations of relative abundance measurements in microbiome studies [9].
Materials and Equipment
Research Reagent Solutions and Essential Materials
| Item | Function/Specification |
|---|---|
| dPCR Instrument | QIAcuity (Qiagen), QX200 (Bio-Rad), or equivalent |
| Universal 16S rRNA Primers/Probes | Target conserved regions of bacterial 16S rRNA gene |
| dPCR Master Mix | Commercial mix (e.g., QIAcuity Probe PCR Kit) |
| Restriction Enzymes | Optional (e.g., HaeIII, EcoRI) to improve DNA accessibility |
| DNA Extraction Kit | Validated for sample type (e.g., QIAamp DNA Mini Kit) |
| Nuclease-free Water | For reaction preparation |
Step-by-Step Procedure
Sample Preparation and DNA Extraction
- For stool samples: Homogenize 200 mg of sample in appropriate buffer [9] [11].
- For mucosal tissues: Limit input to approximately 8 mg due to high host DNA content that may saturate extraction columns [9].
- Extract DNA using a validated kit according to manufacturer's instructions, with optional incorporation of bead-beating for robust cell lysis [9].
- Quantify DNA concentration using fluorometric methods and note the values for subsequent normalization steps [11].
dPCR Reaction Setup
- Prepare 40 μL reaction mixtures containing:
- 10 μL of sample DNA (optimize dilution based on extraction concentration)
- 10 μL of 4× Probe PCR Master Mix
- 0.4 μM of each forward and reverse primer targeting 16S rRNA gene
- 0.2 μM of each specific probe (if using probe-based detection)
- Optional: 0.025 U/μL of restriction enzyme (e.g., HaeIII or EcoRI) to access difficult genomic regions [12]
- Nuclease-free water to volume
- Gently mix reactions by pipetting, avoiding bubble formation
- Prepare 40 μL reaction mixtures containing:
Partitioning and Thermocycling
- Load reactions into appropriate dPCR plates or cartridges
- For QIAcuity system: Use Nanoplate 26k 24-well plates [13]
- Initiate partitioning according to instrument specifications (approximately 26,000 partitions for QIAcuity system)
- Perform thermocycling with the following conditions:
- Initial activation: 2 minutes at 95°C
- 45 amplification cycles:
- Denaturation: 15 seconds at 95°C
- Annealing/Extension: 1 minute at 58°C (optimize based on primer Tm)
- Final hold: 10 minutes at 98°C (enzyme deactivation)
Endpoint Fluorescence Detection and Analysis
- For imaging-based systems: Acquire fluorescence images of all partitions at appropriate wavelengths for used probes/dyes [13]
- For droplet-based systems: Flow droplets through detection system for individual fluorescence measurement [5]
- Set fluorescence thresholds to distinguish positive from negative partitions using instrument software
- Export data including total partitions, positive partitions, and calculated concentration
Concentration Calculation and Normalization
- Software automatically calculates concentration based on Poisson distribution:
- Concentration (copies/μL) = [-ln(1 - p)] / partition volume
- Normalize to original sample mass:
- Copies/gram = (Concentration × Volume) / Sample mass
- For low-abundance targets, ensure minimum of 3 positive partitions for reliable detection [13]
- Software automatically calculates concentration based on Poisson distribution:
Performance and Validation
Table 1: Quantitative Performance Characteristics of dPCR for 16S rRNA Gene Quantification
| Parameter | Performance | Experimental Conditions |
|---|---|---|
| Linear Range | >5 orders of magnitude | From <0.5 to >3000 copies/μL input [12] |
| Limit of Detection (LOD) | 0.17-0.39 copies/μL | Varies by platform and reaction volume [12] |
| Limit of Quantification (LOQ) | 1.35-4.26 copies/μL | Platform-dependent [12] |
| Precision (CV) | 2.5-13% | Varies with target concentration and restriction enzyme [12] |
| Accuracy | ~2× across tissue types | When input >8.3×10⁴ 16S copies [9] |
Table 2: Comparison of dPCR Platform Performance Characteristics
| Parameter | QIAcuity ndPCR | QX200 ddPCR |
|---|---|---|
| Partition Number | ~26,000 | ~20,000 |
| Partition Volume | ~0.4 nL | ~1 nL |
| LOD | 0.39 copies/μL | 0.17 copies/μL |
| LOQ | 1.35 copies/μL | 4.26 copies/μL |
| Restriction Enzyme Impact | Moderate improvement with HaeIII | Significant improvement with HaeIII [12] |
Applications in Absolute Abundance Measurements
dPCR's capability for absolute quantification makes it particularly valuable for microbial ecology and microbiome research, where relative abundance data from sequencing can be misleading [9]. By providing exact copy numbers of target genes rather than proportions, dPCR enables researchers to distinguish between true changes in specific taxa and apparent changes caused by fluctuations in other community members [9] [11].
In a murine ketogenic diet study, absolute quantification through dPCR revealed that total microbial loads decreased on the diet, while relative abundance measurements alone could not determine whether individual taxa increased, decreased, or remained stable [9]. This demonstrates how dPCR anchoring provides critical additional information for accurate interpretation of microbial community dynamics in response to interventions [9].
The technology has been successfully applied to diverse sample types along the gastrointestinal tract, from microbe-rich stool samples to host-rich mucosal samples with varying microbial loads [9]. Quantitative limits differ by sample type, with lower limits of quantification (LLOQ) of 4.2×10⁵ 16S rRNA gene copies per gram for stool/cecum contents and 1×10⁷ copies per gram for mucosal samples due to column saturation effects from host DNA [9].
Absolute Quantification Without Standard Curves and Enhanced Sensitivity for Rare Targets
Digital PCR (dPCR) represents a third-generation polymerase chain reaction technology that enables the absolute quantification of nucleic acids without the need for standard curves [5]. This method operates by partitioning a PCR mixture into thousands to millions of individual reactions, so that each partition contains either zero, one, or a few nucleic acid targets according to a Poisson distribution [5]. Following PCR amplification, the fraction of positive partitions is measured via endpoint detection, allowing precise computation of the target concentration through Poisson statistics [5] [14]. This calibration-free technology presents powerful advantages including high sensitivity, absolute quantification, high accuracy and reproducibility, positioning it as an indispensable tool for modern molecular diagnostics and research [5].
The fundamental difference between dPCR and earlier PCR generations lies in its approach to quantification. While quantitative PCR (qPCR) relies on monitoring fluorescence during the exponential amplification phase and comparing results to standard curves, dPCR provides direct absolute quantification by counting individual molecules [15] [16]. This binary readout (positive or negative) for each partition effectively converts analog concentration measurements into digital counts, significantly enhancing precision and sensitivity, particularly for rare targets [14].
Fundamental Advantages of dPCR
Absolute Quantification Without Standard Curves
The independence from standard curves represents one of dPCR's most significant advantages [14]. In traditional qPCR, the accuracy of quantification depends heavily on the quality and fidelity of the standard curve used for interpolation [14]. Errors in preparing standards, pipetting variability, or differences in amplification efficiency between the standard and unknown samples can introduce significant error [14]. dPCR eliminates these sources of error by providing direct absolute quantification [14].
The mathematical foundation for dPCR quantification relies on Poisson statistics, which accounts for the random distribution of target molecules across partitions [5] [17]. The Poisson equation applied is: λ = -ln(1 - p), where λ is the average number of target DNA molecules per partition and p is the fraction of positive endpoint reactions [16]. This approach allows researchers to obtain results in discrete copy numbers per volume, providing true absolute quantification that is particularly valuable for applications requiring high precision [14].
Enhanced Sensitivity for Rare Targets
dPCR demonstrates exceptional sensitivity for detecting rare targets against a high background of wild-type sequences [5] [14]. This capability stems from the massive partitioning of the sample, which effectively dilutes the background while concentrating the signal for rare variants [14]. The technology can detect mutant alleles at frequencies below 0.001% in a wild-type background, offering sensitivity over 1000 times greater than conventional PCR methods [18].
The partitioning process also contributes to this enhanced sensitivity by reducing the effects of competition between targets during amplification [16]. In qPCR, signals from abundant wild-type sequences often dominate and obscure the detection of rare sequences, whereas dPCR's compartmentalization minimizes this competition, allowing sensitive detection of rare genetic variants [16]. This makes dPCR particularly suitable for liquid biopsy applications, where tumor-derived cell-free DNA often constitutes less than 0.1% of the total circulating cell-free DNA in blood plasma [14] [18].
Additional Technical Advantages
Beyond its core benefits, dPCR offers several additional technical advantages. The technology demonstrates remarkable resistance to PCR inhibitors, as these substances are distributed across all partitions, effectively diluting their concentration within any single partition and minimizing the impact on polymerase activity [14]. dPCR also provides a wide dynamic range, extending from single copies of nucleic acid to high concentrations, enabling both rare target detection and high-load quantification [14]. Furthermore, as an endpoint measurement method, dPCR does not rely on amplification kinetics, making it less susceptible to variations that affect qPCR Ct values [14].
Performance Data and Comparative Analysis
Quantitative Performance Metrics
Recent studies have systematically evaluated dPCR performance across various platforms and applications. The table below summarizes key performance metrics from recent research:
Table 1: Comparative Performance Metrics of Digital PCR Platforms
| Platform | Partitioning Mechanism | Limit of Detection (LOD) | Limit of Quantification (LOQ) | Dynamic Range | Precision (CV Range) |
|---|---|---|---|---|---|
| Nanoplate dPCR (QIAcuity) | Fixed nanowells [10] | 0.39 copies/μL input [12] | 54 copies/reaction [12] | <0.5 to >3000 copies/μL [12] | 7-11% [12] |
| Droplet dPCR (QX200) | Water-oil emulsion droplets [10] | 0.17 copies/μL input [12] | 85.2 copies/reaction [12] | <0.5 to >3000 copies/μL [12] | 6-13% [12] |
| Real-time RT-PCR | Bulk reaction | Varies with target and inhibitors [3] | Requires standard curves [3] | Limited by inhibition [3] | Typically higher [3] |
Application-Specific Performance
The superior performance of dPCR translates directly into enhanced capabilities for specific applications. In respiratory virus detection during the 2023-2024 tripledemic, dPCR demonstrated superior accuracy compared to Real-Time RT-PCR, particularly for high viral loads of influenza A, influenza B, and SARS-CoV-2, and for medium loads of RSV [3]. It showed greater consistency and precision than Real-Time RT-PCR, especially in quantifying intermediate viral levels [3].
For copy number variation (CNV) analysis, dPCR provides true quantitative data and molecular counts that enable detection of differences as low as 10%—without the need for standard curves [19]. This elevated sensitivity is crucial for applications like detecting HER2 gene amplification in breast cancer, where accurate CNV assessment directly impacts treatment decisions [19].
Experimental Protocols
Standard dPCR Workflow for Absolute Quantification
The following protocol outlines the core dPCR workflow for absolute quantification of nucleic acid targets:
Table 2: Key Research Reagent Solutions for dPCR
| Reagent Category | Specific Examples | Function | Application Notes |
|---|---|---|---|
| Partitioning Media | Water-oil emulsion surfactants [5] | Stabilizes partitions during thermal cycling | Critical for droplet integrity in ddPCR [5] |
| Lysis Buffers | Ambion Cell-to-Ct Buffer, SuperScript IV CellsDirect Buffer [17] | Cell membrane disruption and nucleic acid release | Buffer selection affects accuracy and linearity [17] |
| Restriction Enzymes | HaeIII, EcoRI [12] | Digest genomic DNA to reduce viscosity | Enzyme choice impacts precision; HaeIII showed superior performance [12] |
| PCR Master Mix | ddPCR Supermix for Probes [18] | Provides enzymes, nucleotides, and optimized buffer | Contains DNA polymerase, dNTPs, and reaction buffers [15] |
| Fluorogenic Probes | TaqMan probes (FAM, HEX) [5] | Sequence-specific detection | Different fluorophores enable multiplexing [5] |
Procedure:
- Sample Preparation: Extract nucleic acids using appropriate methods. For limited samples (<1000 cells), consider crude lysate preparation using Buffer 2 (from SuperScript IV CellsDirect cDNA Synthesis Kit) to minimize target loss [17].
- Reaction Mixture Assembly: Combine sample DNA, PCR master mix, primers, and fluorogenic probes in a total volume appropriate for the dPCR system [18]. For crude lysates, include a viscosity breakdown step: incubate at 75°C for 10 minutes, then cool to 4°C [17].
- Partitioning: Load reaction mixture into the dPCR instrument for partitioning:
- Thermal Cycling: Perform PCR amplification with optimized cycling conditions. Standard parameters include:
- Initial denaturation: 95°C for 10 minutes
- 40 cycles of: 94°C for 30 seconds and appropriate annealing temperature (e.g., 56-60°C) for 60 seconds
- Final extension: 72°C for 5 minutes [18]
- Endpoint Analysis: Measure fluorescence in each partition to identify positive (target-present) and negative (target-absent) reactions [5].
- Data Analysis: Apply Poisson statistics to calculate absolute target concentration using the formula: λ = -ln(1 - p), where p is the fraction of positive partitions [16]. Use instrument software for automated calculations and visualization.
Figure 1: Digital PCR Workflow for Absolute Quantification
Advanced Protocol for Rare Target Detection in Liquid Biopsies
This specialized protocol enhances sensitivity for detecting rare targets in cell-free DNA from liquid biopsies:
Optimized Sample Preparation:
- cfDNA Concentration: Increase cfDNA concentration by reducing elution volume 5-fold during extraction (1:50 sample-to-eluent ratio) [18].
- Sample Loading: Maximize sample input by eluting cfDNA directly in PCR reaction solution, increasing loading volume by 22-fold [18].
- Direct Detection Option: For unpurified samples, implement direct detection via heat treatment (95°C for 10 minutes) followed by centrifugation at 12,000 × g for 5 minutes to remove debris [18].
Enhanced Detection Parameters:
- Reaction Volume Scaling: Increase total reaction volume to accommodate higher sample input while maintaining proper partitioning efficiency [18].
- Partition Number Maximization: Optimize droplet generation to achieve maximum partitions (typically 20,000+ for ddPCR, 26,000+ for nanoplate systems) [3] [18].
- Background Tolerance: The assay can detect specific targets against 1200 ng of background cfDNA without restriction enzyme digestion [18].
Validation:
- Limit of Detection: Determine LOD using serial dilutions of positive control in negative background matrix.
- Concordance Testing: Validate against purified cfDNA samples; expected concordance rates: 55.6% (plasma), 66.7% (serum), 95.8% (surgical drain fluid) [18].
Figure 2: Enhanced Rare Target Detection Workflow
Applications in Research and Diagnostics
The unique advantages of dPCR have enabled its application across diverse fields. In clinical oncology, dPCR excels in liquid biopsy applications for detecting circulating tumor DNA, monitoring treatment response via minimal residual disease detection, and quantifying copy number variations in cancer genes like HER2 [5] [19]. For infectious disease diagnostics, dPCR provides absolute quantification of viral loads with superior accuracy compared to qPCR, particularly for HIV, hepatitis B, CMV, and respiratory viruses including SARS-CoV-2, influenza, and RSV [3] [14]. In gene therapy development, dPCR enables precise determination of vector copy number per cell, critical for safety and dosing studies [10] [14]. Additionally, dPCR has become invaluable for non-invasive prenatal testing, where it accurately quantifies fetal DNA fragments in maternal plasma, and environmental monitoring, where it detects trace levels of pathogens or genetically modified organisms [14].
The technology's exceptional performance with limited samples has also enabled new research applications. Recent studies have successfully quantified rare T-cell receptor excision circles (TRECs) from as few as 200 cells using optimized crude lysate ddPCR methods, demonstrating the potential for dPCR in minimal sample contexts [17]. Similar approaches have been applied to fixed and permeabilized cells, further expanding the technology's utility in clinical research settings where sample availability is often constrained [17].
Digital PCR (dPCR) represents the third generation of polymerase chain reaction technology, following conventional PCR and real-time quantitative PCR (qPCR) [5] [20]. This powerful technique enables absolute quantification of nucleic acids without the need for standard curves, providing unprecedented precision and sensitivity for molecular analysis [5] [21]. The fundamental principle of dPCR involves partitioning a PCR mixture into thousands of individual reactions so that each partition contains either zero, one, or a few nucleic acid targets according to a Poisson distribution [5]. Following PCR amplification, the fraction of positive partitions is counted via endpoint measurement, allowing computation of the target concentration using Poisson statistics [5] [21]. This calibration-free technology presents significant advantages including high sensitivity, absolute quantification, accuracy, reproducibility, and rapid turnaround time [5].
Historical Development
Early Foundations: Limiting Dilution Principles
The conceptual foundations of dPCR were established through pioneering work in limiting dilution techniques. In 1989, Peter Simmonds utilized limiting dilution PCR to detect single copies of HIV provirus in infected cells, demonstrating that disease stage correlated with the proportion of infected Peripheral Blood Mononuclear Cells [5]. This approach revealed infection ratios ranging from 1 per 5000 to 80,000 cells for asymptomatic patients to 1 per 700 to 3300 cells for late-stage patients [5].
Three years later, Morley and Sykes formally combined limiting dilution PCR with Poisson statistics to isolate, detect, and quantify single nucleic acid molecules, laying the foundational principles for digital PCR [5]. In their landmark study, sample dilutions were replicated, PCR-amplified, and analyzed by gel electrophoresis, enabling accurate counting of target molecules based on the fraction of negative partitions [5]. The researchers successfully detected mutated IgH rearranged heavy chain genes in bone marrow samples from leukemia patients at sensitivities as low as 2 targets in 160,000 wild-type sequences [5].
The Birth of Digital PCR
The term "digital PCR" was officially coined in 1999 by Bert Vogelstein and colleagues [5] [20]. Their work developed a workflow involving limiting dilution distributed across 96-well plates combined with fluorescence readout to detect mutations of the RAS oncogene in stool samples from colorectal cancer patients [5]. This methodology represented a significant advancement, but the reliance on microtiter plates limited its practical application and efficiency.
Key technological improvements followed rapidly. In 1997, Olga Kalinina and collaborators introduced volume miniaturization using microcapillaries (approximately 10 nL) for the partition process, substantially reducing reagent costs and improving amplification efficiency [5]. In 2003, Vogelstein's group reported the BEAMing technology (Beads, Emulsion, Amplification, and Magnetics), which significantly simplified the compartmentalization process by utilizing water-in-oil droplets for parallel PCR amplification [5]. This method involved encapsulating individual DNA molecules with magnetic beads coated with primers, permitting PCR amplification within droplets, with amplified products subsequently recovered magnetically and analyzed by flow cytometry [5].
Diagram 1: Historical progression of dPCR from limiting dilution to modern systems.
Evolution of Commercial dPCR Platforms
Path to Commercialization
The commercialization of dPCR systems began in 2006 when Fluidigm introduced the first compartment-based dPCR nanofluidic platform [5]. This system featured an integrated fluidic circuit (IFC) that automatically loaded samples into microchambers using on-chip valves, combined with a fluorescence analyzer with or without an integrated thermocycler [5]. Although no longer commercially available, this platform demonstrated efficacy for detecting bacterial signatures, measuring gene expression in tissues, and determining gene copy numbers in breast cancer samples [5].
The commercial landscape expanded significantly with the introduction of Applied Biosystems' Quantstudio 3D (QS3D) in 2013, which was originally developed as the Open Array Platform by BioTrove before being acquired by Life Technologies [5]. Formulatrix entered the market with its Constellation dPCR instrument, which was acquired by Qiagen in 2019 and rebranded as QIAcuity in 2020 [5]. Roche launched its Digital LightCycler system in 2022, further expanding commercial options [5].
Modern dPCR Platform Technologies
Current commercial dPCR platforms utilize two primary partitioning methodologies: droplet-based systems and chip-based systems [5]. Droplet digital PCR (ddPCR) systems generate thousands of nanoliter-sized droplets within an immiscible oil phase, typically using microfluidic chips that leverage passive or active forces to break the aqueous/oil interface [5]. These systems require careful stabilization with surfactants to prevent droplet coalescence during thermal cycling [5].
In contrast, microchamber-based dPCR utilizes arrays of thousands of microscopic wells or chambers embedded in a solid chip [5]. While ddPCR offers greater scalability and cost-effectiveness, microchamber dPCR provides higher reproducibility and ease of automation but is typically limited by a fixed number of partitions and higher costs [5].
Readout technologies also differ between platforms, with either in-line detection (common in ddPCR) where droplets flow through a microfluidic channel and are measured individually, or planar imaging where microchambers or microdroplets are imaged using fluorescence microscopy or scanning [5]. Three-dimensional imaging and analysis techniques have been developed to assay larger numbers of droplets in shorter timeframes [5].
Current Commercial dPCR Platform Landscape
The dPCR market has experienced robust growth, with the global PCR technologies market projected to advance at a CAGR of 7.0% from 2024 to 2030, reaching US$21.89 billion [22]. The dPCR platforms market specifically is characterized by moderate concentration, with major players including Thermo Fisher Scientific, Bio-Rad Laboratories, and Roche Diagnostics collectively commanding an estimated 60-70% market share [23].
Table 1: Commercial dPCR Platforms and Technical Specifications
| Brand | Instrument | Launch Date | Partitioning Technology | Number of Partitions | Analysis Channels |
|---|---|---|---|---|---|
| Fluidigm | IFC-based system | 2006 | Microchambers | Not specified | Not specified |
| Applied Biosystems | Quantstudio 3D | 2013 | Microchambers | 20,000 | Not specified |
| Bio-Rad | QX200 | Not specified | Droplet-based | 20,000 | 2-Color [12] |
| Qiagen | QIAcuity | 2020 | Nanoplate-based | 26,000-30,000 [3] [12] | 5-Target multiplex [3] |
| Roche | Digital LightCycler | 2022 | Not specified | Not specified | Not specified |
Recent comparative studies have evaluated the performance characteristics of different dPCR platforms. One 2025 study compared the QX200 droplet digital PCR system from Bio-Rad with the QIAcuity One nanoplate digital PCR system from QIAGEN using synthetic oligonucleotides and DNA from Paramecium tetraurelia [12]. Both platforms demonstrated similar detection and quantification limits with high precision across most analyses [12].
The QIAcuity system employs fixed nanowells on a microfluidic chip, facilitating high-throughput processing and seamless integration with automated workflows [3]. While both droplet-based and nanowell-based platforms offer comparable sensitivity and precision, the QIAcuity system allows for faster setup and reduced sample handling, making it particularly suitable for high-throughput laboratory environments [3].
Table 2: Performance Comparison of dPCR Platforms [12]
| Performance Metric | QIAGEN QIAcuity (ndPCR) | Bio-Rad QX200 (ddPCR) |
|---|---|---|
| Limit of Detection (LOD) | 0.39 copies/μL input | 0.17 copies/μL input |
| Limit of Quantification (LOQ) | 1.35 copies/μL input | 4.26 copies/μL input |
| Best Precision Range | 31-534 copies/μL input | ~270 copies/μL input |
| Coefficient of Variation Range | 7-11% | 6-13% |
| Reaction Volume | 40μL | 20μL |
Application Notes: Absolute Microbial Abundance Quantification
Experimental Protocol for Prokaryotic Abundance Measurement
Background: Information about absolute microbial abundance is lost with standard metagenomic sequencing, making comparative analysis of microbial ecosystems challenging [11]. While methods to measure absolute microbial abundance exist, they are technically demanding and require costly additional experiments [11].
Objective: To predict absolute prokaryotic abundance using a machine learning model based on readily available sample measurements, avoiding the need for digital PCR in routine applications [11].
Materials:
- Stool samples from clinical populations (e.g., hematopoietic cell transplantation patients)
- DNA extraction kit
- Digital PCR system with universal 16S ribosomal RNA gene primers
- Metagenomic sequencing capabilities
- Computational resources for machine learning
Methods:
Sample Processing:
- Process stool samples in a standardized way to minimize variance from differing stool amounts used for DNA extraction
- Randomly distribute samples across 96-well plates for DNA extraction to avoid systematic bias
Absolute Abundance Measurement:
- Perform ddPCR with universal primers for the 16S ribosomal RNA gene (16S)
- Set 16S copies for overly dilute samples (n=16) to the lower limit of detection
- Remove samples producing insufficient droplets (n=10) from analysis
- Express results as absolute number of 16S copies per DNA extraction
Metagenomic Sequencing:
- Conduct shotgun metagenomic sequencing for taxonomic characterization
- Calculate prokaryotic alpha diversity (Shannon diversity)
- Determine relative abundance of high-level taxonomic groups (Eukarya, Archaea, Bacteria)
- Compute fraction of human reads
Machine Learning Model Development:
- Train random forest model using DNA concentration as primary input
- Employ ten times-repeated 10-fold cross-validation strategy
- Develop "full" model incorporating additional parameters:
- High-level domain taxonomic information
- Fraction of human reads
- Prokaryotic alpha diversity
- Sample storage type (same-day versus next-day freezing)
- Evaluate model performance using Spearman correlation, Pearson's r, R², MSE, and concordance correlation coefficient
Results Interpretation: The DNA-only model achieved a Spearman correlation of 0.89 between measured and predicted values [11]. The full model demonstrated improved performance with Spearman correlation of 0.91, outperforming the DNA-only model across multiple metrics (p=0.0003, paired t-test) [11]. Feature importance analysis revealed DNA concentration carried the strongest relative model weight, followed by fraction of host reads in sequencing and prokaryotic alpha diversity [11]. Sample storage type showed minimal impact on absolute prokaryotic abundance prediction [11].
Diagram 2: Workflow for predicting absolute prokaryotic abundance using machine learning.
Essential Research Reagent Solutions
Table 3: Key Research Reagents for dPCR Experiments
| Reagent/Material | Function | Application Notes |
|---|---|---|
| Universal 16S rRNA Primers | Amplification of prokaryotic 16S ribosomal RNA gene | Enables absolute quantification of prokaryotic load [11] |
| DNA Extraction Kits | Isolation of high-quality DNA from complex samples | Standardized protocols minimize variance [11] |
| Restriction Enzymes (HaeIII, EcoRI) | Fragment DNA for improved accessibility | HaeIII demonstrated higher precision than EcoRI in copy number analysis [12] |
| Probe-Based Fluorescence Chemistry | Target-specific detection in multiplex assays | Different excitation colors enable multiplexing [5] |
| EVAGreen/SYBR Green Dyes | Double-stranded DNA binding for detection | Alternative to probe-based chemistry [12] |
| Microfluidic Chips/Cartridges | Sample partitioning into nanoliter reactions | Platform-specific consumables [5] |
| PCR Master Mix | Contains DNA polymerase, dNTPs, buffers | Optimized for partitioning and endpoint amplification [5] |
The evolution of dPCR from its origins in limiting dilution techniques to modern commercial platforms represents a significant advancement in molecular quantification. The technology's capacity for absolute quantification without standard curves has enabled applications across diverse fields including clinical diagnostics, microbial ecology, and biotechnology. Current commercial platforms offer researchers multiple options depending on throughput requirements, precision needs, and budget constraints. The integration of dPCR with machine learning approaches, as demonstrated in absolute prokaryotic abundance prediction, highlights the continuing innovation in quantitative molecular analysis. As the technology continues to evolve with improvements in multiplexing, automation, and cost-effectiveness, dPCR is poised to expand its role in both basic research and clinical applications.
From Theory to Bench: dPCR Workflows for Absolute Abundance in Research and Diagnostics
Digital PCR (dPCR) represents a third-generation PCR technology that enables absolute quantification of nucleic acids without requiring standard curves, providing a significant advantage over quantitative PCR (qPCR) for absolute abundance measurements [5] [24]. This technique operates by partitioning a PCR mixture into thousands of individual reactions, each acting as a binary event—either positive or negative for the target nucleic acid [10]. The exact concentration is then statistically calculated via Poisson distribution based on the fraction of positive partitions [10] [5]. The two primary dPCR platforms discussed in this application note are Droplet Digital PCR (ddPCR) and Chip-based Digital PCR (cdPCR), which differ fundamentally in their partitioning mechanisms [10] [25].
In ddPCR, partitioning occurs through a water-oil emulsion system that generates tens of thousands of nanoliter-sized droplets [25]. In chip-based systems, the sample is distributed across a plate containing fixed micro-wells or nanowells [10] [25]. For researchers designing workflows for absolute abundance measurements, understanding the technical distinctions, performance characteristics, and practical implications of each platform is essential for generating robust, reproducible data.
Platform Comparison: Technical Specifications and Performance
Key Platform Differences and Characteristics
Table 1: Comparative Analysis of Digital PCR Partitioning Methods
| Parameter | Droplet Digital PCR (ddPCR) | Chip-Based Digital PCR (cdPCR) | Nanoplate dPCR |
|---|---|---|---|
| Partitioning Mechanism | Water-oil emulsion droplets [10] [25] | Fixed micro-wells/microchambers [10] [25] | Microfluidic digital PCR plate [25] |
| Number of Partitions | 20,000 (QX200) up to 80 million (RainDrop Plus) [25] | 10,000 - 45,000 (chip-based) [25] | 8,500 - 26,000 (QIAcuity) [25] |
| Partition Volume | Picoliters to nanoliters (10-100 pL) [25] | Nanoliters (~10 nL) [25] | Nanoliters (~10 nL) [25] |
| Multiplexing Capability | Limited (typically 2-4 targets); newer models up to 12 targets [10] | Varies by system | High (up to 5-plex routinely) [10] [25] |
| Throughput (samples/run) | Moderate (e.g., 480 samples across 5 plates for QX One) [25] | Lower (e.g., 16 samples for Thermo Fisher system) [25] | High (312-1248 samples for QIAcuity) [25] |
| Typical Workflow Time | Lengthy (6-8 hours for ddPCR) [10] | Moderate (2.5-3 hours for chip systems) [25] | Fast (<2 hours for QIAcuity) [25] |
| Primary Instruments Needed | Multiple (droplet generator, thermocycler, droplet reader) [10] [25] | Varies (often integrated systems) | Single integrated instrument [10] [25] |
Performance Comparison in Experimental Settings
Recent comparative studies provide empirical data on the performance characteristics of different dPCR platforms:
Table 2: Experimental Performance Metrics from Comparative Studies
| Performance Metric | ddPCR (Bio-Rad QX200) | Nanoplate dPCR (QIAGEN QIAcuity) | Experimental Context |
|---|---|---|---|
| Limit of Detection (LOD) | 0.17 copies/μL input [12] | 0.39 copies/μL input [12] | Synthetic oligonucleotides [12] |
| Limit of Quantification (LOQ) | 4.26 copies/μL input (85.2 copies/reaction) [12] | 1.35 copies/μL input (54 copies/reaction) [12] | Synthetic oligonucleotides [12] |
| Precision (Coefficient of Variation) | 6% - 13% (oligonucleotides) [12] | 7% - 11% (oligonucleotides) [12] | Synthetic oligonucleotides [12] |
| Impact of Restriction Enzyme | Significant (CV: 2.5%-62.1% with EcoRI; <5% with HaeIII) [12] | Moderate (CV: 0.6%-27.7% with EcoRI; 1.6%-14.6% with HaeIII) [12] | Paramecium tetraurelia DNA [12] |
| Correlation with Gold Standard | 95% concordance with PFGE for CNV [4] | Strong correlation with ddPCR (r=0.954) for methylation [26] | Copy Number Variation [4] and DNA methylation [26] |
| Specificity/Sensitivity | Specificity: 100%; Sensitivity: 98.03% [26] | Specificity: 99.62%; Sensitivity: 99.08% [26] | CDH13 methylation in FFPE samples [26] |
Workflow Design and Experimental Protocols
Digital PCR Workflow Comparison
Sample Preparation Protocol
Protocol 1: Universal Sample Preparation for Digital PCR
Materials:
- Source DNA/RNA (purified)
- dPCR Master Mix (commercially available)
- Target-specific primers and probes
- Nuclease-free water
- Restriction enzymes (optional, for complex genomes)
Procedure:
Nucleic Acid Quantification and Quality Assessment
Reaction Mixture Preparation
Restriction Digestion (If Required)
- Incubate with appropriate restriction enzyme (e.g., HaeIII demonstrated superior precision vs. EcoRI) [12].
- Duration: 15-60 minutes at enzyme-specific temperature.
- Enzyme inactivation (if required): 65°C for 20 minutes.
Table 3: Reaction Mixture Components
| Component | ddPCR (20µL Reaction) | Chip-based dPCR (12µL Reaction) | Function |
|---|---|---|---|
| Master Mix | 10µL of 2× ddPCR Supermix [26] | 3µL of 4× Probe PCR Master Mix [26] | Provides enzymes, dNTPs, buffer |
| Forward Primer | 0.45µL (450 nM final) [24] | 0.96µL (variable concentration) [26] | Target-specific forward amplification |
| Reverse Primer | 0.45µL (450 nM final) [24] | 0.96µL (variable concentration) [26] | Target-specific reverse amplification |
| Probe(s) | 0.45µL each (250 nM final) [24] | 0.48µL each (variable concentration) [26] | Sequence-specific fluorescent detection |
| Template DNA | 2-5µL (50ng total recommended) [24] | 2.5µL (variable amount) [26] | Target nucleic acid for amplification |
| Nuclease-free Water | To 20µL final volume | To 12µL final volume | Reaction volume adjustment |
Platform-Specific Protocols
Protocol 2A: Droplet Digital PCR Workflow (Bio-Rad QX200 System)
Materials:
- Prepared reaction mixture (from Protocol 1)
- DG8 Cartridges and Gaskets
- Droplet Generation Oil
- PCR Plate
- Thermal Sealer
Procedure:
Droplet Generation
Endpoint PCR Amplification
- Transfer 40µL droplet emulsion to 96-well PCR plate [26].
- Seal plate with foil heat seal.
- Perform endpoint PCR with optimized protocol:
Droplet Reading and Analysis
Protocol 2B: Chip-based Digital PCR Workflow (QIAGEN QIAcuity System)
Materials:
- Prepared reaction mixture (from Protocol 1)
- QIAcuity Nanoplate (24-well or 96-well)
- Sealing foil
Procedure:
Nanoplate Loading
Integrated Partitioning and PCR
- Load sealed nanoplate into QIAcuity instrument.
- The system automatically:
Imaging and Analysis
Application-Specific Protocol: Methylation Analysis
Protocol 3: DNA Methylation Quantification in FFPE Samples
This protocol was adapted from a recent comparative study analyzing CDH13 gene methylation in breast cancer FFPE samples [26].
Materials:
- FFPE tissue sections
- DNeasy Blood and Tissue Kit (Qiagen) [26]
- EpiTect Bisulfite Kit (Qiagen) [26]
- Methylation-specific primers and probes (FAM for methylated, HEX for unmethylated) [26]
Procedure:
DNA Isolation from FFPE Tissue
Bisulfite Conversion
- Convert 1μg isolated DNA using EpiTect Bisulfite Kit [26].
- Follow manufacturer's protocol for conversion conditions.
- Elute in nuclease-free water.
dPCR Reaction Setup
- Prepare reaction mixture as in Protocol 1 with methylation-specific assay.
- Use primers/probes targeting converted methylated and unmethylated sequences [26].
- For CDH13 promoter region analysis, use:
dPCR Run and Data Analysis
Platform Selection Guide and Research Reagent Solutions
Decision Framework for Platform Selection
Essential Research Reagent Solutions
Table 4: Key Research Reagent Solutions for Digital PCR Workflows
| Reagent Category | Specific Examples | Function & Importance | Application Notes |
|---|---|---|---|
| Nucleic Acid Isolation Kits | DNeasy Blood & Tissue Kit [26], MagMax Viral/Pathogen Kit [3] | High-quality input material critical for quantification accuracy | FFPE-specific protocols available for degraded samples [26] |
| Bisulfite Conversion Kits | EpiTect Bisulfite Kit [26] | Converts unmethylated cytosines to uracils for methylation analysis | Essential for epigenetic applications; quality impacts sensitivity [26] |
| dPCR Master Mixes | ddPCR Supermix for Probes [26] [24], QIAcuity Probe PCR Master Mix [26] | Optimized buffer systems with polymerase, dNTPs, stabilizers | Platform-specific formulations enhance performance |
| Fluorescent Probes | FAM, HEX/VIC, CY5-labeled TaqMan probes [26] | Sequence-specific detection with different emission spectra | Multiplexing capacity limited by instrument optical channels [25] |
| Restriction Enzymes | HaeIII, EcoRI [12] | Digest complex DNA to improve target accessibility | Enzyme selection significantly impacts precision, especially in ddPCR [12] |
| Partitioning Reagents | Droplet Generation Oil [26], NanoPlate Sealing Foil | Creates stable partitions for digital amplification | Critical for partition integrity during thermal cycling |
The choice between droplet-based and chip-based digital PCR platforms involves careful consideration of multiple factors, including workflow efficiency, partitioning density, multiplexing requirements, and sample type. While both technologies provide exceptional sensitivity and absolute quantification capabilities, chip-based systems generally offer streamlined, automated workflows advantageous for quality-controlled environments, whereas droplet systems can provide extremely high partition numbers beneficial for rare variant detection.
For researchers implementing digital PCR for absolute abundance measurements, careful attention to sample preparation, restriction enzyme selection, and platform-specific optimization is essential for generating precise, reproducible data. The protocols provided in this application note offer a foundation for robust experimental design across various applications, from viral quantification to methylation analysis. As the technology continues to evolve, both platforms are demonstrating strong performance in comparative studies, enabling researchers to select systems based on their specific experimental needs and resource constraints.
Absolute quantification of prokaryotic abundance is crucial for accurate microbiome analysis, correcting inherent biases in relative abundance data from next-generation sequencing. This application note details a rigorous, step-by-step protocol for quantifying absolute prokaryotic concentration in stool samples using 16S rRNA droplet digital PCR (ddPCR), a method praised for its high sensitivity and calibration-free absolute quantification [27] [8]. By integrating the precision of ddPCR with high-throughput sequencing data, this framework enables researchers to convert relative taxonomic abundances into absolute counts, providing a more accurate picture of microbial community dynamics [9]. The protocol, which can process approximately 80 samples in four days, is presented within the broader context of digital PCR anchoring for absolute abundance measurements, a key advancement in quantitative microbiome research [28] [9].
In microbiome research, standard 16S rRNA gene amplicon sequencing provides data on the relative abundance of microbial taxa—the proportion of each taxon within a sample. A fundamental limitation of this approach is that an increase in one taxon's relative abundance necessarily leads to an apparent decrease in all others, which can be misleading [9]. For instance, a measured increase in a taxon's ratio could mean that the taxon has genuinely increased, that other taxa have decreased, or a combination of both; relative data alone cannot distinguish between these scenarios [9].
Absolute quantification resolves this ambiguity by measuring the exact number of target molecules per unit of sample. ddPCR achieves this by partitioning a PCR reaction into thousands of nanoliter-sized droplets, effectively performing thousands of parallel PCR reactions. Following amplification, the fraction of positive droplets is counted, and the original target concentration is calculated using Poisson statistics, without the need for a standard curve [27] [8] [28]. This protocol describes how to apply ddPCR to quantify the 16S rRNA gene, a universal prokaryotic marker, thereby providing the total microbial load. When combined with metagenomic sequencing data, these absolute counts can be transformed into taxon-specific absolute concentrations, offering a powerful, quantitative view of the microbiome [28] [9].
Comparative Analysis of Quantitative Methods
The following table summarizes the key characteristics of qPCR and ddPCR for the absolute quantification of the 16S rRNA gene.
Table 1: Comparison of 16S rRNA Quantification by qPCR and ddPCR
| Feature | Quantitative PCR (qPCR) | Droplet Digital PCR (ddPCR) |
|---|---|---|
| Principle | Relative quantification against a standard curve. | Absolute quantification by end-point counting of positive partitions. |
| Quantification Type | Relative; requires external standards for absolute values. | Absolute, calibration-free [27] [28]. |
| Sensitivity & Precision | High, but dependent on standard curve accuracy. | High sensitivity and accuracy, ideal for detecting low-abundance targets [27] [8]. |
| Dynamic Range | Wide, but can be constrained by the standard curve. | Demonstrated effectiveness over a wide range of microbial loads [9]. |
| Resilience to Inhibitors | PCR efficiency can be significantly affected. | More tolerant to PCR inhibitors due to sample partitioning. |
| Throughput | ~80 samples in 4 days [28]. | ~80 samples in 4 days [28]. |
| Ideal Use Case | Well-established labs with resources for reliable standard curves. | Applications requiring high accuracy, absolute quantification, and detection of rare targets [28] [29]. |
Experimental Workflow and Protocol
The complete workflow for absolute prokaryotic load measurement, from sample preparation to data analysis, is outlined below.
Diagram 1: Complete workflow for absolute quantification of prokaryotes using 16S rRNA ddPCR.
Detailed Step-by-Step Protocol
Day 1: Sample Preparation and DNA Extraction
- Sample Homogenization: Resuspend frozen stool samples in an appropriate buffer (e.g., PBS or a commercial stabilization solution) to create a homogeneous slurry.
- Moisture Content Measurement: Dry a small, pre-weighed aliquot of the sample (e.g., 100 µL of slurry) in an oven at 100-105°C for 4-6 hours or until constant weight is achieved. Calculate the moisture content and dry weight to enable final results to be expressed per dry gram if required [28].
- DNA Extraction:
- Perform DNA extraction using a validated kit suitable for complex samples like stool.
- The maximum recommended input is 200 mg for stool and 8 mg for mucosal samples due to the high host DNA content in the latter, which can saturate extraction columns [9].
- Include negative extraction controls (blanks) to monitor for contamination of the 16S rRNA gene [28] [9].
- Validation: The protocol has been validated to show near-complete and even recovery of microbial DNA from a defined community spiked into stool and mucosa over a 5-order-of-magnitude concentration range [9].
Day 2: ddPCR Reaction Setup and Amplification
- Reaction Setup:
- Prepare the ddPCR reaction mix containing:
- ddPCR Supermix for Probes (no dUTP).
- Forward and reverse primers targeting the 16S rRNA gene (e.g., V3-V4 region).
- A fluorescent probe (e.g., FAM-labeled) specific to the 16S rRNA gene.
- The extracted DNA template.
- A known concentration of an exogenous control (e.g., a synthetic gene not found in the sample) can be spiked in for advanced quality control, though it is not mandatory for absolute quantification with ddPCR [9].
- Prepare the ddPCR reaction mix containing:
- Droplet Generation:
- PCR Amplification:
Day 3: Droplet Reading and Data Acquisition
- Plate Reading: Place the PCR-amplified plate into a droplet reader. This instrument flows droplets in a stream past a two-color optical detection system.
- Fluorescence Detection: The reader measures the fluorescence intensity of each droplet in at least two channels (typically FAM and HEX). Droplets that contain the amplified 16S rRNA target will show high fluorescence in the relevant channel (FAM), while negative droplets will show background fluorescence [30].
Day 4: Data Analysis and Integration
- Threshold Analysis and Concentration Calculation:
- Use the manufacturer's software (e.g., QuantaSoft) or open-source tools (e.g., the
ddpcrR package) to set a fluorescence threshold that discriminates between positive and negative droplets [30]. - The software automatically calculates the absolute concentration of the 16S rRNA gene in the original sample (in copies/µL) based on the fraction of positive droplets and the application of Poisson statistics [27] [28].
- Use the manufacturer's software (e.g., QuantaSoft) or open-source tools (e.g., the
- Normalization to Sample Mass:
- Convert the concentration (copies/µL) to 16S rRNA gene copies per gram of stool (either wet or dry weight) using the volume of sample used in DNA extraction and the dilution factors.
- Integration with Sequencing Data (Optional):
The Scientist's Toolkit: Research Reagent Solutions
Table 2: Essential Materials and Reagents for 16S rRNA ddPCR
| Item | Function/Description | Example/Note |
|---|---|---|
| ddPCR System | Instrument platform for droplet generation, thermal cycling, and fluorescence reading. | Bio-Rad QX200 system or similar. |
| ddPCR Supermix | Optimized reaction mix for robust amplification in droplets. | Bio-Rad ddPCR Supermix for Probes (no dUTP). |
| 16S rRNA Primers & Probe | Assay for specific amplification and detection of the prokaryotic 16S rRNA gene. | Primers targeting a conserved region (e.g., V3-V4); TaqMan probe (e.g., FAM-labeled). |
| DNA Extraction Kit | For efficient and unbiased lysis of diverse prokaryotes and purification of DNA. | Kits validated for soil/stool (e.g., MoBio PowerSoil Kit). |
| Droplet Generator | Creates the water-in-oil emulsion, partitioning the sample. | Often integrated into the ddPCR system. |
| Analysis Software | For droplet fluorescence analysis, threshold setting, and concentration calculation. | Bio-Rad QuantaSoft; R package ddpcr for advanced analysis [30]. |
Critical Considerations and Troubleshooting
- Lower Limit of Quantification (LLOQ): The protocol has a defined LLOQ. For stool and cecum contents, the LLOQ is 4.2 × 10⁵ 16S rRNA gene copies per gram. For mucosal samples, which have a high host DNA content, the LLOQ is higher, at 1 × 10⁷ copies per gram [9].
- Contamination Control: The high sensitivity of ddPCR makes it susceptible to false positives from contaminating 16S rRNA DNA present in reagents or the laboratory environment. The use of negative controls is essential to identify and account for this background [28].
- Data Quality Assessment: Samples with a total microbial load below 1 × 10⁴ 16S rRNA gene copies are prone to the detection of contaminants and "dropout" of the lowest abundance taxa, compromising data reliability [9].
- Choice of Anchoring Method: While this protocol uses dPCR, other anchoring methods exist, such as spiked internal standards and flow cytometry. The dPCR-based method was selected for this protocol because PCR is already an integral part of sequencing workflows and dPCR has been extensively validated for nucleic acid quantification, making it a robust and accessible choice [9].
The accurate quantification of viable microorganisms is a critical requirement across multiple scientific disciplines, including microbial ecology, pharmaceutical development, and clinical diagnostics. Traditional molecular methods, particularly quantitative PCR (qPCR), cannot distinguish between DNA from live cells and that from dead cells or extracellular sources, leading to potential overestimation of viable populations [31]. This limitation is especially problematic when evaluating antimicrobial treatments or assessing the quality of probiotic products where viability is directly linked to efficacy [32].
The integration of propidium monoazide (PMA) with digital PCR (dPCR) creates a powerful solution to this challenge. PMA is a viability dye that selectively penetrates membrane-compromised cells and binds to DNA upon photoactivation, thereby inhibiting its amplification in subsequent PCR reactions [33]. When combined with the absolute quantification capabilities of dPCR, this approach enables precise enumeration of intact cells without the need for culture-based methods [34]. This application note details optimized PMA-dPCR workflows for robust intact cell quantification, framed within the broader context of dPCR anchoring strategies for absolute abundance measurements in microbial communities.
Principle of PMA-dPCR
PMA Mechanism of Action
PMA functions as a DNA intercalating dye with selective membrane permeability. In viable cells with intact membranes, PMA is excluded and cannot interact with genomic DNA. In non-viable cells with compromised membranes, PMA enters the cell and intercalates with DNA. Upon exposure to bright light, the azide group on PMA is activated, forming a stable covalent bond with the DNA backbone. This modification sterically hinders DNA polymerase activity during PCR, effectively preventing amplification of DNA from dead cells [33] [32]. Consequently, only DNA from viable, membrane-intact cells is amplified and detected.
Digital PCR Advantage
Digital PCR provides absolute quantification of nucleic acid targets without requiring standard curves. The technology partitions a PCR reaction into thousands of nanoscale reactions, effectively diluting the sample to the point where some partitions contain zero, one, or a few target molecules [5]. Following endpoint PCR amplification, the fraction of positive partitions is counted, and the absolute concentration of the original target is calculated using Poisson statistics [13]. This partitioning makes dPCR particularly resistant to PCR inhibitors present in complex sample matrices and provides superior precision for quantifying low-abundance targets compared to qPCR [13] [34].
The following diagram illustrates the integrated PMA-dPCR workflow, from sample treatment through to quantitative analysis:
Figure 1: PMA-dPCR Workflow for Viable Cell Quantification. The process integrates PMA treatment to selectively exclude DNA from membrane-compromised cells, followed by dPCR for absolute quantification of intact cells.
Key Research Reagent Solutions
Successful implementation of PMA-dPCR requires careful selection of reagents and materials. The following table details essential components and their functions within the workflow:
Table 1: Essential Research Reagents for PMA-dPCR Workflows
| Reagent/Material | Function | Application Notes |
|---|---|---|
| PMAxx Dye (Biotium) | Selective DNA binding in membrane-compromised cells | 20 mM stock in H₂O; working concentrations typically 2.5-50 µM [31] [33] |
| Digital PCR System | Absolute quantification via sample partitioning | Platforms: QIAcuity (Qiagen), QX200 (Bio-Rad), QuantStudio (Thermo Fisher) [13] [5] |
| DNA Extraction Kit | Efficient lysis and purification of microbial DNA | Must be compatible with sample matrix (e.g., soil, stool, bark) [9] [11] |
| Specific Primers/Probes | Target amplification and detection | Designed for target specificity; amplicon length affects PMA efficacy [33] [32] |
| Partitioning Oil/Surfactant | Stable droplet or chamber formation | Critical for maintaining partition integrity during thermal cycling [5] |
Optimized Experimental Protocols
PMA Treatment Optimization
The effectiveness of PMA treatment depends on multiple factors that require empirical optimization for each sample type and microbial target:
PMA Concentration Optimization: Testing a concentration range is essential. For seawater microbiomes, PMA concentrations of 2.5-15 µM effectively reduced 16S rRNA gene amplification from membrane-compromised cells by 24-44% compared to untreated controls [31]. Higher concentrations (up to 100 µM) may be necessary for complex matrices but should be validated to avoid cytotoxic effects on viable cells [31] [33].
Sample Preparation Considerations: Cell density significantly impacts PMA efficiency. Overly dense suspensions may prevent sufficient light penetration during the photoactivation step, reducing PMA binding to dead cell DNA. For canker samples, a 1:50 (w/v) ratio of plant material to diluted antioxidant maceration buffer has proven effective [34]. The buffer composition should minimize the impact of inhibitory compounds (e.g., polyphenols, tannins) present in complex samples [34].
Photoactivation Protocol: After a 10-minute dark incubation, samples should be exposed to a high-intensity light source (∼464 nm) for 30 minutes. During this process, placing samples on horizontal rollers rotating at 25 rpm ensures homogeneous light exposure [31]. Some protocols recommend using SDS or PMA enhancer for Gram-negative bacteria to improve dye penetration [33].
dPCR Assay Configuration
Partitioning Method Selection: Both droplet-based (ddPCR) and chip-based (nanoplates) systems are compatible with PMA-treated samples. The QIAcuity system partitions samples into approximately 26,000 partitions, while the QX200 system generates ∼20,000 droplets [13] [5]. For samples with expected low target concentrations, droplet systems may provide better detection sensitivity.
Amplification Parameters: Thermal cycling conditions must be optimized for the specific target. Reducing cycle number from 40 to 30 and designing longer amplicons (∼966 bp vs. 74 bp) have been shown to improve the discrimination between live and dead cells by increasing the probability of PMA binding to target sequences [33]. Reaction mixtures should include restriction enzymes (e.g., Anza 52 PvuII) to reduce complex DNA structures and improve amplification efficiency [13].
Data Analysis Considerations: Establish a threshold for positive partitions based on fluorescence distribution of negative controls. For the QIAcuity system, thresholds of 30-40 RFU across different channels are typical [13]. Samples with partition counts below three positive signals should be considered below the limit of detection [13].
Quantitative Data and Performance Metrics
PMA-dPCR Performance Characteristics
The following table summarizes key performance metrics for PMA-dPCR across different applications and sample types:
Table 2: Performance Metrics of PMA-dPCR Across Applications
| Application / Sample Type | Linear Range | Limit of Detection | Key Performance Findings |
|---|---|---|---|
| Erwinia amylovora in canker samples [34] | 7.2×10² to 7.6×10⁷ cells/mL | 7.2×10² cells/mL | Detected VBNC cells not identified by culture methods |
| Lacticaseibacillus paracasei in probiotics [32] | 10³ to 10⁸ CFU/mL | 7.3×10³ CFU/mL | Accuracy: ±0.5 Log₁₀ units; no significant difference from theoretical values (p=0.76) |
| Periodontal pathobionts in plaque [13] | 3-8 log₁₀ GEq/mL | 3 log₁₀ GEq/mL | Superior sensitivity for low bacterial loads vs qPCR (5-fold reduction in false negatives) |
| Seawater microbiomes [31] | N/A | N/A | 24-44% reduction in dead cell signal; enabled detection of significant abundance shifts |
Comparison to Alternative Methods
PMA-dPCR demonstrates distinct advantages over other viability assessment approaches:
Compared to PMA-qPCR: dPCR provides absolute quantification without standard curves, exhibits greater tolerance to PCR inhibitors, and shows superior precision for low-abundance targets [13]. In periodontal pathobiont detection, dPCR showed lower intra-assay variability (median CV%: 4.5%) than qPCR [13].
Compared to Culture Methods: PMA-dPCR detects viable but non-culturable (VBNC) cells and provides results more rapidly, without being affected by competing microbiota or growth-inhibitory compounds in samples [34]. This has enabled detection of E. amylovora VBNC cells in apple bark tissues that were culture-negative [34].
Compared to Relative Abundance Methods: When integrated with quantitative microbiome profiling (QMP), PMA-dPCR reveals absolute abundance changes that relative methods miss. In seawater microbiomes, while relative abundance profiling failed to detect significant changes, the absolute approach revealed consistent abundance declines in response to stress [31].
The following diagram illustrates the mechanism of PMA selectivity at the cellular level:
Figure 2: PMA Selective Mechanism for Cell Viability Assessment. PMA dye is excluded from viable cells with intact membranes but enters membrane-compromised dead cells, binding to DNA and preventing its amplification in subsequent PCR.
Troubleshooting and Technical Considerations
Common Optimization Challenges
False Positive Signals: Persistent amplification from dead cells may result from insufficient PMA concentration, inadequate light exposure during photoactivation, or short amplicon targets. Increasing PMA concentration, ensuring homogeneous light exposure, and designing longer amplicons (>500 bp) can improve suppression [33].
False Negative Signals: Loss of viable cell signal may occur from excessive PMA concentrations that affect intact cells, inefficient DNA extraction, or suboptimal PCR amplification conditions. Titrating PMA concentration using samples with known ratios of live:dead cells and verifying extraction efficiency across different cell types is recommended [32].
Inhibition Issues: While dPCR is generally more tolerant to inhibitors than qPCR, complex samples may still require dilution, additional purification steps, or use of restriction enzymes to reduce interference [13] [34].
Method Validation
For rigorous quantitative applications, validate PMA-dPCR performance using samples with defined ratios of viable and non-viable cells. Heat-killed cultures (85°C for 5-30 minutes) provide consistent controls for non-viable cells [31] [33]. The dynamic range should be established using serial dilutions of viable cells in both pure culture and relevant sample matrices to account for matrix effects.
Absolute quantification of nucleic acids is fundamental to advancing research and diagnostics in microbiology, oncology, and virology. Traditional relative measurement techniques often obscure true biological changes, limiting their interpretative power. Digital PCR (dPCR) has emerged as a powerful anchoring technology that provides absolute, standard-free quantification of DNA or RNA targets by partitioning samples into thousands of individual reactions. This article details application notes and protocols for employing dPCR in three critical areas: bacterial plasmid copy number determination, liquid biopsy analysis for cancer management, and precise viral load monitoring, providing a comprehensive framework for absolute abundance measurements in biomedical research.
Application Note 1: Plasmid Copy Number (PCN) Determination
Background and Significance
Plasmid copy number (PCN) is a fundamental aspect of plasmid biology, governing plasmid lifestyles, inheritance stability, and metabolic load on the host cell. Recent research analyzing thousands of diverse bacterial plasmids has revealed that PCN is highly variable, spanning nearly three orders of magnitude, and is intrinsically robust against changes in genomic context [35]. PCN directly modulates plasmid evolvability by affecting gene dosage, mutation rates, and the expression of encoded traits such as antibiotic resistance. Understanding PCN is therefore crucial for both basic microbial genetics and applied biotechnological applications.
Quantitative Insights into Plasmid Biology
Table 1: Key Characteristics of Plasmid Copy Number (PCN) Lifestyles
| Feature | Low-Copy Number Plasmids (LCPs) | High-Copy Number Plasmids (HCPs) |
|---|---|---|
| Typical Copy Number | 1-2 copies per chromosome [35] | >10 copies per cell (mode = 10.40) [35] |
| Common Replication Types | IncF family (Gram-negatives); theta-replicating plasmids (Gram-positives) [35] | Col-like replicons (Gram-negatives); rolling-circle replicating plasmids (Gram-positives) [35] |
| Mobility | Often conjugative [35] | Frequently mobilisable or non-mobilisable [35] |
| Inheritance Strategy | Rely on active partition systems [35] | Random distribution; high copy number ensures stability [35] |
| PCN Variability | Lower variability (stringent control) [35] | Higher intrinsic variability [35] |
A universal scaling law links copy number and plasmid size across bacterial species, indicating pervasive constraints that modulate the PCN-size trade-off. Independently of size or replication type, any given plasmid comprises approximately 2.5% of the chromosome size of its host [35].
Experimental Protocol: dPCR for Plasmid Copy Number
This protocol enables absolute quantification of plasmid copies relative to the host chromosome to determine PCN.
1. Sample Preparation and DNA Extraction
- Culture Cells: Grow bacterial strains under appropriate conditions to mid-exponential phase.
- Harvest Cells: Collect a known volume of culture by centrifugation.
- Extract Genomic DNA: Use a standardized commercial kit for genomic DNA extraction. Ensure high-quality, intact DNA by checking purity via spectrophotometry (A260/A280 ratio ~1.8) [35].
2. Assay Design
- Plasmid Target: Design primer-probe sets targeting a single-copy gene on the plasmid (e.g., a unique replication gene).
- Chromosomal Target: Design primer-probe sets targeting a single-copy essential gene on the host chromosome (e.g., rpoB, gyrB).
- Validation: Confirm the specificity and efficiency of both assays using control templates.
3. Digital PCR Setup and Run
- Reaction Mixture: Prepare a multiplex dPCR reaction containing:
- Extracted DNA template (optimize concentration to avoid over-partitioning)
- Primer-probe mix for both plasmid and chromosomal targets
- dPCR Supermix
- Partitioning: Load the reaction mixture into a dPCR instrument (e.g., Bio-Rad QX200 Droplet Digital PCR system or QIAGEN QIAcuity) to generate thousands of partitions [3] [36].
- Amplification: Run the following thermocycling protocol:
- Initial Denaturation: 95°C for 10 minutes
- 40-45 cycles of:
- Denaturation: 95°C for 30 seconds
- Annealing/Extension: 60°C for 60 seconds
- Enzyme Deactivation: 98°C for 10 minutes
- Hold: 4°C
- Data Analysis: Use the instrument's software to count the positive and negative partitions for each target.
4. Data Analysis and PCN Calculation
- The dPCR software provides absolute concentrations for both targets (in copies/μL).
- Calculate the Plasmid Copy Number (PCN) using the formula:
- PCN = (Concentration of Plasmid Target) / (Concentration of Chromosomal Target) [35]
Application Note 2: Liquid Biopsy for Cancer Biomarkers
Background and Significance
Liquid biopsy involves the analysis of tumor-derived components from bodily fluids, most commonly blood, offering a minimally invasive alternative to tissue biopsies [37] [38]. It enables repeated sampling for longitudinal disease progression and treatment response monitoring, capturing tumor heterogeneity more comprehensively than a single tissue sample [38]. Key analytes include circulating tumor DNA (ctDNA), circulating tumor cells (CTCs), and tumor extracellular vesicles (EVs) [37]. DNA methylation biomarkers in ctDNA are particularly promising due to their early emergence in tumorigenesis, stability, and cancer-specific patterns [38].
Experimental Protocol: dPCR for ctDNA Mutation Analysis
This protocol uses dPCR for ultrasensitive detection and absolute quantification of specific tumor-derived mutations in plasma ctDNA.
1. Sample Collection and Processing
- Blood Collection: Draw patient blood into cell-stabilizing tubes (e.g., Streck Cell-Free DNA BCT or EDTA tubes).
- Plasma Separation: Centrifuge blood within a few hours of collection to separate plasma from cellular components.
- Second Centrifugation: Perform a higher-speed centrifugation to remove residual cells and debris.
- Storage: Aliquot and store plasma at -80°C until cfDNA extraction.
2. Cell-Free DNA (cfDNA) Extraction
- Use dedicated kits for cfDNA extraction from plasma (e.g., QIAamp Circulating Nucleic Acid Kit) [36].
- Include carrier RNA to improve recovery of low-abundance cfDNA.
- Quantify extracted cfDNA using a fluorometer (e.g., Qubit with a high-sensitivity DNA assay) [36].
3. Assay Design
- Target Assay: Design primer-probe sets specific to the mutant allele of interest.
- Reference Assay: Design a separate primer-probe set targeting the wild-type sequence or a reference gene.
4. Digital PCR Setup and Run
- Reaction Mixture: Prepare separate dPCR reactions for the mutant and reference assays containing:
- Extracted cfDNA template
- Target-specific primer-probe mix
- dPCR Supermix
- Partitioning and Amplification: Follow steps similar to the PCN protocol, using the appropriate thermocycling conditions for the assays.
- No-Template Controls (NTCs): Include NTCs to determine the false-positive rate and inform thresholding, which is critical for accurate quantification at low ctDNA levels [39].
5. Data Analysis
- The dPCR software provides the concentration of mutant and reference targets (in copies/μL).
- Calculate the Variant Allele Frequency (VAF):
- VAF = [Mutant Concentration / (Mutant Concentration + Reference Concentration)] × 100%
Research Reagent Solutions: Liquid Biopsy
Table 2: Essential Reagents for Liquid Biopsy Analysis
| Reagent / Material | Function | Example Product / Note |
|---|---|---|
| Cell-Free DNA BCT Tubes | Stabilizes blood cells to prevent genomic DNA contamination during transport/storage. | Streck Cell-Free DNA BCT tubes [38] |
| cfDNA Extraction Kit | Isoles and purifies low-concentration, fragmented cfDNA from plasma. | QIAamp Circulating Nucleic Acid Kit (Qiagen) [36] |
| dPCR Supermix | Optimized buffer, enzymes, and dyes for efficient amplification in partitioned reactions. | ddPCR Supermix for Probes (Bio-Rad) [3] |
| Fluorometer & HS DNA Kit | Accurately quantifies low yields of extracted cfDNA. | Qubit Fluorometer & HS DNA Kit (Invitrogen) [36] |
| Target-Specific Primer/Probes | Enable specific amplification and detection of mutant or methylation biomarkers. | Custom TaqMan assays [36] |
Application Note 3: Viral Load Monitoring
Background and Significance
Accurate viral load quantification is essential for diagnosing infections, monitoring disease progression, assessing treatment efficacy, and informing public health strategies. During the 2023-2024 'tripledemic' of influenza, RSV, and SARS-CoV-2, the need for precise diagnostics became especially evident [3]. While Real-Time RT-PCR has been the gold standard, digital PCR offers absolute quantification without standard curves, demonstrating superior accuracy and precision, particularly for medium and high viral loads [3]. dPCR is also invaluable for monitoring reactivation of viruses like HHV-6B in immunocompromised patients, such as those receiving Chimeric Antigen Receptor T-cell (CAR-T) therapy or hematopoietic stem cell transplantation (HSCT) [36].
Experimental Protocol: dPCR for Respiratory Virus RNA Quantification
This protocol outlines the absolute quantification of viral RNA from respiratory samples using reverse transcription digital PCR (RT-dPCR).
1. Sample Collection and Nucleic Acid Extraction
- Sample Type: Collect nasopharyngeal swabs or other respiratory specimens in viral transport media.
- RNA Extraction: Use an automated or manual nucleic acid extraction system (e.g., KingFisher Flex with MagMax Viral/Pathogen kit) to isolate total RNA [3].
- RNA Quality: Assess RNA integrity if possible, though this can be challenging with clinical samples.
2. Reverse Transcription Digital PCR (RT-dPCR)
- One-Step vs. Two-Step: A one-step RT-dPCR protocol is often more convenient.
- Reaction Mixture: Prepare a multiplex dPCR reaction containing:
- Extracted RNA template
- One-Step RT-dPCR Supermix
- Primer-probe sets specific for target viruses (e.g., Influenza A, B, RSV, SARS-CoV-2) and an internal control [3]
- Partitioning and Amplification: Load the mixture into the dPCR instrument. The thermocycling protocol will include:
- Reverse Transcription: e.g., 50°C for 60 minutes
- Enzyme Activation: 95°C for 10 minutes
- 40-45 cycles of Denaturation/Annealing-Extension
- Enzyme Deactivation and hold.
3. Data Analysis
- The dPCR software directly reports the absolute concentration of each viral target in copies/μL of the original reaction.
- This can be extrapolated to copies/mL of the original sample volume, providing a precise viral load measurement independent of external standards [3].
The Scientist's Toolkit: Core Reagents for dPCR-Based Absolute Quantification
Table 3: Essential Research Reagent Solutions for dPCR Workflows
| Category | Item | Critical Function |
|---|---|---|
| Sample Prep | Genomic DNA Extraction Kits | High-quality input DNA for PCN and microbial load [11]. |
| Cell-Free DNA Extraction Kits | Optimized for low-abundance, fragmented ctDNA from plasma [36]. | |
| RNA Extraction Kits | Integrity preservation for viral RNA and transcript analysis [3]. | |
| dPCR Core | dPCR Supermix | Provides core components for partitioned amplification [3] [36]. |
| One-Step RT-dPCR Supermix | Integrates reverse transcription and PCR in one reaction for RNA targets [3]. | |
| Fluorophore-Linked Probes | Target-specific detection (e.g., FAM, VIC/HEX) for multiplexing [36]. | |
| Controls & Calibration | Positive Control Templates | Validate assay performance and efficiency. |
| No-Template Controls (NTCs) | Critical for determining background and setting thresholds for low-level targets [39]. | |
| Consumables | dPCR Plates/Cartridges | Vessel for partition generation (nanowells or droplets) [3]. |
| Sealing Foils | Prevents cross-contamination and evaporation during thermocycling. |
Digital PCR provides a robust and precise technological anchor for absolute quantification across diverse research and diagnostic applications. Its ability to deliver standard-free measurements of plasmid copy number, rare ctDNA biomarkers, and viral loads without the constraints of relative data transformation makes it an indispensable tool. The detailed protocols and frameworks presented here for PCN analysis, liquid biopsy, and viral load monitoring provide a foundation for researchers and drug development professionals to implement these techniques, thereby enhancing the accuracy and translational impact of their findings in microbiology, oncology, and virology.
Optimizing Precision and Overcoming Pitfalls in dPCR Assay Development
In the advancing field of molecular microbiology, the demand for precise and absolute quantification of microbial abundance is paramount, particularly in applications like drug development and clinical diagnostics. Digital PCR (dPCR) has emerged as a powerful tool for absolute abundance measurements, eliminating the need for standard curves and offering high resistance to PCR inhibitors [40]. However, the accuracy of dPCR can be compromised by both false-positive and false-negative signals, leading to erroneous quantification [41] [42].
This Application Note details an integrated methodological framework that combines robust internal quality controls with digital High-Resolution Melt (dHRM) analysis. This combined approach effectively identifies and mitigates false results, thereby ensuring the reliability of absolute abundance data in complex microbial mixtures [43]. The protocols herein are designed for research scientists seeking to implement rigorous quantitative microbiome profiling.
Experimental Design and Principles
The Critical Need for Absolute Quantification in Microbial Ecology
Traditional metagenomic sequencing provides relative taxonomic abundance, which is inherently compositional. This means that an observed increase in one taxon may not represent a true biological increase but could be an artifact caused by a decrease in other community members [9] [11]. This compositional nature can lead to misleading associations in research linking microbiome to diseases. Absolute abundance measurements, achieved through dPCR anchoring, restore the true quantitative scale, allowing researchers to distinguish between actual changes in a taxon's abundance and apparent changes driven by community composition shifts [9].
Fundamental Principles of dHRM
The dHRM technique synergizes the absolute quantification power of dPCR with the sequence-specific discrimination capability of High-Resolution Melting analysis.
- Digital PCR (dPCR): A sample is partitioned into thousands of nanoliter-scale reactions. Following endpoint PCR, partitions are scored as positive or negative based on fluorescence, allowing for absolute quantification of target DNA molecules without a standard curve [40].
- High-Resolution Melt (HRM): After amplification, the DNA is slowly heated in the presence of a saturating double-stranded DNA dye. The resulting fluorescence decay curve is exquisitely sensitive to the DNA sequence composition (GC content, length, sequence), enabling the discrimination of single-nucleotide variants [44].
- Universal dHRM (U-dHRM): This advanced approach uses broad-based primers (e.g., targeting the 16S rRNA gene) or ligated adapters to universally amplify all nucleic acids in a partitioned sample. Subsequent melt curve analysis and matching to a database of known curves allows for highly sensitive and specific genotyping of multiple targets in a heterogeneous mixture, even at the single-molecule level [43].
Table 1: Key Advantages of the dHRM Workflow
| Feature | Advantage | Application in Microbial Quantification |
|---|---|---|
| Absolute Quantification | Does not require a standard curve; counts single molecules [40]. | Direct measurement of 16S rRNA gene copies per gram of sample [9]. |
| Single-Nucleotide Sensitivity | HRM can distinguish sequences differing by a single base pair [44]. | Precise identification of closely related bacterial species or strains [43]. |
| Mitigation of False Positives | Melt curve shape analysis confirms amplicon identity, rejecting non-specific amplification [43]. | Reduces false calls from primer-dimers or contaminating DNA. |
| Detection of Low-Abundance Targets | Partitioning enhances detection sensitivity in complex backgrounds [43] [40]. | Identification of rare pathogens or minority community members down to 1:10,000 ratios [40]. |
dHRM Workflow for Absolute Quantification
The following diagram illustrates the core workflow for absolute quantification of microbial abundance using dHRM, highlighting steps critical for false signal control.
Materials and Reagents
Research Reagent Solutions
Table 2: Essential Reagents and Materials for dHRM-based Absolute Quantification
| Item | Function / Critical Feature | Example / Note |
|---|---|---|
| Digital PCR System | Partitions the sample and performs nano-scale PCR. | Crystal Digital PCR, droplet digital PCR (ddPCR) systems [40]. |
| High-Fidelity DNA Polymerase | Ensures accurate amplification with minimal errors. | Must be compatible with the chosen dPCR platform and HRM dyes. |
| Saturating dsDNA Binding Dye | Binds homogenously to DNA for precise melt curve generation. | -- |
| Universal Primer Sets | Amplifies broad targets (e.g., 16S rRNA V6 region) [43]. | -- |
| Species-Specific Primers/Probes | For targeted quantification of specific microbes [40]. | Double-quenched probes are recommended for better signal-to-noise [41]. |
| Internal Process Controls | Monitors extraction efficiency and detects PCR inhibition. | Exogenous DNA spiked into the sample during lysis [9] [42]. |
| Negative Controls | Identifies contamination leading to false positives. | No-Template Control (NTC) [45] [42]. |
| Synthetic DNA Templates | Serves as positive controls and for assay optimization. | Used for primer validation and as a quantitative standard [41]. |
| Temperature Calibrator Oligos | Normalizes well-to-well temperature variation during HRM. | Blocked, non-amplifiable duplexes with known melt temperatures [43]. |
Protocol: dHRM for Absolute Microbial Abundance with Integrated Controls
Sample Preparation and DNA Extraction
- Sample Collection: For stool samples, use a standardized wet weight (e.g., 200 mg) for DNA extraction to enable accurate normalization to copies/gram [11].
- Incorporate Internal Controls: At the lysis step, spike a known quantity of an exogenous DNA sequence (from an organism not expected in the sample) into the sample. This controls for DNA extraction efficiency and potential PCR inhibition [9] [42].
- Extraction Efficiency Validation: As demonstrated in quantitative microbiome studies, validate DNA recovery by spiking a defined microbial community into germ-free samples and quantifying recovery via dPCR. Aim for a lower limit of quantification (LLOQ) of around 4.2 × 10^5 16S rRNA gene copies per gram for stool [9].
Digital PCR Reaction Setup and Optimization
- Reaction Mix:
- Primer/Probe Concentration: Optimize concentrations, which may be higher than those used in qPCR [41]. For U-dHRM, universal 16S rRNA primers (e.g., V6-F:
GGAGCATGTGGTTTAATTCGA, V6-R:AGCTGACGACANCCATGCA) can be used [43]. - Additives: For GC-rich targets, include additives like DMSO or betaine to minimize "rain" (partitions with intermediate fluorescence) [41].
- Primer/Probe Concentration: Optimize concentrations, which may be higher than those used in qPCR [41]. For U-dHRM, universal 16S rRNA primers (e.g., V6-F:
- Partitioning: Load the reaction mix into the dPCR system (e.g., Crystal Digital PCR, droplet generator) to create thousands of individual partitions [40].
- Amplification: Run the PCR to endpoint. Using a precise thermal cycler is critical for subsequent HRM analysis.
High-Resolution Melt Analysis
- Melt Curve Generation: After amplification, heat the partitions from a denatured state (e.g., 95°C) to a double-stranded state (e.g., 60°C). Then, slowly increase the temperature (e.g., 0.1°C increments) while continuously monitoring fluorescence [44] [43].
- Data Normalization: Use temperature calibrator oligonucleotides in each reaction to correct for well-to-well temperature variability, ensuring reproducible melt curves [43].
- Curve Analysis: Plot the negative derivative of fluorescence versus temperature (-dF/dT vs. T) to generate distinct melt peaks for each unique sequence variant.
Data Analysis and Interpretation for False Signal Mitigation
- Threshold Setting for dPCR: Set fluorescence thresholds to clearly distinguish positive and negative partitions. Improve separability by optimizing primer/probe concentration and annealing temperature [41].
- Melt Curve Classification: Classify the melt curve from each positive partition by comparing its shape and melting temperature (Tm) to a pre-established database of known sequences. This step is crucial for rejecting false positives from non-specific amplification and for identifying specific taxa in a mixture [43].
- Absolute Quantification Calculation: Use the fraction of positive partitions for each classified sequence (after applying the Poisson distribution) to calculate the absolute copy number in the original sample [40]. Normalize this to the sample weight or volume.
Table 3: Quantitative Performance of dHRM in Microbial Mixtures
| Parameter | Performance Metric | Experimental Context |
|---|---|---|
| Limit of Detection | Single nucleic acid molecule [43]. | Detection of bacteria in polymicrobial blood infection. |
| Limit of Quantification | Reliable quantification at a 1:10,000 ratio [40]. | Quantification of C. acetobutylicum in a synthetic consortium with N. vulgaris. |
| Single-Nucleotide Specificity | Discrimination of single-base differences [43]. | Differentiation of let-7 miRNA family members. |
| Dynamic Range | Spanning multiple orders of magnitude [11]. | Quantification of 16S rRNA copies in stool from immunocompromised patients. |
Troubleshooting Common Issues
The following flowchart guides the systematic investigation and resolution of common false-positive and false-negative results in dHRM assays.
The integration of stringent internal controls with digital High-Resolution Melt analysis provides a robust solution for mitigating false negatives and positives in digital PCR applications. This protocol enables researchers in drug development and microbial ecology to obtain highly reliable absolute abundance measurements, which are crucial for accurately linking microbial taxa to host physiology and disease phenotypes [9]. The dHRM framework not only enhances quantitative accuracy but also opens avenues for discovering unanticipated nucleic acid targets in complex biological mixtures.
The accurate analysis of microbial communities in complex samples is a cornerstone of modern microbiology, with significant implications for human health, environmental science, and drug development. However, two fundamental challenges consistently hamper reliability: the presence of PCR inhibitors and the difficulties associated with low-biomass samples. These issues are particularly problematic in samples such as mucosal surfaces, tissue biopsies, water, and soil, where target DNA may be scarce and coexists with substances that impede molecular analysis.
Traditional relative abundance measurements from 16S rRNA gene sequencing are inherently limited because they can only describe proportions rather than absolute quantities [2]. This compositional nature means that an increase in one taxon's relative abundance necessarily causes an apparent decrease in others, potentially leading to misleading biological interpretations [2]. Digital PCR (dPCR) and droplet digital PCR (ddPCR) have emerged as powerful solutions to these challenges, enabling absolute quantification of target genes without the need for standard curves [46] [7]. These methods partition samples into thousands of nanoscale reactions, allowing for precise counting of target DNA molecules while mitigating the effects of inhibitors through sample dilution across partitions [47].
This application note provides a comprehensive framework for managing complex samples through optimized collection methods, inhibitor mitigation strategies, and dPCR-based absolute quantification protocols. The approaches detailed herein are designed to help researchers obtain quantitatively accurate measurements that more faithfully represent true biological systems.
Core Challenges and Their Impact on Data Fidelity
PCR inhibitors are substances that co-extract with nucleic acids and interfere with amplification efficiency, potentially leading to false negatives or quantitative inaccuracies. Common environmental inhibitors include:
- Humic and fulvic acids from soils and organic matter
- Tannins from plant materials and tea-colored waters [48]
- Polysaccharides from microbial capsules and plant tissues
- Bile salts and hemoglobin from clinical specimens [49]
- Calcium and other ions from hard water and marine environments
The mechanism of inhibition varies by substance but includes direct interaction with DNA polymerase, binding to nucleic acids, or interference with fluorescence detection in quantitative assays [48]. In digital PCR, while partitioning provides some protection by segregating inhibitors from target molecules, significant inhibition can still reduce amplification efficiency, leading to reduced signal intensity and potential underestimation of target concentrations [46] [47].
Low-Biomass Samples: Collection and Contamination Issues
Low-biomass samples present distinct challenges characterized by limited starting material and heightened susceptibility to contamination:
- High host-to-microbe ratio: In samples like fish gills or mucosal tissues, host DNA can constitute the majority of extracted nucleic acids, dramatically reducing sequencing efficiency for microbial targets [50].
- Contamination sensitivity: Reagents, laboratory surfaces, and personnel can contribute exogenous DNA that represents a significant proportion of sequence data in low-biomass samples [46].
- Stochastic sampling effects: At low template concentrations, random distribution of target molecules can lead to substantial variation between technical replicates [2].
- Reduced detection sensitivity: Target sequences may fall below the limit of detection, particularly for rare taxa or when analyzing small sample volumes [48].
Table 1: Comparison of Sample Types and Their Associated Challenges
| Sample Type | Primary Inhibitors | Biomass Characteristics | Major Technical Concerns |
|---|---|---|---|
| Fish Gills | Hemoglobin, mucus components | Low bacterial biomass, high host DNA [50] | Host DNA contamination, inhibitor carryover |
| Marine Water | Tannins, humic acids, salts | Very low biomass, requires concentration [51] | Inhibition, sample processing losses |
| Stool | Bile salts, polysaccharides | High biomass, complex community | Inhibition, DNA extraction bias |
| Intestinal Mucosa | Host enzymes, blood components | Low to moderate biomass, high host DNA [2] | Host DNA contamination, sampling difficulty |
Strategic Approaches for Sample Collection and Processing
Optimized Collection Methods for Low-Biomass Samples
Effective management of complex samples begins at the collection stage with strategies designed to maximize target DNA yield while minimizing contaminants:
Filter swabbing: For fish gill sampling, filter swabs significantly increase 16S rRNA gene recovery while reducing host DNA contamination compared to whole tissue sampling [50]. This approach yielded significantly higher amplification of 16S rRNA genes and greater bacterial diversity after sequencing.
Surfactant washes: Controlled surfactant applications (e.g., Tween 20) can solubilize membrane proteins and associated matrices to recover microorganisms from surfaces with minimal host cell lysis [50]. Optimization of concentration is critical, as higher concentrations (e.g., 1% Tween 20) resulted in significantly more host DNA compared to lower concentrations (0.01-0.1%).
Multi-filter isolation: For water samples, combining multiple filters in a single isolation procedure enables processing of larger volumes (approximately 1L) while avoiding clogging issues. This approach resulted in a 4.4-fold increase in eDNA yield compared to single-filter processing of smaller volumes [48].
Sample concentration: Tangential flow filtration systems effectively concentrate viral particles from large water volumes (25L) for subsequent analysis, though loss factors must be calculated to accurately determine original abundances [7].
Inhibitor Removal and Mitigation Strategies
Several effective approaches exist for reducing the impact of PCR inhibitors:
Chemical separation: CTAB (Cetyl trimethylammonium bromide) buffer, followed by Phenol-Chloroform-Isoamyl (PCI) isolation, effectively removes inhibitory compounds from tannin-laden water samples, resulting in significantly higher target DNA yields compared to other buffer combinations [48].
Propidium monoazide (PMA) treatment: This DNA-binding dye selectively penetrates membrane-compromised cells (including dead cells and free DNA) and inhibits their PCR amplification after light exposure. For seawater samples, PMA concentrations of 2.5-15 µM effectively reduced 16S rRNA gene amplification from non-viable cells by 24-44% [51].
Inhibitor removal kits: Commercial columns specifically designed to remove PCR inhibitors can be effective, though they may require multiple applications for heavily inhibited samples and can result in DNA loss [48].
Partitioning in digital PCR: The nanoliter partitioning in dPCR and ddPCR physically separates inhibitors from target DNA molecules, making these methods more robust to inhibition compared to qPCR [46] [47].
Digital PCR Anchoring for Absolute Quantification
Theoretical Framework for Absolute Quantification
The transition from relative to absolute quantification in microbiome research represents a fundamental shift in data interpretation. Relative abundance measurements, derived from standard 16S rRNA gene sequencing, are inherently compositional because they report proportions rather than absolute quantities [2]. This means that an observed increase in one taxon's relative abundance could result from either an actual increase in that taxon, a decrease in other taxa, or a combination of both [2].
Digital PCR anchoring overcomes this limitation by providing an external benchmark that transforms relative data into absolute values. The core principle involves measuring the total abundance of a target gene (e.g., 16S rRNA gene) in a sample using dPCR, then using this value to convert relative proportions from sequencing into absolute counts [2] [51]. This approach reveals the true magnitude and directionality of abundance changes that are obscured in relative data.
Workflow Implementation
Diagram 1: Digital PCR Anchoring Workflow. This diagram illustrates the parallel processing of samples for absolute 16S rRNA gene quantification (green) and relative community profiling (yellow), with integration of both data types (red) to generate absolute abundance estimates.
The dPCR anchoring workflow consists of five key stages:
Sample Collection and DNA Extraction: Implement optimized collection methods as described in Section 3.1, followed by DNA extraction using protocols validated for efficiency across diverse sample types [2].
Absolute Quantification of 16S rRNA Genes: Partition extracted DNA into a dPCR or ddPCR reaction using universal 16S rRNA primers. The random partitioning of template molecules enables absolute counting without standard curves [46] [7].
16S rRNA Gene Amplicon Sequencing: In parallel, amplify the V3-V4 or other appropriate hypervariable regions of the 16S rRNA gene for high-throughput sequencing to determine taxonomic relative abundances [50].
Data Integration: Multiply relative abundance values for each taxon by the total absolute 16S rRNA gene count determined by dPCR to calculate absolute abundances for individual taxa [2] [51].
Validation: Assess extraction efficiency using defined microbial communities spiked into samples, and determine limits of quantification through dilution series [2].
Table 2: Comparison of Quantification Methods for Microbiome Analysis
| Parameter | Relative Abundance (16S Sequencing) | qPCR with Standards | dPCR/ddPCR Anchoring |
|---|---|---|---|
| Quantification Type | Relative (proportions) | Absolute (with standard curve) | Absolute (standard-free) |
| Inhibitor Resistance | Low | Moderate | High [46] [47] |
| Detection Limit | Moderate | Variable | 1-10 copies/μl [46] |
| Precision at Low Biomass | Poor | Moderate | High [46] |
| Susceptibility to Contamination | High | High | Moderate [46] |
| Throughput | High | Moderate | Moderate |
| Cost per Sample | Low | Moderate | High |
Experimental Protocols and Validation Methods
Detailed ddPCR Protocol for 16S rRNA Gene Quantification
This optimized protocol for absolute quantification of 16S rRNA genes in environmental samples is adapted from recent validation studies [46]:
Reagents and Equipment:
- QIAcuity Digital PCR System (Qiagen) or equivalent
- 16S rRNA gene primers (e.g., 341F/518R or 515F-Y/806R)
- EvaGreen or probe-based supermix
- DNase/RNase-free water
- Thermal cycler compatible with dPCR system
Procedure:
- DNA Extraction and Quality Control: Extract DNA using a kit validated for your sample type (e.g., PowerSoil for soil, QIAamp Ultrasense Virus for water). Include extraction controls. Quantify DNA using fluorescence-based methods (e.g., Qubit) rather than spectrophotometry.
Reaction Setup:
- Prepare 20μL reactions containing:
- 1× EvaGreen supermix
- 500nM forward and reverse primers
- 2μL template DNA (optimize volume based on sample type)
- DNase-free water to volume
- Include negative controls (water instead of template) and positive controls (synthetic standard when available).
- Prepare 20μL reactions containing:
Partitioning and Sealing: Load reactions into dPCR plates or cartridges and generate partitions according to manufacturer's instructions. Ensure partition quality by visual inspection if possible.
Thermal Cycling:
- Initial denaturation: 95°C for 5-10 minutes
- 40-45 cycles of:
- Denaturation: 95°C for 30 seconds
- Annealing/extension: Temperature optimized for primer set (55-60°C) for 1 minute
- Final enzyme deactivation: 98°C for 10 minutes
- Hold at 4°C indefinitely
Data Acquisition and Analysis:
- Read plate in dPCR instrument
- Set thresholds using multiple controls (see Section 5.2)
- Apply Poisson correction to calculate copies/μL
- Apply correction factors for dilution and sample processing if needed
Troubleshooting Notes:
- For samples with significant "rain" (droplets with intermediate fluorescence), optimize annealing temperature and cycle number [47].
- If inhibition is suspected, dilute samples 1:10 and re-run to compare results.
- For low-biomass samples, increase template volume while ensuring reaction chemistry remains stable.
Threshold Determination and Data Quality Control
Accurate threshold setting is critical for reliable ddPCR quantification, particularly for environmental samples that may exhibit significant "rain" (droplets with intermediate fluorescence) [47]. The following multi-control approach is recommended:
No-Template Control (NTC): Establish baseline fluorescence from droplets containing all reagents except template DNA.
Environmental Negative Control: Include samples from the same environment that are confirmed negative for the target (e.g., through prior sequencing).
Organismal Positive Control: Use DNA extracted from pure cultures or synthetic standards to identify the positive cluster position.
Manual Threshold Refinement: Set the threshold at the local minimum between negative and positive clusters when clear separation exists.
Rain Handling: For samples with substantial rain, apply consistent algorithms across all samples or consider droplet removal based on positive and negative control distributions.
Diagram 2: Viability Assessment Workflow with PMA Treatment. This diagram shows the integration of propidium monoazide (PMA) treatment for selective detection of membrane-intact cells, with parallel quantification using ddPCR and flow cytometry (FC) for absolute abundance determination.
PMA Treatment Protocol for Viability Assessment
The following protocol describes how to integrate viability assessment into quantitative microbiome profiling using PMA treatment [51]:
Reagents:
- PMAxx dye (Biotium)
- Phosphate buffered saline (PBS), pH-adjusted to match sample salinity
- LED light source (464 nm)
Procedure:
- Sample Preparation: Prepare samples as suspensions in appropriate buffer. For seawater, use PBS adjusted to 33 ppt salinity.
PMA Treatment:
- Add PMA to sample to achieve final concentration of 2.5-15 μM.
- Incubate in dark for 10 minutes with occasional mixing.
- Place samples on horizontal roller and expose to LED light for 30 minutes for photo-induced crosslinking.
DNA Extraction: Proceed with standard DNA extraction protocol after PMA treatment.
Validation: Compare PMA-treated and untreated samples to assess efficiency of DNA reduction from membrane-compromised cells. Expected reduction is 24-44% in natural seawater samples [51].
Research Reagent Solutions
Table 3: Essential Reagents and Kits for Complex Sample Analysis
| Reagent/Kits | Primary Function | Application Notes | Key References |
|---|---|---|---|
| PowerSoil DNA Isolation Kit | DNA extraction from soil and stool | Effective inhibitor removal; validated for environmental samples | [2] [47] |
| PMAxx Dye | Viability assessment | Selective detection of membrane-intact cells; optimize concentration (2.5-15 μM) | [51] |
| QIAcuity dPCR System | Absolute quantification | Nanoplates with partition imaging; suitable for 16S rRNA gene counting | [46] |
| QX100/QX200 ddPCR System | Absolute quantification | Droplet-based partitioning; demonstrated for viral and bacterial targets | [7] |
| CTAB Buffer | Inhibitor removal | Particularly effective for tannin-rich samples; use with PCI extraction | [48] |
| QIAamp Ultrasense Virus Kit | Viral DNA extraction | Effective for low-biomass water samples; compatible with PMA treatment | [7] |
The integration of optimized sample collection methods, inhibitor mitigation strategies, and dPCR anchoring represents a comprehensive approach to overcoming the principal challenges in complex sample analysis. By implementing these protocols, researchers can transition from semi-quantitative relative abundance measurements to quantitatively accurate absolute abundance data, enabling more biologically meaningful interpretations of microbial community dynamics.
The strategies outlined in this application note are particularly valuable for environmental monitoring, host-microbe interaction studies, and any research domain where sample complexity compromises molecular analysis. As digital PCR technologies continue to evolve and become more accessible, these absolute quantification approaches will likely become standard practice in microbiome research, ultimately strengthening the biological conclusions drawn from complex sample types.
The accuracy of polymerase chain reaction (PCR) assays, whether for basic research or clinical diagnostics, is fundamentally dependent on the specificity of the primer and probe sequences used. Proper design is crucial for minimizing false positives and false negatives, ensuring that results truly reflect the biological reality being measured. Within the context of digital PCR (dPCR) for absolute abundance measurements, assay specificity becomes even more critical as this technology is often employed for sensitive applications such as rare variant detection, pathogen quantification, and precise copy number variation analysis [52]. The partitioning process in dPCR reduces competition from background DNA and minimizes inhibitor effects, but this advantage can only be fully realized with exquisitely specific primers and probes that accurately target the sequence of interest without cross-reacting with similar sequences in complex samples.
The fundamental challenge in assay design lies in achieving two sometimes competing objectives: sensitivity (the ability to detect all true positive targets, including variant sequences) and specificity (the ability to exclude non-target sequences). As will be detailed in this application note, meeting these objectives requires careful attention to thermodynamic properties, comprehensive in silico validation, and empirical testing under appropriate conditions. This is particularly true for multiplex assays where the number of potential primer-dimer interactions grows quadratically with the number of primers, creating significant design challenges that require specialized computational approaches [53].
Core Principles of Primer and Probe Design
Fundamental Design Parameters
Well-designed primers and probes must meet specific thermodynamic and sequence composition criteria to ensure robust assay performance. The guidelines in Table 1 represent consensus best practices compiled from industrial and academic sources [54].
Table 1: Optimal Design Characteristics for Primers and Probes
| Parameter | Primers | Hydrolysis Probes | Rationale |
|---|---|---|---|
| Length | 18–30 bases | 20–30 bases (single-quenched) | Balances specificity with binding efficiency |
| Melting Temperature (Tm) | 60–64°C (ideal: 62°C) | 5–10°C higher than primers | Ensures probe hybridizes before primers |
| Annealing Temperature (Ta) | ≤5°C below primer Tm | Set based on lower primer Tm | Optimizes specific binding while reducing mismatches |
| GC Content | 35–65% (ideal: 50%) | 35–65% | Provides sequence complexity while avoiding stability issues |
| 3'-End Sequence | Avoid 4+ consecutive Gs; no G for probes | Avoid G at 5' end | Precludes quenching of 5' fluorophore; reduces secondary structures |
| Complementarity | ΔG > -9.0 kcal/mol for self-dimers, hairpins, and heterodimers | Similar to primers | Minimizes off-target interactions and primer-dimer formation |
Additional considerations for amplicon design include keeping product length between 70–150 base pairs for optimal amplification efficiency and designing assays to span exon-exon junctions when working with RNA to minimize genomic DNA amplification [54]. For dPCR applications, these design principles become even more important as the partitioning process can amplify the impact of any non-specific amplification events.
Assessing Specificity and SensitivityIn Silico
Prior to laboratory validation, comprehensive computational analysis is essential for predicting assay performance. Research indicates that many published assays have high specificity but unacceptably low sensitivity, failing to detect legitimate target sequences due to mismatches [55]. A robust in silico validation workflow should include:
- Specificity Analysis: Basic Local Alignment Search Tool (BLAST) searches against comprehensive genomic databases to ensure primers and probes are unique to the desired target sequence [54] [55].
- Secondary Structure Prediction: Evaluation of potential hairpins, self-dimers, and heterodimers using tools like OligoAnalyzer or UNAFold [54]. The free energy (ΔG) of any predicted secondary structures should be weaker (more positive) than -9.0 kcal/mol.
- Cross-Hybridization Assessment: Checking for potential binding to non-target sequences, particularly in complex samples where related organisms or genes may be present.
- Consensus Analysis: For highly variable targets, multiple sequence alignment of all known variants should be performed to identify conserved regions for targeting [55].
This computational approach was effectively demonstrated in a study on visceral leishmaniasis diagnostics, where researchers identified critical specificity failures in published assays through in silico analysis and designed new oligonucleotides with predicted superior performance [56].
Experimental Protocol for Validation of Assay Specificity
Workflow for Design and Validation
The following workflow diagram illustrates the comprehensive process for designing and validating specific PCR assays:
Detailed Experimental Methods
1In SilicoSpecificity Analysis Protocol
- Sequence Collection: Gather all available target sequences from public databases (GenBank, EMBL, TIGR) for the organism or gene of interest, including strain variants [55].
- Primer-BLAST Analysis: Use NCBI's Primer-BLAST tool with the following parameters:
- Database: "nr"
- Organism: Target and related non-target species
- Maximum number of target-specific primers: 0 (to see all potential matches)
- Primer specificity stringency: High
- TaqSim Analysis: For more rigorous assessment, use tools like TaqSim which applies BLAST searches to find sequences matching both forward and reverse primers and probe with the required orientations and proximity [55].
- Specificity Calculation: Compare the tool's predicted sequence hits with the known target sequences from taxonomy databases to calculate:
- Sensitivity = 1 - (False Negatives / (True Positives + False Negatives))
- Specificity = 1 - (False Positives / (True Negatives + False Positives))
Empirical Validation Protocol
- Sample Selection: Test the assay against:
- Positive controls with known target sequence
- Negative controls without target
- Cross-reactivity panels containing related non-target sequences
- Temperature Optimization: Perform thermal gradient experiments to determine optimal annealing temperature that maximizes specific amplification while minimizing non-specific products.
- Limit of Detection (LOD) Determination: Perform serial dilutions of target template to establish the lowest concentration at which the assay reliably detects the target.
- Specificity Testing: Amplify a panel of non-target sequences that are phylogenetically related or commonly found in the sample matrix to assess cross-reactivity.
Special Considerations for Multiplex Assays
Challenges in Multiplex Assay Design
Designing multiplex PCR assays presents additional challenges beyond single-plex assays. The primary issue is the quadratic increase in potential primer-dimer interactions with the number of primers. For an N-plex assay with 2N primers, there are (2N choose 2) possible primer-dimer interactions [53]. For a 50-plex assay (100 primers), this translates to 4,950 potential interactions—far too many to evaluate and optimize manually.
Computational Approaches for Multiplex Optimization
Advanced computational methods are essential for designing highly multiplexed primer sets. The Simulated Annealing Design using Dimer Likelihood Estimation (SADDLE) algorithm represents a significant advancement in this field [53]. This approach includes:
- Primer Candidate Generation: Systematic generation of primer candidates with optimal binding energy (ΔG° ≈ -11.5 kcal/mol) to their cognate templates.
- Loss Function Evaluation: Rapid computation of potential primer dimer formation across all primer combinations in a set.
- Iterative Optimization: Stochastic selection of primer sets that minimize the overall "badness" score for primer dimer formation.
Using this approach, researchers successfully designed a 96-plex PCR primer set (192 primers) that reduced the primer dimer fraction from 90.7% in a naive design to just 4.9% in the optimized set [53]. Even when scaling to 384-plex (768 primers), the optimized primer set maintained low dimer formation.
Practical Guidelines for Multiplex Assays
- Uniform Thermodynamic Properties: Design all primers and probes in a multiplex assay to have similar melting temperatures (within 2°C) to ensure balanced amplification of all targets [54].
- Compatible Fluorescent Dyes: For detection, select dye combinations with minimal spectral overlap to enable clear signal discrimination.
- Balanced Amplicon Length: Keep amplicon lengths similar to prevent amplification bias toward shorter fragments.
- Computational Design Tools: Leverage specialized software tools that can evaluate and optimize large primer sets, as manual design is impractical beyond a few primer pairs.
Table 2: Key Research Reagent Solutions for PCR Assay Development
| Reagent/Resource | Function | Application Notes |
|---|---|---|
| High-Fidelity DNA Polymerase | Catalyzes DNA synthesis with low error rates | Reduces misincorporation errors; essential for accurate amplification [57] |
| Double-Quenched Probes | Fluorescent detection of amplified targets | Provide lower background and higher signal compared to single-quenched probes [54] |
| Digital PCR Systems | Absolute quantification of nucleic acids | Enables precise measurement without standard curves; partitions samples into nano-reactions [52] |
| Optimized Buffer Systems | Maintains optimal pH and salt conditions | Mg2+ concentration significantly impacts Tm; use specific reaction conditions for Tm calculations [54] |
| Multiplex PCR Master Mixes | Specialized formulations for multiplexing | Contains optimized salt concentrations and enhancers for balanced multi-target amplification |
The specificity of primer and probe designs fundamentally determines the reliability of PCR-based detection and quantification assays. By adhering to established design principles, conducting thorough in silico validation, and implementing rigorous experimental testing, researchers can develop robust assays suitable even for the most demanding applications like digital PCR-based absolute quantification. For multiplex assays, leveraging advanced computational design tools becomes essential to manage the complex interactions between numerous primers. As molecular diagnostics continues to advance toward more precise and sensitive applications, the foundational practices outlined in this application note will remain critical for generating trustworthy, reproducible results in both research and clinical settings.
Digital PCR (dPCR) enables absolute quantification of nucleic acid targets by partitioning a sample into thousands of individual reactions, performing end-point amplification, and applying Poisson statistics to count target molecules [58] [8]. This calibration-free method provides high sensitivity and accuracy, making it particularly valuable for detecting rare genetic mutations, copy number variations, and targets in complex backgrounds like those encountered in liquid biopsy and microbial ecotoxicology [51] [8]. However, two critical analytical challenges can impact the reliability of dPCR results: the phenomenon of "rain" in partition classification and ensuring a sufficient number of partitions for statistical power.
"Rain" refers to partitions exhibiting fluorescence intensities that are neither clearly positive nor negative, often appearing as a scatter of points between the main negative and positive clusters [58]. This phenomenon complicates the binary classification of partitions, potentially introducing bias in concentration estimates. Furthermore, the total number of partitions and the resulting mean copy per partition (λ) directly influence quantification uncertainty [59]. This application note details protocols for addressing these challenges within the context of dPCR anchoring for absolute abundance measurements in research.
Experimental Protocols for dPCR Analysis
Protocol 1: Absolute Abundance Workflow with dPCR Anchoring
This protocol is adapted from methods for absolute quantification of microbial taxa using dPCR anchoring of 16S rRNA gene amplicon sequencing data [2] [51].
Step 1: Sample Preparation and DNA Extraction
- Procedure: Extract total genomic DNA from samples (e.g., stool, mucosa, seawater) using a validated kit. For samples with high host DNA (e.g., mucosal biopsies), limit input mass to prevent column over-saturation. For viability assessment, treat samples with Propidium Monoazide (PMA) to selectively inhibit PCR amplification from membrane-compromised cells [51].
- Critical Parameters: Determine the Lower Limit of Quantification (LLOQ) for your sample type. For example, LLOQs may be 4.2 × 10^5 16S rRNA gene copies per gram for stool and 1 × 10^7 copies per gram for mucosal samples [2].
Step 2: 16S rRNA Gene Amplicon Sequencing
- Procedure: Amplify the 16S rRNA gene using universal primers. Monitor amplification reactions with real-time qPCR and stop in the late exponential phase to limit chimera formation. Perform high-throughput sequencing on an appropriate platform [2].
- Critical Parameters: The coefficient of variation (%CV) for a taxon's relative abundance increases significantly at low DNA input and low relative abundance. Define a minimum sequencing depth based on the lowest abundance taxa of interest [2].
Step 3: Digital PCR for Absolute Quantification
- Procedure:
- Critical Parameters: The dynamic range of the assay depends on the number of partitions; 20,000 partitions can achieve a dynamic range of five orders of magnitude [58].
Step 4: Data Integration and Quantitative Microbiome Profiling (QMP)
- Procedure: Use the absolute quantity of 16S rRNA gene copies per gram of sample (obtained from dPCR) to normalize the relative abundance data from sequencing. This converts relative proportions into absolute abundances for each taxon [2] [51].
- Analysis: Compare the effects of Quantitative Microbiome Profiling (QMP) versus Relative Microbiome Profiling (RMP) on diversity metrics and differential abundance testing.
Protocol 2: Optimized Classification of Partitions and 'Rain'
This protocol provides a method for robust cluster identification in multiplex dPCR experiments, which is critical for accurate absolute quantification.
Step 1: Data Acquisition and Preprocessing
- Procedure: Export the fluorescence amplitude data for all partitions (e.g., in FAM and HEX/VIC channels) from the dPCR instrument software.
Step 2: Selection and Application of Clustering Algorithms
- Procedure: Based on benchmarking studies [60], apply clustering algorithms to the fluorescence data. Suitable methods include:
dpcp: A two-step method using DBSCAN to identify cluster locations, followed by fuzzy c-means (cmeans) clustering [60].flowClust: A model-based method using t-mixture models with Box-Cox transformation [60].flowPeaks: A method combining k-means with empirical density estimation and cluster merging [60].
- Critical Parameters: The performance of clustering methods depends on data characteristics. For data with good separation between clusters but some outliers,
flowClustandflowPeaksare recommended. For complex data with higher levels of rain or closer cluster proximity,dpcporflowPeaksmay be more suitable [60]. Always use standardized data unless the algorithm specifies otherwise.
- Procedure: Based on benchmarking studies [60], apply clustering algorithms to the fluorescence data. Suitable methods include:
Step 3: Manual Validation and Threshold Adjustment
- Procedure: Visually inspect the clustering result in a 2D scatter plot. Partitions that are misclassified or fall into "rain" can often be manually re-assigned based on their proximity to established clusters.
- Critical Parameters: Manual correction should be performed conservatively and consistently across all samples in a study. Document any manual adjustments made.
Step 4: Concentration Calculation
The following diagram illustrates the core data analysis workflow for classifying partitions and managing rain, leading to absolute quantification.
Essential Reagents and Materials
Table 1: Research Reagent Solutions for dPCR-based Absolute Abundance Workflows
| Item | Function/Description | Example Application in Protocol |
|---|---|---|
| dPCR Instrument | Partitions samples, performs thermocycling, and reads endpoint fluorescence. | Absolute quantification of 16S rRNA genes or specific pathogens [2] [8]. |
| dPCR Reagent Kits | Master mixes containing polymerase, dNTPs, buffers; may be optimized for probe or dye-based detection. | Target amplification in partitioned samples [8]. |
| DNA Extraction Kits | Isolate high-quality genomic DNA from complex samples (stool, tissue, water). | Preparation of template DNA for sequencing and dPCR [2] [51]. |
| Propidium Monoazide (PMA) | DNA-binding dye that selectively inhibits PCR amplification from dead/damaged cells. | Differentiation of intact vs. compromised cells in microbial community analysis [51]. |
| 16S rRNA Gene Primers | "Universal" primers targeting conserved regions of the bacterial 16S rRNA gene. | Amplicon generation for high-throughput sequencing [2]. |
| Fluorogenic Probes (e.g., TaqMan) | Target-specific oligonucleotides with a reporter and quencher dye for sequence-specific detection. | Multiplex dPCR for simultaneous quantification of multiple targets [8]. |
Quantitative Data and Statistical Considerations
Guidelines for Partition Sufficiency
The precision of dPCR is subject to partitioning uncertainty (random distribution of targets) and subsampling uncertainty (analyzing only a portion of the sample) [59]. The required number of partitions depends on the target concentration and the desired level of precision.
Table 2: Impact of Partition Number and Target Concentration on Quantification
| Target Concentration (copies/partition, λ) | Recommended Minimum Partitions | Primary Source of Uncertainty | Comment on Statistical Power |
|---|---|---|---|
| Low (λ < 0.1) | 20,000+ | Subsampling uncertainty is dominant. | Essential for detecting rare targets (e.g., rare mutations, low-abundance taxa) [59]. |
| Medium (0.1 < λ < 3) | 10,000 - 15,000 | Balanced partitioning and subsampling uncertainty. | Provides a robust compromise for most absolute quantification applications [59]. |
| High (λ > 3) | Maximize number of partitions | Partitioning uncertainty increases. | A higher number of partitions is beneficial to minimize Poisson error, though reaction saturation becomes a limiting factor [59] [58]. |
Performance of Clustering Methods
A comprehensive benchmarking of clustering algorithms for dPCR data provides guidance on method selection based on data quality [60].
Table 3: Clustering Algorithm Performance for Partition Classification
| Clustering Method | Type | Recommended Data Scenario | Performance Notes |
|---|---|---|---|
dpcp |
Two-step (DBSCAN + cmeans) | Complex data with significant rain or close cluster proximity. | Requires clean references; performs well when lower-order clusters are present [60]. |
flowClust |
Model-based (t-mixture) | Data with good separation between clusters but some outliers. | Model parameters inferred via Expectation-Maximization; number of clusters can be pre-specified [60]. |
flowPeaks |
Density-based & Model-based | General use, various scenarios. | Starts with k-means; no need to pre-specify the number of clusters [60]. |
DBSCAN |
Density-based | Data with well-defined, dense clusters. | Requires pre-specification of the neighborhood distance and minimum number of neighbors [60]. |
The relationship between key experimental parameters and data quality is summarized below.
Robust dPCR data analysis is foundational for its application in absolute abundance measurements. Effectively interpreting "rain" through the use of benchmarked clustering algorithms and ensuring partition sufficiency by understanding the sources of uncertainty are both critical for achieving high statistical power. The protocols and data analysis frameworks provided here enable researchers to refine their dPCR assays, yielding more accurate and reliable absolute quantification data for demanding applications in microbiology, oncology, and diagnostic development.
Benchmarking dPCR: Performance Validation Against qPCR, Flow Cytometry, and Machine Learning
Digital PCR (dPCR) represents the third generation of PCR technology, emerging after conventional PCR and real-time quantitative PCR (qPCR) [5]. While qPCR has long been the gold standard for nucleic acid detection and relative quantification, dPCR offers a fundamentally different approach to measurement by partitioning a PCR mixture into thousands of individual reactions, enabling absolute quantification of target molecules without requiring standard curves [3] [5]. This technical comparison examines the performance characteristics of both platforms across critical parameters including sensitivity, precision, and resistance to PCR inhibitors—factors that significantly impact their application in research and diagnostic settings, particularly for absolute abundance measurements in complex sample matrices.
The core technological difference lies in their quantification methods. qPCR relies on relative quantification by comparing amplification cycle threshold (Cq) values to standard curves, while dPCR uses endpoint detection and Poisson statistics to calculate absolute target concentrations [61] [5]. This fundamental distinction underpins the performance differences observed in various application domains, from clinical diagnostics to environmental monitoring [7] [5].
Performance Comparison: Sensitivity, Precision, and Dynamic Range
Sensitivity and Detection Limits
Digital PCR demonstrates enhanced sensitivity compared to qPCR, particularly for low-abundance targets. In respiratory virus detection, dPCR showed superior accuracy for high viral loads of influenza A, influenza B, and SARS-CoV-2, along with improved detection of medium loads of RSV [3]. This increased sensitivity stems from dPCR's ability to detect rare events through massive partitioning, enabling identification of targets present at very low concentrations [62] [7].
When quantifying mitochondrial DNA deletions, dPCR significantly improved detection sensitivity through absolute quantitation, reduced assay standard error, and enhanced precision for low-abundance targets [62]. Similarly, in viral genome quantification, dPCR exhibited higher sensitivity compared to qPCR despite qPCR having a wider dynamic range [63]. The partitioning approach in dPCR reduces competition between targets in multiplex reactions and improves template availability, contributing to its enhanced sensitivity profile [3] [62].
Table 1: Sensitivity and Detection Limit Comparisons
| Application Area | qPCR Performance | dPCR Performance | Reference |
|---|---|---|---|
| Respiratory Virus Detection | Effective for medium to high viral loads; Ct value dependent | Superior accuracy for high viral loads (Influenza A/B, SARS-CoV-2) and medium RSV loads | [3] |
| mtDNA Deletion Detection | Limited sensitivity for low-abundance deletions; requires external calibration | Significant improvement in detection sensitivity and reduced standard error | [62] |
| Infectious Bronchitis Virus | Lower sensitivity compared to dPCR | Higher sensitivity; better detection of low-concentration targets | [63] |
| Synthetic Oligonucleotides | N/A | LOD: ~0.17-0.39 copies/μL; LOQ: ~1.35-4.26 copies/μL | [12] |
Measurement Precision and Accuracy
Digital PCR provides superior measurement precision and reproducibility compared to qPCR, particularly for targets with moderate to low abundance. In copy number variation studies using protist models, both droplet-based (ddPCR) and nanoplate-based (ndPCR) dPCR systems demonstrated high precision across most analyses, with coefficients of variation (CV) typically below 5% for optimized assays [12]. This precision advantage stems from dPCR's partitioning approach, which reduces the impact of amplification efficiency variations that commonly affect qPCR measurements [63] [12].
The absolute quantification capability of dPCR eliminates the need for standard curves, removing a significant source of variability introduced during reference material preparation and serial dilution [61] [5]. When comparing quantification of infectious bronchitis virus genome loads, dPCR showed higher precision in terms of repeatability and reproducibility compared to qPCR [63]. Similarly, in bacterial strain quantification, ddPCR demonstrated slightly better reproducibility than qPCR, though both methods showed excellent linearity (R² > 0.98) when proper DNA isolation methods were employed [49].
Table 2: Precision and Accuracy Comparisons
| Parameter | qPCR Characteristics | dPCR Characteristics | References |
|---|---|---|---|
| Quantification Basis | Relative to standard curves | Absolute using Poisson statistics | [61] [5] |
| Precision (Coefficient of Variation) | Moderate; efficiency-dependent | High; CV often <5% with optimized assays | [63] [12] |
| Repeatability | Lower compared to dPCR | Higher repeatability and reproducibility | [63] |
| Accuracy in Complex Matrices | Affected by inhibitors and matrix effects | Improved accuracy due to partitioning | [3] [49] |
| Multiplexing Precision | Affected by competition between targets | Improved due to physical separation | [3] |
Dynamic Range and Linearity
While dPCR excels in sensitivity and precision, qPCR typically offers a wider dynamic range [63] [49]. The limited dynamic range in dPCR stems from partition capacity constraints—once all partitions contain at least one target molecule, the system becomes saturated, establishing an upper quantification limit [12]. This contrasts with qPCR, which can quantify across a broader concentration range through serial dilution approaches.
For bacterial quantification in fecal samples, qPCR demonstrated a wider dynamic range while maintaining similar sensitivity to ddPCR when using kit-based DNA isolation methods [49]. Similarly, in viral genome quantification, the qPCR assay showed a wider quantification range than dPCR, though with compromised precision and sensitivity at the lower end of the range [63]. This suggests that the choice between platforms should consider the expected target concentration, with dPCR being preferable for low-abundance targets and qPCR remaining suitable for applications requiring broad dynamic range where extreme sensitivity is not critical.
Resistance to PCR Inhibitors
Mechanisms of Inhibitor Tolerance
Digital PCR demonstrates markedly superior resistance to PCR inhibitors compared to qPCR, attributable to both its partitioning technology and endpoint detection approach [64] [65]. In qPCR, inhibitors affect reaction kinetics and amplification efficiency, skewing Cq values and consequently impacting quantification accuracy [64] [65]. In contrast, dPCR's endpoint measurement is less affected by efficiency reductions—as long as amplification occurs sufficiently to distinguish positive from negative partitions, accurate quantification remains possible [65].
The partitioning process in dPCR physically separates inhibitor molecules from target DNA across thousands of individual reactions, effectively reducing local inhibitor concentrations in target-containing partitions [64] [7]. This distribution effect explains why complete inhibition requires significantly higher inhibitor concentrations in dPCR compared to qPCR [64]. Studies comparing humic acid inhibition demonstrated that accurate dPCR quantification remained possible at inhibitor concentrations that completely compromised qPCR measurements [65].
Performance in Challenging Matrices
Digital PCR's enhanced inhibitor tolerance makes it particularly valuable for analyzing complex sample matrices. In respiratory samples, which contain mucus, epithelial cell debris, and potential PCR inhibitors, dPCR demonstrated superior performance due to reduced susceptibility to these matrix effects [3]. Similarly, for environmental samples containing humic substances and clinical samples with blood-derived inhibitors like heparin and hemoglobin, dPCR maintained quantification accuracy at inhibitor levels that severely compromised qPCR results [64] [65].
When analyzing fecal samples for bacterial strains, both qPCR and dPCR performed well with proper DNA extraction methods, though dPCR's inherent inhibitor tolerance provided an advantage for minimally processed samples [49]. This robustness makes dPCR particularly suitable for applications requiring direct amplification from complex samples without extensive nucleic acid purification, where inhibitor carryover frequently affects qPCR reliability.
Application-Oriented Experimental Protocols
Protocol 1: Absolute Quantification of Respiratory Viruses using dPCR
Principle: This protocol enables absolute quantification of respiratory viral pathogens (Influenza A, Influenza B, RSV, SARS-CoV-2) without standard curves, providing improved accuracy for medium to high viral loads compared to qPCR [3].
Materials and Reagents:
- QIAcuity dPCR platform (QIAGEN) or equivalent droplet-based system
- Nanowell plates or droplet generation cartridges
- Viral nucleic acid extraction kit (e.g., MagMax Viral/Pathogen kit)
- Primer-probe mixes specific for target viruses
- dPCR master mix
- Internal control assay
- QIAcuity Suite Software v.0.1 or equivalent
Procedure:
- Sample Collection and Nucleic Acid Extraction:
- Collect respiratory samples (nasopharyngeal swabs, BAL) in appropriate transport media
- Extract RNA using automated platform (e.g., KingFisher Flex system) following manufacturer's protocol
- Quantify RNA quality and store at -80°C until analysis
dPCR Reaction Setup:
- Prepare multiplex reaction mixture containing:
- 11 μL dPCR master mix
- 1.1 μL primer-probe mix (optimized for multiplex detection)
- 5.5 μL RNA template
- Nuclease-free water to 22 μL total volume
- Vortex gently and centrifuge to collect mixture
- Prepare multiplex reaction mixture containing:
Partitioning and Amplification:
- Load samples into nanowell plates or droplet generation cartridges
- Execute partitioning according to platform specifications (~26,000 wells for QIAcuity)
- Perform endpoint PCR with the following cycling conditions:
- Reverse transcription: 50°C for 30 minutes
- Polymerase activation: 95°C for 2 minutes
- 40 cycles of: 95°C for 15 seconds, 60°C for 30 seconds
- Final hold: 4°C
Signal Detection and Analysis:
- Acquire fluorescence signals using integrated detector
- Analyze data with platform software applying Poisson statistics
- Calculate absolute copy numbers per μL of original sample
- Apply quality controls (internal control performance, partition count thresholds)
Validation: Compare results with parallel qPCR analysis using commercial respiratory panels (e.g., Allplex Respiratory Panel) stratified by Ct values into high (Ct ≤25), medium (Ct 25.1-30), and low (Ct >30) viral load categories [3].
Protocol 2: Environmental Sample Analysis with Inhibitor Tolerance Testing
Principle: This protocol evaluates dPCR performance in inhibitor-prone matrices and compares its resilience to qPCR, particularly relevant for soil, sediment, and complex clinical samples [64] [65].
Materials and Reagents:
- Crystal Digital PCR platform (Stilla Technologies) or equivalent
- qPCR system with comparable chemistry
- Inhibitor stocks: humic acid (soil simulator), heparin (blood anticoagulant)
- Target DNA (human genomic DNA or specific pathogen targets)
- ALB, EGFR, and BRAF gene assays or equivalent target panels
- PerfeCta Multiplex qPCR ToughMix or equivalent inhibitor-tolerant chemistry
Procedure:
- Inhibitor Preparation:
- Prepare humic acid stock solution at 1 mg/mL in nuclease-free water
- Prepare heparin stock solution at 1,000 IU/mL in nuclease-free water
- Serially dilute inhibitors to create working concentrations
Sample Spiking:
- Aliquot constant amount of target DNA (e.g., 5.4 ng/μL human genomic DNA)
- Spike with increasing inhibitor concentrations:
- Humic acid: 0, 10, 50, 100, 200 pg/μL
- Heparin: 0, 0.1, 0.5, 1.0, 2.0 IU/μL
- Include no-inhibitor controls for baseline quantification
Parallel dPCR and qPCR Analysis:
- dPCR Setup:
- Prepare reactions with primer-probe mixes for multiple targets (ALB, EGFR, BRAF)
- Partition samples according to platform specifications
- Perform endpoint PCR amplification
- Analyze using fraction positive partitions and Poisson statistics
- qPCR Setup:
- Use identical reaction chemistry and primer-probe concentrations
- Perform real-time amplification with standard curve quantification
- Record Cq values and calculate concentrations from standard curve
- dPCR Setup:
Inhibition Assessment:
- Calculate percentage inhibition relative to no-inhibitor controls
- Compare inhibition curves between dPCR and qPCR platforms
- Determine maximum inhibitor concentration maintaining ±20% accuracy
- Assess differential inhibition across multiple targets in multiplex format
Data Interpretation: dPCR typically maintains quantification accuracy at 2-5× higher inhibitor concentrations compared to qPCR, with humic acid tolerance of 50-100 pg/μL in dPCR versus complete inhibition at 50 pg/μL in qPCR [65].
Research Reagent Solutions and Platform Selection
Essential Research Reagents and Materials
Table 3: Key Reagent Solutions for dPCR Applications
| Reagent Category | Specific Examples | Function/Application | Considerations |
|---|---|---|---|
| Partitioning Systems | QIAcuity nanoplate technology (QIAGEN), QX200 droplet generator (Bio-Rad) | Physical separation of reactions for single-molecule amplification | Nanowell systems offer higher reproducibility; droplet systems provide greater scalability [3] [12] |
| Inhibitor-Tolerant Polymerases | PerfeCta Multiplex qPCR ToughMix, Phusion Flash | Maintain amplification efficiency in complex matrices | Essential for direct PCR from challenging samples without extensive purification [64] [65] |
| Nucleic Acid Extraction Kits | MagMax Viral/Pathogen kit, QIAamp Fast DNA Stool Mini Kit | Optimal recovery from specific sample types | Kit-based methods outperform phenol-chloroform for qPCR/dPCR applications [3] [49] |
| Multiplex Assay Systems | Custom primer-probe panels, commercially validated respiratory virus kits | Simultaneous detection of multiple targets | dPCR reduces competition in multiplex reactions compared to qPCR [3] |
| Inhibition Assessment Tools | Humic acid standards, heparin solutions, internal reference materials | System performance validation in complex matrices | Critical for method validation when analyzing environmental or clinical samples [64] [65] |
Platform Selection Guidelines
Platform choice between dPCR and qPCR should consider specific application requirements. dPCR is preferable for: absolute quantification without standards, low-abundance target detection, applications requiring high precision, and inhibitor-rich sample analysis [3] [63] [65]. qPCR remains suitable for: high-throughput routine testing, applications with well-characterized standards, broad dynamic range requirements, and budget-constrained settings where extreme sensitivity is not critical [63] [49].
Emerging dPCR platforms including the QIAcuity system offer faster setup and reduced sample handling through integrated nanoplate technology, while droplet-based systems like the QX200 provide established workflows with extensive application validation [3] [12]. The choice between specific dPCR platforms should consider partition density, multiplexing capability, workflow integration, and application-specific validation data.
Digital PCR demonstrates clear advantages over qPCR in sensitivity, precision, and inhibitor resistance, making it particularly valuable for absolute abundance measurements in research and diagnostic applications. The partitioning technology underlying dPCR enables absolute quantification without standard curves, reduces the impact of amplification inhibitors, and provides enhanced precision for low-abundance targets [3] [63] [65]. These advantages come with trade-offs including narrower dynamic range, higher per-sample costs, and more complex workflow requirements [63] [49].
The selection between dPCR and qPCR should be guided by specific application requirements, sample matrix characteristics, and quantification performance needs. dPCR is particularly suited for applications requiring absolute quantification, analysis of inhibitor-rich samples, and detection of rare targets—all critical considerations for anchoring absolute abundance measurements in research contexts. As dPCR technology continues to evolve with improved automation and reduced costs, its implementation is expected to expand across diverse research and diagnostic applications where measurement precision and accuracy are paramount.
Next-generation sequencing (NGS) technologies have revolutionized microbial ecology by enabling detailed characterization of microbial community composition. However, a significant limitation of standard 16S rRNA gene amplicon sequencing is that it generates inherently compositional data, reporting the relative proportion of each taxon within a sample rather than its absolute abundance [31] [9]. This compositional nature can be misleading, as an increase in the relative abundance of one taxon may result from an actual expansion of that population or merely from the decline of other community members [9]. Quantitative Microbiome Profiling (QMP) addresses this fundamental limitation by converting relative sequencing data into absolute counts, providing a true representation of microbial population dynamics that is essential for understanding community responses to environmental stressors, dietary interventions, or disease states [31].
The integration of digital PCR (dPCR) with flow cytometry (FC) represents a robust approach for microbial load anchoring in QMP workflows. dPCR provides precise, absolute quantification of total 16S rRNA gene copies through partitioning of the PCR reaction into thousands of nanoliter-sized reactions, enabling target molecule counting without the need for standard curves [5] [66]. Meanwhile, FC offers direct enumeration of intact microbial cells, distinguishing between living and dead cells based on membrane integrity when used with viability dyes [31]. When combined, these techniques provide complementary and validating measurements for normalizing 16S rRNA gene amplicon sequencing data, thereby enabling accurate determination of absolute taxon abundances in complex microbial communities [31].
Theoretical Framework: Principles of dPCR and Flow Cytometry for Microbial Quantification
Digital PCR (dPCR) Technology
Digital PCR (dPCR) represents the third generation of PCR technology, following conventional PCR and real-time quantitative PCR (qPCR) [5]. The fundamental principle involves partitioning a PCR reaction mixture containing the sample nucleic acids into thousands to millions of discrete compartments, such that each partition contains either zero, one, or a few target molecules according to Poisson distribution [5] [66]. Following endpoint PCR amplification, the fraction of positive partitions is counted, and the absolute concentration of the target nucleic acid is calculated using Poisson statistics, eliminating the need for external standard curves [5]. This partitioning approach provides dPCR with several advantages for microbial quantification, including exceptional sensitivity for detecting rare targets, absolute quantification capability, high accuracy and reproducibility, and increased tolerance to PCR inhibitors compared to qPCR due to the massive sample dilution during partitioning [66] [67].
Two primary dPCR platforms dominate current applications: droplet digital PCR (ddPCR), which utilizes water-in-oil emulsion droplets to create partitions [5] [66], and chip-based or microchamber dPCR, which employs nanoliter-scale wells embedded in solid chips [5]. While ddPCR offers greater scalability and cost-effectiveness, microchamber dPCR provides higher reproducibility and ease of automation [5].
Flow Cytometry for Microbial Cell Enumeration
Flow cytometry (FC) enables rapid, multiparametric analysis of physical and chemical characteristics of individual cells as they flow in a fluid stream through a laser beam [66]. For microbial applications, FC provides direct enumeration of total and intact microbial cells, with the capability to distinguish between living and dead cells using viability dyes such as propidium iodide (PI) and SYBR Green I [31]. The recent application of FC in microbial ecology includes its use as an anchoring method for QMP, where total cell counts or intact cell counts derived from FC serve as the "anchor" point for converting relative sequencing data to absolute abundances [31] [9].
FC offers several advantages for microbial load determination, including rapid analysis, multi-parameter data collection, and the ability to distinguish cell viability [66] [31]. However, challenges remain in distinguishing closely related bacterial species based solely on light scattering properties, often requiring specific fluorescent labeling for taxonomic resolution [66].
Complementary Nature of dPCR and Flow Cytometry
dPCR and FC provide complementary information when used together for microbial load anchoring. While dPCR quantifies the number of target gene copies (typically 16S rRNA genes), FC enumerates intact microbial cells. The combination of these techniques allows researchers to account for variations in 16S rRNA gene copy number per genome and to distinguish between genetic potential (dPCR) and actual intact cells (FC) [31]. This integrated approach provides a more comprehensive understanding of microbial community dynamics, particularly in applications where cell viability and metabolic activity are important considerations.
Table 1: Comparison of dPCR and Flow Cytometry for Microbial Quantification
| Parameter | Digital PCR (dPCR) | Flow Cytometry (FC) |
|---|---|---|
| Measurement Target | Nucleic acid molecules (e.g., 16S rRNA gene copies) | Intact microbial cells |
| Quantification Principle | Partitioning and Poisson statistics | Light scattering and fluorescence |
| Viability Assessment | No (unless combined with PMA) | Yes (with viability dyes) |
| Throughput | Medium to High | High |
| Sensitivity | Very High (single molecule) | High (single cell) |
| Information Content | Target-specific | Multi-parametric |
| PCR Inhibition Tolerance | High | Not applicable |
Integrated Experimental Protocol: dPCR with Flow Cytometry Anchoring for QMP
This protocol describes an optimized workflow for correlating dPCR with flow cytometry to determine absolute microbial abundances in environmental samples, adapted from the method validated for seawater microbiomes [31].
Sample Collection and Preparation
- Sample Collection: Collect samples appropriate for your ecosystem (e.g., 40L seawater filtered through 4.5μm filter [31], 200mg stool samples [9], or soil/sediment samples).
- Sample Aliquoting: Divide each sample into three aliquots for:
- Flow cytometry (0.5-1mL liquid or resuspended solid sample)
- DNA extraction for dPCR and sequencing (0.1-0.5g solid or filtered liquid sample)
- Optional propidium monoazide (PMA) treatment for viability assessment
- PMA Treatment for Viability Assessment (Optional):
- Prepare PMA working solution (e.g., 2.5-15μM in phosphate-buffered saline) [31]
- Add PMA to sample to final concentration of 2.5μM
- Incubate in dark for 10 minutes
- Expose to 464nm LED light for 30 minutes with continuous mixing to crosslink DNA from membrane-compromised cells
Flow Cytometry for Microbial Cell Enumeration
- Staining Procedure:
- For total cell counts: Stain 0.5mL sample with SYBR Green I (1:10,000 final dilution)
- For intact cell counts: Co-stain with SYBR Green I and propidium iodide (PI; 1-5μM final concentration)
- Incubate in dark at room temperature for 15 minutes
- Flow Cytometry Analysis:
- Use a flow cytometer with 488nm laser excitation
- Set trigger on green fluorescence (SYBR Green I)
- Collect at least 10,000 events per sample
- Use 1μm fluorescent beads as internal size standard and for volume calibration
- Gate populations based on green (SYBR Green I) versus red (PI) fluorescence to distinguish intact (SYBR Green I positive only) from damaged cells (SYBR Green I and PI positive)
- Cell Concentration Calculation:
- Calculate cells/mL = (Event count × Bead concentration) / (Bead event count × Sample volume)
DNA Extraction and Quality Control
- DNA Extraction:
- DNA Quality Assessment:
- Measure DNA concentration using fluorometric methods (e.g., Qubit)
- Check DNA purity using spectrophotometric ratios (A260/280 ~1.8-2.0)
- Assess DNA integrity by agarose gel electrophoresis if needed
Droplet Digital PCR for 16S rRNA Gene Quantification
- Reaction Setup:
- Prepare 20μL reaction mixture containing:
- 10μL of 2× ddPCR Supermix for Probes
- 1μL each of forward and reverse primers (final concentration 500nM)
- 0.5μL of probe (final concentration 250nM)
- 2μL template DNA
- Nuclease-free water to 20μL
- Use universal 16S rRNA gene primers (e.g., 515F/806R) with FAM-labeled probe
- Prepare 20μL reaction mixture containing:
- Droplet Generation:
- Transfer reaction mixture to DG8 cartridge
- Add 70μL droplet generation oil
- Place in QX200 Droplet Generator
- Transfer generated droplets to 96-well PCR plate
- PCR Amplification:
- Use the following thermal cycling conditions:
- Initial denaturation: 95°C for 10 minutes
- 40 cycles of:
- Denaturation: 94°C for 30 seconds
- Annealing/Extension: 55-60°C for 1 minute
- Enzyme deactivation: 98°C for 10 minutes
- Hold at 4°C
- Use the following thermal cycling conditions:
- Droplet Reading and Analysis:
- Place plate in QX200 Droplet Reader
- Analyze using QuantaSoft software
- Set threshold between positive and negative droplets based on negative controls
- Calculate copies/μL using Poisson statistics
16S rRNA Gene Amplicon Sequencing and Data Integration
- Library Preparation:
- Amplify V4 region of 16S rRNA gene using dual-indexed primers
- Use minimal amplification cycles to reduce bias
- Clean PCR products with magnetic beads
- Quantify library using fluorometry
- Sequencing:
- Pool libraries in equimolar ratios
- Sequence on appropriate platform (e.g., Illumina MiSeq)
- Bioinformatic Analysis:
- Process raw sequences using DADA2 or similar pipeline
- Generate amplicon sequence variants (ASVs)
- Assign taxonomy using reference database (e.g., SILVA, Greengenes)
- Data Integration for Absolute Abundance:
- Calculate absolute abundance of each ASV using the formula:
- Absolute Abundance (cells/g or mL) = (ASV relative abundance × Microbial load) / 16S rRNA gene copy number
- Where microbial load can be derived from:
- Flow cytometry: intact cell count from Live/Dead staining
- dPCR: total 16S rRNA gene copies normalized by average 16S copy number per genome
- Calculate absolute abundance of each ASV using the formula:
Applications and Validation Data
Performance Comparison of dPCR and Flow Cytometry for Microbial Load Determination
Strong correlation has been demonstrated between microbial load estimates from ddPCR and flow cytometry in natural seawater samples, confirming the suitability of both methods for normalizing 16S rRNA gene amplicon sequencing data [31]. The integration of these methods enables accurate assessment of absolute taxon abundances, providing insights into microbial community dynamics that are obscured in relative abundance analyses.
Table 2: Analytical Performance of dPCR and Flow Cytometry in Microbial Community Studies
| Application | Method | Key Performance Metrics | Reference |
|---|---|---|---|
| Seawater Microbiome | ddPCR & FC | Strong correlation between ddPCR and FC for total and intact cell counts | [31] |
| Gut Microbiome | dPCR anchoring | LLOQ: 4.2×10^5 16S copies/g (stool); 1×10^7 16S copies/g (mucosa) | [9] |
| Bacterial Quantification in Mixed Communities | Crystal Digital PCR | Reliable quantification down to 1:10,000 ratio | [66] |
| E. coli Bloodstream Infection | ddPCR | Sensitivity: 82.7%; Specificity: 100%; LOD: 75 copies/mL | [68] |
| Pathogen Detection in Complex Matrices | ddPCR | Better tolerance to PCR inhibitors in soil vs qPCR | [67] |
Case Study: Microbial Stress Response Assessment
The combined dPCR-FC anchoring approach has been successfully applied to assess how environmental stressors affect microbial communities in seawater [31]. Unlike relative abundance analysis, which failed to detect significant changes, absolute quantification revealed consistent abundance declines in specific ASVs when exposed to stressors, demonstrating the critical importance of absolute quantification for accurate interpretation of microbial community dynamics [31].
Diagnostic Applications: Pathogen Detection
In clinical microbiology, ddPCR has demonstrated superior sensitivity (96.4% vs 83.9%) compared to qPCR for detecting Phytophthora nicotianae in complex environmental samples [67]. Similarly, for Escherichia coli bloodstream infections, ddPCR showed 82.7% sensitivity and 100% specificity, with bacterial DNA load inversely correlating with time-to-positivity in blood culture and associated with disease severity [68]. These clinical applications highlight the utility of absolute quantification for improving diagnostic accuracy.
Research Reagent Solutions
Table 3: Essential Research Reagents and Tools for dPCR-FC QMP Workflow
| Category | Specific Product/Kit | Application Note |
|---|---|---|
| Digital PCR Systems | QX200 Droplet Digital PCR System (Bio-Rad) | Partitioning into ~20,000 droplets for absolute quantification [66] [67] |
| QIAcuity Digital PCR System (Qiagen) | Nanoplate-based partitioning with integrated thermocycling [5] | |
| Flow Cytometers | FACSCanto II (BD Biosciences) | Multi-parameter analysis for cell counting and viability [69] |
| Viability Stains | SYBR Green I + Propidium Iodide | Distinguish intact vs. membrane-compromised cells [31] |
| DNA Extraction Kits | DNeasy PowerSoil Kit (Qiagen) | Efficient lysis and purification from complex samples [31] [67] |
| PMA Reagent | PMAxx Dye (Biotium) | Selective detection of intact cells by inhibiting DNA amplification from compromised cells [31] |
| 16S rRNA Gene Primers/Probes | 515F/806R with FAM-labeled probe | Universal bacterial amplification for dPCR quantification [31] [9] |
| Digital PCR Master Mix | ddPCR Supermix for Probes (Bio-Rad) | Optimized reaction chemistry for droplet-based dPCR [67] [68] |
Workflow Visualization
Diagram 1: Integrated workflow for dPCR and flow cytometry anchoring in quantitative microbiome profiling.
Troubleshooting and Technical Considerations
Optimization of PMA Concentration
The effectiveness of PMA treatment for selective detection of intact cells varies by sample type and must be optimized for each application. For seawater samples, concentrations of 2.5-15μM PMA effectively inhibited PCR amplification of DNA from membrane-compromised cells, reducing 16S rRNA gene copies by 24-44% relative to untreated samples [31]. Higher PMA concentrations may be required for samples with higher organic matter content.
DNA Extraction Efficiency
DNA extraction efficiency must be validated across different sample types and microbial communities. Spike-in experiments with defined microbial communities show near-complete recovery of microbial DNA over 5 orders of magnitude, with approximately 2x accuracy in extraction across tissue types when total 16S rRNA gene input exceeds 8.3×10^4 copies [9]. The lower limit of quantification (LLOQ) was determined to be 4.2×10^5 16S rRNA gene copies per gram for stool/cecum contents and 1×10^7 copies per gram for mucosa samples [9].
Dynamic Range and Detection Limits
The dynamic range and detection limits of both dPCR and sequencing must be considered when designing experiments. Sequencing samples with low total microbial loads (<1×10^4 16S rRNA gene copies) may result in the presence of contaminants and taxon "dropouts" [9]. The quantitative limits of dPCR make it particularly suitable for low-biomass samples where qPCR may lack sensitivity.
The correlation of dPCR with flow cytometry for microbial load anchoring represents a significant advancement in quantitative microbiome research, enabling the conversion of relative sequencing data into absolute abundances. This integrated approach reveals microbial community dynamics that are obscured in relative abundance analyses and provides a more accurate foundation for understanding how microbial communities respond to environmental changes, dietary interventions, and disease states. The protocols and applications outlined herein provide researchers with a robust framework for implementing this powerful combination of techniques in diverse research settings.
The analysis of microbial communities via metagenomic sequencing has revolutionized our understanding of microbial ecosystems in human health and disease. However, a significant limitation persists: standard sequencing data is compositional, meaning it reveals only the relative proportions of microbial taxa within a sample, not their absolute quantities [9]. This compositional nature can obscure true biological changes, as an increase in one taxon's relative abundance may result from the actual decline of others [11]. Absolute abundance measurements are therefore crucial for accurately interpreting microbiome dynamics, particularly in clinical contexts like drug development where understanding microbial load is essential for assessing therapeutic interventions.
Traditional methods for obtaining absolute abundance, such as digital PCR (dPCR) anchoring and flow cytometry, are technically demanding, costly, and not readily scalable to large cohort studies [9] [51]. This application note explores a transformative synergy: the use of machine learning (ML) models to predict absolute prokaryotic abundance directly from DNA concentration and readily available metagenomic data. We frame these developments within the established context of dPCR anchoring, detailing the experimental workflows that enable this innovative approach and providing a protocol for its implementation.
Key Research and Data Foundations
Recent research has demonstrated a powerful correlation between simple laboratory measurements and absolute microbial abundance, creating a foundation for predictive modeling.
The Correlation Between DNA Concentration and Absolute Abundance
A seminal 2025 study by Wirbel et al. established a strong positive correlation (Spearman's rho = 0.92, p < 2e-16) between the total DNA concentration extracted from stool samples and the absolute number of 16S ribosomal RNA (rRNA) gene copies per extraction as measured by digital droplet PCR (ddPCR) [11] [70]. This relationship is pivotal because it suggests that a routinely collected, straightforward measurement—DNA concentration—can serve as a robust proxy for the more difficult-to-obtain absolute prokaryotic load.
Machine Learning Model Performance
Leveraging this correlation, Wirbel et al. developed machine learning models to predict absolute abundance. The performance of their models is summarized in Table 1.
Table 1: Performance Metrics of ML Models for Predicting Absolute Prokaryotic Abundance
| Model Type | Spearman's rho | Pearson's r | R² | Mean-Squared Error (MSE) | Concordance Correlation Coefficient (CCC) |
|---|---|---|---|---|---|
| DNA-only Model | 0.89 | 0.92 | 0.82 | 0.11 | 0.92 |
| Full Model | 0.91 | 0.94 | 0.86 | 0.08 | 0.93 |
The "Full Model" incorporated DNA concentration along with additional features such as the fraction of human reads, prokaryotic alpha diversity, and high-level domain taxonomic information [11]. This model demonstrated exceptional prediction accuracy on an external validation cohort including individuals with Parkinson's disease and healthy controls, confirming its generalizability.
Experimental Protocols
The following protocols detail the steps for establishing the ground truth via dPCR and for building the machine learning predictor.
Protocol 1: Absolute Abundance Quantification via dPCR Anchoring
This protocol describes how to generate the ground truth data for absolute microbial abundance, against which the machine learning model is trained [9] [11].
1. Sample Preparation and DNA Extraction
- Weigh a standardized amount of starting material (e.g., 200 mg of stool or a defined mass of mucosal tissue).
- Extract genomic DNA using a column-based kit. It is critical to determine the maximum sample input that does not exceed the column's binding capacity (e.g., 20 µg), especially for host-rich samples like mucosa.
- Elute DNA in a known volume of buffer and quantify the total DNA concentration using a fluorescent assay (e.g., Qubit). Record this value.
2. Digital PCR (dPCR) for 16S rRNA Gene Quantification
- Prepare a dPCR reaction mix using universal primers targeting the V4 region of the 16S rRNA gene. The use of a microfluidic well-based system (Crystal Digital PCR) or a droplet-based system (ddPCR) is acceptable [11] [40].
- Partition the PCR reaction into thousands of nanoliter-sized droplets or wells.
- Perform PCR amplification with the following cycling conditions (optimized for 16S rRNA gene):
- Initial Denaturation: 95°C for 10 minutes.
- 40 cycles of:
- Denaturation: 95°C for 30 seconds.
- Annealing: 55°C for 60 seconds.
- Extension: 72°C for 90 seconds.
- Final Hold: 4°C.
3. Data Analysis and Absolute Quantification
- After amplification, count the number of partitions that are positive for the 16S rRNA gene amplicon.
- Use the fraction of positive partitions and Poisson statistics to calculate the absolute concentration of 16S rRNA gene copies per microliter of the dPCR reaction.
- Calculate the total 16S rRNA gene copies in the DNA extraction and normalize it to the original sample mass (e.g., copies per gram of stool). This value is the absolute prokaryotic abundance.
Protocol 2: Building a Machine Learning Predictor for Absolute Abundance
This protocol outlines the workflow for training a model to predict the dPCR-derived absolute abundance from standard metagenomic data [11].
1. Feature Collection For each sample in the training cohort, compile the following data:
- Total DNA concentration (µg/µL) from the extraction.
- Metagenomic sequencing data:
- Host DNA fraction: The percentage of sequencing reads that map to the host genome.
- Prokaryotic alpha diversity: Calculate the Shannon Diversity Index from the taxonomic profile.
- High-level taxonomic relative abundances: The proportions of Bacteria, Archaea, and Eukarya.
- Meta-data: Information such as sample storage conditions (e.g., same-day vs. next-day freezing).
2. Model Training
- Use the absolute abundance value from Protocol 1 as the target variable for the model.
- Implement a Random Forest regression model using a ten times-repeated 10-fold cross-validation strategy.
- For the "Full Model," use all features from Step 1. For a "DNA-only" model, use only the DNA concentration.
- Optimize hyperparameters (e.g., tree depth, number of estimators) through a grid search within the cross-validation framework to prevent overfitting.
3. Model Validation
- Perform cross-validation on the training cohort to assess performance metrics (see Table 1).
- As a more rigorous test, use a leave-one-plate-out validation strategy, where the model is trained on samples from five 96-well plates and tested on the held-out sixth plate.
- Finally, validate the final trained model on a completely external cohort with distinct characteristics (e.g., a different disease population) to confirm generalizability.
Workflow Visualization
The diagram below illustrates the integrated workflow, from wet-lab procedures to in-silico prediction, highlighting how dPCR anchoring and machine learning synergize.
The Scientist's Toolkit: Research Reagent Solutions
Table 2: Essential Reagents and Kits for Implementing the dPCR and ML Workflow
| Item | Function / Application | Example / Note |
|---|---|---|
| DNA Extraction Kit | Isolation of high-quality genomic DNA from complex samples. | Column-based kits (e.g., Qiagen DNeasy PowerSoil). Validate extraction efficiency for Gram-positive and Gram-negative bacteria [9]. |
| Universal 16S rRNA Primers | Amplification of a conserved region for dPCR quantification and amplicon sequencing. | Primers targeting the V4 region (e.g., 515F/806R). Use improved primers to limit amplification bias [9]. |
| dPCR/ddPCR System | Absolute quantification of 16S rRNA gene copy number without a standard curve. | Crystal Digital PCR [40] or Bio-Rad ddPCR systems. Partitions samples for precise digital counting. |
| Propidium Monoazide (PMA) | (Optional) Selective detection of intact/viable cells by inhibiting DNA amplification from membrane-compromised cells. | For viability assessment in environmental samples; optimize concentration (e.g., 2.5-15 µM for seawater) [51]. |
| Metagenomic Library Prep Kit | Preparation of sequencing libraries for shotgun metagenomics. | Kits from Illumina or other NGS providers. Enables taxonomic profiling and host DNA fraction calculation. |
| Machine Learning Framework | Building and training the random forest regression model. | Python with scikit-learn or R with caret. Enables model training, cross-validation, and prediction [11]. |
The synergy between dPCR-based absolute quantification and machine learning prediction represents a significant advancement in quantitative microbiome research. While dPCR provides an essential and validated ground truth, the ML model offers a scalable, cost-effective solution for estimating absolute abundance in large-scale studies where performing dPCR on every sample is impractical. This integrated workflow empowers researchers and drug developers to move beyond relative abundances, enabling a more accurate understanding of microbial ecosystem dynamics in health and disease. For clinical applications, further validation of these models in diverse populations and sample types is recommended to ensure robust and reliable predictions.
Digital PCR (dPCR) has emerged as a powerful technology for the absolute quantification of nucleic acids, providing unparalleled precision for applications in research and drug development. The two predominant partitioning methods—nanoplate-based and droplet-based dPCR—each present distinct advantages and limitations. This application note provides a detailed comparison of these platforms, supported by quantitative data and experimental protocols, to guide researchers in selecting the optimal system for absolute abundance measurements in their specific research context.
Digital PCR (dPCR) is a method for the absolute quantification of nucleic acid concentrations without the need for a standard curve. This is achieved through a combination of limiting dilution, end-point PCR, and Poisson statistics [71]. The fundamental process involves partitioning a PCR reaction mixture into thousands of independent microreactions. Each partition effectively contains zero, one, or several target nucleic acid molecules. Following endpoint amplification, the presence or absence of fluorescent signal in each partition is detected, providing a binary ("on/off") readout [71]. The absolute number of target molecules in the original sample is then calculated using Poisson statistics to account for the random distribution of templates across the partitions [71]. This partitioning step is where nanoplate-based and droplet-based systems fundamentally differ, leading to variations in workflow, performance, and application suitability.
Technology Comparison: Nanoplate-based vs. Droplet-based dPCR
Partitioning Mechanism and Workflow
Nanoplate-based dPCR: This system uses a microfluidic digital PCR plate—typically with 96 or 24 wells—where each well is subdivided into thousands of nanoscale chambers [25]. The workflow is highly integrated: after pipetting the reaction mix into the nanoplate, the instrument manages partitioning, thermocycling, and imaging automatically within a single system [25]. The process is completed in approximately 2 hours, offering a workflow very similar to qPCR [25].
Droplet-based dPCR (ddPCR): This method uses an immiscible fluid in oil to generate tens of thousands of sub-microliter droplets, which act as individual reaction chambers [25]. The workflow involves multiple instruments: a droplet generator, a thermocycler, and a droplet reader [25]. The emulsion is collected in a vial after droplet generation, transferred for endpoint PCR, and then processed by a flow cytometer where droplets are read one-by-one as they pass a laser [25]. This multi-step process is more time-consuming and cumbersome than the nanoplate-based approach [25].
Performance and Technical Specifications
The table below summarizes key performance characteristics of various dPCR platforms, including representative nanoplate-based and droplet-based systems:
Table 1: Comparison of dPCR Platform Performance Characteristics [25]
| Partitioning Type | dPCR Platform | Number of Partitions per Well | Volume per Well (µL) | Throughput (reactions/run) | Sample Turnaround Time (TAT) |
|---|---|---|---|---|---|
| Nanoplate | QIACuity | 8,500 or 26,000 | 12 and 40 | 312 to 1,248 | 8 hours for 1,248 samples |
| Droplet Plate | Bio-Rad QX One | 20,000 | 20 | 480 (5 plates) | 21 hours for 480 samples |
| Microarray Plate | Thermo Fisher Scientific | 20,000 | 20 | 16 | 2.5 hours for 16 samples |
| Microfluidic Chips | Stilla Technologies Naica System | 20,000 | 14.5 | 24 | 2-3 hours for 24 samples |
Advantages and Limitations
Nanoplate-based dPCR Advantages: Streamlined workflow with reduced hands-on time; lower risk of contamination due to a closed system; faster run times; high multiplexing capabilities (up to 5-plex); and simplified operation requiring less extensive training [25] [10]. The integrated nature of the system also saves valuable lab space [25].
Nanoplate-based dPCR Limitations: Potentially higher initial instrument cost; less established in some research areas compared to older droplet-based systems [25].
Droplet-based dPCR Advantages: Capacity to generate a very large number of partitions (up to millions in some systems); well-established method with extensive literature support; and proven utility in various research applications [25] [72].
Droplet-based dPCR Limitations: Droplet variability in size and shape can adversely affect robustness and reproducibility; workflow requires multiple instruments and transfer steps, increasing contamination risk and hands-on time; data quality can be compromised by droplet coalescence or shearing; and the appearance of "rain" (droplets with intermediate fluorescence) complicates data interpretation [25].
Experimental Protocols for System Evaluation
Protocol 1: Sensitivity and Precision Assessment Using Synthetic Oligonucleotides
Purpose: To determine the Limit of Detection (LOD), Limit of Quantification (LOQ), accuracy, and precision of nanoplate-based and droplet-based dPCR systems [12].
Materials:
- Synthetic oligonucleotides with known target sequences
- dPCR master mix (appropriate for each platform)
- Restriction enzymes (HaeIII and EcoRI)
- QIAcuity One nanoplate-based dPCR system (QIAGEN) or QX200 droplet-based dPCR system (Bio-Rad)
- Appropriate fluorometer for DNA concentration measurement (e.g., Qubit Fluorometer)
Procedure:
- Sample Preparation: Prepare a serial dilution series of synthetic oligonucleotides covering a range from <0.5 copies/µL to >3000 copies/µL input [12].
- Reaction Setup: For each dilution, prepare reaction mixtures according to manufacturer recommendations for each platform. Include replicates for precision assessment.
- Restriction Enzyme Digestion: Split each sample and treat with either HaeIII or EcoRI restriction enzymes to evaluate the impact on gene copy number quantification, particularly for tandemly repeated genes [12].
- dPCR Run: Load samples onto respective platforms:
- Data Analysis:
- Calculate LOD and LOQ using appropriate statistical models (e.g., 3rd degree polynomial model) [12].
- Determine accuracy by comparing expected vs. measured gene copy numbers.
- Calculate precision using coefficient of variation (CV) across replicates.
Expected Results: Both platforms should demonstrate similar detection and quantification limits with high precision. A 2025 study reported an LOD of approximately 0.39 copies/µL for ndPCR and 0.17 copies/µL for ddPCR, with LOQ values of 1.35 copies/µL and 4.26 copies/µL, respectively [12].
Protocol 2: Viral Load Quantification in Clinical Samples
Purpose: To compare the performance of nanoplate-based dPCR and Real-Time RT-PCR in detecting and quantifying respiratory viruses (Influenza A, Influenza B, RSV, SARS-CoV-2) [3].
Materials:
- Respiratory samples (nasopharyngeal swabs, bronchoalveolar lavage)
- Nucleic acid extraction kits (e.g., MagMax Viral/Pathogen kit)
- Multiplex primer-probe sets for target viruses
- QIAcuity nanoplate-based dPCR system (QIAGEN)
- Real-Time RT-PCR system
Procedure:
- Sample Collection and Stratification: Collect respiratory samples and stratify by Ct values into high (≤25), medium (25.1-30), and low (>30) viral load categories [3].
- Nucleic Acid Extraction: Extract RNA using an automated platform (e.g., KingFisher Flex system) according to manufacturer protocols [3].
- dPCR Analysis:
- Prepare reaction mixtures with multiplex primer-probe sets.
- Load into QIAcuity nanoplates and run with appropriate cycling conditions.
- Analyze using QIAcuity Suite software for absolute copy number quantification.
- Real-Time RT-PCR Analysis: Perform parallel analysis using commercial respiratory panel kits on a standard real-time PCR system.
- Data Comparison: Compare quantification results between methods across viral load categories, assessing consistency and precision.
Expected Results: dPCR demonstrates superior accuracy, particularly for high viral loads of influenza A, influenza B, and SARS-CoV-2, and for medium loads of RSV. It shows greater consistency and precision than Real-Time RT-PCR, especially in quantifying intermediate viral levels [3].
Workflow Visualization
Diagram 1: dPCR platform workflow comparison. The nanoplate-based system offers a more streamlined, integrated process.
Research Reagent Solutions
Table 2: Essential Reagents for dPCR Experiments
| Reagent/Material | Function | Example Products/Notes |
|---|---|---|
| dPCR Master Mix | Provides enzymes, nucleotides, and buffers optimized for partitioning | Platform-specific mixes (e.g., QIAcuity Probe PCR Master Mix, ddPCR Supermix) |
| Fluorogenic Probes | Target-specific detection with fluorescent reporters | FAM, HEX, VIC, CY5-labeled probes; must be compatible with instrument optics [73] |
| Restriction Enzymes | Enhance access to target sequences by digesting DNA | HaeIII, EcoRI; particularly important for tandemly repeated genes [12] |
| Nucleic Acid Purification Kits | Isolation of high-quality DNA/RNA from samples | QIAamp Ultrasense Virus Kit, MasterPure Complete DNA & RNA Purification Kit [72] |
| Sealing Foils | Prevent evaporation and cross-contamination in nanoplates | Optical seals compatible with thermocycling and imaging [71] |
| Droplet Generation Oil | Creates water-in-oil emulsion for droplet systems | Specific oils matched to droplet generator systems [25] |
Application Scenarios and Platform Selection Guide
Recommended Applications for Nanoplate-based dPCR:
- High-throughput clinical diagnostics: The streamlined workflow and rapid turnaround time make it ideal for clinical settings processing large sample volumes [3].
- Quality control in cell and gene therapy: The integrated system with reduced contamination risk is advantageous for GMP environments and QC release assays [10].
- Routine absolute quantification: When simplicity and ease of use are priorities, particularly in laboratories with high personnel turnover [25].
- Multiplexing applications: Projects requiring detection of multiple targets (up to 5-plex) in a single reaction [25].
Recommended Applications for Droplet-based dPCR:
- Research requiring maximum partitioning: Applications where the highest possible number of partitions is critical for precision [25].
- Established research protocols: When following well-characterized ddPCR methods with extensive literature support [72] [74].
- Specialized applications requiring unique droplet-based chemistries: Specific assays optimized for the droplet format.
Table 3: Platform Selection Guide Based on Research Needs
| Research Requirement | Recommended Platform | Rationale |
|---|---|---|
| High-Throughput Processing | Nanoplate-based | Faster turnaround time; higher throughput capability [25] [3] |
| Maximized Partition Number | Droplet-based | Can generate up to millions of partitions in some systems [25] |
| Multiplexing (3+ targets) | Nanoplate-based | Superior multiplexing capabilities (up to 5-plex) [25] |
| Minimal Hands-on Time | Nanoplate-based | Integrated "sample-to-result" workflow [10] |
| Reduced Contamination Risk | Nanoplate-based | Closed system with fewer transfer steps [25] [73] |
| GMP/Regulated Environments | Nanoplate-based | Streamlined workflow, auditing features support compliance [10] |
The choice between nanoplate-based and droplet-based dPCR systems depends largely on the specific research requirements and operational constraints. Nanoplate-based systems offer significant advantages in workflow efficiency, ease of use, and reduced contamination risk, making them particularly suitable for high-throughput environments, clinical diagnostics, and regulated environments. Droplet-based systems remain valuable for applications requiring the highest number of partitions or for well-established research protocols. Researchers should consider their specific application needs, sample throughput requirements, and available laboratory resources when selecting between these platforms. As both technologies continue to evolve, performance differences are likely to narrow further, making workflow considerations increasingly important in the selection process.
Conclusion
Digital PCR anchoring has firmly established itself as a critical tool for moving beyond relative proportions to true absolute quantification in molecular biology. By providing a calibration-free method with exceptional sensitivity, dPCR enables researchers to accurately measure microbial loads, quantify rare mutations in liquid biopsies, and validate genetic constructs with high confidence. The future of dPCR is pointed toward greater integration—with AI-driven data analysis, portable point-of-care platforms, and sophisticated multiplexing. For biomedical research and clinical diagnostics, the adoption of dPCR for absolute abundance measurement is not just a methodological improvement but a fundamental shift towards more precise, reliable, and actionable quantitative data, ultimately strengthening the pipeline from basic discovery to therapeutic application.
References
- 1. Relative versus absolute RNA quantification [https://pmc.ncbi.nlm.nih.gov/articles/PMC7883443/]
- 2. A quantitative sequencing framework for absolute ... [https://pmc.ncbi.nlm.nih.gov/articles/PMC7244552/]
- 3. Comparative Performance of Digital PCR and Real-Time RT ... [https://pmc.ncbi.nlm.nih.gov/articles/PMC12474457/]
- 4. Digital droplet PCR is an accurate and precise method to ... [https://www.nature.com/articles/s41598-025-20944-4]
- 5. Digital PCR: from early developments to its future application ... [https://pubs.rsc.org/en/content/articlehtml/2025/lc/d5lc00055f]
- 6. Mastering dMIQE Guidelines for the Publication of dPCR ... [https://www.thermofisher.com/us/en/home/life-science/pcr/digital-pcr/education/basic-research/mastering-dmiqe-guidelines.html]
- 7. Droplet Digital PCR for Estimating Absolute Abundances of ... [https://www.frontiersin.org/journals/microbiology/articles/10.3389/fmicb.2019.01226/full]
- 8. Digital PCR: from early developments to its future application ... [https://pmc.ncbi.nlm.nih.gov/articles/PMC12278255/]
- 9. A quantitative sequencing framework for absolute ... [https://www.nature.com/articles/s41467-020-16224-6]
- 10. dPCR vs. ddPCR: Why Precision Matters in Cell and Gene ... [https://www.roslinct.com/insights/dpcr-vs-ddpcr/]
- 11. Accurate prediction of absolute prokaryotic abundance ... [https://pmc.ncbi.nlm.nih.gov/articles/PMC12146642/]
- 12. Comparing the precision of two digital PCR applications for ... [https://www.nature.com/articles/s41598-025-13143-8]
- 13. Digital PCR outperforms quantitative real-time PCR for the ... [https://pmc.ncbi.nlm.nih.gov/articles/PMC12288185/]
- 14. Droplet Digital PCR: Advantages and Applications in ... [https://www.labx.com/resources/droplet-digital-pcr-advantages-and-applications-in-molecular-diagnostics/5581]
- 15. Quantitative or digital PCR? A comparative analysis for ... [https://www.sciencedirect.com/science/article/abs/pii/S0165993624001584]
- 16. Entering the Digital Age for Quantitative PCR Analysis [https://bitesizebio.com/27227/entering-the-digital-age-for-quantitative-pcr-analysis-digital-pcr/]
- 17. Absolute quantification of rare gene targets in limited ... [https://www.nature.com/articles/s41598-025-94115-w]
- 18. Rapid and Sensitive Digital Droplet PCR Assays for ... [https://pmc.ncbi.nlm.nih.gov/articles/PMC11683180/]
- 19. Detection of CNV with digital PCR (dPCR) [https://sequencing.roche.com/us/en/article-listing/digital-pcr-dpcr-for-cnv.html]
- 20. PCR past, present and future - PMC - PubMed Central [https://pmc.ncbi.nlm.nih.gov/articles/PMC7439763/]
- 21. Real-Time vs Digital vs Traditional PCR [https://www.thermofisher.com/us/en/home/life-science/pcr/real-time-pcr/real-time-pcr-learning-center/real-time-pcr-basics/real-time-vs-digital-vs-traditional-pcr.html]
- 22. PCR Technologies Market Growth, Drivers, and Opportunities [https://www.marketsandmarkets.com/Market-Reports/pcr-technologies-market-96291811.html]
- 23. dPCR Platforms: Competitive Landscape and Growth ... [https://www.datainsightsmarket.com/reports/dpcr-platforms-1027803]
- 24. Comparison of digital PCR platforms using the molecular ... [https://pmc.ncbi.nlm.nih.gov/articles/PMC10326530/]
- 25. Comparison of digital PCR methods [https://www.qiagen.com/us/knowledge-and-support/knowledge-hub/bench-guide/pcr/digital-pcr/comparison-of-digital-pcr-methods]
- 26. Comparative Analysis of Two Digital PCR Platforms for ... [https://pmc.ncbi.nlm.nih.gov/articles/PMC12361875/]
- 27. Digital PCR: from early developments to its future ... [https://pubs.rsc.org/en/content/articlelanding/2025/lc/d5lc00055f]
- 28. Absolute quantification of prokaryotes in the microbiome by ... [https://pubmed.ncbi.nlm.nih.gov/40389632/]
- 29. Development of an eDNA-based qPCR and dPCR method ... [https://www.sciencedirect.com/science/article/pii/S235198942500112X]
- 30. ddpcr: Analysis and visualization of Droplet Digital PCR ... [https://cran.r-project.org/web/packages/ddpcr/readme/README.html]
- 31. Development of a quantitative PMA-16S rRNA gene ... [https://pmc.ncbi.nlm.nih.gov/articles/PMC12220233/]
- 32. Development and validation of a PMA-qPCR method for ... [https://www.frontiersin.org/journals/microbiology/articles/10.3389/fmicb.2024.1456274/full]
- 33. Development of a viability digital PCR protocol for the ... [https://www.nature.com/articles/s41598-019-47976-x]
- 34. Improved Canker Processing and Viability Droplet Digital ... [https://www.mdpi.com/2076-2607/12/2/376]
- 35. Universal rules govern plasmid copy number [https://www.nature.com/articles/s41467-025-61202-5]
- 36. Comparison of Droplet Digital PCR and Metagenomic Next ... [https://pmc.ncbi.nlm.nih.gov/articles/PMC9469937/]
- 37. Liquid biopsy – a narrative review with an update on current ... [https://pmc.ncbi.nlm.nih.gov/articles/PMC12333414/]
- 38. a roadmap for DNA methylation biomarkers in liquid biopsies [https://www.nature.com/articles/s41388-025-03624-5]
- 39. Regular article Comparison of Real-Time PCR and Digital ... [https://www.sciencedirect.com/science/article/pii/S1525157823000740]
- 40. Crystal Digital PCR™ Enables Precise Quantification of ... [https://www.mdpi.com/2076-2607/13/11/2592]
- 41. Digital PCR Multiplex Assay Optimization [https://www.stillatechnologies.com/digital-pcr/primer-design/multiplex-assay-optimization/]
- 42. For Clinical Labs: Avoid False-Positives and Negatives by ... [https://blog.seracare.com/molecular-serology-blog/for-clinical-labs-avoid-false-positives-and-negatives-by-being-a-control-freak]
- 43. Universal digital high-resolution melt: a novel approach to ... [https://pmc.ncbi.nlm.nih.gov/articles/PMC3794612/]
- 44. High Resolution Melting (HRM) [https://www.thermofisher.com/us/en/home/life-science/pcr/real-time-pcr/real-time-pcr-applications/genetic-variation-analysis-using-real-time/high-resolution-melting-hrm.html]
- 45. Avoiding false positives with PCR | IDT [https://www.idtdna.com/page/support-and-education/decoded-plus/how-to-avoid-false-positives-in-pcr-and-what-to-do-if-you-get-them/]
- 46. Validating digital polymerase chain reaction for 16S rRNA ... [https://pmc.ncbi.nlm.nih.gov/articles/PMC12342375/]
- 47. Challenges Using Droplet Digital PCR for Environmental ... [https://www.mdpi.com/2673-8007/1/1/7]
- 48. Improving eDNA yield and inhibitor reduction through ... [https://www.nature.com/articles/s41598-019-40977-w]
- 49. Highly accurate and sensitive absolute quantification of ... [https://microbiomejournal.biomedcentral.com/articles/10.1186/s40168-024-01881-2]
- 50. Optimization of Low-Biomass Sample Collection and ... [https://pmc.ncbi.nlm.nih.gov/articles/PMC9769501/]
- 51. Development of a quantitative PMA-16S rRNA gene ... [https://environmentalmicrobiome.biomedcentral.com/articles/10.1186/s40793-025-00741-2]
- 52. Review Digital PCR for accurate quantification of pathogens [https://www.sciencedirect.com/science/article/abs/pii/S0141813021013611]
- 53. Designing highly multiplex PCR primer sets with Simulated ... [https://www.nature.com/articles/s41467-022-29500-4]
- 54. Rules and Tips for PCR & qPCR Primer Design | IDT [https://www.idtdna.com/page/support-and-education/decoded-plus/how-to-design-primers-and-probes-for-pcr-and-qpcr/]
- 55. Predicting the sensitivity and specificity of published real-time ... [https://ann-clinmicrob.biomedcentral.com/articles/10.1186/1476-0711-7-18]
- 56. Specificity of Primers and Probes for Molecular Diagnosis ... [https://pmc.ncbi.nlm.nih.gov/articles/PMC12566895/]
- 57. A high-throughput assay for quantitative measurement of ... [https://www.nature.com/articles/s41598-017-02727-8]
- 58. BLINK Digital PCR Analysis [https://www.blink-dx.com/post/blink-digital-pcr-analysis]
- 59. Partitioning and subsampling statistics in compartment-based ... [https://pmc.ncbi.nlm.nih.gov/articles/PMC10184943/]
- 60. Benchmarking digital PCR partition classification methods ... [https://pmc.ncbi.nlm.nih.gov/articles/PMC10981767/]
- 61. Droplet Digital PCR for Measuring Absolute Copies of ... [https://pubmed.ncbi.nlm.nih.gov/31273732/]
- 62. Digital PCR methods improve detection sensitivity and ... [https://www.nature.com/articles/srep25186]
- 63. Comparison of quantitative PCR and digital PCR assays ... [https://www.sciencedirect.com/science/article/pii/S0166093423001842]
- 64. PCR inhibition in qPCR, dPCR and MPS—mechanisms and ... [https://pmc.ncbi.nlm.nih.gov/articles/PMC7072044/]
- 65. Effect of Inhibitors - Crystal Digital PCR™ vs qPCR [https://www.stillatechnologies.com/digital-pcr/naica-application-notes/effect-of-inhibitors-crystal-digital-pcr-vs-qpcr/]
- 66. Crystal Digital PCR™ Enables Precise Quantification of ... [https://pmc.ncbi.nlm.nih.gov/articles/PMC12654214/]
- 67. Development and validation of a droplet digital PCR assay ... [https://www.frontiersin.org/journals/plant-science/articles/10.3389/fpls.2025.1573949/full]
- 68. Clinical diagnostic performance of droplet digital PCR for ... [https://bmcinfectdis.biomedcentral.com/articles/10.1186/s12879-024-10396-y]
- 69. Digital Polymerase Chain Reaction (dPCR) Versus Flow ... [https://www.sciencedirect.com/science/article/abs/pii/S0006497123137487]
- 70. Accurate prediction of absolute prokaryotic abundance from ... [https://pubmed.ncbi.nlm.nih.gov/40300608]
- 71. Fundamentals of digital PCR [https://www.qiagen.com/us/knowledge-and-support/knowledge-hub/bench-guide/pcr/digital-pcr/what-is-digital-pcr]
- 72. Droplet Digital PCR for Estimating Absolute Abundances of ... [https://pmc.ncbi.nlm.nih.gov/articles/PMC6581686/]
- 73. Development of a Nanoplate-Based Digital PCR Test ... [https://pmc.ncbi.nlm.nih.gov/articles/PMC10986707/]
- 74. Droplet Digital PCR versus qPCR for gene expression ... [https://www.nature.com/articles/s41598-017-02217-x]