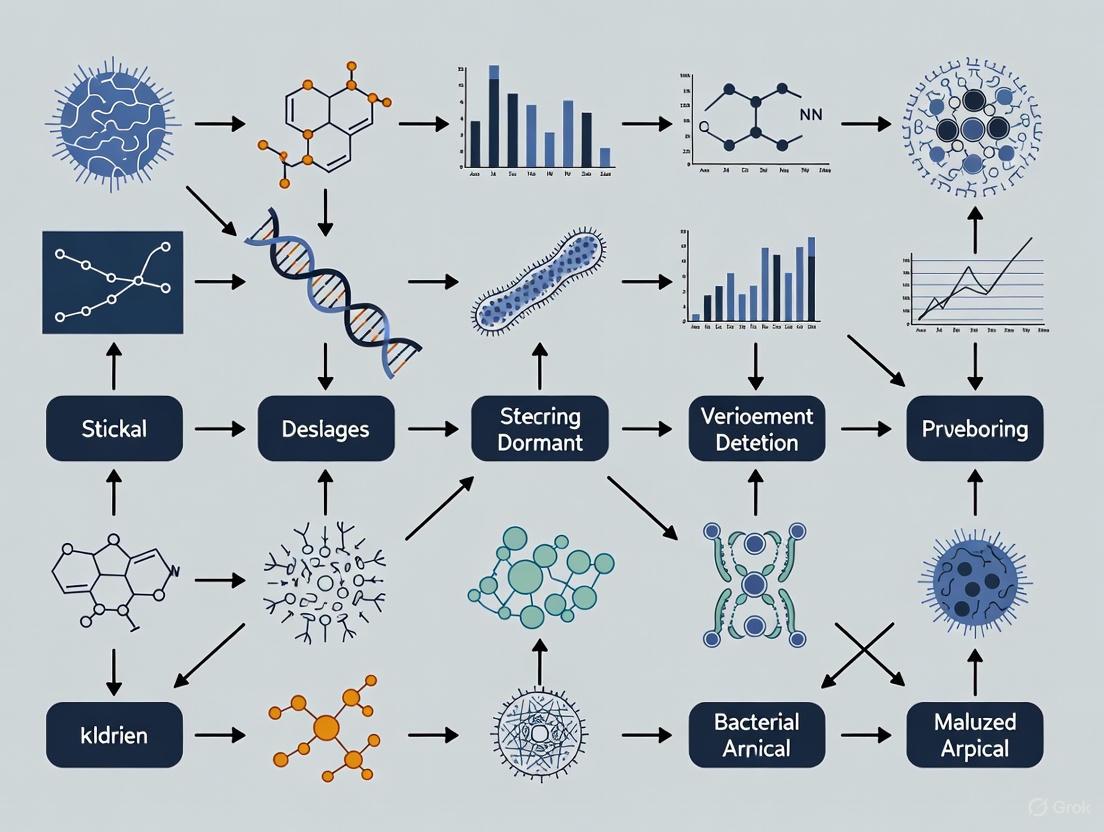
Advanced Strategies for Detecting Dormant Bacterial Populations: From Fundamental Concepts to Cutting-Edge Applications
The detection of dormant bacterial populations, including persisters and viable but non-culturable (VBNC) cells, is a critical challenge in combating chronic infections and antibiotic treatment failure.
Advanced Strategies for Detecting Dormant Bacterial Populations: From Fundamental Concepts to Cutting-Edge Applications
Abstract
The detection of dormant bacterial populations, including persisters and viable but non-culturable (VBNC) cells, is a critical challenge in combating chronic infections and antibiotic treatment failure. This article provides a comprehensive overview for researchers and drug development professionals, covering the foundational biology of bacterial dormancy, state-of-the-art detection methodologies, troubleshooting for common pitfalls, and comparative validation of techniques. We synthesize the latest research to offer a practical guide for accurately identifying these elusive cells, which is paramount for developing more effective antimicrobial therapies and improving clinical outcomes in persistent infections.
Understanding the Dormancy Continuum: Defining Persisters, VBNC, and Spores
In the fight against bacterial infections, the failure of antibiotic therapy is not always due to traditional resistance. The abilities of bacterial populations to survive treatment through non-inherited, transient mechanisms present a significant challenge in both clinical and research settings. Within the broader context of detecting dormant bacterial populations, understanding the crucial distinctions between phenotypic resistance, genotypic resistance, tolerance, and persistence is fundamental for developing effective diagnostic and therapeutic strategies. This guide provides troubleshooting support for researchers characterizing these survival states.
Core Concept Definitions
What is the fundamental difference between genotypic and phenotypic resistance?
Genotypic Resistance: Refers to the inheritable genetic makeup of a bacterium that confers resistance to an antibiotic. This includes acquired genes (e.g., genes for beta-lactamase enzymes like
blaCTX-M-15orblaVIM) or mutations in chromosomal genes (e.g., ingyrAorparCfor fluoroquinolone resistance) [1] [2] [3]. It represents the genetic potential for resistance.Phenotypic Resistance: Describes the observable ability of a bacterial population to survive or multiply despite antibiotic exposure. It is determined through functional laboratory tests, such as measuring the Minimum Inhibitory Concentration (MIC) [1]. It reveals the expressed resistance.
The key distinction is that genotypic testing identifies the genetic machinery for resistance, while phenotypic testing directly measures the functional outcome of that machinery under specific conditions [1]. Not all bacteria with a resistance genotype will always express a resistant phenotype, due to factors like gene regulation, environmental conditions, and the genetic background [1] [3].
How do tolerance and persistence relate to these concepts?
The following table clarifies the relationship and distinctions between resistance, tolerance, and persistence.
Table: Defining Resistance, Tolerance, and Persistence
| Characteristic | Resistance | Tolerance | Persistence |
|---|---|---|---|
| Definition | The ability to grow in the presence of an antibiotic, characterized by an elevated Minimum Inhibitory Concentration (MIC) [4] [5]. | The ability of an entire population to survive transient antibiotic exposure without an increase in MIC, typically by slowing down essential processes [4] [5]. | The ability of a small subpopulation to survive antibiotic exposure due to a dormant, non-growing state. The population's MIC is unchanged [6] [4]. |
| Inheritance | Heritable (genetic) [4]. | Can be pre-programmed or induced by environmental stress (non-heritable) [4]. | Non-heritable, epigenetic trait; progeny are as susceptible as the parent population [4] [7]. |
| Population Dynamics | Uniform - the entire population can grow [4]. | Uniform - the entire population survives longer [4]. | Biphasic killing curve - a small subpopulation survives while the majority is killed [5]. |
| Typical Mechanisms | Drug inactivation, target modification, efflux pumps [4] [2]. | Slow growth, general stress response (RpoS), metabolic shutting [4]. | Stochastic entry into dormancy, toxin-antitoxin (TA) modules, stringent response [6] [4]. |
Troubleshooting Guides & FAQs
FAQ: Why is it critical to differentiate between persistence and genetic resistance in a clinical isolate?
Misidentification can lead to inappropriate therapy. Persisters are genetically susceptible. Relapsed infections caused by persisters may still be treatable with the same antibiotic if combined with strategies to eradicate the dormant cells, whereas genuine resistance requires a switch to a different drug class [6] [7]. Furthermore, distinguishing them is crucial for surveillance and understanding treatment failure epidemiology.
Troubleshooting Guide: Resolving Discrepancies Between Genotypic and Phenotypic Test Results
A common challenge in the lab is when the result of a rapid molecular test (genotype) does not match the subsequent phenotypic susceptibility profile [3]. The following workflow outlines a systematic approach to resolve these discrepancies.
Diagram Title: Resolving Genotype-Phenotype Discordance
Steps for Investigation:
For Scenario 1 (Gene Detected, Phenotype Susceptible):
For Scenario 2 (Gene Not Detected, Phenotype Resistant):
- Check for Off-Target Mechanisms: The resistance may be due to a mechanism not targeted by your molecular panel. For example, carbapenem resistance in Pseudomonas aeruginosa can occur via porin loss (OprD) and efflux pump overexpression, not just carbapenemase genes [2] [3].
- Confirm Organism Identity: As above, ensure the phenotypic result is from a pure culture.
General Steps:
- Re-test Phenotype: Repeat the AST using a different validated method (e.g., broth microdilution if disk diffusion was used first) to rule out technical error [3].
- Perform Further Genetic Characterization: Use whole-genome sequencing to identify novel resistance mutations or genes not covered by the standard panel [3].
FAQ: What are the main types of bacterial persisters?
Persisters are often categorized based on their formation mechanism [6] [8]:
- Type I (Triggered): Form in response to a specific environmental trigger, such as entry into the stationary phase or nutrient starvation. They are pre-existing and non-growing before antibiotic exposure [6] [8].
- Type II (Stochastic): Arise spontaneously at a low frequency throughout the growth phase due to random fluctuations (noise) in gene expression, leading to a slow-growing phenotype [6] [8].
- Type III (Specialized): Arise from active, genetically susceptible cells in response to a specific antibiotic stress. Their persistence mechanism is often tailored to the specific drug [8].
Experimental Protocols for Detecting Dormant Populations
Protocol 1: Isolation and Quantification of Persister Cells
This protocol describes a standard method for quantifying the persister subpopulation in a bacterial culture via a time-kill assay [6] [5].
Principle: Exposing a stationary-phase culture to a high concentration of a bactericidal antibiotic kills the majority of the population. The surviving, non-growing cells that cannot be killed even after prolonged exposure are considered persisters. These cells will regrow on fresh media without antibiotic.
Materials:
- Bacterial strain of interest
- Appropriate liquid growth medium (e.g., LB, TSB)
- Bactericidal antibiotic (e.g., Ciprofloxacin, Amikacin, Meropenem)
- Phosphate Buffered Saline (PBS)
- Sterile culture flasks/tubes
- 37°C Shaking incubator
Procedure:
- Grow culture: Inoculate the bacterium in liquid medium and incubate at 37°C with shaking until it reaches the stationary phase (typically 16-24 hours).
- Harvest cells: Centrifuge the culture and wash the pellet once with PBS to remove metabolic waste.
- Resuspend and treat: Resuspend the cell pellet in fresh medium containing the bactericidal antibiotic at a high concentration (e.g., 10x MIC). Ensure a uniform cell suspension.
- Incubate and sample: Incubate the culture with the antibiotic. Take samples (e.g., 100 µL) at time zero (T0) and at regular intervals thereafter (e.g., 2h, 4h, 6h, 24h).
- Enumerate survivors: Serially dilute the samples in PBS and plate them onto antibiotic-free solid agar plates. Incubate the plates for 24-48 hours and count the colony-forming units (CFU).
- Analyze data: Plot the log~10~ CFU/mL versus time. The initial rapid killing followed by a plateau with a subpopulation of surviving cells indicates the presence of persisters.
Troubleshooting:
- No plateau observed: The antibiotic concentration may be too low, or the antibiotic might have degraded. Verify the antibiotic stock and its stability.
- No cells survive: The initial inoculum might be too low, or the antibiotic exposure time might be too long for the strain. Optimize the inoculum size and sampling time points.
Protocol 2: Detecting Tolerance via Minimum Duration for Killing (MDK)
The Minimum Inhibitory Concentration (MIC) is insufficient to detect tolerance. The MDK assay measures the time required to kill a set proportion of the population (e.g., 99.99%), which is extended in tolerant strains [5].
Materials:
- Materials listed in Protocol 1
- Broth microdilution plates or tubes
Procedure:
- Prepare a standard inoculum of the test strain in broth.
- Expose the inoculum to a fixed, high concentration of antibiotic (e.g., 5-10x MIC) in a time-kill assay as described in Protocol 1.
- Determine the time point at which a 4-log (99.99%) reduction in CFU/mL is achieved compared to the initial inoculum. This is the MDK~99.99~ [5].
Interpretation: A significantly longer MDK~99.99~ in the test strain compared to a non-tolerant control strain indicates a tolerance phenotype.
Key Signaling Pathways in Persister Formation
The formation of persister cells is regulated by a complex interplay of several key bacterial stress response pathways. The following diagram illustrates the core network.
Diagram Title: Core Pathways in Persister Formation
Pathway Details:
- Stringent Response: Triggered by nutrient starvation, leading to accumulation of the alarmone (p)ppGpp. This molecule shuts down ribosome and protein synthesis, redirecting the cell into a dormant, non-growing state [4] [5].
- Toxin-Antitoxin (TA) Modules: Systems where a stable toxin protein can inhibit essential cellular processes (e.g., translation). Under stress, labile antitoxins are degraded, freeing the toxin to induce growth arrest (dormancy) [4] [8].
- Quorum Sensing (QS): A cell-cell communication system. Some QS signals, like those in Pseudomonas aeruginosa, can increase persister formation by inducing oxidative stress and metabolic changes, often in a density-dependent manner [4] [7].
- SOS Response: Activated by DNA damage, which can be caused by antibiotics like fluoroquinolones. This response halts cell division to allow for DNA repair, contributing to a transient non-growing state [4] [5].
The Scientist's Toolkit: Research Reagent Solutions
Table: Essential Reagents for Investigating Dormant Bacterial Populations
| Reagent / Material | Function / Application | Example Use |
|---|---|---|
| Bactericidal Antibiotics | To kill growing cells and select for the non-growing, tolerant persister subpopulation [6] [5]. | Ciprofloxacin for DNA synthesis inhibition; Amikacin for protein synthesis inhibition. |
| (p)ppGpp Analogs | To chemically induce the stringent response and study its direct role in persister formation [4] [5]. | Treating cultures with synthetic (p)ppGpp to mimic starvation. |
| Reactive Oxygen Species (ROS) Detection Kits | To measure intracellular ROS levels, which are implicated in antibiotic-mediated killing and persister metabolism [7]. | Quantifying ROS in persisters after antibiotic treatment. |
| Membrane Potential Sensitive Dyes | To assess the metabolic state of cells, as persisters often have a depleted membrane potential [7]. | Differentiating dormant from active cells using flow cytometry. |
| ClpP Activators (e.g., ADEP4) | To force the degradation of proteins in a growth-independent manner, effectively killing persisters by causing uncontrolled proteolysis [7]. | Eradicating persisters in combination with standard antibiotics. |
| Hydrogen Sulfide (H₂S) Inhibitors / Scavengers | To target the H₂S-mediated defense system that protects bacteria under stress, thereby sensitizing persisters to antibiotics [7]. | Co-treatment with aminoglycosides to enhance killing of S. aureus and E. coli persisters. |
Fundamental Concepts: Defining the Dormancy Spectrum
What are the key definitions and characteristics of bacterial dormancy?
Bacterial dormancy is a reversible state of reduced metabolic activity that enables microorganisms to survive adverse environmental conditions [9]. Within this broad state, several distinct phenotypes exist, primarily differentiated by their depth of metabolic shutdown and capacity for resuscitation.
Persister Cells: These are genetically drug-susceptible, quiescent (non-growing or slow-growing) bacteria that survive antibiotic exposure and other stresses. After stress removal, they can regrow and remain susceptible to the same stress [6]. Persisters typically constitute 0.001% to 1% of a bacterial population and are not genetically resistant mutants but rather phenotypic variants [10] [11]. Their formation can be triggered by various stresses including starvation, oxidative stress, heat shock, acid, or antibiotic treatment itself [11].
Viable But Non-Culturable (VBNC) Cells: These represent an even deeper state of dormancy where bacteria fail to grow on routine bacteriological media but maintain viability and metabolic activity [6] [11]. The transition from persister to VBNC state often correlates with increased protein aggregation and depletion of intracellular ATP [11]. VBNC cells can restore metabolic activity and resuscitate under favorable conditions, though the lag phase before resuscitation is significantly longer than for persisters [11].
Table 1: Characteristics of Dormant Bacterial States
| Characteristic | Shallow Persisters | Deep Persisters | VBNC Cells |
|---|---|---|---|
| Metabolic Activity | Reduced but detectable | Significantly reduced | Minimal, but maintains viability |
| Culturability | Culturable on standard media | Culturable with extended incubation | Non-culturable on standard media |
| Resuscitation Time | Hours to days | Days | Days to weeks |
| Antibiotic Tolerance | High | Very high | Extreme |
| Primary Formation Trigger | Environmental stress, stochastic processes | Prolonged stress, toxin-antitoxin systems | Severe or prolonged stress conditions |
| % in Population | 0.001-1% | Subset of persisters | Variable, often environment-dependent |
Detection and Analysis: Technical Challenges and Solutions
Why do I keep getting false negatives when detecting dormant cells in my biofilm models?
This common issue stems from several technical challenges inherent in dormant cell biology. Standard microbiological methods like culturing on agar plates often fail because slow-growing variants and dormant cells may not form colonies under routine conditions [12]. This is particularly problematic with biofilms, where dormant subpopulations are protected by the extracellular matrix and heterogeneously distributed [12].
Solutions:
- Combine detection methods: Use both molecular and cultural approaches to overcome limitations of individual techniques [12].
- Implement sample processing: For biofilm samples, use sonication or other mechanical disruption to release trapped cells before analysis [12].
- Extend incubation times: When culturing, allow extended incubation periods to accommodate slower resuscitation of deep persisters.
- Include viability markers: Use stains that differentiate between live and dead cells regardless of culturalility.
What are the most reliable methods for quantifying different dormancy states?
Table 2: Detection Methods for Dormant Bacterial Populations
| Method | Target | Strengths | Limitations | Best for |
|---|---|---|---|---|
| Standard Culture | Culturable cells | Simple, inexpensive | Misses VBNC and many persisters | Shallow persisters |
| Flow Cytometry with Viability Stains | Membrane integrity, enzyme activity | Rapid, quantitative | Doesn't confirm culturalility | All dormant states |
| PCR-based Methods | DNA presence | Highly sensitive | Doesn't distinguish viability | Total bacterial load |
| mRNA Analysis | Gene expression | Confirms metabolic activity | Technically challenging, unstable targets | Active vs. dormant discrimination |
| Combined Viability PCR | DNA from viable cells | More specific than standard PCR | May miss deeply dormant cells | VBNC detection |
| Raman Spectroscopy | Biomolecular fingerprints | Non-destructive, single-cell resolution | Specialized equipment required | Metabolic activity assessment |
| Advanced Imaging (CLSM, FISH) | Spatial distribution, specific taxa | Visual confirmation, localization | Complex sample preparation | Biofilm studies |
Experimental Protocol: Comprehensive Dormancy Detection Workflow
Sample Preparation:
- For biofilms: Use sonication (e.g., 5-10 minutes at 40 kHz) to dislodge cells from surfaces and break up aggregates [12].
- For planktonic cultures: Concentrate cells by centrifugation (5,000 × g, 10 minutes).
Viability Staining:
- Prepare working solution of SYTO 9 and propidium iodide (or alternative viability stains).
- Incubate with sample (30 minutes, room temperature, dark).
- Analyze by flow cytometry or fluorescence microscopy.
Culturalility Assessment:
- Plate serial dilutions on appropriate media.
- Incubate at optimal temperature for extended period (up to 2 weeks).
- Count colonies daily to detect slow-growing resuscitating cells.
Molecular Confirmation:
- Extract DNA and RNA from parallel samples.
- Perform 16S rRNA gene PCR to determine total bacterial presence.
- Conduct RT-PCR for metabolic activity markers (e.g., rRNA, housekeeping genes).
Data Interpretation:
- Calculate viability ratio: (viable count by culture)/(total count by flow cytometry).
- Compare metabolic activity signals between active and stressed populations.
Troubleshooting Common Experimental Scenarios
How can I distinguish between true VBNC cells and moribund/dying cells in my assays?
This distinction is critical for accurate interpretation. Moribund cells are in the process of dying and cannot resuscitate, while VBNC cells maintain the capacity to return to active growth [11].
Diagnostic Approach:
- Resuscitation Tests: Add fresh nutrient medium and monitor for return to culturalility over 1-4 weeks. True VBNC cells will eventually resume growth.
- Metabolic Activity Probes: Use multiple viability markers targeting different cellular functions (membrane integrity, enzyme activity, membrane potential).
- Time-course Analysis: Sample at multiple time points. Moribund populations will continue to decline, while VBNC populations stabilize.
- Stress Response Markers: Monitor expression of specific genes associated with dormancy (e.g., toxin-antitoxin systems, ribosomal hibernation factors) [10] [11].
My antibiotic killing curves show inconsistent persister fractions between replicates. What could be causing this variability?
Persister formation often involves stochastic processes, but excessive variability suggests technical issues [10] [11].
Potential Causes and Solutions:
- Inconsistent culture conditions: Maintain strict control over growth phase, temperature, and medium composition.
- Antibiotic degradation: Prepare fresh antibiotic solutions and verify concentrations.
- Inadequate killing curve sampling: Increase sampling frequency during the biphasic killing phase.
- Cell aggregation: Use gentle vortexing or pipetting to ensure single-cell suspensions before plating.
- Insufficient sample size: Persister fractions are small (0.001-1%), so plate larger volumes or concentrate samples.
Molecular Mechanisms and Research Tools
What are the key molecular pathways regulating entry into and exit from dormancy?
Multiple interconnected pathways regulate bacterial dormancy, with different mechanisms dominating in various bacterial species and environmental contexts.
Diagram Title: Molecular Pathways Regulating Bacterial Dormancy
Research Reagent Solutions for Dormancy Studies
Table 3: Essential Research Reagents for Dormancy Studies
| Reagent Category | Specific Examples | Research Application | Key Considerations |
|---|---|---|---|
| Viability Stains | SYTO 9/propidium iodide, CTC, FDA | Differentiate viable/dormant/dead cells | Membrane permeability varies by species |
| Metabolic Probes | Resazurin, PrestoBlue, ATP assays | Measure metabolic activity | May not detect deeply dormant cells |
| Toxin-Antitoxin Modulators | HipA inducers, RelE inhibitors | Manipulate persistence pathways | Species-specific effects |
| (p)ppGpp Analogs | ppGpp, synthetic stringent response inducers | Study stringent response mechanism | Difficult cellular delivery |
| RNA Preservation Solutions | RNAlater, TRIzol | Preserve transcriptional state | Critical for accurate gene expression |
| Matrix Degrading Enzymes | Dispersin B, DNase I, proteinase K | Biofilm disruption for cell recovery | Optimization required for different biofilms |
| Resuscitation Promoters | Pyruvate, catalase, fresh medium components | Recovery of VBNC cells | May require species-specific factors |
Advanced Technical Considerations and Mitigation Strategies
What specific techniques can help me track the transition between shallow persisters, deep persisters, and VBNC states over time?
Longitudinal tracking of dormancy transitions requires integrated approaches:
Time-course Single-cell Analysis:
- Use microfluidics systems to monitor individual cells throughout stress exposure and recovery.
- Combine with time-lapse microscopy and fluorescent reporter constructs for persistence markers.
- Measure resuscitation times at single-cell level to map the dormancy continuum.
Metabolic Depth Profiling:
- Employ multiple, complementary metabolic probes with different sensitivity thresholds.
- Correlate ATP levels, membrane potential, and enzymatic activity with resuscitability.
- Use Raman spectroscopy to obtain biomolecular fingerprints of cells at different dormancy depths [12].
Protocol: Monitoring Dormancy Transitions Over Time
Establish baseline population:
- Grow culture to mid-exponential phase under controlled conditions.
- Sample for baseline viability and metabolic activity measurements.
Apply standardized stress:
- Use precise antibiotic concentrations (e.g., 10× MIC) or nutrient starvation.
- Maintain consistent stress duration across experiments.
Time-point sampling:
- Sample at t=0, 2, 4, 8, 24, 48, and 96 hours post-stress.
- At each time point, split sample for:
- Culturalility assessment (immediate and extended incubation)
- Flow cytometry with multiple viability markers
- RNA preservation for transcriptional analysis
- ATP measurement and metabolic assays
Resuscitation phase monitoring:
- After stress removal, continue sampling for 1-2 weeks.
- Track return to culturalility and normal growth rates.
How can I prevent or reduce persister formation in my experimental systems?
While complete prevention is challenging, these strategies can minimize persister formation:
Environmental Control:
- Maintain optimal growth conditions to reduce stress-induced persistence.
- Avoid nutrient limitations during exponential growth phase.
- Control population density to minimize quorum-sensing mediated persistence.
Chemical Interventions:
- Consider combination approaches with anti-persister compounds [6] [11].
- Target persistence mechanisms with specific inhibitors (e.g., stringent response inhibitors).
- Use membrane-active agents that work independently of metabolic state.
Physical Methods:
- Apply electrochemical disruption to affect dormant cells [13].
- Utilize phage-derived enzymes that degrade cell walls of dormant bacteria [11].
- Implement surface modifications that reduce biofilm formation in continuous systems.
The consistent theme across all dormancy research is the necessity for multiple, complementary approaches. No single method can fully characterize the complex spectrum of bacterial dormancy states, but integrated experimental designs that combine cultural, molecular, and single-cell techniques can provide comprehensive insights into this challenging phenomenon.
Frequently Asked Questions (FAQs)
Q1: What is the fundamental difference between bacterial dormancy, persistence, and tolerance? A1: While these terms are related, they describe distinct physiological states:
- Dormancy refers to a reversible state of extremely low metabolic activity where bacteria do not grow. Cells can remain in this state for extended periods until conditions improve [14].
- Persistence describes a phenomenon where a small, dormant subpopulation of an isogenic bacterial culture survives exposure to high doses of antibiotics. Once the antibiotic is removed, these persisters can regrow. The minimum inhibitory concentration (MIC) for the population does not change [15].
- Tolerance occurs when the entire bacterial population temporarily survives antibiotic treatment by slowing down vital processes. This is often observed in stationary-phase cultures [15].
Q2: How do toxin-antitoxin (TA) systems and the stringent response interact to promote dormancy? A2: These systems are key, interconnected mechanisms that sense stress and halt growth.
- The Stringent Response is the primary reaction to nutrient stress (e.g., amino acid starvation). It is mediated by the alarmones (p)ppGpp, which act as a master regulator to dramatically rewire the cell's transcriptome. This shifts resources from growth-related processes (like ribosome synthesis) to stress survival and amino acid biosynthesis [15] [16] [17].
- Toxin-Antitoxin Systems are protein complexes that are often transcriptionally activated by (p)ppGpp. Under normal conditions, the antitoxin neutralizes the toxin. Under stress, the toxin is activated and contributes to dormancy by disrupting essential processes like protein translation, further arresting growth [18] [15]. They work in concert to induce and maintain a dormant state.
Q3: My relA-deficient strain shows an extremely long lag phase during nutrient downshift. What is the molecular reason for this?
A3: The relA gene codes for a primary synthase of (p)ppGpp. A relA deficiency means your strain cannot mount a proper stringent response. During nutrient downshift, the wild-type strain uses (p)ppGpp to immediately reallocate proteomic resources—for example, shifting synthesis from ribosomes to amino acid biosynthetic enzymes. Your mutant strain cannot do this efficiently, causing a significant delay in adapting its metabolism to the new, poorer nutrient condition. Quantitative proteomics has shown this proteome re-allocation is significantly delayed in relA-deficient strains, leading to a prolonged lag [16].
Q4: Can (p)ppGpp levels be quantitatively linked to specific phenotypic changes? A4: Yes, recent research shows that the (p)ppGpp response is not a simple on/off switch but is graded. The level of (p)ppGpp accumulation is proportional to the severity of the stress. This graded increase imposes a layer-by-layer alteration on the transcriptome [17]:
- Low levels begin to inhibit motility and reduce metabolism.
- Intermediate levels further suppress growth and start to upregulate biofilm-related genes.
- High levels strongly promote a sessile lifestyle, enhance antibiotic tolerance, and form condensed biofilms.
Troubleshooting Guides
Issue 1: Inconsistent Persister Cell Formation in Biofilm Experiments
Potential Cause: Uncontrolled or unmeasured fluctuations in (p)ppGpp levels within your biofilm cultures.
Solution:
- Confirm Stringent Response Activation: Use analytical methods like thin-layer chromatography (TLC) or mass spectrometry to directly measure (p)ppGpp pools in your biofilm samples [15].
- Standardize Stress Induction: If using chemical inducers like Serine Hydroxamate (SHX), establish a dose-response curve. The transcriptional and phenotypic changes are highly dependent on the concentration used [17]. Refer to the table in the "Quantitative Data" section for guidance.
- Use a Reliable Protocol: To induce a stringent response via amino acid starvation, you can use the following:
- Grow the bacterial culture to mid-exponential phase in a defined rich medium.
- Rapidly filter the culture and transfer it to a pre-warmed minimal medium lacking a specific amino acid.
- Alternatively, for a more controlled induction in E. coli, induce expression of a constitutively active RelA (RelA*) protein from an inducible plasmid system (e.g., pALS13 with IPTG induction) [16].
Issue 2: Difficulty in Detecting Dormant Cells in Environmental or Clinical Samples
Potential Cause: Dormant cells have low metabolic activity and may "play dead," evading standard culture-based detection methods [14].
Solution:
- Employ Resuscitation-Promoting Factors (Rpf): For Actinobacteria, add recombinant Rpf proteins to your culture media. This protein can stimulate the resuscitation of dormant cells, making them detectable by plate counts [14].
- Utilize Advanced Genomic Tools: Apply new computational models like SeedbankTree to analyze genome sequences from a population. This software can estimate the percentage of dormant members, their average dormancy period, and mutation rates, even from historical outbreak data [19].
- Focus on Genetic Memory: Research shows that dormant bacterial spores preserve a core RNA polymerase bound to key promoter regions, which allows for rapid gene activation upon revival. Detecting markers of this "standby mode" could be a future detection strategy [20].
The following tables consolidate key quantitative findings from recent literature to aid in experimental design and data interpretation.
Table 1: Graded Transcriptional and Phenotypic Response to Increasing (p)ppGpp in Pseudomonas aeruginosa PA14
| Stress Level (SHX Concentration) | (p)ppGpp Increase (Fold) | Differentially Expressed Genes | Key Phenotypic Outcomes |
|---|---|---|---|
| Mild (100 µM) | 1.33-fold | 227 (~4% of genome) | Reduced growth & metabolism; suppressed motility and pyocyanin production. |
| Intermediate (500 µM) | 1.39-fold | 1197 (~20% of genome) | Further growth inhibition; upregulation of biofilm-related genes. |
| Acute (1000 µM) | 1.48-fold | 1508 (~25% of genome) | Formation of condensed biofilms; induction of antimicrobial tolerance. |
Source: [17]
Table 2: Impact of relA Deficiency on Growth Adaptation Lag Time
| Bacterial Strain | Condition | Lag Time (Wild Type) | Lag Time (relA-deficient) |
|---|---|---|---|
| E. coli K-12 | AA Downshift | ~50 minutes | ~6 hours |
| Vibrio natriegens | AA Downshift | Short lag | Substantially prolonged |
Source: [16]
Table 3: Key Reagent Solutions for Dormancy Research
| Reagent / Tool | Function / Mechanism | Example Application |
|---|---|---|
| Serine Hydroxamate (SHX) | Serine analogue that inhibits seryl-tRNA synthetase, inducing RelA-dependent (p)ppGpp accumulation. | Inducing a graded stringent response in P. aeruginosa and other bacteria [17]. |
| Amino Acid Auxotrophs | Allows for precise and rapid induction of amino acid starvation by removal of the essential amino acid from the medium. | Studying the canonical RelA-mediated stringent response triggered by uncharged tRNA [21]. |
| Constitutively Active RelA (RelA*) | A variant of RelA that synthesizes (p)ppGpp without the need for starvation signals. | Overexpressing from a plasmid to directly manipulate intracellular (p)ppGpp levels and study downstream effects [16]. |
| Resuscitation-Promoting Factor (Rpf) | A bacterial cytokine protein that stimulates the germination and growth of dormant Actinobacteria. | "Waking up" dormant cells in samples from extreme environments or clinical settings to enable detection [14]. |
| Relacin | A (p)ppGpp analog that inhibits (p)ppGpp synthetases. | Targeting and disrupting the stringent response in Gram-positive bacteria to reduce persistence and biofilm formation [22]. |
Pathway and Workflow Visualizations
Diagram 1: Stringent Response and TA System Activation Pathway
Diagram 2: Experimental Workflow for Inducing and Analyzing Dormancy
Troubleshooting Guides & FAQs
Frequently Asked Questions
FAQ 1: Why does my antibiotic treatment fail in vitro even when my bacterial strain tests as susceptible? This is a classic sign of recalcitrance, which encompasses bacterial tolerance and persistence. Unlike resistance, which raises the Minimum Inhibitory Concentration (MIC), recalcitrance allows a bacterial population to survive antibiotic exposure by entering a transient, dormant state without a change in MIC. The surviving, dormant subpopulation can then resume growth once the antibiotic pressure is removed, leading to recurrent infections [23]. Within biofilms, this is often due to the presence of persister cells—a metabolically dormant subpopulation—and the physical barrier of the Extracellular Polymeric Substance (EPS) matrix, which restricts antibiotic penetration [24] [25].
FAQ 2: What are the key physiological differences between resistant and tolerant/persistent bacterial cells? The table below outlines the core distinctions [23].
| Feature | Resistance | Tolerance | Persistence |
|---|---|---|---|
| Definition | Ability to proliferate under antibiotic treatment | Ability of a population to survive longer | Ability of a subpopulation to survive longer |
| Effect on MIC | Increased | Unchanged | Unchanged |
| Effect on MDK99 | Variable | Increased | Increased |
| Killing Curve | Shifted | Monophasic, slowed | Biphasic |
| Genetic Basis | Stable genetic mutations | Homogeneous phenotypic change | Heterogeneous phenotypic change |
FAQ 3: How does the biofilm matrix contribute to the protection of dormant cells? The biofilm matrix, or EPS, acts as a multi-functional shield [24] [26]:
- Physical Barrier: The matrix can hinder the diffusion of antibiotics into the biofilm, preventing a lethal concentration from reaching all cells [24].
- Chemical Deactivation: Some antibiotics can bind to or be degraded by matrix components like extracellular DNA (eDNA) or enzymes [24].
- Creation of Gradients: The matrix contributes to nutrient and oxygen gradients within the biofilm, driving subpopulations of cells into a slow-growing or dormant state that is inherently more tolerant to antibiotics [26] [25].
FAQ 4: What molecular mechanisms trigger dormancy in a subpopulation of biofilm cells? Dormancy is primarily regulated by the following mechanisms, which are often interconnected [23] [25]:
- (p)ppGpp and Stringent Response: This universal bacterial stress response to nutrient starvation shuts down energy-intensive processes like replication and translation, promoting a dormant state [23].
- Toxin-Antitoxin (TA) Modules: Under stress, labile antitoxins are degraded, allowing stable toxins to disrupt essential metabolic processes (e.g., translation, DNA replication), inducing dormancy [23].
- Aggresome Formation: A drop in cellular ATP can lead to the aggregation of proteins involved in central processes, effectively halting metabolism and inducing deep dormancy [23].
The diagram below illustrates the relationship between these key mechanisms and the formation of dormant persister cells within a biofilm.
Troubleshooting Common Experimental Challenges
Problem 1: Inconsistent Persister Cell Counts in Killing Assays
- Potential Cause: The depth of bacterial dormancy is not uniform. Cells can enter different states of metabolic arrest, which affects the time they need to "resuscitate" and form colonies on plates, leading to variable counts [23].
- Solution:
- Standardize Pre-treatment: Ensure consistent growth conditions (medium, temperature, shaking speed) to minimize phenotypic heterogeneity before antibiotic exposure.
- Extend Recovery Time: When plating for survivors, include a recovery step with fresh media or a longer incubation period to allow deeply dormant cells to resuscitate.
- Use Metabolic Probes: Employ fluorescent dyes that indicate metabolic activity (e.g., CTC for respiration, CFDA-AM for esterase activity) in conjunction with plating to distinguish between viable but non-culturable (VBNC) states and persisters.
Problem 2: Difficulty in Disrupting Biofilms for Cell Analysis
- Potential Cause: The composition and strength of the EPS matrix vary significantly between species and growth conditions. A one-size-fits-all disruption method does not exist [24] [26].
- Solution:
- Enzymatic Cocktails: Use a combination of matrix-degrading enzymes. The table below lists common reagents. Always validate the enzyme's activity against your specific biofilm.
Problem 3: Failure of "Wake and Kill" Strategies with Metabolite Adjuvants
- Potential Cause: The chosen metabolite may not effectively rewire the central metabolism of the specific dormant pathogen you are studying, or the local concentration is insufficient to reactivate a large enough subpopulation [25].
- Solution:
- Metabolite Selection: Base your choice on the target pathogen's metabolism. For example, mannitol and pyruvate have been shown to re-sensitize P. aeruginosa and E. coli persisters to aminoglycosides by restoring the proton motive force (PMF) [25].
- Check Timing and Concentration: The metabolite must be administered before or concurrently with the antibiotic to prime the cells. Perform a dose-response curve for the metabolite adjuvant.
- Confirm Metabolic Reactivation: Use a reporter system (e.g., ATP levels, PMF-sensitive dyes) to verify that the metabolite is indeed increasing the metabolic activity of the persister cells before adding the antibiotic.
Experimental Protocols for Detecting & Targeting Dormant Populations
Protocol 1: Quantifying Biofilm-Associated Persister Cells
Method: This protocol details the steps for isolating and enumerating the persister cell subpopulation within a mature biofilm after antibiotic challenge.
Detailed Workflow:
- Biofilm Growth: Grow a mature biofilm in a suitable model system (e.g., Calgary biofilm device, flow cell, or 96-well plate) for 48-72 hours [24].
- Washing: Gently wash the biofilm three times with phosphate-buffered saline (PBS) to remove non-adherent planktonic cells.
- Antibiotic Challenge: Expose the biofilm to a high concentration of a bactericidal antibiotic (e.g., 5-10x the MIC of ciprofloxacin for gram-negatives or vancomycin for gram-positives) for 24 hours [23].
- Biofilm Disruption: After antibiotic removal and washing, disrupt the biofilm using an optimized method from the troubleshooting guide above (e.g., sonication in combination with DNase I and Proteinase K).
- Viable Count: Perform serial dilutions of the disrupted biofilm suspension and plate on rich, non-selective agar. Colonies that form after 48-72 hours of incubation are derived from persister cells that survived the antibiotic challenge [23].
Protocol 2: Evaluating "Wake and Kill" Efficacy with Metabolite Adjuvants
Method: This protocol assesses the ability of specific metabolites to re-sensitize dormant cells in a biofilm to antibiotic killing.
Detailed Workflow:
- Prepare Biofilms: Grow and wash biofilms as in Protocol 1, steps 1-2.
- Metabolite Priming: Instead of immediate antibiotic addition, first treat the biofilm with a solution of the metabolite adjuvant (e.g., 10-50 mM mannitol or pyruvate in buffer) for 2-4 hours [25]. Include a control group that receives buffer only.
- Antibiotic Killing: Without removing the metabolite solution, add the bactericidal antibiotic to the wells. Incubate for a further 18-24 hours.
- Quantify Survival: Proceed with biofilm disruption and plating as in Protocol 1, steps 4-5.
- Data Analysis: Compare the persister titer (CFU/mL) in the metabolite-primed group to the buffer-only control. A statistically significant reduction in the primed group indicates successful "waking" and killing.
The diagram below summarizes the core concept of this therapeutic strategy.
The Scientist's Toolkit: Research Reagent Solutions
This table consolidates key reagents for studying and targeting biofilm-associated dormant populations.
| Research Reagent | Category | Primary Function & Application |
|---|---|---|
| DNase I | Enzyme | Degrades eDNA in biofilm matrix; used for biofilm disruption and to study matrix contribution to tolerance [24] [26]. |
| Dispersin B | Enzyme | Hydrolyzes PNAG polysaccharide; effective for disrupting biofilms of staphylococci and other PNAG-producing species [24]. |
| Mannitol | Metabolite | Re-activates PMF in dormant cells; used as an adjuvant to re-sensitize persisters to aminoglycoside antibiotics [25]. |
| Sodium Pyruvate | Metabolite | Functions as an energy substrate; re-energizes persister cells, enhancing their susceptibility to various antibiotics [25]. |
| N-Acetylcysteine (NAC) | Mucolytic / Antioxidant | Can disrupt disulfide bonds in matrix components and reduce oxidative stress; used in biofilm dispersal experiments [26]. |
| CCCp | Chemical Agent | A proton ionophore that dissipates PMF; used as a control to confirm PMF-dependent antibiotic uptake [25]. |
| AlamarBlue/Resazurin | Cell Viability Dye | Fluorescent indicator of metabolic activity; used to measure the metabolic state of cells within biofilms without plating [23]. |
| SYTOX Green/Blue | Nucleic Acid Stain | Impermeant dye that stains eDNA and dead cells; used to visualize the EPS matrix and quantify cell death in biofilms via microscopy [24] [27]. |
Frequently Asked Questions (FAQs)
FAQ 1: What is the difference between antibiotic resistance, tolerance, and persistence? Understanding these distinctions is crucial for diagnosing infection types and developing effective treatments. The key differences are summarized in the table below.
Table 1: Key Characteristics of Bacterial Survival Strategies
| Feature | Resistance | Tolerance | Persistence |
|---|---|---|---|
| Minimum Inhibitory Concentration (MIC) | Increased | Unchanged | Unchanged |
| Killing Kinetics | Not applicable | Homogeneous survival of the entire population | Biphasic killing curve; only a subpopulation survives |
| Defining Feature | Ability to grow in the presence of an antibiotic | Reduced killing rate of the entire population | Presence of a dormant subpopulation that survives treatment |
| Genetic Basis | Heritable genetic mutations | Can be influenced by genetic mutations and environmental cues | Non-heritable, phenotypic heterogeneity within a genetically identical population |
| Mechanism | Drug inactivation, target modification, efflux pumps | Slowed metabolism, dormancy | Stochastic entry into a dormant, non-growing state |
FAQ 2: Why are dormant cells like persisters so critical in clinical settings? Dormant persister cells are a major cause of treatment failure and are associated with a wide range of chronic and recurrent infections. Because they are metabolically dormant, they are tolerant to antibiotics that typically target active cellular processes. After antibiotic treatment is stopped, these persister cells can resume growth, leading to relapsing infections. This phenomenon is a significant problem in infections such as tuberculosis, recurrent urinary tract infections, and biofilm-associated infections on medical devices [6] [23].
FAQ 3: What are the primary molecular mechanisms that lead to bacterial dormancy? Several interconnected biological processes can induce a dormant state:
- Toxin-Antitoxin (TA) Systems: These genetic modules are widespread in bacteria. Under stress, the antitoxin is degraded, allowing the toxin protein to act on targets such as protein translation or DNA replication, inducing growth arrest [6] [23] [28].
- The Stringent Response: Triggered by nutrient starvation, this response involves the rapid production of the alarmone (p)ppGpp. This molecule drastically reprograms cellular metabolism, shutting down energy-intensive processes like replication and translation to promote survival [23] [28].
- SOS Response: DNA damage, which can be caused by some antibiotics, activates the SOS response. This leads to cell cycle arrest and DNA repair, which can coincide with a dormant, persistent state [23].
The following diagram illustrates the relationship between these key mechanisms and their role in forming dormant persister cells.
FAQ 4: My flow cytometry data for bacterial cell cycle shows poor resolution between phases. What could be wrong? Poor resolution of G0/G1, S, and G2/M phases in DNA content histograms is a common issue. Here are the main causes and solutions:
Table 2: Troubleshooting Flow Cytometry for Cell Cycle Analysis
| Problem | Possible Cause | Recommendation |
|---|---|---|
| Unresolved Cell Cycle Phases | High flow rate during sample acquisition. | Use the lowest possible flow rate setting on your cytometer to reduce CV and improve resolution [29]. |
| Unresolved Cell Cycle Phases | Insufficient staining with DNA dye. | Ensure the cell pellet is resuspended directly in an adequate Propidium Iodide (PI)/RNase solution and incubated for sufficient time [29]. |
| Unresolved Cell Cycle Phases | Cells are not proliferating. | Harvest cells during asynchronous, exponential growth to ensure all cell cycle phases are represented [29]. |
| High Background/Noise | Presence of cell clumps or debris. | For mycobacteria, implement a needle emulsification step to disrupt clumps, as vortexing or sonication may be insufficient [30]. |
| High Background/Noise | Incorrect instrument settings or thresholds. | Set thresholds on a fluorescence channel (e.g., SYBR-gold) instead of light scatter to significantly reduce background noise and improve counting accuracy [30]. |
Key Experimental Protocols
Protocol 1: Detection and Quantification of Bacterial Persisters using Flow Cytometry
This protocol is adapted from a study on absolute counting and phenotyping of mycobacteria, a classic model for dormancy, but the principles are widely applicable [30].
Principle: This method uses a combination of fluorescent dyes to distinguish subpopulations within a bacterial culture based on membrane integrity and metabolic activity, allowing for the identification and absolute counting of dormant persister cells.
Reagents and Materials:
- Bacterial culture in liquid medium
- SYBR-Gold (SG) nucleic acid stain
- Calcein-AM (CA) esterase substrate dye
- Phosphate-Buffered Saline (PBS) with 0.1-0.25% Tween-80
- Flow cytometer (e.g., BD Accuri C6)
- Heat block or water bath
- Syringe and needle (e.g., 26G) for emulsification
Procedure:
- Sample Preparation: Harvest bacterial cells from culture. To disrupt inherent clumping—a major source of counting error—perform needle emulsification by passing the culture through a narrow-gauge syringe (e.g., 26G) 10-15 times [30].
- Staining for Total Intact Cells (Denominator):
- Split the sample. Heat-kill one aliquot (e.g., 80°C for 20 minutes).
- Stain the heat-killed aliquot with SYBR-Gold (e.g., 1X final concentration) and incubate in the dark for 15-30 minutes.
- This SG-positive population represents the total count of cells with intact membranes.
- Staining for Metabolic Activity (Vitality):
- Take a separate, non-heat-killed aliquot and stain it with Calcein-AM (e.g., 0.1-1 µM final concentration).
- Incubate in the dark for 30-60 minutes.
- CA is hydrolyzed by active intracellular esterases, marking metabolically active cells.
- Staining for Membrane Integrity (Damage):
- Take another non-heat-killed aliquot and stain it with SYBR-Gold without heat killing.
- SG will penetrate cells with compromised membranes, marking dead or damaged cells.
- Flow Cytometry Acquisition:
- Run all samples on the flow cytometer. Set the acquisition threshold on a combination of Side Scatter (SSC) and a fluorescence channel (e.g., FL1 for SG) to effectively gate out electronic noise and debris [30].
- Record a known volume of sample to enable absolute counting.
- Data Analysis:
- The dormant persister population is typically characterized as Calcein-AM negative / SYBR-Gold positive (in the non-heat-killed sample). These cells have intact membranes but low metabolic activity.
- Compare counts to Colony Forming Units (CFU) to observe the discrepancy between culturable and total viable cells.
This protocol outlines a method to confirm the dormant, non-resistant nature of bacterial survivors after antibiotic exposure [31].
Principle: After a lethal antibiotic challenge, surviving cells are washed to remove the drug and placed in fresh, nutrient-rich media. The regrowth of these cells confirms they were dormant persisters rather than resistant mutants.
Reagents and Materials:
- Overnight bacterial culture
- Appropriate antibiotic at bactericidal concentration
- Fresh culture medium
- Centrifuge and tubes
Procedure:
- Antibiotic Challenge: Inoculate fresh medium with bacteria and add antibiotic at a predetermined bactericidal concentration (e.g., 10x MIC). Incubate for a set time (e.g., 3-6 hours).
- Drug Removal: Centrifuge the antibiotic-treated culture. Discard the supernatant containing the antibiotic.
- Washing: Resuspend the pellet in fresh, pre-warmed medium. Repeat the centrifugation and washing step once more to ensure complete antibiotic removal.
- Resuscitation: Resuspend the final pellet in fresh medium and incubate under optimal growth conditions. Monitor bacterial growth via optical density (OD) or CFU plating over 24-48 hours.
- Confirmation: The resumption of growth after antibiotic removal indicates the survivors were dormant persisters. To confirm they are not resistant, the MIC of the resuscitated culture can be checked and should be identical to the original, drug-naive strain.
The Scientist's Toolkit: Essential Research Reagents
This table lists key reagents used in the study of dormant cells, along with their specific functions in experiments.
Table 3: Key Research Reagents for Dormancy Studies
| Reagent | Function/Biological Role | Application in Experiments |
|---|---|---|
| SYBR-Gold | High-sensitivity nucleic acid stain that penetrates cells with compromised membranes [30]. | Used in flow cytometry to label total intact cells (after heat killing) or dead/damaged cells (without heat killing) [30]. |
| Calcein-AM | Cell-permeant esterase substrate; becomes fluorescent upon cleavage by intracellular enzymes [30]. | A marker of metabolic "vitality" in flow cytometry. Metabolically dormant persisters are often Calcein-AM negative [30]. |
| Propidium Iodide (PI) | DNA stain that is excluded by intact cell membranes. | A common viability dye to label dead cells in a population and gate them out during analysis [29]. |
| (p)ppGpp | An alarmone molecule known as guanosine tetra/pentaphosphate [23] [28]. | Central mediator of the stringent response. Studying its synthesis and degradation is key to understanding starvation-induced dormancy [23] [28]. |
| HipA Toxin | A protein kinase toxin in the HipAB toxin-antitoxin system [6] [28]. | Overexpression of HipA is used to artificially induce persistence. Studying HipA mutants helps elucidate TA system regulation [6] [28]. |
Advanced Detection Workflow
The following diagram outlines a comprehensive experimental workflow for detecting and characterizing dormant bacterial cells, integrating the protocols and reagents described above.
A Practical Toolkit: From Culture-Based to Single-Cell Detection Technologies
Frequently Asked Questions (FAQs)
FAQ 1: What is the fundamental difference between antibiotic resistance, tolerance, and persistence? These are distinct survival strategies. Resistance is the ability of bacteria to grow in the presence of an antibiotic, characterized by an elevated Minimum Inhibitory Concentration (MIC). Resistance is genetically inherited and affects the entire population [23] [32]. In contrast, tolerance is the ability of a bacterial population to survive extended antibiotic exposure without an increase in MIC. It is characterized by an increase in the Minimum Duration for killing 99% of the population (MDK99) and results from a homogeneous slowing of bacterial metabolism [33] [23] [32]. Persistence is a special case of tolerance where only a subpopulation of cells survives treatment, resulting in a biphasic killing curve. The surviving persister cells are genetically identical to the susceptible population but exhibit a transient, non-growing state [23] [32] [6].
FAQ 2: Why is the MDK99 metric considered a "gold standard" for quantifying tolerance and persistence? The Minimum Inhibitory Concentration (MIC) measures resistance but fails to capture survival over time. The Minimum Duration for killing 99% of the population (MDK99) was introduced specifically to quantify how long bacteria can survive lethal antibiotic concentrations [33] [34]. It provides a direct, quantitative timescale parameter for tolerance. A higher MDK99 indicates a more tolerant population. For persistent subpopulations, the MDK99 of the second, slower phase of killing quantifies the persistence level [33] [32]. This metric is crucial for estimating sufficient treatment lengths to eradicate all bacteria, including persisters [35].
FAQ 3: What are the most common experimental pitfalls that lead to misinterpretation of biphasic killing curves?
- Inconsistent Inoculum Preparation: The physiological state of the bacteria (e.g., exponential vs. stationary phase) profoundly influences the fraction of persisters [36] [32]. Using non-standardized growth conditions leads to irreproducible results.
- Insufficient Time Points: Failing to collect enough data points, especially during the transition between killing phases, can obscure the true shape of the curve and lead to misidentification of a biphasic pattern [33].
- Inadequate Antibiotic Concentration: The antibiotic concentration must be significantly above the MIC (e.g., 10-20x MIC) to ensure rapid killing of the susceptible population. Using concentrations too close to the MIC can mask the biphasic response [33] [37].
- Overlooking Regrowth: Survivors at later time points may be resistant mutants rather than persisters. It is critical to re-test the susceptibility of the survivors to confirm they are not resistant [32].
FAQ 4: Beyond tolerance and persistence, what other factors can cause a biphasic killing pattern? The primary alternative explanation is heteroresistance, where a small subpopulation has a genetically encoded, higher resistance level (MIC) [32]. This can also produce a biphasic curve. Distinguishing heteroresistance from persistence requires sub-culturing the survivors: the progeny of persisters will have the same MIC as the original population, while the progeny of resistant mutants will maintain a higher MIC [32]. Furthermore, pre-existing or de novo-generated resistant mutants in a large inoculum can regrow on antibiotic-containing plates, which may be mistaken for survival in a time-kill curve experiment [37].
Troubleshooting Guides
Issue 1: No Biphasic Curve Observed in a Known Persister Model
| Possible Cause | Investigation Method | Recommended Solution |
|---|---|---|
| Insufficient antibiotic concentration | Check that concentration is >10x MIC. Verify MIC value is current. | Increase antibiotic concentration to at least 10-20x MIC to ensure rapid killing of susceptible cells [33]. |
| Inoculum too small | Plate diluted samples to accurately determine the starting CFU/mL. | Increase the initial inoculum size to at least 10^7 - 10^8 CFU/mL to ensure the small persister subpopulation is detectable [36]. |
| Incorrect bacterial growth phase | Use OD600 and growth curve data to confirm culture is in early stationary phase for "triggered" persistence [32]. | Standardize the culture age and growth conditions (e.g., always use cultures grown for a specific duration into stationary phase) [36]. |
| Data points are too infrequent | Review the time intervals between sample collections. | Increase sampling frequency, especially during the first 2-8 hours of antibiotic exposure, to capture the transition between killing phases [33]. |
Issue 2: High Variability in MDK99 Measurements Between Replicates
| Possible Cause | Investigation Method | Recommended Solution |
|---|---|---|
| Inconsistent culture conditions | Document media batch, temperature, and shaking speed. | Use pre-aliquoted media from a single batch and strictly control incubation conditions across all experiments [33]. |
| Inaccurate determination of the 1% survival point | Use a statistical approach to calculate MDK from multiple replicate wells [33]. | Implement an automated, high-throughput MDK assay that uses presence/absence of growth in many replicate wells to statistically determine the MDK99 value, rather than relying on CFU counts from a single culture [33]. |
| Carryover of antibiotic during viability plating | Include a control plate with an antibiotic-neutralizing agent. | Perform serial washing steps or add neutralizing agents (e.g., β-lactamase for ampicillin) to the plating medium to prevent antibiotic carryover that inhibits the growth of survivors [33]. |
Issue 3: Distinguishing Between Tolerance and Resistance in Clinical Isolates
Step 1: Determine the MIC. Perform a standard broth microdilution MIC assay according to CLSI/EUCAST guidelines. A significantly elevated MIC indicates resistance [32].
Step 2: Perform a Time-Kill Assay. Expose the isolate to a high concentration of the antibiotic (e.g., 10x MIC) and perform CFU counts over 24-48 hours.
Step 3: Analyze the Data.
- If the killing curve shows rapid initial killing followed by a plateau, calculate the MDK99. An elevated MDK99 with a normal MIC indicates tolerance [33] [32].
- If the curve shows monophasic but slow killing across the entire population, this indicates homogeneous tolerance.
- If the curve is biphasic, this indicates persistence (heterogeneous tolerance).
Step 4: Confirm by Re-challenging Survivors. Isolate colonies from the surviving population after 24 hours of antibiotic exposure. Determine the MIC of these survivors. If the MIC is unchanged from the original population, the survivors are persisters. If the MIC is elevated, the isolate exhibits heteroresistance [32].
The Scientist's Toolkit: Research Reagent Solutions
| Item | Function in Experiment | Key Considerations |
|---|---|---|
| MDK99 Automated Setup [33] | Robots for high-throughput inoculation and incubation of bacteria with antibiotics for varied durations. | Enables statistical determination of MDK99 from many replicates, improving accuracy over manual time-kill curves. |
| LIVE/DEAD BacLight Bacterial Viability Kit [36] | Staining with SYTO 9 and propidium iodide (PI) to differentiate membrane-compromised cells via fluorescence microscopy or flow cytometry. | PI-stained cells may still be cultivable; staining indicates membrane compromise, not necessarily death [36]. |
| BacTiter-Glo Microbial Cell Viability Assay [36] | Measures cellular ATP production as a correlate of metabolic activity. | Useful for confirming a dormant, low-metabolism state in persister cells, which correlates with tolerance. |
| Concentration-Killing Curve (CKC) Method [37] | Agar plate method to fit a sigmoidal curve of surviving colonies vs. antibiotic concentration, deriving BC50 (median bactericidal concentration). | An alternative to MDK99 for quantifying bactericidal potency; useful for estimating the actual MBC more accurately [37]. |
| 1-N-phenylnaphthylamine (NPN) Assay [36] | A fluorescent dye used to measure outer membrane permeability. | Increased uptake of NPN indicates enhanced outer membrane permeability, which can be linked to changes in antibiotic susceptibility. |
Core Quantitative Data for Bactericidal Phenomena
Table 1: Key Definitions and Metrics for Bacterial Survival Strategies.
| Parameter | Resistance | Tolerance | Persistence |
|---|---|---|---|
| Defining Feature | Ability to grow in drug presence | Prolonged survival of the entire population | Survival of a subpopulation |
| Primary Metric | MIC (Minimum Inhibitory Concentration) | MDK99 (Minimum Duration for killing 99%) | Biphasic Kill Curve & MDK99 of subpopulation |
| MIC of Population | Increased | Unchanged | Unchanged |
| Killing Curve Shape | Not applicable (growth occurs) | Monophasic, but slower | Biphasic (rapid kill then plateau/slow kill) |
| Mechanism | Genetic mutations (e.g., drug target modification) | Slow growth or dormancy (e.g., stringent response) | Stochastic entry into dormancy in a subpopulation (e.g., TA systems) |
Table 2: Comparison of Methods for Quantifying Bacterial Survival.
| Method | What It Measures | Key Outputs | Advantages | Limitations |
|---|---|---|---|---|
| Time-Kill Curve [33] [32] | Reduction in viable cells (CFU/mL) over time at a fixed antibiotic concentration. | Killing rate, MDK99, curve shape (mono/biphasic). | Directly measures bactericidal activity; reveals population heterogeneity. | Labor-intensive; low throughput; CFU counting is imprecise at low counts. |
| MDK99 Assay [33] | The minimum time required to kill 99% of the population across a range of concentrations. | A single time-value (MDK99) quantifying tolerance. | High-throughput, automated, and statistical; provides a clear tolerance metric. | Requires specialized robotic equipment; does not provide a continuous killing curve. |
| Concentration-Killing Curve (CKC) [37] | Number of surviving colonies after 24h on agar plates with a concentration gradient of antibiotic. | BC50 (median bactericidal concentration), r (bactericidal intensity). | Avoids problems of traditional MBC; provides a sigmoidal curve for accurate potency estimation. | Agar-based; may not reflect in-liquid kinetics; less common than time-kill assays. |
Experimental Protocol: Automated MDK99 Determination
This protocol is adapted from the high-throughput, robotic method described by [33].
Objective: To accurately determine the Minimum Duration for killing 99% of a bacterial population (MDK99) for an antibiotic.
Materials:
- Bacterial strain of interest.
- Antibiotic stock solutions.
- 96-well microplates (U-shaped wells recommended for washing).
- Robotic liquid handling and plate handling system (e.g., Tecan Freedom EVO).
- Programmable incubator with shaking.
Procedure:
- Preparation of Antibiotic Plate: A 96-well plate is filled with antibiotics in exponentially decreasing concentrations, with the final column left antibiotic-free as a growth control. Concentrations should typically reach at least 20x the known MIC [33].
- Bacterial Inoculum Preparation: Bacteria are diluted to a concentration corresponding to the MDK being measured. For an MDK99, 100 bacteria are required per well. The mean number of bacteria in the inocula (N) must be evaluated by serial dilution and plating [33].
- Inoculation-Incubation Cycle: The antibiotic plate is inoculated one row at a time at set time intervals (e.g., every 30 minutes over 24 hours). After each inoculation, the plate is returned to the incubator with shaking [33].
- Antibiotic Wash: Once all inoculations are complete, the antibiotic must be removed to allow for regrowth of survivors. This can be achieved by two spin-down cycles (e.g., 10 min at 1200 g), discarding the supernatant each time. Alternatively, for drugs like ampicillin, an inactivating enzyme (e.g., β-lactamase) can be added to all wells [33].
- Outcome Measurement: The plates are supplemented with fresh growth medium and incubated to allow any surviving bacteria to regrow. The presence or absence of growth in each well is then determined by optical density or visual inspection [33].
- Data Analysis: The MDK99 is determined statistically by analyzing the pattern of growth/no growth across the replicate wells at different time points. It is defined as the shortest treatment duration after which 99% of the replicate wells show no bacterial regrowth [33].
Workflow and Conceptual Diagrams
Diagram 1: Experimental workflow for time-kill assays and MDK99 analysis.
Diagram 2: Logical relationships between resistance, tolerance, and persistence.
Viability staining is an essential component of any flow cytometry experiment, particularly in the context of research aimed at detecting dormant bacterial populations. Dead cells can compromise data integrity by non-specifically binding antibodies and exhibiting higher autofluorescence, leading to inaccurate results, especially when observing low-expression antigens or performing cell sorting [38] [39]. The exclusion of dead cells is therefore critical for generating reliable data, as they can cause misidentification during analysis and release cell debris that clumps together, causing further inaccuracies and additional cell death [40].
The fundamental principle behind most viability staining methods relies on membrane integrity. Living cells maintain intact plasma membranes that exclude certain dyes, while dead cells with compromised membranes allow these dyes to enter and bind to intracellular components, typically nucleic acids [39]. For research on bacterial dormancy, accurately distinguishing between live, dead, and dormant states presents particular challenges, as dormant cells may exhibit membrane properties different from both actively growing and dead cells. The development of safer, more reliable staining protocols that minimize risks to both researchers and equipment while providing accurate viability assessment remains a priority in the field [41].
Core Concepts: Mechanisms of Viability Dyes
DNA Binding Dyes
DNA binding dyes function by penetrating cells with compromised membranes and fluorescing upon binding to nucleic acids. The table below summarizes the key characteristics of common DNA binding dyes:
Table 1: DNA Binding Dyes for Viability Assessment
| Dye Name | Excitation/Emission (nm) | Binding Mechanism | Compatibility | Key Considerations |
|---|---|---|---|---|
| Propidium Iodide (PI) | 488/617 [39] | Intercalates between base pairs of dsDNA [39] | Unfixed cells only [38] | Cannot be used with intracellular staining; must remain in buffer during acquisition [38] |
| 7-AAD | 488/647 [39] | Intercalates in G-C rich regions of dsDNA [39] | Unfixed cells only [38] | Similar limitations to PI; offers different emission spectrum for multiplexing [38] |
| DAPI | 358/461 [39] | Binds to A-T rich regions in dsDNA [39] | Unfixed cells only | Can also bind RNA with lower intensity; excitable by violet laser (405 nm) [39] |
These dyes are straightforward to use, typically requiring short incubation immediately before cytometric analysis. However, a significant limitation is their incompatibility with fixation procedures, as they rely on membrane permeability differences between live and dead cells that are eliminated by fixation [39]. Additionally, because cells continue to die during experimentation, the timing of dye addition relative to analysis must be consistent across samples for accurate comparisons [39].
Fixable Viability Dyes
Fixable viability dyes (FVDs) represent a significant advancement for experiments requiring fixation or permeabilization. These dyes work through a different mechanism: they react with protein amine groups in both live and dead cells, but due to the compromised membranes of dead cells, the dye penetrates more deeply and binds to more intracellular proteins, resulting in approximately 50 times greater fluorescence in dead cells compared to live ones [39]. This covalent attachment to cellular proteins means the staining remains stable through fixation, permeabilization, and even cryopreservation procedures [38].
Table 2: Characteristics of Fixable Viability Dyes
| Property | Advantages | Experimental Considerations |
|---|---|---|
| Chemical Mechanism | Covalently binds to cellular amines [39] | Stain before fixation; compatible with intracellular staining |
| Signal Stability | Withstands fixation, permeabilization, freezing [38] | Allows for batch processing and analysis at later timepoints |
| Flexibility | Can be used before or after surface staining [38] | Provides experimental design flexibility |
| Spectral Range | Available for UV, violet, blue, and red lasers [38] | Enables multiplexing with various fluorochrome combinations |
For optimal results with FVDs, it is recommended to stain in azide- and protein-free PBS, as these components can interfere with the staining reaction and reduce intensity. Cells should be washed twice in appropriate buffer before resuspending at 1-10 × 10⁶ cells/mL, and the dye should be added at approximately 1 μL per mL of cells, followed by vortexing and incubation for 30 minutes at 2-8°C protected from light [38].
Metabolic Activity Dyes
Metabolic activity dyes provide an alternative approach to viability assessment based on biochemical function rather than membrane integrity. Calcein AM is a cell-permeant compound that is non-fluorescent until it enters living cells, where intracellular esterases hydrolyze it to produce green fluorescence [38] [39]. Dead cells with low esterase activity do not generate this fluorescent signal. This dye is particularly useful when paired with a dead cell indicator like PI, enabling simultaneous assessment of both live and dead populations in a sample [39].
Another metabolic staining approach uses Fluorescein Diacetate (FDA), which similarly relies on intracellular esterase activity in live cells to convert the non-fluorescent compound into fluorescent fluorescein [42]. This method offers very low toxicity and is particularly effective for sensitive cell types and yeast, as it provides a readout dependent on metabolic activity rather than just membrane integrity [42].
Troubleshooting Guides
Common Problems and Solutions in Viability Staining
Table 3: Troubleshooting Viability Staining for Flow Cytometry
| Problem | Possible Causes | Recommended Solutions |
|---|---|---|
| Weak or no fluorescence signal | Incorrect laser and PMT settings [43] | Verify laser wavelengths and PMT settings match fluorochrome excitation/emission spectra [43] |
| Poorly expressed target paired with dim fluorochrome [43] | Use brightest fluorochrome (e.g., PE) for lowest density targets [43] | |
| Inadequate fixation and/or permeabilization [43] | Optimize fixation and permeabilization protocol for specific target [43] | |
| High background fluorescence | Presence of dead cells [43] | Use appropriate viability dye (PI/7-AAD for live cells; fixable dyes for fixed cells) to gate out dead cells [43] |
| Fc receptor-mediated non-specific binding [43] [44] | Block with BSA, Fc receptor blocking reagents, or normal serum [43] | |
| Excessive antibody concentration [43] | Titrate antibodies to determine optimal concentration [43] | |
| Autofluorescence in certain cell types [43] | Use fluorochromes emitting in red-shifted channels (e.g., APC) or very bright fluorochromes [43] | |
| Poor separation between live/dead populations | Incorrect dye concentration [38] | Titrate viability dye for optimal performance in specific assay [38] |
| Insufficient incubation time [38] | Follow recommended incubation times (5-15 min for PI/7-AAD; 30 min for FVDs) [38] | |
| Use of inappropriate buffer [38] | Stain FVDs in azide- and protein-free PBS for brightest staining [38] | |
| Inconsistent results between samples | Variable timing of dye addition [39] | Add dye at consistent time before analysis across all samples [39] |
| Dye degradation | Protect dyes from light and moisture; follow storage recommendations [38] | |
| Bacterial contamination in samples | Implement sterile techniques; consider staining before fixation to eliminate risk [41] |
Special Considerations for Bacterial Viability Assessment
Assessing bacterial viability presents unique challenges compared to eukaryotic cells, particularly in the context of dormant populations. Bacteria have size and granularity characteristics very similar to background signals in flow cytometry, necessitating additional staining steps to differentiate them from noise. A recently developed safer protocol addresses this by combining viability staining with DNA labeling using dyes like SYTO or DRAQ5 to clearly distinguish bacterial cells [41].
This approach has been validated on both Gram-positive and Gram-negative bacteria, as well as polybacterial cultures, using multiple marker combinations (viability-DNA). The method includes a viability labeling step before fixation, which eliminates the risk of biological exposure for researchers and prevents contamination of cytometers. Additionally, it reduces the use of hazardous reagents like propidium iodide, which has carcinogenic, mutagenic, and reprotoxic (CMR) properties [41].
For bacterial dormancy research, flow cytometry offers significant advantages over traditional culture-dependent methods, which often have high variability and require days to obtain results. The flow cytometry approach can evaluate physiological states including cell-wall damage and metabolic activity, allowing quantification of cells in sub-optimal physiological conditions that might represent dormant populations [45].
Frequently Asked Questions (FAQs)
Q1: When should I use DNA binding dyes versus fixable viability dyes? DNA binding dyes like PI and 7-AAD are suitable for simple live cell surface staining protocols where fixation is not required. They are cost-effective and involve straightforward protocols with short incubation times. Fixable viability dyes are essential when performing intracellular staining, as they withstand fixation and permeabilization procedures. They also offer greater flexibility in experimental timing, as stained samples can be fixed and analyzed later [38] [39].
Q2: How can I improve viability staining results for sensitive primary cells? For sensitive cells like PBMCs or stem cells, avoid Trypan Blue due to its cytotoxicity, which can cause significant reduction in cell counts within 15-30 minutes. Instead, use low-toxicity options like Erythrosin B for brightfield counting or AO/PI for fluorescence-based detection. These alternatives provide greater stability and are less harmful to delicate cells [42]. Additionally, employ gentle cell separation methods to minimize mechanical stress that can compromise cell viability [40].
Q3: What controls are necessary for proper viability staining in flow cytometry? For compensation, use single-stained samples (either cells or compensation beads) for each fluorochrome in your experiment. Include unstained controls and consider fluorescence-minus-one (FMO) controls for accurate gating, especially when working with rare cell populations or poorly defined populations. For viability assessment specifically, it's recommended to use a compensation control sample stained with the fixable viability dye only [38] [44].
Q4: How does viability staining help in detecting dormant bacterial populations? Traditional viability assessment often fails to accurately identify dormant bacteria, as they may exhibit different membrane characteristics and metabolic activities compared to both actively growing and dead cells. Advanced flow cytometry protocols combining viability dyes with DNA labels and metabolic indicators can help resolve these subpopulations by measuring multiple parameters simultaneously, including membrane integrity, enzymatic activity, and nucleic acid content [41] [45].
Q5: Why is my viability dye staining all cells, rather than just dead cells? This common issue can have several causes. For fixable viability dyes, excessive dye concentration can lead to overwhelming the amine buffering capacity of live cells, resulting in non-specific staining. Titrate your dye to determine the optimal concentration. Additionally, using inappropriate buffers containing proteins or azides can interfere with staining reactions. Always use azide- and protein-free PBS for FVD staining unless using validated alternative protocols [38]. Also ensure your cell preparation doesn't contain an excessive proportion of dead cells, which can make population discrimination challenging.
Experimental Protocols
Standard Protocol for Fixable Viability Dyes
This protocol is optimized for distinguishing live and dead cells in samples that will undergo fixation, permeabilization, or intracellular staining.
Table 4: Step-by-Step Protocol for Fixable Viability Dyes
| Step | Procedure | Key Considerations |
|---|---|---|
| Cell Preparation | Wash cells 2 times in azide-free and protein-free PBS [38] | Azides and proteins can interfere with dye binding |
| Cell Resuspension | Resuspend at 1-10 × 10⁶ cells/mL in azide- and serum/protein-free PBS [38] | Consistent cell concentration ensures reproducible staining |
| Dye Addition | Add 1 μL of FVD per 1 mL of cells and vortex immediately [38] | Immediate mixing ensures even dye distribution |
| Incubation | Incubate 30 minutes at 2-8°C protected from light [38] | Lower temperatures reduce dye internalization in live cells |
| Washing | Wash cells 1-2 times with Flow Cytometry Staining Buffer or equivalent [38] | Remove excess dye before continuation with experiment |
| Downstream Processing | Continue with surface staining, fixation, or intracellular staining as desired [38] | FVD staining remains stable through these procedures |
Protocol for DNA Binding Dyes (PI or 7-AAD)
This quick protocol is suitable for viability assessment in unfixed cells during surface staining procedures.
- After staining cells for surface antigens, wash cells 1-2 times with Flow Cytometry Staining Buffer [38].
- Resuspend cells in an appropriate volume of Flow Cytometry Staining Buffer [38].
- Add 5 μL of PI Staining Solution or 7-AAD Staining Solution per 100 μL of cells [38].
- Incubate for 5-15 minutes on ice or at room temperature. Do not wash cells [38].
- Analyze samples by flow cytometry within 4 hours due to adverse effects on cell viability with prolonged dye exposure [38].
Research Reagent Solutions
Table 5: Essential Reagents for Viability Staining and Flow Cytometry
| Reagent Category | Specific Examples | Function and Application |
|---|---|---|
| DNA Binding Viability Dyes | Propidium Iodide (PI), 7-AAD, DAPI [38] [39] | Identify dead cells in unfixed samples based on membrane integrity; bind to nucleic acids |
| Fixable Viability Dyes | eFluor series, Zombie Dyes, Phantom Dyes [38] [41] [39] | Covalently label dead cells before fixation; compatible with intracellular staining protocols |
| Metabolic Activity Dyes | Calcein AM, Calcein Violet AM, Fluorescein Diacetate (FDA) [38] [42] | Identify live cells based on enzymatic activity; indicate metabolic function |
| Nucleic Acid Stains for Bacteria | SYTO dyes, DRAQ5 [41] | Differentiate bacterial cells from background in flow cytometry; enable detection of small particles |
| Staining Buffers | Flow Cytometry Staining Buffer, Azide/Protein-Free PBS [38] | Maintain cell viability during staining; provide appropriate chemical environment for reactions |
| Fc Receptor Blocking Reagents | Bovine Serum Albumin, species-specific normal serum [43] [44] | Reduce non-specific antibody binding; decrease background fluorescence |
| Compensation Beads | Antibody capture beads [44] | Create single-color controls for compensation; ensure proper fluorescence calibration |
Advanced Applications for Dormancy Research
For research specifically focused on detecting dormant bacterial populations, viability staining requires specialized approaches that go beyond simple live/dead discrimination. Dormant cells often exhibit characteristics that differ from both actively growing and dead cells, potentially including reduced membrane permeability, altered metabolic activity, and changes in nucleic acid content.
Innovative approaches combine multiple staining strategies to identify these subpopulations. For example, a protocol might simultaneously assess membrane integrity (using a fixable viability dye), metabolic activity (using a substrate like FDA), and DNA content (using a nucleic acid stain). This multiparameter analysis can help resolve dormant populations that might be missed with single-parameter viability assessment [41] [45].
The development of safer protocols that minimize researchers' exposure to hazardous reagents while providing accurate assessment of bacterial viability represents an important advancement for the field. These methods allow for the analysis of fixed samples, eliminating risks associated with viable pathogens, and replace carcinogenic, mutagenic, or reprotoxic dyes with safer alternatives [41]. This is particularly valuable for long-term studies of bacterial dormancy where repeated sampling and analysis may be required.
When applying these techniques to dormant population research, validation with complementary methods is essential. The reliability of flow cytometry results should be confirmed using techniques such as confocal microscopy, additional permeabilization methods, or time-course experiments tracking cultures over extended periods [41]. This comprehensive approach ensures that viability staining protocols accurately reflect the complex physiological states present in bacterial populations containing dormant cells.
Frequently Asked Questions (FAQs)
Q1: What are the key advantages of using Single-Cell Raman Spectroscopy (SCRS) over fluorescence-based methods for studying dormant bacteria?
SCRS offers several critical advantages for probing dormant bacterial populations, such as persister cells and spores. It is a label-free, non-destructive technique that requires no fluorescent dyes or probes, thereby avoiding potential cytotoxicity, non-specific binding, and interference with natural cellular functions [46]. It provides an intrinsic molecular "fingerprint" of a single cell, encompassing vibrational information from nucleic acids, proteins, lipids, and carbohydrates in a single spectrum [46]. Crucially, it can analyze samples containing water, making it ideal for studying living cells in their native, hydrated state without laborious drying procedures that could alter their chemistry [46]. This combination of attributes makes SCRS uniquely suited for tracking the metabolic state and resuscitation dynamics of dormant cells without external perturbation.
Q2: We observe very weak spontaneous Raman signals from our bacterial persister cells. What strategies can enhance these signals?
Weak spontaneous Raman signals are a common bottleneck, constraining detection speed and throughput [46]. The table below summarizes primary signal enhancement methods:
Table: Strategies for Enhancing Raman Signals in Bacterial Cell Studies
| Strategy | Brief Description | Key Advantage | Key Disadvantage |
|---|---|---|---|
| D₂O Probing | Tracks incorporation of Deuterium (D) from heavy water into newly synthesized biomolecules, creating a detectable C-D band [47] [48]. | Probes metabolic activity directly; non-toxic at moderate concentrations [47]. | Requires metabolic activity; not for completely dormant cells. |
| Resonance Raman | Enhances signal by matching laser frequency with electronic transitions of target molecules. | Can provide massive signal enhancement for specific molecules. | Can cause photo-damage; not a general-purpose enhancement. |
| Coherent Anti-Stokes Raman Scattering (CARS) | A nonlinear optical process that provides a coherent and directional signal. | Enables high-speed imaging. | Requires complex, expensive instrumentation. |
| Stimulated Raman Scattering (SRS) | Another nonlinear technique involving two laser beams to stimulate vibrational transitions. | Offers high sensitivity and background-free imaging. | Complex setup and potential for photothermal damage. |
Q3: When using microfluidics for Raman-activated cell sorting, how can we distinguish target cells from oil bubbles to improve sorting accuracy?
In digital microfluidics systems, oil bubbles can form and be misidentified as cells by automated algorithms, reducing sorting purity. A robust solution is to implement a three-class detection model for object recognition. Instead of just classifying objects as "droplets" or "cells," this model adds a third category for "oil bubbles" [49]. This approach has been shown to improve cell recognition accuracy, with one study reporting a 1.0% increase in the AP75 metric (a measure of detection accuracy) and an overall model identification precision exceeding 98% [49]. This method is particularly effective at identifying cells obscured at droplet edges, a common occurrence.
Q4: How can we verify that our sorted persister cells are viable and metabolically active?
The combination of SCRS with D₂O-based Ramanometry (D₂O-Ramanometry) is a powerful method for this purpose. When bacteria are incubated with D₂O, metabolically active cells incorporate deuterium into newly synthesized biomolecules, which generates a detectable carbon-deuterium (C-D) Raman band [47] [48]. The intensity of this C-D band, often expressed as a C-D ratio, is directly correlated with the rate of metabolic activity [47]. A successful experiment will show that sorted persister cells, upon resuscitation, exhibit a temporal pattern of D₂O intake and an increasing C-D ratio, confirming their viability and metabolic recovery [48]. Machine learning models can then classify metabolic states with high accuracy (>99%) based on the Raman spectral data [47].
Troubleshooting Guides
Low Single-Cell Raman Signal Intensity
| Problem | Possible Causes | Solutions | Preventive Measures |
|---|---|---|---|
| Weak or noisy spectra from individual cells. | 1. Low concentration of cellular components.2. Suboptimal laser power or integration time.3. Cell damage or photobleaching.4. Inadequate optical alignment. | 1. Use D₂O probing to amplify the signal for metabolic components [47] [48].2. Gradually increase laser power and integration time until a clear signal is obtained, while monitoring for cell damage.3. Verify cell viability using viability stains post-analysis (if applicable).4. Perform regular calibration of the Raman spectrometer with a standard sample (e.g., silicon). | - Optimize culture conditions to ensure healthy cells.- Establish a standard calibration protocol for the instrument. |
Poor Classification of Metabolic States
| Problem | Possible Causes | Solutions | Preventive Measures |
|---|---|---|---|
| Machine learning models fail to accurately classify cells based on metabolic activity (e.g., active vs. dormant). | 1. Insufficient or low-quality training data.2. High variability in single-cell spectra.3. Incorrect D₂O concentration. | 1. Acquire a large and balanced dataset of SCRS for each metabolic state.2. Pre-process spectra (e.g., normalization, background subtraction) to reduce noise.3. Test different D₂O concentrations (e.g., up to 50%) to find the level that does not inhibit growth but provides a clear C-D signal [47].4. Try different classifiers; studies show Support Vector Machine (SVM) and Linear Discriminant Analysis (LDA) can achieve >99% accuracy for this task [47]. | - Establish a standardized protocol for D₂O labeling and SCRS acquisition.- Validate the model with a separate, blinded test set. |
Challenges in Raman-Activated Cell Sorting
| Problem | Possible Causes | Solutions | Preventive Measures |
|---|---|---|---|
| Low throughput or efficiency in sorting target cells. | 1. Slow spectral acquisition rate.2. Weak Raman signals prolong exposure time.3. Misidentification of non-target particles (e.g., bubbles). | 1. Employ signal enhancement techniques (see Table above) to reduce required exposure time [46].2. Implement a three-class AI detection model to distinguish cells from oil bubbles and empty droplets [49].3. Utilize an Active-Matrix Digital Microfluidic (AM-DMF) system for parallel manipulation of thousands of droplets, significantly increasing throughput [49]. | - Integrate AI-driven object detection from the start of the experimental design.- Use high-quality, purified oils and surfactants in microfluidic systems to minimize bubble formation. |
Experimental Protocols
Protocol: Detecting Metabolic Activity inStaphylococcus aureususing D₂O-Probed SCRS
This protocol is adapted from recent research to detect and classify the metabolic activity of S. aureus, a relevant pathogen known to form persisters [47].
1. Principle: Metabolically active cells incorporate deuterium (D) from heavy water (D₂O) into newly synthesized proteins, lipids, and other molecules during biosynthesis. This incorporation generates a distinct carbon-deuterium (C-D) bond, which produces a Raman band in the "silent region" (1800–2700 cm⁻¹) where native biological molecules have few Raman peaks. The intensity of this C-D band serves as a quantitative measure of metabolic activity [47].
2. Reagents and Materials:
- Staphylococcus aureus culture.
- Appropriate growth broth (e.g., Tryptic Soy Broth).
- Heavy water (D₂O, 99.9% atom D).
- Phosphate Buffered Saline (PBS).
- Raman-compatible substrate (e.g., aluminum-coated slide, microfluidic chip).
3. Procedure:
- Step 1: Culture Preparation. Grow S. aureus to the desired growth phase (e.g., exponential or stationary) in standard broth.
- Step 2: D₂O Labeling. Harvest cells and resuspend them in a growth medium containing a defined concentration of D₂O (e.g., 30% v/v). Note: Concentrations below 50% D₂O have been shown to have no significant impact on the growth and reproduction of S. aureus [47].
- Step 3: Incubation. Incubate the cell suspension for a defined metabolic labeling period (e.g., 2-4 hours) under optimal growth conditions.
- Step 4: Sample Preparation. After incubation, wash the cells with PBS to remove residual D₂O. Concentrate the cells and deposit them onto a Raman-compatible substrate for analysis.
- Step 5: Raman Spectroscopy. Acquire single-cell Raman spectra using a confocal Raman microspectrometer. Typical parameters: 532 nm or 785 nm laser wavelength, 1-10 mW laser power at the sample, 1-30 seconds integration time.
- Step 6: Data Analysis.
- Pre-processing: Subtract background, correct baseline, and normalize spectra (e.g., to the C-H band near 2930 cm⁻¹).
- Calculate C-D ratio: The ratio of the intensity in the C-D band (e.g., 2040-2300 cm⁻¹) to the intensity in the C-H band (e.g., 2800-3100 cm⁻¹) [47].
- Metabolic Classification: Use a pre-trained machine learning model (e.g., Linear Discriminant Analysis) to classify cells into different metabolic states (e.g., high activity, low activity, dead) based on their spectral fingerprints [47].
Protocol: Identifying and AssessingE. coliPersisters via SCRS
This protocol outlines the process for generating E. coli persisters and probing their metabolic state using SCRS and D₂O [48].
1. Principle: Bacterial persisters are a small, non-growing, antibiotic-tolerant subpopulation. This protocol uses a high dose of ampicillin to kill the majority of a population, leaving behind persisters. Their metabolic activity before and after antibiotic removal is then quantified using D₂O-Ramanometry, challenging the classical view that all persisters are entirely dormant [48].
2. Reagents and Materials:
- Escherichia coli (e.g., ATCC 25922).
- Luria-Bertani (LB) Broth and Agar.
- Ampicillin sodium salt (prepare a stock solution, e.g., 100 mg/mL in water).
- D₂O (99.9% atom D).
- PBS.
3. Procedure:
- Step 1: Culture and Persister Formation.
- Grow E. coli overnight in LB broth.
- Dilute the overnight culture 1:100 into fresh LB and grow to mid-exponential phase.
- Treat the culture with a high concentration of ampicillin (e.g., 32x MIC, 100 μg/mL) for 4 hours to kill non-persister cells [48].
- Wash the cells with PBS to remove the antibiotic and residual media.
- Step 2: Metabolic Labeling and SCRS Analysis.
- Resuspend the ampicillin-treated cell pellet (enriched with persisters) in fresh LB medium containing 30% D₂O.
- Incubate for a short period (e.g., 0, 1, 2 hours) to monitor metabolic resuscitation.
- At each time point, take an aliquot, wash, and acquire SCRS as described in Protocol 3.1.
- Step 3: Data Interpretation.
- Compare the Raman spectra of untreated E. coli and ampicillin-treated persisters. Notable differences in bands related to cellular components are expected [48].
- Analyze the C-D ratio over time. Studies have shown that E. coli persisters can exhibit significant metabolic activity after antibiotic removal, and their pattern of D₂O intake may be distinct from normal cells [48].
- Use multivariate analysis (e.g., Principal Component Analysis - PCA) to visually separate persisters from normal cells based on their distinct Raman spectra [48].
The Scientist's Toolkit: Key Research Reagent Solutions
Table: Essential Reagents and Materials for SCRS Studies of Dormant Bacteria
| Item | Function/Application | Key Considerations |
|---|---|---|
| Heavy Water (D₂O) | Non-invasive metabolic probe; incorporated during biosynthesis to generate a quantifiable C-D Raman signal [47] [48]. | Use concentrations ≤50% to avoid growth inhibition in S. aureus [47]. Optimal concentration may vary by species. |
| Raman-Compatible Microfluidic Chips (AM-DMF) | Enables high-throughput single-cell manipulation, sorting, and analysis in picoliter-to-nanoliter droplets [49]. | AM-DMF systems allow parallel control of thousands of electrodes, vastly improving throughput over manual methods. |
| Antibiotics (e.g., Ampicillin) | Used to select for and enrich persister cell populations by killing the majority of non-persister cells [48]. | Concentration must be thoroughly lethal (e.g., 32x MIC); verify MIC for your specific strain and growth conditions. |
| Machine Learning Classifiers (SVM, LDA) | For high-accuracy classification of single-cell metabolic states based on spectral data [47]. | SVM is effective for classifying viable vs. dead cells; LDA excels in distinguishing levels of metabolic activity [47]. |
| Three-Class Object Detection AI Model | Differentiates between target cells, empty droplets, and confounding oil bubbles in microfluidic systems, ensuring sorting accuracy [49]. | Trained on datasets annotated by multiple experts to minimize misidentification; improves cell recognition accuracy [49]. |
Workflow and Pathway Diagrams
SCRS Workflow for Metabolic Analysis
Troubleshooting Guides
Issue 1: No or Weak Fluorescence Signal in Bacterial Staining
Problem: Failure to detect or unexpectedly weak fluorescence signal when attempting to visualize bacterial cells.
Solutions:
- Verify dye compatibility and bacterial uptake: Certain fluorescent dyes like 2-NBDG (used in glucose uptake assays) are not transported by all bacterial species. Confirm your target bacteria can import the dye through their membrane transport systems [50].
- Optimize dye concentration and staining conditions: Perform a dye titration to determine the optimal concentration. For intracellular targets, ensure proper permeabilization is used if the epitope is not surface-exposed [51].
- Check microscope filter sets and light source: Ensure you are using the correct excitation/emission settings for your specific dye. Verify that high-energy lamp sources (e.g., mercury or xenon) are functioning properly and not at end of life [52].
- Account for photobleaching: Add antifading reagents to your mounting medium and reduce overall light exposure by using lower light intensity or blocking excitation light when not actively capturing images [51] [52].
Issue 2: High Background or Non-Specific Staining
Problem: Excessive background fluorescence or non-specific signal that obscures specific staining of target bacteria.
Solutions:
- Quench autofluorescence: Bacterial cells, pigmented cell types, and some culture media components can autofluoresce. Use autofluorescence quenchers, particularly for blue wavelength dyes which are most susceptible. Always include an unstained control to assess inherent autofluorescence levels [51].
- Optimize washing steps: Increase the number and volume of washes after staining steps, ensuring adequate rocking for free movement. Remove excessive, unbound fluorochrome to reduce background [51] [52].
- Validate antibody specificity: For immunofluorescence, perform staining controls with secondary antibody alone to check for cross-reactivity. Use highly cross-adsorbed secondary antibodies in multiple staining experiments [51].
- Adjust antibody concentration: If both specific signal and background are high, the primary or secondary antibody concentration may be too high. Titrate antibodies to find the concentration that maximizes signal-to-noise ratio [51].
Issue 3: Inability to Detect Dormant (VBNC) Bacterial Populations
Problem: Failure to detect Viable But Non-Culturable (VBNC) cells using standard viability assays, leading to underestimation of viable bacterial load.
Solutions:
- Employ membrane integrity-based assays: Since VBNC cells are non-culturable and can have low metabolic activity, use dyes that assess membrane integrity (e.g., propidium iodide exclusion) as a more reliable viability criterion [50] [53].
- Combine multiple detection methods: No single method perfectly captures all VBNC cells. Use a combination of culturability, metabolic activity, and membrane integrity assessments to gain a comprehensive view of the bacterial population [50].
- Utilize advanced reporter systems: Implement genetic reporters like luciferase or fluorescent proteins coupled with promoters induced in VBNC cells. For MRI-based detection, consider reporter gene combinations (e.g., transferrin receptor, DMT1, and Ferritin-M6A) that allow observation in living systems [54].
Frequently Asked Questions (FAQs)
Q1: How can I distinguish between dormant bacterial persisters and VBNC cells? A1: Both are dormant states, but a key difference is their resuscitation time. Persisters can quickly resume growth upon stress removal (e.g., antibiotic withdrawal), while VBNC cells require a more prolonged and specific resuscitation-promoting treatment. Persisters are often considered an initial stage of dormancy, with VBNC representing a deeper dormant state within the microbial dormancy continuum [53].
Q2: What is the best fluorescent reporter for long-term, real-time tracking of bacteria in vivo? A2: While fluorescent proteins (FPs) like GFP and RFP allow real-time analysis, they are prone to photobleaching and background autofluorescence. Luciferase reporters often provide superior sensitivity for in vivo imaging due to minimal background signal, though they typically require substrate administration [55]. The choice involves a trade-off between convenience and sensitivity.
Q3: My bacterial colonies show heterogeneous growth on agar plates. How can I best analyze this? A3: Heterogeneous colony growth can indicate phenotypic heterogeneity, including dormancy. Instead of relying on a single endpoint measurement, use time-lapse imaging (e.g., with tools like ColTapp) to monitor colony appearance time and growth dynamics over time. This provides a better proxy for single-cell lag time and helps distinguish slow growth from delayed growth resumption [56]. Account for colony density, as crowding can bias appearance time estimates.
Q4: Why do my viability assays give conflicting results for the same bacterial sample? A4: This is common when different assays target different viability criteria. A culture-based method may miss VBNC cells, a metabolic dye may fail to detect dormant cells with silenced metabolism, while a membrane integrity assay might identify both as viable. The choice of assay should align with your specific definition of "viable" for your research context [50] [53].
Experimental Protocols & Methodologies
Protocol 1: Assessing Bacterial Viability Using Metabolic Dye Uptake
Principle: This method assesses viability based on the metabolic activity of bacterial cells. Viable cells with active enzyme systems take up and hydrolyze non-fluorescent substrates into detectable fluorescent products.
Procedure:
- Prepare dye stock solution: Dissolve Fluorescein Diacetate (FDA) in an appropriate solvent (e.g., acetone or DMSO) to create a concentrated stock solution.
- Incubate with bacterial sample: Add the FDA stock to a bacterial suspension in buffer at a final concentration typically ranging from 5-50 µg/mL. Incubate in the dark for 15-60 minutes at the growth temperature.
- Wash and resuspend: Centrifuge the cells to remove excess, unhydrolyzed dye. Gently resuspend the bacterial pellet in fresh buffer.
- Analyze by microscopy or flow cytometry: Immediately observe the cells under a fluorescence microscope with standard FITC filter sets, or analyze using flow cytometry. Viable, metabolically active cells will exhibit green fluorescence [50].
Troubleshooting Note: Be aware that the hydrolysis of FDA produces acetic acid, which can lower the intracellular pH and potentially quench the fluorescent signal or affect enzyme activity. Optimization of incubation time and dye concentration is critical [50].
Protocol 2: Time-Lapse Imaging and Analysis of Bacterial Colony Growth Dynamics
Principle: This protocol uses automated image analysis to quantify colony growth parameters, which serve as a proxy for the metabolic state and heterogeneity within a bacterial population, crucial for identifying dormant subpopulations.
Procedure:
- Plate preparation: Spread or spot the bacterial sample of interest onto an appropriate agar plate. For analyzing heterogeneity, ensure a cell density that yields well-isolated colonies.
- Image acquisition: Place the plate in a time-lapse imaging system equipped with a controlled-temperature chamber. Capture images of the entire plate at regular intervals (e.g., every 30-60 minutes) over the entire incubation period (e.g., 24-48 hours).
- Image analysis with ColTapp:
- Input the time-lapse image series into the ColTapp application.
- The software automatically detects colonies and tracks their radius over time.
- Set a detectable size threshold (Rthresh, e.g., 200 µm). ColTapp determines the appearance time (tapp) and linear radial growth rate (GR) for each colony by performing a linear regression on the growth data shortly after the colony exceeds Rthresh [56].
- Data interpretation: Colonies with significantly longer appearance times are likely derived from cells that were dormant or had extended lag phases at the time of plating. The distribution of appearance times across the population quantifies phenotypic heterogeneity [56].
Data Presentation
Table 1: Comparison of Common Reporter Gene Systems
| Reporter System | Detection Method | Key Advantages | Key Limitations | Ideal for Detecting Dormancy? |
|---|---|---|---|---|
| Fluorescent Proteins (e.g., GFP, RFP) [55] | Fluorescence microscopy | Real-time, live-cell imaging; multicolor capability | Photobleaching; background autofluorescence; requires high metabolic activity for folding/maturation | Less suitable, as maturation often requires active metabolism |
| Luciferase [55] | Bioluminescence (Luminometer) | Extremely high sensitivity; low background; suitable for in vivo imaging | Requires substrate (luciferin) and ATP; signal is transient | More suitable, but dormant cells with low ATP may not produce signal |
| β-Galactosidase (LacZ) [55] | Colorimetric assay (X-gal) | Cost-effective; high signal-to-noise; works in fixed samples | Mostly qualitative; often requires cell lysis/fixation | Can be used post-resuscitation or in fixed samples |
| MRI Reporter Genes (e.g., Ferritin-M6A) [54] | Magnetic Resonance Imaging | Allows deep-tissue imaging in living animals; high resolution | Requires transduction of genes; complex setup; lower sensitivity | Promising for in vivo tracking, including dormant cells |
Table 2: Viability Assessment Methods for Bacterial Pathogens
| Viability Criterion | Example Method | Detects VBNC State? | Detects Dormant (Metabolically Inactive) Cells? | Key Limitations |
|---|---|---|---|---|
| Culturability [50] [53] | Plate Count | No | No | The "gold standard" but misses VBNC and dormant cells; slow (2-7 days) |
| Metabolic Activity [50] | FDA Hydrolysis, 2-NBDG Uptake | Yes | No | May fail if metabolism is silenced; sensitive to pH and environment |
| Membrane Integrity [50] [53] | Propidium Iodide Exclusion | Yes | Yes | Considered the most reliable for overall viability; does not indicate metabolic state |
Research Reagent Solutions
Essential Materials for Fluorescence-Based Detection of Dormant Bacteria
| Item | Function | Example & Notes |
|---|---|---|
| Fluorescein Diacetate (FDA) | Metabolic viability dye: converted to fluorescent fluorescein by active intracellular enzymes [50]. | Assess general metabolic activity; note pH sensitivity. |
| Propidium Iodide (PI) | Membrane integrity dye: enters only cells with damaged membranes and binds to DNA [50] [53]. | Often used in combination with green fluorescent viability dyes for live/dead staining. |
| 2-NBDG | Fluorescent glucose analog: taken up via glucose transport systems [50]. | Measures glucose uptake activity; not transported by all bacterial species. |
| TrueBlack Autofluorescence Quencher | Reduces background signal from natural autofluorescence in cells and tissues [51]. | Critical for improving signal-to-noise ratio, especially in environmental samples. |
| EverBrite Mounting Medium | Antifade mounting medium to reduce photobleaching [51]. | Preserves fluorescence signal during microscopy imaging. |
| Reporter Plasmids | Genetically encode fluorescent or luciferase proteins under specific promoters [54] [55]. | Allows tracking of gene expression and promoter activity in response to dormancy cues. |
Diagram: Strategy for Dormant Bacterial Population Detection
Dormant Bacteria Detection Strategy
Diagram: Fluorescence Microscopy Troubleshooting Workflow
Fluorescence Microscopy Troubleshooting
This technical support center is designed for researchers working on the front lines of a critical public health challenge: detecting dormant bacterial populations. Metabolically inert bacteria pose a significant threat, as they escape detection by traditional antibiotics and can cause recurring infections, a key driver of antimicrobial resistance [57]. This guide provides detailed troubleshooting and methodological support for implementing emerging tools that combine nano-sensors and artificial intelligence (AI) to detect these elusive "sleeper" bacteria with the speed and sensitivity required for modern diagnostics and therapeutic development [58].
FAQs and Troubleshooting Guide
Q1: Our colorimetric nano-sensor for bacterial endotoxins is showing inconsistent color development, leading to false negatives. What could be the issue?
- Potential Cause & Solution: Inconsistent color change is often related to the stability of the nanoparticle conjugates or suboptimal binding conditions.
- Verify Bioreceptor Integrity: Ensure the LPS-binding aptamers or Polymyxin B used for selectivity are fresh and have been stored correctly. Degraded bioreceptors will not bind endotoxins effectively [59].
- Check Nanoparticle Functionalization: The process of attaching bioreceptors to nanomaterials like gold nanoclusters or carbon nanotubes is critical. Confirm the functionalization protocol was followed precisely, as incomplete coating can lead to non-specific aggregation and unreliable color signals [60] [59].
- Optimize Incubation Conditions: pH and temperature can greatly affect binding efficiency. Re-optimize the incubation time and buffer conditions for your specific sample matrix (e.g., blood serum vs. water) [59].
Q2: When using AI-screened compounds to target dormant bacteria, our in vitro results don't match the AI's predicted efficacy. How can we troubleshoot this?
- Potential Cause & Solution: This discrepancy often stems from the biological models used for validation not accurately mimicking the dormant state.
- Confirm Dormancy Model: Ensure your stationary-phase bacterial culture (e.g., E. coli or A. baumannii) is properly induced and verified. Use metabolic activity assays to confirm the bacteria are in a dormant state before adding the AI-identified compounds like semapimod [57].
- Assess Membrane Disruption Mechanism: For compounds like semapimod, which disrupt the outer membrane of Gram-negative bacteria, confirm your assay can detect membrane integrity changes. Use a standard assay for membrane disruption as a positive control [57].
- Review Training Data: The AI model's predictions are only as good as its training data. Understand the source and biological context of the data used to train the AI (e.g., ancient peptide sequences vs. modern chemical libraries) and ensure your experimental setup aligns with those conditions [61].
Q3: Our electrochemical nanosensor for E. coli has high background noise, reducing its sensitivity in complex samples like blood serum.
- Potential Cause & Solution: High background is frequently caused by non-specific binding or interference from the sample matrix.
- Improve Surface Passivation: Use a blocking agent (e.g., BSA or casein) to coat any non-specific binding sites on the sensor chip after immobilizing the bioreceptor [59].
- Implement Standard Addition Method: Spiking known concentrations of the analyte (endotoxin) into the sample can help account for matrix effects and improve quantification accuracy, as demonstrated in portable endotoxin detectors [59].
- Refine Nanomaterial Synthesis: The sensitivity of your fCNT or copper oxide nanoparticle platform is key. Variations in nanomaterial synthesis can introduce contaminants that cause background signal. Standardize your nanofabrication process for consistency [60] [59].
Q4: What are the key considerations when moving a nanosensor prototype from the lab to a point-of-care clinical setting?
- Potential Cause & Solution: The transition from a lab prototype to a robust bedside device involves several engineering and biological challenges.
- Electronic Design Refinement: Lab setups often use bulky equipment. To achieve the required sensitivity in a portable device, the electronic design, including signal amplification and processing, must be miniaturized and refined [59].
- Ensure Single-Use and Sterility: Design the sensor to be a single-use, disposable cartridge to prevent cross-contamination between patients [59].
- Validate with Real Clinical Samples: Rigorously test the device with a range of clinically relevant samples (e.g., whole blood, serum) to establish a reliable calibration curve and define the clinical detection limit [59].
Experimental Protocols and Data
Protocol 1: Electrochemical Endotoxin Detection using a CNT-based Aptasensor
This protocol details the fabrication and use of a sensitive electrochemical sensor for Lipopolysaccharide (LPS), a key biomarker for Gram-negative bacterial infections [59].
1. Sensor Fabrication:
- Materials:
- Functionalized Carbon Nanotubes (fCNT)
- Copper(I) oxide nanoparticles (Cu₂O)
- LPS-binding Aptamer or Polymyxin B
- Electrode chip (e.g., Gold or Screen-printed Carbon Electrode)
- Covalent linking chemistry (e.g., EDC/NHS)
- Method:
- Drop-cast a suspension of fCNT onto the electrode surface and allow to dry.
- Decorated the fCNT layer with Cu₂O nanoparticles to enhance electrochemical signal.
- Activate the nanomaterial surface using a crosslinker like EDC/NHS.
- Immobilize the LPS-specific aptamer or Polymyxin B onto the activated surface. The sensor chip is now ready.
2. Detection and Measurement:
- Materials:
- Portable potentiostat or custom-built analyzer.
- Buffer solutions.
- Standard LPS solutions for calibration.
- Method:
- Incubate the sensor chip with the sample (e.g., blood serum, juice) for a set time (e.g., 10 minutes).
- Wash the chip to remove unbound material.
- Measure the change in voltage (or current) using the portable analyzer.
- Quantify the endotoxin concentration by comparing the signal to a standard curve generated with known LPS concentrations.
Protocol 2: AI-Assisted Screening for Anti-Dormancy Compounds
This protocol outlines the workflow for using machine learning to identify compounds that are lethal to metabolically dormant bacteria [57].
1. AI Model Training and Compound Screening:
- Materials:
- Curated dataset of compounds with known activity/inactivity against dormant bacteria.
- High-performance computing resources.
- Machine learning algorithms (e.g., for generative modeling).
- Method:
- Train an ML model on the curated dataset to recognize patterns associated with anti-dormancy activity. Standardized data on Minimum Inhibitory Concentrations (MICs) is crucial for model accuracy [61].
- Use the trained model to screen vast digital libraries of compounds (e.g., existing drug libraries, ancient proteome databases, or generative chemical spaces) to predict potential "hits" [57] [61].
- Select the top candidate compounds for laboratory validation.
2. Laboratory Validation of AI Hits:
- Materials:
- Stationary-phase cultures of target bacteria (e.g., A. baumannii, E. coli).
- AI-predicted compound hits.
- Standard microbiological culture and assay equipment.
- Method:
- Induce bacterial dormancy by cultivating bacteria into the stationary phase. Confirm reduced metabolic activity using a assay.
- Expose the dormant bacterial culture to the AI-identified compounds.
- Assess bacterial viability after compound exposure using colony-forming unit (CFU) counts or a metabolic activity assay.
- For hits showing activity, investigate the mechanism of action (e.g., membrane depolarization assays for compounds like semapimod) [57].
Data Presentation
The table below summarizes performance data for various nanosensing platforms, which can be used for benchmarking your own sensor development.
Table 1: Performance Comparison of Selected Nanosensors for Pathogen Detection
| Nanomaterial | Detection Technique | Target | Detection Time (min) | Limit of Detection (LOD) |
|---|---|---|---|---|
| Au-CNT nanohybrid [60] | Colorimetric | H3N2 Influenza Virus | 10 | 3.4 PFU/mL |
| Functionalized CNT/Cu₂O [59] | Electrochemical | Endotoxin (LPS) | 10 | Not Specified |
| RNA-conjugated AuNPs [60] | Colorimetric | Influenza Virus | - | 10 PFU/mL |
| Silicon Nanowires [60] | Field-Effect Transistor (FET) | H3N2 Influenza Virus | 1 | 0.1 PFU/mL |
| Silver Nanoparticles (AgNPs) [60] | Surface-Enhanced Raman Scattering (SERS) | Respiratory Syncytial Virus (RSV) | 10 | 0.2 PFU/mL |
Table 2: Research Reagent Solutions for Nano-Sensing Experiments
| Reagent / Material | Function in Experiment |
|---|---|
| Functionalized Carbon Nanotubes (fCNT) [59] | Serves as a highly conductive scaffold on the electrode, enhancing electron transfer and providing a large surface area for bioreceptor immobilization. |
| Gold Nanoparticles (AuNPs) / Atomic Clusters [60] [59] | Used in colorimetric and electrochemical sensors; their surface plasmon resonance properties cause a visible color change upon aggregation, and they can be easily functionalized with antibodies or aptamers. |
| LPS-binding Aptamer [59] | A short, single-stranded DNA or RNA molecule that acts as the biological recognition element, binding specifically to endotoxin with high affinity and selectivity. |
| Polymyxin B [59] | A peptide antibiotic that binds tightly to the lipid A component of LPS; used as an alternative biological recognition element in endotoxin sensors. |
| Electrospun Nanofibers [60] | Used as a porous substrate in filter-based sensors to capture airborne microbes or as a matrix for immobilizing detection elements, benefiting from a high surface-to-volume ratio. |
Workflow and Pathway Visualization
AI and Nanosensor Workflow for Dormant Bacteria Detection
Endotoxin Nanosensor Experimental Process
Overcoming Detection Challenges: Pitfalls, False Negatives, and Protocol Optimization
Frequently Asked Questions
FAQ 1: What are the main reasons a sample can show clinical signs of infection but have a negative culture result? Several biological and technical factors can cause this discrepancy:
- Viable But Non-Culturable (VBNC) State: Bacteria can enter a dormant state with extremely low metabolic activity, allowing them to survive while being unable to form colonies on routine culture media [14] [62]. This is a common survival strategy under stress.
- Prior Antibiotic Treatment: Exposure to antibiotics before sample collection can damage bacteria sufficiently to prevent growth in culture, even if the cells are still alive and causing pathology [63].
- Presence of Obligate Anaerobes or Fastidious Bacteria: Some bacteria have specific nutritional requirements or require anaerobic conditions that are not met in standard aerobic culture protocols [63].
- Biofilm Formation: Bacteria embedded in biofilms are often metabolically heterogeneous and protected from environmental stresses, making them difficult to dislodge and culture with standard methods [23] [63].
FAQ 2: How can the VBNC state lead to recurrent infections and antibiotic treatment failure? Unlike resistant bacteria, VBNC cells are tolerant to antibiotics. Most antibiotics target active cellular processes like cell wall synthesis or protein production. Since VBNC cells have drastically reduced metabolic activity, these drugs have no effect, allowing the cells to "hide" during treatment. Once the antibiotic pressure is removed and conditions become favorable, these dormant cells can resuscitate and cause a recurrence of the infection [62] [23].
FAQ 3: What are the limitations of the standard aerobic plate count (APC) method? The APC method, while a gold standard, has several well-documented limitations:
- It Only Detects a Fraction of Microbes: It inherently misses VBNC cells, obligate anaerobes, and unculturable bacteria [62] [64] [63].
- It is Statistically Imprecise: The technique has inherent errors from sampling, dilution, and the distribution of cells. This error increases significantly as the colony count decreases. For example, a count of 10 CFU has a 95% confidence interval of 4 to 16, an error of ±60% [65].
- It Can Be Technically Challenging: Factors like colony swarming can make accurate counting difficult or impossible, leading to underestimation [66].
FAQ 4: What advanced methods can detect dormant bacterial populations?
- Molecular Methods (e.g., 16S rRNA PCR): This technique can detect bacterial DNA regardless of the cell's culturalbility. It is highly effective for identifying VBNC, unculturable, or anaerobic bacteria in culture-negative samples [63].
- Flow Cytometry: This method can provide a rapid and accurate count of total particles, including spores, and can be used with viability stains to assess cell status without requiring growth [66].
- Digital Plating Platforms: A recent technological advancement that partitions a sample into thousands of picoliter-sized wells. This micro-confinement can enhance the growth of slow-growing or finicky cells and provides single-cell resolution, significantly speeding up detection and quantification [67].
- Enzymatic Assays: Techniques that detect metabolic activity rather than growth, such as measuring ATP levels, can indicate the presence of viable cells that are not dividing [62].
Troubleshooting Guide: Improving Detection of Dormant Bacteria
Problem: Consistently low or no bacterial recovery from samples with clear signs of infection.
| Possible Cause | Investigation Steps | Recommended Solution |
|---|---|---|
| Sample collected after antibiotic therapy | Review patient medication history. | Use molecular diagnostic methods (e.g., 16S rRNA PCR) to detect non-growing bacterial DNA [63]. |
| Bacteria in VBNC state due to environmental stress | Test sample with viability stains (e.g., PMA) coupled with qPCR. | Implement a resuscitation-promoting factor (RPF) protocol. Add RPF to culture media to stimulate dormant cells to re-enter growth [14]. |
| Presence of obligate anaerobes | Perform Gram stain on sample—if bacteria are visible but won't grow, anaerobes are likely. | Use anaerobic culture systems or send samples for anaerobic culture and PCR [63]. |
| Inadequate culture conditions / fastidious bacteria | Evaluate colony morphology; if swarming occurs, it can mask other colonies. | Modify culture medium formulation (e.g., add swarming inhibitors like bile salts) or adjust incubation temperature [66]. Simulate the natural environment by using filtered seawater or low-nutrient media for environmental isolates [64]. |
| Low plate count accuracy | Re-examine counting methodology and statistical error. | Increase the number of replicate plates to improve precision. For counts below 25 CFU, report as " |
Experimental Protocols for Enhanced Detection
Protocol 1: Detection of Bacteria in Culture-Negative Samples via 16S rRNA PCR
This protocol is adapted from a clinical study that successfully identified bacteria in over 50% of culture-negative surgical site infections [63].
1. DNA Extraction
- Use a commercial DNA extraction kit (e.g., QIAamp DNA Mini Kit) to isolate total genomic DNA from the clinical sample (e.g., wound swab or aspirate).
- Follow the manufacturer's instructions precisely.
2. Broad-Range 16S rRNA PCR Assay
- Primers: Use universal bacterial primers.
- Forward (27F): 5′-AGAGTTTGATCCTGGCTCAG-3′
- Reverse (1492R): 5′-GGTTACCTTGTTACGACTT-3′
- PCR Reaction Mix:
- 1X Reaction Buffer
- 0.2 mM dNTPs
- 0.40 µM of each primer
- 1.25 U Taq Polymerase
- 5 µL of extracted DNA template
- Nuclease-free water to 25 µL
- Thermocycling Conditions:
- Initial Denaturation: 94°C for 4 minutes.
- 35 Cycles of:
- Denaturation: 94°C for 1 minute.
- Annealing: 57°C for 1 minute.
- Extension: 72°C for 1 minute.
- Final Extension: 72°C for 10 minutes.
3. Analysis
- Run the PCR products on a 1.0% agarose gel. A positive result will show a band at ~1500 bp.
- The amplified DNA can be purified and sent for Sanger sequencing. The resulting sequence is identified by comparing it to known sequences in a database like NCBI BLAST [63].
This protocol is based on research that successfully "woke up" dormant Tersicoccus phoenicis from NASA cleanrooms [14].
1. Induction of Dormancy
- In a laboratory setting, the VBNC state can be induced in a bacterial culture by exposing it to prolonged nutrient starvation (e.g., suspending cells in phosphate-buffered saline) or other sub-lethal stresses.
2. Resuscitation Attempt
- Prepare culture media suitable for the target bacterium.
- Supplement the media with a purified Resuscitation-Promoting Factor (RPF) protein. This protein is a common lysozyme-like enzyme in actinobacteria that can kickstart cell wall metabolism and growth in dormant cells [14].
- Inoculate the RPF-supplemented media with the sample suspected to contain VBNC cells.
- Incubate under optimal growth conditions and monitor for culturability compared to a control plate without RPF.
Diagram Title: Strategies to Overcome the Culturability Dilemma
The Scientist's Toolkit: Key Research Reagents & Materials
| Item | Function/Brief Explanation |
|---|---|
| Universal 16S rRNA Primers | Allows amplification of a conserved gene region from a wide range of bacteria for molecular detection, bypassing the need for culturability [63]. |
| Resuscitation-Promoting Factor (RPF) | A bacterial cytokine-like protein that stimulates the cleavage of peptidoglycan in dormant cell walls, promoting resuscitation from the VBNC state [14]. |
| Bile Salts | An additive to culture media that acts as a swarming inhibitor, preventing colonies from merging and allowing for more accurate enumeration of certain Bacillus species [66]. |
| Anaerobe Jar or Chamber | Creates an oxygen-free environment essential for the growth of obligate anaerobic bacteria, which would otherwise be missed in standard aerobic culture [63]. |
| Digital Plating (PicoArray) Chip | A microfluidic device that partitions a sample into thousands of picoliter wells, enabling single-cell isolation and rapid, high-resolution analysis of mixed microbial communities [67]. |
| Viability Stains (e.g., PMA) | Chemical dyes that penetrate membrane-compromised dead cells. When used with PCR (PMA-qPCR), they can help distinguish DNA from live (VBNC) vs. dead cells [62]. |
Quantitative Data: Comparing Microbial Detection Methods
Table 1: Characteristics of Different Microbial Detection and Enumeration Techniques
| Method | Principle | Detection Target | Time to Result | Key Limitation |
|---|---|---|---|---|
| Aerobic Plate Count (APC) | Growth on solid medium | Culturable cells | 1-3 days [68] | Misses VBNC, anaerobes, fastidious bacteria [62] [63] |
| 16S rRNA PCR | DNA amplification | Bacterial DNA (viable & dead) | Several hours [63] | Does not prove viability; detects DNA from dead cells |
| Flow Cytometry | Light scattering/fluorescence | Total particles & viable cells (with stain) | < 1 hour [66] | Requires specialized equipment; does not differentiate species |
| Digital Plating (DP) | Growth in micro-confinement | Culturable & some VBNC cells | ~6-7 hours (E. coli) [67] | Emerging technology; may not be widely available |
Table 2: Impact of Replicate Plating on Counting Precision
| Number of Replicate Plates | 95% Confidence Interval for an Observed Mean of 100 CFU [65] | Error as % of Mean |
|---|---|---|
| 2 Plates | 70 - 130 | ± 30% |
| 3 Plates | 74 - 126 | ± 26% |
| 5 Plates | 79 - 121 | ± 21% |
| 10 Plates | 82 - 118 | ± 18% |
Diagram Title: Bacterial Dormancy and Recalcitrance Pathway
Frequently Asked Questions (FAQs)
Q1: What are the key bacterial factors that initiate the resuscitation of dormant cells? The resuscitation-promoting factor (Rpf) is a key bacterial protein that initiates the wake-up process. Rpf is an exoenzyme that cleaves β-(1,4) glycosidic bonds in bacterial peptidoglycan, facilitating the remodeling of the cell wall which is necessary for dormant cells to resume growth [69]. The muropeptides released during this hydrolysis may also act as signaling molecules that awaken closely related bacteria [69].
Q2: Why might my resuscitation assays be yielding low or inconsistent results? Low resuscitation yields can often be traced to suboptimal Rpf concentration or protein integrity. Research on Rpf from Micrococcus KBS0714 shows its effect is concentration-dependent, with a half-saturation constant (Ks) of 2.1 µM for maximum biomass yield [69]. Furthermore, site-directed mutations at conserved catalytic sites (like E54) or deletion of specific repeating motifs in a lectin-encoding linker region can significantly reduce or eliminate resuscitation activity [69]. Ensure your recombinant protein is functional and used at an effective concentration.
Q3: Beyond Rpf, what other methods can induce resuscitation? While Rpf is a major factor for Actinomycetota, other stimuli can also trigger resuscitation. For example, pyruvate and its analog, α-ketobutyrate, have been shown to have resuscitative effects on Salmonella enterica serovar Enteritidis that was compelled into a dormant state [70]. Simply providing a nutrient-rich medium after a period of starvation can also reverse a non-growing state, as seen in desert biocrust communities that resuscitated within minutes of simulated rain [71].
Q4: How can I definitively confirm the presence of viable dormant cells that are no longer culturable? Standard culture methods are insufficient. Instead, employ viability PCR techniques. One advanced method uses propidium monoazide (PMA) treatment combined with droplet digital PCR (ddPCR) [72]. PMA penetrates only membrane-compromised dead cells and binds DNA, preventing its amplification. The subsequent ddPCR then provides an absolute quantification of intact, viable cells—including those in the Viable But Non-Culturable (VBNC) state—without requiring an external standard curve [72].
Troubleshooting Guide
Potential Causes and Solutions:
Inadequate Resuscitation-Promoting Factor (Rpf)
- Cause: The concentration of Rpf may be below the effective threshold, or the protein may have lost activity.
- Solution: Titrate the Rpf concentration. Use recombinant Rpf in the micromolar range (e.g., 0-6 µM) and confirm protein integrity and activity via enzyme kinetics assays if possible [69].
Non-Responsive Bacterial Strains
- Cause: The spectrum of Rpf activity is not universal and can be phylogenetically constrained. The effect of Rpf from Micrococcus KBS0714 on resuscitation mapped onto strain phylogeny, which reflected core features of the cell envelope [69].
- Solution: Confirm that your target bacterium is responsive to the specific Rpf you are using. Consider using Rpf sourced from a closely related species or supplementing with other resuscitation stimuli like pyruvate [70].
Problem: Failure to Detect and Quantity Viable But Non-Culturable (VBNC) Cells
Potential Causes and Solutions:
- Reliance on Culture-Based Methods Only
- Cause: By definition, VBNC cells cannot form colonies on standard growth media, leading to false negatives.
- Solution: Implement culture-independent viability detection. The PMA-ddPCR protocol allows for direct quantification of viable cells, even in a complex matrix like mouse fecal samples [72].
- Workflow:
- Induce VBNC state: Treat cells with a stressor like ciprofloxacin [72].
- Treat with PMA: Optimize PMA concentration (e.g., between 5 µM and 200 µM) and incubation time (5-30 minutes) to ensure complete penetration into dead cells [72].
- Extract DNA and Perform ddPCR: Quantify viable cell load by targeting specific genes (e.g., rpoB for Klebsiella pneumoniae) [72].
Table 1: Key Quantitative Parameters for Rpf-Mediated Resuscitation (from Micrococcus KBS0714)
| Parameter | Value | Context / Significance |
|---|---|---|
| Enzyme Affinity (Km) | 1.8 mg/mL | High substrate affinity, allows catalysis at low peptidoglycan concentrations [69]. |
| Half-Saturation Constant (Ks) | 2.1 µM | Rpf concentration for half-maximal biomass yield [69]. |
| Lag Time Reduction | 37% (from 476 ± 27.1 h to 298 ± 3.4 h) | Rpf addition significantly shortens the delay before dormant populations enter exponential growth [69]. |
| Resuscitation with E54A Mutant | No effect | Mutation of catalytic site glutamic acid to alanine eliminates resuscitation [69]. |
| Resuscitation with E54K Mutant | Reduced by 40% | Mutation to a different charged amino acid diminishes, but does not eliminate, activity [69]. |
| Linker & LysM Domain Deletion | Activity reduced by >50% | Truncated Rpf fails to resuscitate, highlighting the importance of non-catalytic domains [69]. |
Table 2: Resuscitation Timeframes Across Different Bacterial Systems
| System / Organism | Resuscitation Timeframe | Key Finding |
|---|---|---|
| Desert Biocrust Community | Minutes to hours | Genome-resolved metatranscriptomics revealed nearly all microbial populations, regardless of taxonomy, began resuscitating within minutes of rehydration [71]. |
| High Alcohol-Producing K. pneumoniae | Quantifiable via PMA-ddPCR | The method directly counts viable cells during VBNC state formation and resuscitation, bypassing the need for culture [72]. |
Experimental Protocols
Detailed Protocol 1: Assessing Rpf Activity and Concentration Dependence
This protocol is adapted from studies on Rpf from Micrococcus KBS0714 [69].
- Prepare Dormant Cells: Use a bacterial culture in the late stationary phase (e.g., maintained for 90 days).
- Purify Recombinant Rpf: Express and purify Rpf from your target organism. Confirm activity using an enzyme kinetics assay with fluorescein-labeled peptidoglycan, measuring the fluorescence of hydrolyzed products [69].
- Resuscitation Assay:
- Transfer dormant cells to fresh, sterile growth medium.
- Add purified recombinant Rpf at a range of concentrations (e.g., 0 µM to 6 µM).
- Incubate under optimal growth conditions.
- Monitor Growth: Measure biomass (e.g., OD600) over time.
- Data Analysis:
- Fit biomass data to the Monod growth model to determine the half-saturation constant (Ks) and maximum biomass yield.
- Compare lag time, maximum growth rate (µmax), and yield between Rpf-treated and control cultures.
Detailed Protocol 2: Absolute Quantification of VBNC Cells Using PMA-ddPCR
This protocol is derived from work on Klebsiella pneumoniae [72].
- VBNC State Induction: Subject a bacterial culture to a stressor known to induce the VBNC state, such as incubation with ciprofloxacin or exposure to H2O2 [72].
- PMA Treatment Optimization:
- Take aliquots of the stressed culture.
- Treat with PMA at a range of final concentrations (e.g., 5 µM to 200 µM) and incubate in the dark for 5-30 minutes.
- Expose the tubes to bright light (e.g., a 500-W halogen light source for 5-10 minutes) to photo-activate the PMA, which cross-links to DNA in dead cells.
- DNA Extraction: Extract genomic DNA from the PMA-treated samples.
- Droplet Digital PCR (ddPCR):
- Prepare the ddPCR reaction mix using primers and probes targeting a conserved essential gene (e.g., rpoB).
- Generate droplets and run the PCR according to manufacturer protocols.
- Read the droplet plate to count the number of positive and negative droplets.
- Calculation: The ddPCR software provides an absolute concentration of target DNA copies per microliter of the original sample, representing the number of viable cells that were present.
Signaling Pathways and Workflows
The Scientist's Toolkit: Research Reagent Solutions
Table 3: Essential Reagents for Dormancy and Resuscitation Research
| Reagent / Material | Function / Application | Example & Notes |
|---|---|---|
| Recombinant Rpf | To experimentally initiate resuscitation in dormant cultures. | Purified from model organisms like Micrococcus KBS0714 [69]. Activity must be confirmed via enzyme assays. |
| Propidium Monoazide (PMA) | Viability dye for molecular detection. Penetrates only dead cells with compromised membranes, allowing differentiation from viable cells in downstream PCR [72]. | Concentration and incubation time require optimization (e.g., 5-200 µM for 5-30 min) [72]. |
| ddPCR / qPCR Reagents | For absolute quantification of viable cell load without culture, crucial for VBNC studies. | Targets essential single-copy genes (e.g., rpoB, adhE) [72]. |
| Ciprofloxacin / H2O2 | Chemical stressors to induce the VBNC state in laboratory cultures. | Used to create a model system for studying resuscitation [72]. |
| Fluorescein-labeled Peptidoglycan | Substrate for in vitro enzymatic assays to quantify Rpf muralytic activity. | Hydrolysis measured by fluorescence increase [69]. |
| Specialized Growth Media | To support the outgrowth of newly resuscitated, potentially fragile cells. | Composition should reflect the natural environment of the bacterium under study (e.g., soil extract media). |
Frequently Asked Questions (FAQs)
FAQ 1: What are the primary causes of matrix effects in biofilm imaging? Matrix effects in biofilm imaging arise from the complex physical and chemical structure of the biofilm itself. The extracellular polymeric substance (EPS) matrix, composed of polysaccharides, proteins, extracellular DNA, and lipids, acts as a dense physical barrier that can impede probe penetration [73]. This structure creates heterogeneous microenvironments with varying nutrient and oxygen gradients, which can quench signals, cause non-specific binding, and reduce the effective concentration of imaging probes at the target site [74] [73].
FAQ 2: How can I improve the specificity of my fluorescent probes for bacterial targets within a biofilm? Probe specificity is enhanced by selecting targeting moieties that bind to unique bacterial surface components. Antibody-based probes, such as the 1D9-680 which targets the immunodominant staphylococcal antigen A (IsaA), often provide higher specificity over antibiotic-based probes like Vanco-800CW, which may bind more broadly to cell wall components found in various Gram-positive bacteria [74]. For Pseudomonas aeruginosa biofilms, peptide-based probes such as 4Iphf-HN17 have demonstrated rapid labeling kinetics and high specificity in infection models [75]. Always validate probe specificity against your specific bacterial strain and biofilm conditions.
FAQ 3: What are the key differences between antibiotic-based and antibody-based probes? The choice between antibiotic-based and antibody-based probes involves a trade-off between specificity and penetration, as summarized in the table below.
Table 1: Comparison of Fluorescent Probe Types for Biofilm Imaging
| Probe Characteristic | Antibiotic-Based (e.g., Vanco-800CW) | Antibody-Based (e.g., 1D9-680) |
|---|---|---|
| Target | Peptidoglycan (Gram-positive bacteria) [74] | Immunodominant staphylococcal antigen A (IsaA) [74] |
| Specificity | Broader (binds to a class of bacteria) [74] | Higher (binds to a specific bacterial antigen) [74] |
| Penetration | Appears to penetrate deeper into biofilm matrix [74] | More surface-bound; may bind to actively growing bacteria [74] |
| Clearance & Background | Sleeper clearance; higher non-specific background signal at 24h post-injection [74] | Faster clearance from tissue; lower background in control animals [74] |
| Molecular Size | Smaller (vancomycin) [74] | Larger (full-size IgG1 antibody) [74] |
FAQ 4: My probe signal is weak despite a confirmed biofilm presence. What could be wrong? Weak signals can result from several factors. First, the biofilm's EPS matrix may be physically blocking probe access; consider using smaller probe molecules or pre-treating with matrix-dispersing agents. Second, the metabolic state of the bacteria is critical; many standard metabolic probes fail to detect dormant or persister cells. In such cases, use viability stains based on membrane integrity rather than activity [76]. Finally, optimize your imaging time point based on probe pharmacokinetics; for instance, the 1D9-680 probe showed optimal specific signal at 48 hours post-injection, after non-bound probe had cleared [74].
FAQ 5: How can I distinguish between live and dead bacteria in a biofilm during imaging? Accurately assessing viability within biofilms requires complementary techniques. Culture-based methods like CFU counting can underestimate viability due to the presence of Viable But Non-Culturable (VBNC) cells [76]. Fluorescent viability stains, such as the SYTO9/PI (propidium iodide) combination, are recommended. SYTO9 stains all cells, while PI only penetrates cells with compromised membranes, allowing differentiation between live (SYTO9+/PI-) and dead (SYTO9+/PI+) populations when analyzed via fluorescence microscopy or flow cytometry [76].
Troubleshooting Guides
Problem 1: High Background Fluorescence and Non-Specific Signal
Potential Causes and Solutions:
- Cause A: Inadequate Probe Clearance. The imaging was performed too soon after probe administration, and unbound probe is still circulating, creating background noise.
- Solution: Establish a time-course for imaging. For example, while a signal may be visible at 24 hours, imaging at 48 or 72 hours post-injection can allow for sufficient clearance of non-specifically bound probe, significantly improving the target-to-background ratio [74].
- Cause B: Probe Binding to Non-Target Components. The probe may be interacting with host tissue components or the abiotic substrate instead of the target bacteria.
- Solution: Include rigorous controls. Always run parallel experiments with sterile implants or uninfected animals to establish the level of non-specific background signal for your probe [74]. For in vitro work, include wells with growth medium and substrate but no bacteria.
Problem 2: Inconsistent or Low Signal from a Validated Probe
Potential Causes and Solutions:
- Cause A: Poor Probe Penetration. The dense biofilm matrix is preventing the probe from reaching its intracellular or surface target.
- Solution: Consider alternative probe designs. Smaller peptide-based probes (e.g., 4Iphf-HN17) or engineered fragments may offer better penetration than full-sized antibodies [75]. Furthermore, investigate the use of biofilm-disrupting agents as adjuvants to improve probe access.
- Cause B: Heterogeneous Metabolic Activity. The probe's target may be downregulated in dormant sub-populations or under the specific environmental conditions of your biofilm.
- Solution: Use a multiplexed staining approach. Combine your specific probe with a general nucleic acid stain (like SYTO) to identify all bacterial cells, and a membrane integrity stain (like PI) to assess viability. This helps determine if the signal loss is due to lack of probe access or true absence of the target [76].
Problem 3: Difficulty Detecting Dormant or VBNC Populations
Potential Causes and Solutions:
- Cause: Reliance on Metabolic Activity. Many standard probes and culture-based methods fail because dormant cells have low metabolic activity and do not divide.
- Solution: Implement methods that do not require bacterial growth.
- Flow Cytometry with Viability Stains: Use a combination of SYTO9 and PI to directly assess membrane integrity in single cells, which is a key indicator of viability independent of culturability [76].
- Target Dormancy-Associated Biomarkers: Develop or source probes that target specific markers of dormancy or stress responses, rather than active growth processes.
- Solution: Implement methods that do not require bacterial growth.
Experimental Protocols
Protocol 1: Evaluating Probe Specificity and Penetration in Biofilms
This protocol is adapted from studies comparing fluorescent probes for staphylococcal biofilms [74] and evaluating peptide-based probes [75].
Research Reagent Solutions:
- Bacterial Strain: e.g., Staphylococcus aureus (Xen36 for bioluminescence) or Pseudomonas aeruginosa for peptide probes.
- Fluorescent Probes: e.g., 1D9-680 (2-5 µM) or Vanco-800CW (2-5 µM) for S. aureus; 4Iphf-HN17-Cy5 (1-10 µM) for P. aeruginosa [74] [75].
- Growth Medium: Appropriate broth (e.g., TSB for S. aureus).
- Staining Buffer: Phosphate-buffered saline (PBS) or a minimal salts buffer.
- Microscopy Substrate: Glass-bottom dishes or borosilicate coverslips.
Methodology:
- Biofilm Cultivation: Grow biofilms on relevant substrates (e.g., borosilicate coverslips, plastic, or implant material) for 24-72 hours under static or flow conditions to achieve maturity [74].
- Probe Incubation: Dilute the fluorescent probe in staining buffer or fresh medium at the working concentration. Replace the growth medium in the biofilm wells with the probe solution. Incubate for a predetermined time (e.g., 1-4 hours) at the cultivation temperature [74] [75].
- Washing: Gently wash the biofilm three times with PBS to remove unbound probe. Critical Step: Standardize wash volume, time, and agitation to ensure reproducibility.
- Fixation (Optional): If required for subsequent analysis, fix biofilms with a mild fixative like 4% paraformaldehyde for 15-30 minutes, followed by additional washing.
- Imaging: Acquire images using confocal laser scanning microscopy (CLSM). Use consistent laser power and gain settings across all samples for quantitative comparison.
- Image Analysis: Quantify fluorescence intensity, biofilm coverage, and penetration depth using image analysis software (e.g., ImageJ, IMARIS).
Protocol 2: Flow Cytometry for Assessing Bacterial Viability and VBNC State
This protocol is adapted from flow cytometry studies used to confirm the absence of VBNC states after treatment [76].
Research Reagent Solutions:
- Bacterial Suspension: Planktonic culture or dispersed biofilm cells.
- Viability Stains: LIVE/DEAD BacLight Bacterial Viability Kit (SYTO9 and Propidium Iodide (PI)) or equivalent.
- Staining Buffer: Filter-sterilized PBS or 0.9% NaCl solution.
- Controls: Untreated live culture (SYTO9+), heat-killed culture (PI+).
Methodology:
- Sample Preparation: For biofilms, gently disaggregate using mild sonication or enzymatic treatment to create a single-cell suspension. Centrifuge and resuspend in staining buffer to a consistent density (e.g., ~10^6 CFU/mL) [76].
- Staining: Add SYTO9 and PI to the bacterial suspension according to the manufacturer's instructions. A typical ratio is 1:1 mixture of the two dyes, with 3 µL of dye mix per 1 mL of sample [76].
- Incubation: Incubate the stained suspension in the dark at room temperature for 15-30 minutes.
- Flow Cytometry Analysis: Analyze samples immediately using a flow cytometer.
- Use a 488 nm laser for excitation.
- Detect SYTO9 fluorescence in the FL1 (green, ~530 nm) channel.
- Detect PI fluorescence in the FL3 (red, >670 nm) channel.
- Collect a minimum of 10,000 events per sample.
- Gating Strategy:
- Create a dot plot of FSC-A vs. SSC-A to gate on the bacterial population.
- Create a dot plot of FL1 (SYTO9) vs. FL3 (PI). The populations can be defined as:
- Live/Intact (SYTO9+ PI-): High green, low red fluorescence.
- Dead/Damaged (SYTO9+ PI+): High green and high red fluorescence (PI displaces SYTO9).
- VBNC/Debris: May appear in other quadrants and require further validation [76].
The Scientist's Toolkit: Research Reagent Solutions
Table 2: Essential Reagents for Biofilm Penetration and Detection Studies
| Reagent | Function/Application | Example & Key Characteristics |
|---|---|---|
| Antibody-Based Probes | High-specificity labeling of surface antigens on target bacteria. | 1D9-680: Targets IsaA protein on S. aureus; high specificity, faster clearance [74]. |
| Antibiotic-Based Probes | Broader labeling of structural components of bacterial cell walls. | Vanco-800CW: Binds peptidoglycan in Gram-positive bacteria; good biofilm penetration but slower clearance [74]. |
| Peptide-Based Probes | Smaller size can improve penetration; can be engineered for specificity. | 4Iphf-HN17: Targets P. aeruginosa biofilms; rapid labeling, lack of bactericidal activity [75]. |
| Viability Stains (SYTO9/PI) | Differentiate live/dead bacteria based on membrane integrity; critical for VBNC studies. | LIVE/DEAD BacLight: SYTO9 stains all cells; PI stains only cells with compromised membranes [76]. |
| Enzymatic Dispersants | Partially break down EPS matrix to improve probe access without killing cells. | Dispersin B, DNase I: Target specific EPS components (polysaccharides, eDNA); used as pre-treatment [73]. |
| Flow Cytometry Controls | Essential for validating gating strategies and instrument settings in viability assays. | Heat-Killed Bacteria: Provide a PI-positive control. Untreated Log-Phase Culture: Provide a SYTO9-positive control [76]. |
Welcome to the Technical Support Center
This resource is designed to help researchers navigate the specific challenges of studying dormant and heterogeneous bacterial populations. The guides below provide solutions for common experimental problems, ensuring your research is robust and reproducible.
Frequently Asked Questions (FAQs)
Q1: Our team cannot reproduce the microbial diversity profiles from the same sample set. Where is the variability most likely introduced?
A1: Variability in microbial diversity profiles most frequently stems from two critical points in your workflow:
- DNA Extraction: The DNA extraction procedure is a significant source of variability. Different methods have varying efficiencies in lysing different cell types. For instance, Gram-positive bacteria with thicker cell walls are often underrepresented if the lysis method is not sufficiently rigorous [77].
- Bioinformatics Analysis: The choice of bioinformatics tools can dramatically alter results. A comparison of 11 tools for shotgun metagenomics found that the number of organisms identified could differ by up to three orders of magnitude [77].
- Troubleshooting Tip: Implement a mock microbial community as a control. This synthetic community with known ratios of bacteria, including both Gram-positive and Gram-negative species, allows you to benchmark your entire workflow, from DNA extraction to bioinformatics, and identify where bias is introduced [77].
Q2: How can we reliably detect dormant bacterial cells that might be evading standard culture and molecular methods?
A2: Detecting dormant cells requires moving beyond standard, growth-based methods.
- Resuscitation Promoters: Some dormant actinobacteria can be "woken up" using a resuscitation-promoting factor (RPF), a specific protein that stimulates metabolic activity and growth. This method was successfully used to confirm the dormancy of Tersicoccus phoenicis in NASA clean rooms [14].
- Advanced Physical Detection: For dormant spores, ultra-sensitive physical methods can be employed. Surface-Enhanced Raman Spectroscopy (SERS) uses gold nanorods and laser technology to amplify signals from unique chemical markers in spores, allowing detection at the single-molecule level [78].
- Troubleshooting Tip: If you suspect dormancy in a sample, split it and treat one part with a known RPF or a nutrient-rich resuscitation medium before performing your downstream analysis.
Q3: In large-scale, multi-batch studies, how can we distinguish true biological signals from technical artifacts and contamination?
A3: This is a common challenge in low-biomass microbiome research. A robust solution is a two-tiered strategy for contaminant identification [79]:
- Statistical Algorithm-Based Removal: Use tools like the
decontampackage in R to identify potential contaminants based on their higher frequency in negative controls or a negative correlation with sample DNA concentration [79]. - Data Structure Comparison: Compare the prevalence and abundance of taxa between batches. True biological signals should be relatively consistent, while reagent contaminants will often show high prevalence in one batch and low prevalence in another. This leverages between-batch variation to identify contaminants that algorithms might miss [79].
Troubleshooting Guides
Issue: Inconsistent Results When Scaling Up a Bioprocess
Problem: A fermentation process that performs well in a small, well-mixed bench-scale bioreactor shows lower yield and increased heterogeneity when scaled up to a production-scale vessel.
Root Cause: In large-scale bioreactors, poor mixing leads to environmental gradients (e.g., in nutrients, oxygen, pH). As cells circulate, they experience constantly changing conditions, which triggers a heterogeneous physiological response within the isogenic population [80].
Solution:
- Design Scale-Down Experiments: Simulate large-scale gradients in a small, controlled bioreactor system. This allows you to study the impact of oscillating conditions on cell physiology in a controlled environment [80].
- Implement Single-Cell Analytics: Use flow cytometry or microfluidic systems to monitor population heterogeneity, moving beyond averaged measurements that mask the underlying diversity [80].
- Adopt Heterogeneous Models: Shift from traditional homogeneous population models to newer frameworks like Population Balance Models (PBM) or Individual-Based Models (IBM), which can account for the distribution of properties across the cell population [80].
The following workflow diagram outlines the core strategy for investigating and resolving issues of heterogeneity and non-reproducibility in microbial studies:
Issue: Managing Heterogeneity in Pragmatic Trials or Multi-Center Studies
Problem: A pragmatic trial or multi-center observational study is designed to reflect real-world conditions, but the inherent heterogeneity in patients, centers, and interventions threatens the consistency and interpretability of the results.
Root Cause: By design, pragmatic studies welcome heterogeneity in patients, settings, and interventions to mimic real-world conditions, but this can introduce undesirable variability if not properly managed [81].
Solution:
- Planning (Design):
- Centers & Patients: deliberately recruit a variety of centers (e.g., community and university hospitals) and avoid overly restrictive patient selection criteria to ensure the population reflects the target audience [81].
- Intervention: Allow for some tailoring of the intervention to local contexts, but maintain a common core. Do not enforce strict adherence that would not occur in usual practice [81].
- Analysis:
- Primary Analysis: Favor the intention-to-treat principle to assess the effect of assigning the intervention in a real-world scenario [81].
- Subgroup Analysis: Limit planned subgroup analyses to those most relevant for clinical decision-making (e.g., by age, disease severity) and account for multiple comparisons [81] [82].
The Scientist's Toolkit: Key Research Reagent Solutions
The following table details essential materials for establishing reproducible protocols in dormancy and heterogeneity research.
| Item | Function & Application |
|---|---|
| Mock Microbial Community (e.g., ZymoBIOMICS Standard) | A synthetic community of known composition and abundance. Serves as a critical control to benchmark accuracy and identify bias in the entire workflow, from DNA extraction to sequencing and bioanalysis [77] [79]. |
| Resuscitation-Promoting Factor (RPF) | A protein that stimulates the awakening of dormant actinobacteria from a state of low metabolic activity. Used to confirm and study dormancy in bacterial populations [14]. |
| Gold Nanorods for SERS | Nanoparticles used in Surface-Enhanced Raman Spectroscopy (SERS) to dramatically amplify the spectroscopic signal from bacterial spores, enabling ultra-sensitive, culture-free detection [78]. |
| Flow Cytometry with Viability Stains | Techniques using dyes (e.g., LIVE/DEAD BacLight) in combination with flow cytometry to differentiate and quantify subpopulations of viable, injured, and dead cells in a heterogeneous sample [80]. |
| Electronic Lab Notebook (ELN) | Browser-based tools (e.g., protocols.io, Benchling) for recording, annotating, and publishing detailed experimental protocols. Ensures method details are preserved and shareable, enhancing reproducibility [83]. |
The table below summarizes key quantitative findings from the literature to inform your experimental design.
| Metric | Value | Context / Source |
|---|---|---|
| DNA Extraction Yield Variability | Up to 100-fold difference | Some DNA extraction protocols can recover up to 100 times more DNA than others, significantly skewing perceived microbial abundance [77]. |
| Bioinformatics ID Discrepancy | Up to 3 orders of magnitude | The number of organisms identified from the same data can differ by a factor of 1000 depending on the bioinformatics tool used [77]. |
| Contaminant Identification | 769 ASVs identified | A two-tiered strategy (algorithm + data structure) identified 769 contaminant amplicon sequence variants (ASVs) in a low-biomass milk microbiome study [79]. |
| SERS Sensitivity | Single-molecule level | The SERS method using gold nanorods can detect chemical signatures down to the level of individual molecules, making it suitable for detecting low concentrations of bacterial spores [78]. |
Within the broader scope of strategies for detecting dormant bacterial populations, a central challenge persists: accurately differentiating and quantifying various physiological states. Traditional DNA-based methods often overestimate the active microbial community by failing to distinguish between active, dormant, and dead cells [84]. This technical support article provides targeted troubleshooting guides and detailed protocols to help researchers correlate metabolic detection signals with specific dormancy levels, enabling more accurate assessment of the "metabolic depth" of bacterial populations.
Troubleshooting Guide: Detection of Dormant Bacteria
Table 1: Common Experimental Challenges and Solutions
| Problem | Possible Cause | Solution |
|---|---|---|
| No signal in activity assays | Cells in deep dormancy; insufficient metabolic activity [85] | Use longer incubation times; employ more sensitive detection methods (e.g., targeted trace gas analysis) [85]. |
| High DNA signal but no growth in culture | Presence of dead cells (relic DNA) or viable but non-culturable (VBNC) cells [8] [84] | Implement viability staining (e.g., PMA treatment) prior to DNA extraction to exclude relic DNA [84]. |
| Inconsistent resuscitation results | Unmet optimal awakening cues; stochastic revival [86] [87] | Standardize nutrient signals; ensure environmental conditions (pH, temperature) are stable and optimal [86] [84]. |
| Failure to induce dormancy | Lack of proper stressor or incorrect stressor application [8] | Calibrate stress induction (e.g., nutrient starvation, antibiotic exposure) using positive control strains. |
| Low signal-to-noise ratio in metabolic probes | Non-specific binding; background from growth media [85] | Include appropriate negative controls; optimize probe concentration and washing steps. |
Frequently Asked Questions (FAQs)
Q1: What is the fundamental difference between a dormant cell and a dead cell? A dormant cell is a viable but metabolically attenuated cell that can resume activity under favorable conditions. It maintains membrane integrity and a low level of essential metabolic processes. A dead cell has lost membrane integrity and cannot replicate [85] [8] [84]. Techniques like PMA treatment exploit this difference by selectively penetrating dead cells with compromised membranes [84].
Q2: Why do standard PCR-based methods overestimate the active microbial population? Standard DNA-based methods amplify DNA from all cells in a sample—active, dormant, and dead. This total DNA pool includes "relic DNA" from dead cells, which can constitute a significant fraction of the sequence richness, thereby inflating diversity estimates for the active community [84].
Q3: Can dormant cells sense their environment without waking up? Yes, recent research shows that even deeply dormant spores can monitor their environment. They use stored electrochemical potential, like a capacitor, to process information by integrating short-lived environmental signals before committing to resuscitation [87].
Q4: What are the main types of bacterial persisters? Persisters are broadly classified into three types based on their formation mechanisms. Type I (Triggered) form in stationary phase in response to environmental cues. Type II (Stochastic) arise randomly during all growth phases due to population heterogeneity. Type III (Specialized) exhibit persistence mechanisms specific to particular antibiotics, not necessarily linked to slow growth [8].
Q5: What is the "rare biosphere," and is it predominantly dormant? The "rare biosphere" refers to the large number of low-abundance bacterial taxa in a community. Studies have found that rare bacterial taxa are disproportionately active compared to common taxa, suggesting that microbial rank-abundance curves are dynamic and that the rare biosphere is not primarily composed of dormant cells [88].
Experimental Protocols for Physiological State Discrimination
Protocol 1: Triple Metabarcoding Approach (TMA) for Discriminating Active, Dormant, and Dead Populations
This protocol leverages the latest research to categorize microbial phylotypes into physiologically distinct fractions [84].
- Principle: Simultaneous metabarcoding of total environmental rRNA genes (rDNA), rRNA transcripts (rRNA), and DNA from viable cells (using PMA treatment) allows for the classification of amplicon sequence variants (ASVs) into active, dormant, and dead fractions.
- Workflow:
- Materials:
- Propidium Monoazide (PMA): A dye that crosses compromised membranes of dead cells and intercalates into DNA, rendering it insoluble and non-amplifiable upon light exposure [84].
- DNA/RNA Co-extraction Kit: For simultaneous isolation of nucleic acids.
- Reverse Transcription Kit: For synthesizing cDNA from rRNA templates.
- PCR Reagents and Primers: Targeting 16S/18S rRNA genes.
- High-Throughput Sequencer: e.g., Illumina MiSeq.
- Procedure:
- Split a homogenized environmental sample (e.g., water, sediment, biofilm) into three aliquots.
- For DNA-seq: Extract total DNA from the first aliquot using a standard kit.
- For RNA-seq: Extract total RNA from the second aliquot. Treat with DNase to remove genomic DNA contamination. Synthesize cDNA via reverse transcription.
- For PMA-seq: Treat the third aliquot with PMA according to manufacturer's instructions (incubate in dark, then expose to light). Subsequently, extract DNA.
- Amplify the target gene (e.g., 16S rRNA V4 region) from all three DNA/cDNA libraries using barcoded primers.
- Pool and sequence the libraries.
- Process sequences to generate ASVs.
- Classification: An ASV is considered:
- ACTIVE if detected in both DNA-seq and RNA-seq.
- DORMANT if detected in DNA-seq and PMA-seq, but not in RNA-seq.
- DEAD if detected in DNA-seq, but not in PMA-seq or RNA-seq [84].
This protocol is based on the discovery of specific sensor proteins that act as channels to revive dormant spores [86].
- Principle: Dormant spores remain in stasis until nutrient-sensing receptor channels in the membrane open in response to specific signals. This allows ion efflux (e.g., K⁺, Ca²⁺), which triggers the shedding of protective layers and metabolic reactivation. The "integrate-and-fire" mechanism can be monitored [86] [87].
- Workflow:
- Materials:
- Purified Spore Preparation: From Bacillus subtilis or other model species.
- Fluorescent Ion Indicators: e.g., Potassium-sensitive dyes (Thallium-sensitive dyes used as a K⁺ surrogate).
- Germinant Solution: Defined nutrients known to trigger awakening (e.g., L-alanine).
- Microfluidics System or Spectrofluorometer: For real-time monitoring of ion fluxes.
- Procedure:
- Load a purified spore suspension with a fluorescent ion indicator.
- Place the spores in a microfluidic chamber or cuvette and establish a baseline reading.
- Introduce pulses of sub-threshold germinant concentrations.
- Monitor fluorescence changes corresponding to ion efflux in real-time.
- Analyze the data to determine the "integration" pattern, where successive small inputs summate until a threshold is reached, triggering the "fire" response and full resuscitation [87].
Research Reagent Solutions
Table 2: Essential Reagents for Dormancy Research
| Reagent | Function & Application in Dormancy Research |
|---|---|
| Propidium Monoazide (PMA) | Viability dye; selectively binds DNA in dead cells with compromised membranes, allowing selective analysis of intact (dormant/active) cells [84]. |
| Resuscitation-Promoting Factor (Rpf) | Bacterial cytokine; a protein that stimulates the resuscitation of dormant cells, such as those of Micrococcus luteus and related actinobacteria like Tersicoccus phoenicis [14]. |
| SOC Medium | Nutrient-rich recovery medium; used to support the growth of transformed or resuscitating bacteria that are under stress [89]. |
| High-Affinity Hydrogenase Assay | Metabolic activity probe; measures consumption of atmospheric H₂, a trace gas used as an energy source by dormant, non-growing bacteria for maintenance metabolism [85]. |
| Fluorescent Ion Indicators/Dyes | Signal detection; used to monitor ion fluxes (e.g., K⁺) from spores during the early stages of resuscitation and environmental sensing [86] [87]. |
| Specific Germinants | Resuscitation triggers; defined nutrients (e.g., L-alanine) that bind to spore receptors to initiate the awakening process from dormancy [86]. |
Benchmarking Performance: Validating and Selecting the Right Detection Assay
In the relentless battle against bacterial infections, the emergence of dormant, antibiotic-tolerant bacterial persisters represents a formidable clinical challenge, directly contributing to chronic infections and post-therapeutic relapse [90]. Effectively detecting and characterizing these resilient subpopulations is paramount for developing next-generation therapeutic strategies. This endeavor relies heavily on diagnostic and research technologies, whose performance is quantified by the foundational metrics of sensitivity and specificity. Sensitivity measures a test's ability to correctly identify the presence of a target—in this case, dormant bacterial populations—while specificity measures its ability to correctly identify the target's absence [91]. The clinical and research implications of these metrics are profound; a test with low sensitivity risks missing true positives, allowing reservoirs of infection to persist, while low specificity can lead to false positives, prompting unnecessary or misguided treatments [91].
Understanding that these metrics are not static is crucial. A test's accuracy can vary significantly depending on the healthcare and research setting in which it is employed [92] [93]. A diagnostic assay may demonstrate one level of performance in a primary care setting (nonreferred care) and a different level in a specialized tertiary care center (referred care). A meta-epidemiological study found that for various diagnostic tests, the differences in sensitivity between nonreferred and referred settings ranged from -0.22 to +0.30, and specificity from -0.19 to +0.03, with no universal pattern governing the differences [93]. This variability underscores the necessity for a critical review of how sensitivity and specificity perform across the diverse platforms used in the critical field of persistent bacterial infection research.
Comparative Analysis of Diagnostic Test Performance Across Settings
Diagnostic test accuracy (DTA) is not an intrinsic property; it is profoundly influenced by the context in which the test is used. The spectrum of patients, the prevalence of the target condition, and the technical execution of the test can all vary between settings, leading to significant heterogeneity in reported sensitivity and specificity [92]. Recognizing this is essential for the accurate interpretation of research data and for making informed decisions when selecting diagnostic platforms for clinical trials or patient management related to bacterial persistence.
Quantitative Comparison of Test Performance
The following tables summarize the variations in sensitivity and specificity for different categories of diagnostic tests, as revealed by a meta-epidemiological study of systematic reviews [93].
Table 1: Variation in Accuracy for Signs, Symptoms, and Biomarker Tests
| Test Category | Specific Test/Target Condition | Sensitivity Difference (Nonreferred - Referred) | Specificity Difference (Nonreferred - Referred) |
|---|---|---|---|
| Signs & Symptoms | Test A | +0.03 | -0.12 |
| Test B | +0.30 | +0.03 | |
| Biomarkers | Test C | -0.11 | -0.01 |
| Test D | +0.21 | -0.19 |
Table 2: Variation in Accuracy for Questionnaire and Imaging Tests
| Test Category | Specific Test/Target Condition | Sensitivity Difference (Nonreferred - Referred) | Specificity Difference (Nonreferred - Referred) |
|---|---|---|---|
| Questionnaire | Patient Health Questionnaire | +0.10 | -0.07 |
| Imaging | Ultrasonography | -0.22 | -0.07 |
Interpreting the Variability
The data illustrates that performance differences are highly test-dependent and vary in both direction and magnitude. For instance, some tests showed markedly higher sensitivity in nonreferred settings (e.g., +0.30 for a signs/symptoms test), while others, like the imaging test, performed with much higher sensitivity in referred care (-0.22 difference) [93]. This lack of a universal pattern highlights that factors such as disease spectrum—where patients in referred settings often have more advanced or complicated diseases—and the technical expertise available in different settings can dramatically alter test outcomes [92] [93]. For researchers developing assays to detect bacterial persisters, this underscores the critical need to validate their methods in the specific context (e.g., in vitro models, animal infection models, or human clinical samples) where they will be ultimately deployed.
Technical Support Center: Troubleshooting Guides and FAQs
This section provides targeted guidance for researchers encountering challenges with sensitivity and specificity in their experiments aimed at detecting dormant bacterial populations.
Frequently Asked Questions (FAQs)
Q1: What is the fundamental relationship between sensitivity and specificity, and why is it challenging to optimize both simultaneously? Sensitivity and specificity share an inverse relationship; as sensitivity increases, specificity typically decreases, and vice versa [91]. This occurs because adjusting a test's cutoff point to be more inclusive (to catch more true positives) often results in also capturing more false positives, thereby reducing specificity. This trade-off is a central challenge in assay development for bacterial persisters, where the target is often a small, hard-to-detect subpopulation.
Q2: How does disease prevalence in my study population impact the predictive value of my test results? Disease prevalence, or the proportion of true positives in your population, has a direct and powerful impact on Predictive Values [91]. In a population with high disease prevalence (e.g., a clinical sample from a chronic infection site), a positive test result is more likely to be a true positive (higher Positive Predictive Value). Conversely, in a population with low prevalence (e.g., a screening context), a negative test result is more reliable (higher Negative Predictive Value). The formulas are:
- Positive Predictive Value (PPV)= True Positives / (True Positives + False Positives)
- Negative Predictive Value (NPV) = True Negatives / (True Negatives + False Negatives) [91]
Q3: My molecular detection assay for persisters is generating many false negatives. What are the primary areas I should investigate? A high rate of false negatives indicates a problem with assay sensitivity. Key areas to troubleshoot include:
- Sample Preparation: The lysis method may be inefficient for dormant cells, which can have tougher cell walls. Furthermore, the high background of host genomic DNA can inhibit the amplification of microbial targets [94].
- Insufficient Sample Volume: For low-titer targets like persisters, processing a larger sample volume (e.g., 5 ml of blood instead of 1 ml) can dramatically improve sensitivity by increasing the probability of capturing the target [94].
- Inhibition: The presence of PCR inhibitors in the sample matrix can lead to false negatives. Incorporating internal controls is essential to detect this.
Troubleshooting Guide: Low Sensitivity in Molecular Detection of Bacterial Persisters
Problem: The molecular assay (e.g., PCR/ESI-MS) fails to detect bacterial persisters that are known to be present, based on culture or other evidence.
Scope: This guide is designed for researchers using PCR-based methods to detect dormant bacteria in complex matrices like blood or biofilm samples.
Preparation & Safety: Always wear appropriate PPE. Ensure all reagents are nuclease-free to prevent degradation of genetic material.
| Problem | Possible Root Cause | Recommended Action & Diagnostic Steps |
|---|---|---|
| Low Signal/ High False Negatives | 1. Inefficient Cell Lysis: Dormant persister cells are metabolically inactive and can be more resistant to standard lysis protocols. | - Implement a mechanical lysis step, such as percussive beating with zirconium-yttrium beads, to ensure robust disruption of all cell types [94]. |
| 2. Low Target Abundance: The volume of sample processed is too small to capture the rare persister cells. | - Scale up the sample input volume (e.g., from 1 ml to 5 ml of whole blood) to improve sampling probability [94]. | |
| 3. PCR Inhibition/ Human DNA Interference: High levels of co-purified human genomic DNA can compete with and inhibit the amplification of microbial targets [94]. | - Optimize PCR formulations with higher primer and polymerase concentrations to tolerate high levels of human DNA [94]. - Use post-PCR analytical methods that selectively enrich for microbial amplicons. |
Experimental Protocols for Key Methodologies
Protocol: Enhanced Sample Preparation for PCR/ESI-MS from Whole Blood
This protocol, adapted from a study aiming to improve molecular detection of bloodstream infections, outlines a method to overcome the challenges of high human DNA background and low microbial titer, which are analogous to the challenges in detecting persisters [94].
Objective: To efficiently isolate total nucleic acids from a large volume of whole blood (5 ml) for subsequent sensitive molecular detection of bacterial targets.
Key Reagents and Materials:
- EDTA-treated whole blood
- Lysis buffer (e.g., 100 mM Tris solution with guanidinium thiocyanate and detergent)
- Zirconium-yttrium beads (0.2-mm, yttria-stabilized)
- Large-volume bead mill homogenizer
- Automated nucleic acid extraction system with silica-coated magnetic particles
- PCR master mix and broad-range bacterial primers
Methodology:
- Sample Lysis: Combine 5 ml of whole blood with 665 μl of lysis buffer and 3 g of zirconium-yttrium beads. Process using a bead mill homogenizer at high speed (e.g., 6.6 m/s) for three cycles of 90 seconds, with a 20-second dwell time between cycles [94].
- Clarification: Centrifuge the lysed sample at 3,220 × g for 5 minutes to pellet debris.
- Nucleic Acid Extraction: Transfer the supernatant to an automated DNA extraction system. Use a cartridge with silica-coated magnetic particles to bind nucleic acids, followed by wash steps and elution in a nuclease-free buffer.
- PCR Amplification: The eluate is transferred to a PCR plate pre-filled with a broad-panel primer mix and concentrated master mix. The PCR formulations should be optimized to withstand high levels of human DNA (up to ~12 μg per reaction) [94].
Protocol: Evaluating Nanomaterial-Based Eradication of Persisters
Objective: To assess the efficacy of antibacterial nanoagents in directly eliminating bacterial persisters.
Key Reagents and Materials:
- Caffeine-functionalized Gold Nanoparticles (Caff-AuNPs)
- ATP-functionalized Gold Nanoclusters (AuNC@ATP)
- ROS-generating hydrogel microspheres (e.g., MPDA/FeOOH-GOx@CaP)
- Mature bacterial biofilms (e.g., of S. aureus or P. aeruginosa)
- Standard microbiological culture equipment
Methodology:
- Persister Generation: Generate a population of persister cells by treating a stationary-phase bacterial culture with a high dose of a bactericidal antibiotic (e.g., a fluoroquinolone or aminoglycoside) for several hours, followed by washing to remove the antibiotic.
- Nanomaterial Treatment: Incubate the persister population or a mature biofilm with the nanomaterial of interest. For example:
- Viability Assessment: After treatment, serially dilute the samples and plate on nutrient agar to determine the number of colony-forming units (CFUs). A significant reduction (e.g., a 7-log reduction) in CFUs compared to the untreated control indicates successful eradication of persisters [90].
Visualization of Experimental Workflows
Molecular Detection of Bacterial Persisters
Nanoagent Strategies Against Persisters
The Scientist's Toolkit: Key Research Reagent Solutions
Table 3: Essential Materials for Research on Bacterial Persisters
| Research Reagent / Material | Function in Experimental Context |
|---|---|
| Caffeine-functionalized Gold Nanoparticles (Caff-AuNPs) | Disrupts mature biofilms and directly kills both planktonic and biofilm-associated Gram-positive and Gram-negative bacterial persisters through physical and chemical mechanisms [90]. |
| ATP-functionalized Gold Nanoclusters (AuNC@ATP) | Selectively enhances bacterial membrane permeability and disrupts outer membrane protein folding, leading to a dramatic reduction in persister cell populations [90]. |
| ROS-Generating Hydrogel Microspheres (MPDA/FeOOH-GOx@CaP) | Generates high levels of reactive oxygen species (ROS) in the acidic infection microenvironment, effectively eradicating persisters in contexts like prosthetic joint infections [90]. |
| Cationic Polymer PS+(triEG-alt-octyl) | A "wake-and-kill" agent that first reactivates dormant persisters by stimulating the electron transport chain, then disrupts bacterial membranes to cause cell lysis [90]. |
| Zirconium-Yttrium Beads & Bead Mill Homogenizer | Provides high-impact mechanical lysis for efficient disruption of bacterial and human cells in large-volume samples (e.g., 5 ml blood), ensuring release of nucleic acids for sensitive molecular detection [94]. |
| Silica-coated Magnetic Particles | Used in automated nucleic acid extraction systems to purify DNA from complex lysates, enabling downstream PCR analysis free of inhibitors [94]. |
| Broad-Range PCR Primers for Bacteria/Candida | Target conserved genomic sequences to amplify species-specific signatures from a vast spectrum of microbes, allowing for the identification of known and unexpected pathogens in a single assay [94]. |
For researchers investigating dormant bacterial populations, a significant challenge lies in bridging the gap between high-resolution single-cell observations and population-level, ecosystem-scale conclusions. Dormancy, a bet-hedging strategy where individual cells enter a reversible state of low metabolic activity, creates a "seed bank" that is critical for maintaining microbial diversity and determines community dynamics in future generations [88]. However, the inherent heterogeneity in a population where only a subset of cells is active at any given time complicates data interpretation. This technical guide outlines robust, correlative approaches to validate the findings from single-cell methodologies against population-level metrics, ensuring that insights into cellular mechanisms scale accurately to inform therapeutic and ecological models.
Core Concepts: Bridging Single-Cell and Population-Level Data
Why is this Correlation Necessary?
In studies of bacterial dormancy, techniques like single-cell RNA sequencing (scRNA-seq) can reveal the transcriptional state of individual cells, potentially identifying which are active and which are dormant. However, the population-level impact of this dormancy—such as its effect on overall community richness, resilience, and function—requires a different set of tools. Without correlating these data, you risk having detailed mechanistic insights that do not accurately predict population or ecosystem behavior.
Theoretical models indicate that the ability to enter and successfully emerge from dormancy has a strong, positive influence on species richness [88]. Furthermore, molecular surveys have shown that the proportion of dormant bacteria can account for up to 40% of taxon richness in nutrient-poor systems [88]. Validating your single-cell data against such population-level metrics confirms that your in vitro observations reflect biologically meaningful in vivo phenomena.
Key Population-Level Metrics for Validation
When working with dormant bacterial populations, specific quantitative metrics are essential for grounding your single-cell data. The table below summarizes the key metrics and their significance.
Table 1: Key Population-Level Metrics for Validating Dormancy Studies
| Metric Name | Description | What It Validates | Typical Tool/Method |
|---|---|---|---|
| sc-UniFrac Distance | A statistical framework to quantify compositional diversity in cell populations between single-cell transcriptome landscapes [95]. | Quantifies the significance of population structure shifts (e.g., after a resuscitation trigger). | sc-UniFrac pipeline [95]. |
| Active vs. Total Community Composition | The comparison between potentially active (rRNA) and total (rDNA) community profiles [88]. | Identifies the dormant fraction of the community; decouples the "seed bank" from the active population. | rRNA vs. rDNA community fingerprinting. |
| Taxon Richness Contribution | The proportion of total microbial diversity made up by dormant taxa [88]. | Confirms the role of dormancy in maintaining biodiversity, especially in low-nutrient conditions. | Molecular survey and diversity indexing. |
| Resuscitation Rate | The rate at which dormant cells (spores) return to active life following an environmental cue [86]. | Measures the responsiveness and heterogeneity of the dormant population. | Germination assays, time-series tracking. |
Experimental Protocols for Correlation
Protocol 1: Using sc-UniFrac to Quantify Population Shifts
Purpose: To statistically determine if the cell population structures in your control versus treated samples (e.g., before and after a resuscitation cue) are significantly different [95].
Methodology:
- Sample Preparation: Generate scRNA-seq data for all conditions (e.g., dormant state and post-resuscitation state).
- Data Integration: Combine the transcriptome profiles of single cells from all datasets into a unified analysis.
- Hierarchical Clustering: Build a hierarchical tree from clustering the combined transcriptome data. The goal is to discern data structure, not to define rigid cell groups.
- Distance Calculation: Calculate the sc-UniFrac distance, which weights the relative abundance of samples assigned to each branch of the tree and the branch length (distance between cluster centroids).
- Statistical Testing: Perform a permutation test by randomizing sample labels to calculate the statistical significance of the observed sc-UniFrac distance. A significant p-value indicates that the population structures are different.
- Branch Identification: Identify specific branches (cell subpopulations) in the tree that show significant, non-random proportional shifts between conditions. These are the cell populations driving the difference.
Protocol 2: Differentiating Active and Dormant Fractions via rRNA:rDNA Ratio
Purpose: To empirically determine what fraction of your total bacterial community is composed of active versus dormant cells [88].
Methodology:
- Parallel Sampling: Extract both DNA and RNA from the same environmental or lab sample.
- Molecular Analysis:
- Use DNA to perform sequencing or fingerprinting of a phylogenetic marker gene (e.g., 16S rDNA). This characterizes the total community (active + dormant).
- Use RNA (reverse-transcribed to cDNA) to perform the same analysis on the same marker gene. Since ribosomes are required for protein synthesis, rRNA represents the active community.
- Data Correlation: Compare the composition of the active (rRNA) and total (rDNA) communities.
- Tight Coupling: If the active and total communities are similar, it suggests most present cells are active.
- Decoupling: A significant difference (e.g., MRPP, P < 0.001) indicates that the active taxa are only a subset of the total community, implying a substantial dormant fraction [88].
Troubleshooting Guides & FAQs
FAQ 1: My single-cell data shows heterogeneity, but my population-level metrics appear static. Why is there a disconnect?
- Potential Cause: Technical noise or batch effects in the single-cell data can be misinterpreted as biological heterogeneity.
- Solutions:
- Employ Batch Correction: Use algorithms like Combat, Harmony, or Scanorama to integrate datasets and remove systematic technical variation [96].
- Validate with Replicates: Ensure your findings are consistent across biological and technical replicates.
- Use Control Spikes: If possible, use control cells of a known type to calibrate your measurements.
- Check Data Quality: Adhere to strict quality control measures, assessing cell viability, library complexity, and sequencing depth [96].
FAQ 2: How can I distinguish true dormant cells from dead cells or technical dropouts in my scRNA-seq data?
- Potential Cause: scRNA-seq suffers from "dropout events," where transcripts fail to be captured or amplified, creating false negatives that can resemble the low transcriptional profile of a dormant cell [96].
- Solutions:
- Leverage Population Context: Use metrics like the rRNA:rDNA ratio on a bulk sample from the same population to confirm the presence of a dormant fraction. If the bulk data shows a dormant seed bank, the low-activity cells in your single-cell data are more likely to be dormant.
- Use Viability Markers: Incorporate live/dead staining or viability PCR in your experimental design.
- Computational Imputation: Use statistical models and machine learning algorithms to impute missing gene expression data and distinguish technical zeros from biological zeros [96].
- Look for Dormancy Signatures: Actively search for known genetic markers of dormancy and sporulation (e.g., specific sensor proteins [86]) in the low-activity cells.
FAQ 3: I have identified a potential "resuscitation trigger" for my dormant bacteria. How can I validate its effect at the population level?
- Solution:
- Measure Resuscitation Kinetics: At the population level, apply the trigger and use growth assays (e.g., OD600), colony-forming unit (CFU) counts, or flow cytometry to track the increase in active cells over time.
- Correlate with Molecular Cues: Simultaneously, use the rRNA:rDNA protocol to confirm the molecular shift from a dormant to an active community profile.
- Quantify the Population Shift: Use the sc-UniFrac pipeline to statistically compare single-cell landscapes from pre- and post-trigger samples. A significant sc-UniFrac distance will confirm the population structure has changed [95].
Essential Research Reagent Solutions
The following table details key reagents and materials critical for experiments in this field.
Table 2: Key Research Reagents for Studying Dormant Bacterial Populations
| Reagent / Material | Function / Application | Technical Notes |
|---|---|---|
| SMART-Seq Kits | Single-cell RNA-seq for full-length transcriptome analysis. | Optimized for low RNA input; ideal for capturing the minimal transcriptome of dormant cells [97]. |
| Unique Molecular Identifiers (UMIs) | Oligonucleotide tags used to correct for amplification bias in scRNA-seq [96]. | Critical for accurate quantification of transcript numbers in single cells, reducing technical noise. |
| Viability PCR Reagents | Dye-based assays (e.g., propidium monoazide) that selectively penetrate dead cells. | Helps differentiate between dormant (viable but non-culturable) and dead cells in a population. |
| Fluorescence-Activated Cell Sorting (FACS) Buffer | An EDTA-, Mg2+-, and Ca2+-free buffer for resuspending cells during sorting [97]. | Prevents interference with downstream enzymatic reactions like reverse transcription in scRNA-seq. |
| Germinant Compounds | Specific nutrients (e.g., sugars, amino acids) that trigger spores to exit dormancy [86]. | Used in resuscitation assays to test the responsiveness and heterogeneity of dormant populations. |
Visualizing Workflows and Signaling Pathways
Diagram 1: Bacterial Spore Germination Signaling Pathway
Diagram 2: Experimental Workflow for Data Validation
Dormancy is a widespread survival strategy employed by bacteria to withstand hostile conditions, such as nutrient starvation, antibiotic pressure, and rigorous sterilization procedures [98] [9]. In this state, microbes enter a reversible state of reduced metabolic activity, allowing them to persist undetected before resuscitating when conditions improve [14] [9]. This capability poses significant challenges for public health, food safety, and planetary protection, as standard detection methods often fail to identify these dormant cells [99] [100]. This case study, framed within broader thesis research on detecting dormant bacterial populations, explores successful strategies for identifying these elusive pathogens. We will examine specific detection methodologies, provide detailed troubleshooting guides for common experimental challenges, and highlight key reagent solutions to aid researchers and scientists in this critical field.
Case Studies in Pathogen Detection
Clinical Setting: Detection of DormantMycobacterium tuberculosis
Mycobacterium tuberculosis, the causative agent of tuberculosis, is a prime example of a pathogen that leverages dormancy to establish chronic infections. Its ability to enter a quiescent state allows it to resist immune attacks and endure prolonged antibiotic therapy [98].
Experimental Protocol for Studying M. tuberculosis Dormancy:
- Induction of Dormancy: Use the Wayne model of hypoxia-induced dormancy. Grow M. tuberculosis culture in a sealed container with slow, controlled stirring to create microaerophilic and eventually anaerobic conditions. Monitor the oxygen depletion spectrophotometrically by observing the reduction of a methylene blue indicator [98].
- Detection of Dormancy Markers:
- Triglyceride Accumulation: Stain dormant cells with lipophilic dyes (e.g., Nile Red) and visualize lipid inclusions using fluorescence microscopy. This correlates with the redirection of acetyl-CoA from the TCA cycle into lipid synthesis, a hallmark of the dormancy response [98].
- Transcriptional Analysis: Perform RT-PCR to detect upregulation of the DosRST regulon, a genetic program activated in response to hypoxia and other stresses, leading to growth arrest and triglyceride synthesis [98].
- Resuscitation Assay: Add a resuscitation-promoting factor (RPF), such as that derived from Micrococcus luteus, to the dormant culture. Monitor the culture for a return to active growth using turbidity measurements (OD600) and colony-forming unit (CFU) counts on agar plates [14] [98].
Diagram: Signaling Pathway for M. tuberculosis Dormancy
Industrial Setting: Detection of a Novel Dormant Bacterium in NASA Clean Rooms
NASA's spacecraft assembly clean rooms are among the most sterile environments on Earth, yet they harbor resilient microorganisms that threaten planetary protection. University of Houston researchers investigated Tersicoccus phoenicis, a rare bacterium found in these facilities, revealing its ability to "play dead" to survive [14].
Experimental Protocol for Detecting and Resuscitating T. phoenicis:
- Sample Collection: Swab surfaces in spacecraft clean rooms using standardized sterile protocols. Transfer samples to nutrient-deficient buffer solutions to maintain the dormant state during transport [14].
- Failed Cultivation Attempts: Inoculate samples onto standard rich culture media (e.g., Tryptic Soy Agar). Observe a lack of growth after standard incubation periods, indicating the presence of non-growing, dormant cells or VBNC states [14] [99].
- Genetic Identification: Extract total DNA directly from the environmental sample. Perform broad-range PCR targeting the 16S ribosomal RNA (rDNA) gene. Sequence the PCR product and compare it to genetic databases to identify the novel actinobacterium, Tersicoccus phoenicis [14] [99].
- Resuscitation and Detection: Suspend the environmental sample in a minimal nutrient medium. Add a purified Resuscitation-Promoting Factor (RPF) protein. Incubate the culture and monitor for growth via turbidity and CFU counts, confirming the cells were dormant but viable [14].
Food Industry Setting: Ultra-Sensitive Detection of Bacterial Spores
Bacterial spores are a highly resistant form of dormancy that poses a major risk to food safety and healthcare. Researchers at Umeå University developed a novel, ultra-sensitive method for detecting spores, such as those from Bacillus species, which can contaminate dairy products [78] [101].
Experimental Protocol for SERS-Based Spore Detection:
- Sample Preparation: Concentrate bacterial spores from a contaminated food sample (e.g., milk) using centrifugation. Resuspend the spore pellet in a purified water or buffer solution [78].
- SERS Substrate Preparation: Synthesize or acquire gold nanorods to be used as the Surface-Enhanced Raman Spectroscopy (SERS) substrate. These nanorods amplify the Raman signal dramatically [78].
- Spore Detection: Mix the spore sample with the gold nanorod suspension. Apply a laser source to the mixture. The laser interacts with the unique molecular structure of the spore coat (e.g., calcium dipicolinate), causing Raman scattering. Capture the resulting SERS spectrum, which acts as a molecular fingerprint for the spore [78].
- Analysis: Identify the specific spore by matching the acquired SERS spectrum against a library of known spectral signatures. This method allows for the detection of spores at incredibly low concentrations, even down to individual molecules [78].
Diagram: SERS Workflow for Spore Detection
The Scientist's Toolkit: Research Reagent Solutions
Table 1: Essential Reagents for Dormancy Research
| Reagent/Material | Function in Experiment | Example Application |
|---|---|---|
| Resuscitation-Promoting Factor (RPF) | A bacterial cytokine that reactivates dormant cells by stimulating peptidoglycan cleavage and growth resumption [14]. | Resuscitation of Tersicoccus phoenicis and other Actinobacteria [14]. |
| Gold Nanorods | A nanostructured material that acts as a substrate for Surface-Enhanced Raman Spectroscopy (SERS), amplifying the Raman signal from target molecules [78]. | Ultra-sensitive detection of bacterial spores via SERS fingerprinting [78]. |
| Broad-Range 16S rDNA Primers | PCR primers that bind to conserved regions of the bacterial 16S ribosomal RNA gene, allowing amplification and identification of novel or uncultivated bacteria [99]. | Genetic identification of Tersicoccus phoenicis directly from clean room samples [14]. |
| Dormancy Marker Dyes (e.g., Nile Red) | Fluorescent dyes used to stain and visualize intracellular accumulations, such as lipid bodies, that are characteristic of the dormant state [98]. | Detection of triglyceride storage in dormant M. tuberculosis and Vibrio cholerae [98]. |
| Hibernation Factor Antibodies | Antibodies specific to proteins (e.g., ribosome-associated factors) that bind and protect essential cellular machinery during dormancy [9]. | Studying molecular mechanisms of dormancy and developing inhibition strategies. |
Troubleshooting Guides and FAQs
FAQ 1: Why do my standard culture methods consistently fail to detect known pathogens in my samples?
Answer: This is a classic indicator of microbial dormancy. Many bacteria, including pathogens, can enter a state known as "viable but non-culturable" (VBNC) or quiescence under stress [9] [100]. In this state, their metabolic activity is so low that they cannot grow on standard culture media, effectively "playing dead" to evade detection [14]. Standard methods are biased toward rapidly growing organisms, while an estimated 60% of microbial biomass on Earth exists in a quiescent state [98].
Troubleshooting Guide:
- Problem: Suspected VBNC cells are not resuscitating with nutrient supplementation.
- Solution: Incorporate Resuscitation-Promoting Factors (RPFs) into your culture medium. These bacterial cytokines are essential for reactivating dormant Actinobacteria and other phylogenetically related organisms [14].
- Problem: Unable to detect any microbial signature, even from dormant cells.
- Solution: Bypass cultivation entirely. Use culture-independent molecular methods. Extract DNA directly from the sample and perform broad-range 16S rDNA PCR to identify the total microbial community present, including uncultivable members [99].
FAQ 2: My molecular method (e.g., PCR) is detecting bacterial DNA, but my viability assays confirm the cells are dead. How is this possible?
Answer: This discrepancy often arises because DNA can persist in the environment long after a cell has died. A positive PCR signal alone does not confirm the presence of live, potentially hazardous organisms [102]. It is crucial to distinguish between relic DNA and DNA from viable cells.
Troubleshooting Guide:
- Problem: PCR is positive, but are the cells viable?
- Solution 1: Use vital stains (e.g., propidium monoazide or PMA) that penetrate only membrane-compromised dead cells and intercalate into their DNA, rendering it unamplifiable by PCR. Subsequent PCR will then only amplify DNA from intact, viable cells [102].
- Solution 2: Employ RNA-based detection. Messenger RNA (mRNA) has a very short half-life. Detecting pathogen-specific mRNA via Reverse-Transcriptase PCR (RT-PCR) is a strong indicator of metabolic activity and viability [102] [100].
FAQ 3: My target pathogen is a spore-former. How can I improve the sensitivity of my detection to prevent contamination outbreaks?
Answer: Bacterial spores are notoriously resistant and can be present in very low numbers initially, making them difficult to detect before they germinate and cause contamination. Traditional culture methods are often too slow or not sensitive enough [78].
Troubleshooting Guide:
- Problem: Need to detect low concentrations of spores with high sensitivity.
- Solution: Implement Surface-Enhanced Raman Spectroscopy (SERS). This method uses metal nanoparticles (e.g., gold nanorods) to amplify the unique vibrational signature of spore coat components, allowing detection down to the single-spore level, far surpassing the sensitivity of traditional methods [78].
- Problem: Require rapid, on-site spore detection in an industrial setting.
- Solution: Develop a biosensor incorporating SERS technology or nucleic acid-based methods like loop-mediated isothermal amplification (LAMP), which allows for rapid amplification of DNA at a constant temperature, facilitating field deployment [102].
Comparative Analysis of Detection Methods
Table 2: Comparison of Pathogen Detection Methodologies
| Method Type | Principle | Advantages | Limitations | Ability to Detect Dormant Pathogens |
|---|---|---|---|---|
| Culture-Based | Growth of bacteria on nutrient media to form visible colonies [102]. | Considered the "gold standard"; confirms viability; cost-effective [102] [100]. | Lengthy (days to weeks); fails for VBNC and uncultivable organisms [14] [99] [102]. | Poor. Dormant cells will not grow on standard media without specific resuscitation signals [14]. |
| Immunoassays (e.g., ELISA) | Antigen-antibody binding for detection [103] [100]. | Relatively fast; suitable for toxin detection [103] [100]. | May lack sensitivity; depends on antibody specificity; does not confirm viability [103]. | Variable. May detect antigens from dormant cells, but cannot confirm their viability or potential for resuscitation. |
| PCR-Based | Amplification of specific DNA sequences [102] [100]. | High sensitivity and specificity; rapid compared to culture [102]. | Does not differentiate between live/dead cells; requires specialized equipment and training [102]. | Good. Can detect genetic material from dormant cells, especially when combined with viability stains (PMA-PCR) [102]. |
| Next-Generation Sequencing (NGS) | Massively parallel sequencing of all DNA in a sample [102] [100]. | Comprehensive, culture-independent view of entire microbiome [99] [102]. | High cost; complex data analysis; does not confirm viability [99] [102]. | Good. Can identify the genetic potential for dormancy and discover novel, uncultivable dormant pathogens [99]. |
| SERS Biosensors | Amplification of molecular vibrational signals on a metallic nanostructure [78]. | Ultra-sensitive (single molecule); rapid; can be tailored for on-site use [78]. | Early stages of development; requires a library of spectral signatures for identification [78]. | Excellent for Spores. Directly detects the unique, hardy molecular structures of dormant spores [78]. |
The successful detection of dormant pathogens requires a paradigm shift from traditional, growth-dependent methods to a more nuanced, multi-faceted approach. As demonstrated in the cases of M. tuberculosis in clinical settings, Tersicoccus phoenicis in controlled clean rooms, and bacterial spores in the food industry, overcoming the challenge of dormancy involves leveraging molecular biology, biophysics, and biochemistry. Key strategies include the use of resuscitation factors to stimulate growth, sophisticated instrumentation like SERS for ultra-sensitive detection, and genetic tools to identify uncultivable organisms. The troubleshooting guides and reagent toolkit provided here offer a practical framework for researchers to refine their experimental designs. As we deepen our understanding of microbial dormancy, the development of rapid, sensitive, and viability-based detection technologies will be paramount for safeguarding human health, ensuring food safety, and protecting our biosphere.
Frequently Asked Questions (FAQs)
FAQ 1: What are the primary computational challenges when integrating different types of omics data? A major challenge is managing the high dimensionality and heterogeneous nature of multi-modal data. Each data type (e.g., genomics, transcriptomics) has different scales, distributions, and statistical properties. Successful integration requires robust normalization methods and advanced machine learning models, such as deep generative models, that can learn a shared representation from these disparate data modalities without requiring extensive feature selection [104]. Scalable computational infrastructure is also critical for handling the massive data volumes [105].
FAQ 2: How can I validate that my integrated model has accurately captured biological relationships and not just technical noise? Performance should be assessed using multiple metrics. Key strategies include evaluating the model's data reconstruction performance on held-out test sets of cells to ensure it captures underlying patterns [104]. Furthermore, you should validate that the model can make accurate cross-modality predictions (e.g., predicting chromatin accessibility from gene expression) [104]. Finally, for biological relevance, the model's outputs (e.g., identified cell clusters or features) should be examined against known biological knowledge or through experimental validation.
FAQ 3: My multi-omics model performs well on training data but generalizes poorly to new datasets. What could be the cause? Poor generalization often stems from batch effects or other technical variations between datasets. To address this, use models that can explicitly account for and disentangle technical covariates (like sample batch) from the biological signal of interest. Some models, like multiDGD, employ a covariate latent model that learns a separate representation for technical effects, which can improve generalization and allow for better integration of new data without retraining [104].
FAQ 4: What is the advantage of a multimodal approach over single-modality analysis for studying dormant bacterial populations? A single-modality analysis (e.g., 16S rRNA sequencing) can only reveal changes in bacterial taxonomy. A multimodal approach that integrates data on taxonomy, encoded functions (shotgun sequencing), and metabolite outputs (metabolomics) can provide a causal understanding. For example, it can show not only that protective Clostridiales are depleted, but also that this leads to a loss of genes for synthesizing bacteriostatic short-chain fatty acids (SCFAs), which in turn allows for the expansion of opportunistic pathogens [106]. This holistic view is essential for identifying mechanistic drivers of dormancy and reactivation.
Troubleshooting Guides
Issue 1: Inadequate Integration and Joint Representation of Multi-Modal Data
Problem: After integrating genomics, transcriptomics, and phenotypic data, the resulting joint representation fails to reveal meaningful biological clusters or relationships, making it difficult to draw insights.
Solution:
- Recommended Model: Employ a deep generative model like multiDGD, which is specifically designed for multi-omics data. It uses a Gaussian Mixture Model (GMM) as a latent prior, which excels at capturing clustered data structures naturally found in biological cell types or states [104].
- Implementation: Use multiDGD to learn a joint representation of your paired data (e.g., transcriptome and chromatin accessibility). The model's probabilistic framework helps in learning a well-clustered, shared latent space without the need for extensive feature selection, even when dealing with highly dimensional data like chromatin accessibility [104].
- Verification: Check the model's performance on data reconstruction tasks for held-out cells. A model that has effectively integrated the data will show high accuracy in reconstructing the original input features [104].
Issue 2: Failure to Identify Meaningful Causal Links Between Molecular Features
Problem: The analysis identifies correlations between different data types (e.g., a peak in chromatin accessibility and a gene's expression) but cannot distinguish causal regulatory relationships from mere association.
Solution:
- Methodology: Leverage the learned representations of a trained multi-omics model for in silico perturbation. Models like multiDGD can be used to perform a "gene-to-peak" analysis.
- Protocol:
- Train the multiDGD model on your paired scRNA-seq and scATAC-seq data until it converges.
- In the learned latent representation, systematically perturb the value of a specific gene.
- Observe the model's predictions for changes in the accessibility of regulatory peaks across the genome.
- Peaks that show significant changes in predicted accessibility are likely to be statistically associated with the perturbed gene, providing a stronger basis for hypothesizing a regulatory relationship [104].
- Alternative Approach: Apply multivariate machine learning approaches to study the "interactome"—the network of interactions between different modalities (e.g., bacteria and their metabolic products). This can reveal how shifts in one modality (loss of a bacterium) drive changes in another (reduction of a metabolite), which can be linked to a clinical outcome like GVHD [106].
Issue 3: Inability to Differentiate Pathogens or Bacterial States with High Accuracy
Problem: A model trained to differentiate between bacterial states or species (e.g., dormant vs. active) achieves low diagnostic accuracy, leading to misclassification.
Solution:
- Strategy: Develop a Multimodal Integration (MMI) pipeline that combines multiple data types, such as clinical text, laboratory results, and imaging data (e.g., CT scans). The synergy of data types significantly boosts performance compared to unimodal models [107].
- Implementation Steps:
- Feature Extraction: Use specialized deep learning models for each modality. For example, use a BERT model to extract features from clinical text notes and a Swin-Transformer model to extract spatial features from CT scan images [107].
- Feature Fusion: Integrate the extracted features using an attention-based architecture. This architecture amalgamates unimodal feature spaces into a unified representation, allowing the model to capture intricate relationships and leverage complementary information [107].
- Validation: Rigorously test the MMI system on an internal validation set and an external dataset from a different institution to ensure robustness and generalizability [107].
Issue 4: Scalability and Data Management Problems with Large Multi-Modal Datasets
Problem: The computational infrastructure becomes a bottleneck when storing, processing, and analyzing large-scale multi-omics and phenotypic data.
Solution:
- Architecture: Implement a cloud-based data lake architecture, such as the guidance provided for AWS.
- Key Components and Workflow:
- Data Ingestion & Storage: Use scalable object storage (e.g., Amazon S3) as the central data lake for raw genomic, clinical, and imaging data [105].
- Data Transformation: Utilize serverless ETL (Extract, Transform, Load) services (e.g., AWS Glue) to clean, prepare, and catalog the data. This makes the data ready for large-scale analysis [105] [108].
- Analysis & Querying: Leverage specialized services for genomic data (e.g., Amazon HealthOmics) and interactive SQL querying (e.g., Amazon Athena) to run analyses without managing servers [105] [109].
- Cost Optimization: Use serverless technologies that scale on-demand, so you only pay for the resources you use. You can further optimize costs by stopping notebook instances when not in use [105].
Experimental Protocols for Key Methodologies
Protocol 1: Building a Multimodal Integration (MMI) Pipeline for Pathogen Differentiation
This protocol outlines the procedure for developing an AI-powered MMI system to accurately diagnose different types of pulmonary infections, as demonstrated in [107].
1. Data Collection and Cohort Definition:
- Assemble a large, real-world dataset from hospital systems. The study in [107] used 161,258 chest CT scans from 54,581 patients, linked with clinical information and laboratory results.
- Define clear patient subsets for specific prediction tasks (e.g., primary infection prediction, pathogen subtyping, severe outcome prediction).
2. Multimodal Feature Extraction:
- Clinical Text Feature Extraction: Process clinical medical records (e.g., chief complaints, demographics) using a pre-trained BERT (Bidirectional Encoder Representations from Transformers) model to generate dense feature vectors [107].
- CT Image Feature Extraction: Process chest CT scans using a Swin-Transformer network, a hierarchical vision transformer that efficiently captures spatial features and findings from the images [107].
- Laboratory Data: Incorporate structured laboratory test results as part of the clinical feature set.
3. Feature Fusion and Model Training:
- Integrate the extracted clinical/textual and image features using an attention-based architecture. This architecture amalgamates the unimodal features into a unified, shared representation [107].
- Train a classifier on this joint representation to perform the target task (e.g., differentiate between bacterial, fungal, and viral pneumonia).
4. Model Validation:
- Perform rigorous internal validation using a held-out test set from the same institution.
- Conduct external validation on a dataset from a completely separate institution to assess model robustness and generalizability [107].
Protocol 2: Multi-Omic Microbiome Analysis for Association with Host Conditions
This protocol details the steps for a multimodal microbiome study to identify microbial features linked to post-transplant complications, as performed in [106].
1. Multi-Omic Data Generation from Samples:
- Collect longitudinal samples (e.g., fecal samples from patients pre- and post-hematopoietic stem cell transplantation).
- Perform multiple omic assays on the same sample:
- 16S rRNA Sequencing: For taxonomic profiling of the bacterial community.
- Shotgun Metagenomic Sequencing: To identify bacterial-encoded functions and genes.
- Metabolomics (Targeted and Untargeted): To quantify metabolites, such as short-chain fatty acids (SCFAs).
2. Data Processing and Univariate Analysis:
- Process sequencing data (DADA2 for 16S, appropriate pipelines for shotgun data) and metabolomics data to generate feature tables (taxa, genes, metabolites).
- Use machine learning (e.g., the Boruta algorithm) and statistical tests (ANCOM-BC) to identify features in each modality that are significantly altered between conditions (e.g., pre- vs. post-transplant) [106].
3. Multimodal Integration and Interactome Analysis:
- Apply multivariate statistical approaches to study interactions between the different data modalities (the "interactome").
- Analyze how changes in specific bacterial taxa correlate with changes in their encoded functions and the resulting metabolite levels. This helps build a mechanistic understanding, such as how the depletion of Clostridiales leads to a reduction in SCFAs, facilitating pathogen expansion [106].
Data Presentation
Table 1: Performance Comparison of Multi-Modal vs. Single-Modality Diagnostic Models
The following table summarizes quantitative data from a study on diagnosing pulmonary infections, comparing models using different data modalities [107].
| Model Type | Data Modalities Used | AUC (Internal Test) | Sensitivity | Specificity | Key Advantage |
|---|---|---|---|---|---|
| Multimodal Integration (MMI) | Clinical Text + CT Images | 0.935 | 0.866 | 0.838 | Integrates complementary information for highest accuracy [107] |
| Image-Only Model | CT Images Only | 0.926 | - | - | Excels at capturing spatial features from scans [107] |
| Clinical-Only Model | Clinical Records & Lab Data | 0.879 | - | - | Leverages patient history and symptoms [107] |
Table 2: Key Research Reagent Solutions for Multi-Omic Microbiome Studies
This table details essential materials and their functions for conducting a multi-omics study on microbiome samples, based on the methodologies described in [106].
| Research Reagent / Material | Function in the Experimental Protocol |
|---|---|
| 16S rRNA Gene Sequencing Reagents | Provides taxonomic profiling of the bacterial community, identifying which taxa are present and their relative abundances [106]. |
| Shotgun Metagenomic Sequencing Kits | Allows for the sequencing of all genetic material in a sample, enabling the identification of bacterial-encoded functions and genes [106]. |
| Metabolomics Standards & Kits | For targeted (e.g., SCFAs) and untargeted analysis of metabolites, which are the functional outputs of the microbial community [106]. |
| Boruta Machine Learning Algorithm | A feature selection method used to identify the most relevant and significant bacterial taxa (or other features) that distinguish between experimental groups [106]. |
| Multivariate Statistical Software (e.g., R) | Used to perform integrative analyses, such as studying the interactome between different data modalities (taxa, genes, metabolites) [106]. |
Workflow and Architecture Diagrams
Diagram 1: High-Level Multi-Modal Data Integration Workflow
High-Level Multi-Modal Data Integration Workflow
Diagram 2: multiDGD Model Architecture for Multi-Omics Integration
multiDGD Model Architecture
Frequently Asked Questions (FAQs)
Q1: What is the difference between bacterial resistance, tolerance, and persistence? Understanding these terms is crucial for diagnosing why an antibiotic treatment may fail.
- Resistance: The ability of bacteria to grow in the presence of an antibiotic. This is due to genetic mutations and is measured by an increase in the Minimum Inhibitory Concentration (MIC) [23].
- Tolerance: The ability of an entire bacterial population to survive a transient antibiotic exposure by stopping growth. The MIC does not change, but the time required to kill the population increases. This is often a reversible, non-genetic state [23].
- Persistence: The ability of a small subpopulation of bacteria to survive antibiotic treatment that kills the majority. Like tolerance, the MIC does not change, and survival is linked to a dormant state. This is characterized by a biphasic killing curve [23].
Q2: Our antibiotic killing assays show a biphasic curve. Does this confirm we are studying persister cells? A biphasic killing curve, where a large population dies rapidly followed by a plateau where a small subpopulation survives extended treatment, is a classic signature of bacterial persistence [23]. However, you should confirm that the surviving cells do not have a genetically elevated MIC, which would indicate resistance instead.
Q3: We are unable to resuscitate dormant bacteria after antibiotic treatment. What could be going wrong? Resuscitation is a critical step. The failure to wake dormant cells can be due to several factors:
- Antiotic Carryover: Ensure the antibiotic is thoroughly removed or inactivated from the culture medium after the killing phase. Residual antibiotic will kill cells as they attempt to resuscitate.
- Insufficient Nutrients: The resuscitation medium must be rich and fresh to provide the signals and energy needed to restart metabolic activity. Simple buffer solutions are insufficient.
- Extended Dormancy: Some cells may enter a very deep dormancy and require specific resuscitation-promoting factors (Rpfs), which are bacterial proteins that can stimulate regrowth, rather than just nutrients [14].
Q4: What are the key signaling pathways that trigger bacterial dormancy? Two primary stress response pathways are central to initiating dormancy:
- The Stringent Response: Triggered by nutrient starvation, this pathway involves the rapid synthesis of the alarmone (p)ppGpp. This molecule dramatically reprograms cellular metabolism, shutting down energy-intensive processes like ribosome synthesis and stalling growth [23].
- The SOS Response: Activated by DNA damage, often caused by antibiotics like fluoroquinolones, this pathway can halt cell division and promote a dormant, drug-tolerant state [23].
Q5: Why is it so difficult to culture and detect dormant bacteria? Standard microbiological methods, like growth on agar plates, rely on bacterial division and metabolic activity. Dormant cells have drastically reduced or halted these processes, making them "unculturable" by conventional means [14]. They evade detection because they are metabolically inactive when the assay is run.
Troubleshooting Common Experimental Issues
Problem: High variability in persister cell counts between replicate assays.
| Possible Cause | Diagnostic Steps | Suggested Solution |
|---|---|---|
| Inconsistent inoculum | Check the optical density (OD) and colony-forming units (CFU) of the pre-culture immediately before the assay. | Standardize the growth of the pre-culture to the same mid-log phase OD and use it at a consistent cell density. |
| Incomplete drug mixing | Visually confirm thorough mixing after antibiotic addition. | Ensure consistent and vigorous vortexing or pipetting across all replicates. |
| Biofilm contamination | Check for a ring or pellicle in the liquid culture. | Use well-dispersed, planktonic cultures. Sonication or vortexing with glass beads may be necessary to break up clumps. |
Problem: Background growth during antibiotic treatment skews results.
| Possible Cause | Diagnostic Steps | Suggested Solution |
|---|---|---|
| Antibiotic degradation or instability | Check the antibiotic's shelf life and storage conditions. | Use freshly prepared antibiotic solutions. Confirm the working concentration is above the MIC for the strain using a growth curve. |
| Emergence of resistant mutants | Re-plate surviving cells on antibiotic-containing agar. If they grow, they are resistant. | Include a control with a higher antibiotic concentration or use a drug from a different class to distinguish persistence from resistance [23]. |
Quantitative Data for Resource Allocation
The table below summarizes key detection methods, allowing for a direct cost-benefit analysis based on technical complexity and the information each method yields.
Table 1: Comparison of Methods for Detecting Dormant Bacterial Populations
| Method | Principle | Informational Yield | Technical Complexity | Key Limitations |
|---|---|---|---|---|
| Standard Killing Assay | Expose culture to a high concentration of a bactericidal antibiotic and plate survivors over time [23]. | Quantifies the size of the persister/tolerant subpopulation; generates a killing curve. | Low | Cannot detect cells that are already dormant prior to treatment; only measures culturability. |
| Fluorescence-Activated Cell Sorting (FACS) | Uses fluorescent dyes to probe metabolic activity (e.g., CTC), membrane potential, or membrane integrity without the need for growth [14]. | Distinguishes subpopulations based on physiological state (e.g., dormant vs. active); can sort cells for downstream analysis. | High | Requires expensive equipment; dye toxicity and reliability can be issues. |
| Resuscitation-Promoting Factor (Rpf) Assay | Adds purified Rpf proteins, which are bacterial cytokines that stimulate the breakdown of the cell wall and promote growth of dormant cells [14]. | Can reveal and quantify a population of dormant cells that are not culturable by standard means. | Medium | Effectiveness is species-specific; may not wake all types of dormant cells. |
| RNA/DNA Staining (e.g., FISH) | Uses nucleic acid-binding probes to identify cells with a low RNA:DNA ratio, indicative of low ribosomal activity and dormancy. | Detects the physiological state of dormancy at the single-cell level; can be used in complex samples like biofilms. | Medium-High | Does not distinguish between live and dead cells; requires validation with a viability marker. |
Experimental Protocols
Protocol 1: Standard Antibiotic Killing Assay for Persister Enrichment
This protocol is used to isolate and quantify the persister subpopulation in a bacterial culture.
- Grow culture: Inoculate bacteria in appropriate liquid medium and grow to the desired phase (typically mid-log phase, e.g., OD600 ~0.5).
- Treat with antibiotic:
- Take a 1 mL sample for the "Time Zero" CFU count (see step 3).
- Add a high concentration of a bactericidal antibiotic (e.g., 100x MIC of ciprofloxacin or ampicillin) to the main culture.
- Incubate the culture under normal growth conditions with shaking.
- Determine CFU/mL over time:
- At predetermined time points (e.g., 1h, 2h, 4h, 8h), remove 1 mL samples.
- Wash the cells 2-3 times in sterile phosphate-buffered saline (PBS) or medium to remove the antibiotic. Centrifuge at high speed (>8,000 x g) for 2-3 minutes between washes.
- Serially dilute the final resuspension and spot-plate or spread-plate onto antibiotic-free agar plates.
- Incubate the plates until colonies appear (this may take longer for resuscitating persisters).
- Count the colonies and calculate the CFU/mL at each time point.
- Data Analysis: Plot the log(CFU/mL) versus time to generate a killing curve. A biphasic curve indicates persistence.
Protocol 2: Induction of Dormancy via Nutrient Starvation
This protocol induces a tolerant state in a homogeneous population.
- Grow culture: Grow bacteria to stationary phase (e.g., 24-48 hours) to deplete nutrients naturally.
- Transfer to starvation medium: Pellet the cells by centrifugation and resuspend them in a minimal medium or buffer without a carbon source (e.g., M9 salts).
- Incubate: Continue incubation for several hours or days. The lack of nutrients will trigger the stringent response, pushing the majority of the population into a dormant, tolerant state [23].
- Validate dormancy: Perform a killing assay (Protocol 1) on the starved culture. A tolerant population will show uniformly increased survival compared to a log-phase culture.
Visualization of Key Pathways and Workflows
Experimental Workflow for Dormancy Detection
The Scientist's Toolkit: Research Reagent Solutions
Table 2: Essential Reagents for Dormancy Research
| Item | Function in Research |
|---|---|
| Bactericidal Antibiotics (e.g., Ciprofloxacin, Ampicillin) | Used in killing assays to select for and enumerate the dormant population that survives treatment [23]. |
| Fluorescent Viability Dyes (e.g., SYTOX Green, Propidium Iodide) | Distinguish live/dead cells based on membrane integrity; dormant cells often have intact membranes. |
| Metabolic Probes (e.g., CTC, CFDA-AM) | Measure metabolic activity at the single-cell level; dormant cells show little to no signal [14]. |
| Resuscitation-Promoting Factor (Rpf) | A recombinant protein used to stimulate the regrowth of dormant actinobacteria, making them detectable by plating [14]. |
| (p)ppGpp Analogs | Pharmacological tools to directly induce the stringent response and study its role in initiating dormancy [23]. |
| Stringent Response Mutants (e.g., relA spoT) | Genetically engineered bacterial strains used to dissect the specific role of the (p)ppGpp-mediated pathway in dormancy [23]. |
| Toxin-Antitoxin System Mutants | Bacterial strains with deletions in specific toxin-antitoxin genes (e.g., hipA) to study their contribution to persistence [23]. |
Conclusion
The accurate detection of dormant bacterial populations is no longer a niche interest but a fundamental necessity for addressing the global crisis of persistent infections and antimicrobial resistance. A paradigm shift from purely culture-based methods to a multi-modal, single-cell resolution approach is essential. Future progress hinges on the development of standardized, accessible protocols that can be widely adopted in both research and clinical laboratories. The integration of advanced technologies like AI-powered analysis and highly sensitive nanosensors promises a new era where these 'hidden' populations can be routinely identified, monitored, and targeted, ultimately paving the way for novel therapeutic strategies that can eradicate the root cause of chronic and relapsing infections.
References
- 1. What Is The Difference Between Phenotypic Versus ... [https://www.idstewardship.com/difference-phenotypic-versus-genotypic-resistance/]
- 2. Antibiotics Resistance Profile of Clinical Isolates ... [https://pmc.ncbi.nlm.nih.gov/articles/PMC12189386/]
- 3. The Genotype-to-Phenotype Dilemma: How Should ... [https://pmc.ncbi.nlm.nih.gov/articles/PMC8316082/]
- 4. Mechanisms of Bacterial Tolerance and Persistence in the ... [https://pmc.ncbi.nlm.nih.gov/articles/PMC6148185/]
- 5. New Strategies to Kill Metabolically-Dormant Cells Directly ... [https://pmc.ncbi.nlm.nih.gov/articles/PMC10295454/]
- 6. Bacterial persisters: molecular mechanisms and ... [https://www.nature.com/articles/s41392-024-01866-5]
- 7. Mini review: Persister cell control strategies [https://www.frontiersin.org/journals/pharmacology/articles/10.3389/fphar.2025.1706115/full]
- 8. From Dormancy to Eradication: Strategies for Controlling ... [https://www.mdpi.com/2304-8158/14/6/1075]
- 9. Why Dormant Microbes Matter in a Changing Climate [https://asm.org/articles/2024/december/why-dormant-microbes-matter-in-a-changing-climate]
- 10. From Dormancy to Eradication: Strategies for Controlling ... [https://pmc.ncbi.nlm.nih.gov/articles/PMC11942268/]
- 11. New Strategies to Kill Metabolically-Dormant Cells Directly ... [https://www.mdpi.com/2079-6382/12/6/1044]
- 12. challenges and opportunities in biofilm detection - PMC [https://pmc.ncbi.nlm.nih.gov/articles/PMC7242124/]
- 13. Biofilms and multidrug resistance: an emerging crisis and the ... [https://pmc.ncbi.nlm.nih.gov/articles/PMC12237878/]
- 14. University of Houston Scientists Learn that Rare Bacterium ... [https://www.uh.edu/news-events/stories/2025/october/10082025-dormant-spacecraft-clean-room-bacteria.php]
- 15. (p)ppGpp and Its Role in Bacterial Persistence [https://pmc.ncbi.nlm.nih.gov/articles/PMC7508602/]
- 16. Stringent response ensures the timely adaptation of ... [https://www.nature.com/articles/s41467-023-36254-0]
- 17. (p)ppGpp imposes graded transcriptional changes to ... [https://www.nature.com/articles/s41522-025-00795-7]
- 18. Wake me when it's over - Bacterial toxin-antitoxin proteins and ... [https://pubmed.ncbi.nlm.nih.gov/27216598/]
- 19. New method explores dormancy in TB, other organisms [https://news.cornell.edu/stories/2025/05/new-method-explores-dormancy-tb-other-organisms]
- 20. Unlocking Long-term Genetic Memory: Dormant Bacterial ... [https://astrobiology.com/2023/11/unlocking-long-term-genetic-memory-dormant-bacterial-spores-offer-key-insights-into-evolutionary-survival-strategies.html]
- 21. Understanding the Stringent Response: Experimental Context ... [https://pmc.ncbi.nlm.nih.gov/articles/PMC9973329/]
- 22. Targeting the bacterial stringent response to combat ... [https://www.frontiersin.org/journals/immunology/articles/10.3389/fimmu.2025.1663548/full]
- 23. Recent advances in the understanding, detection and ... [https://pmc.ncbi.nlm.nih.gov/articles/PMC12333241/]
- 24. Mechanisms of antimicrobial resistance in biofilms [https://www.nature.com/articles/s44259-024-00046-3]
- 25. Metabolite-driven reprogramming of bacterial persisters [https://www.sciencedirect.com/science/article/abs/pii/S1368764625001256]
- 26. Biofilm Resilience: Molecular Mechanisms Driving Antibiotic ... [https://pmc.ncbi.nlm.nih.gov/articles/PMC11852148/]
- 27. An AI-based approach for detecting cells and microbial ... [https://www.frontiersin.org/journals/microbiology/articles/10.3389/fmicb.2022.996400/full]
- 28. Are Bacterial Persisters Dormant Cells Only? - PMC [https://pmc.ncbi.nlm.nih.gov/articles/PMC8847742/]
- 29. Flow Cytometry Troubleshooting Guide [https://www.cellsignal.com/learn-and-support/troubleshooting/flow-cytometry-troubleshooting-guide?srsltid=AfmBOoqJI10ul1DPSR2Lyrq4PwUd4AT2BRv4W2aEOFCyAppeA3FMJYlW]
- 30. Flow cytometry method for absolute counting and single- ... [https://www.nature.com/articles/s41598-021-98176-5]
- 31. The Application of Imaging Flow Cytometry for ... [https://pmc.ncbi.nlm.nih.gov/articles/PMC8335544/]
- 32. Definitions and guidelines for research on antibiotic ... [https://www.nature.com/articles/s41579-019-0196-3]
- 33. An Experimental Framework for Quantifying Bacterial ... [https://pmc.ncbi.nlm.nih.gov/articles/PMC5479142/]
- 34. An Experimental Framework for Quantifying Bacterial ... [https://www.sciencedirect.com/science/article/pii/S0006349517305519]
- 35. Estimating treatment prolongation for persistent infections [https://pmc.ncbi.nlm.nih.gov/articles/PMC6134427/]
- 36. Pseudomonas aeruginosa displays a dormancy phenotype ... [https://pmc.ncbi.nlm.nih.gov/articles/PMC6147739/]
- 37. Novel Concentration-Killing Curve Method for Estimation of ... [https://pmc.ncbi.nlm.nih.gov/articles/PMC521920/]
- 38. BestProtocols: Viability Staining Protocol for Flow Cytometry [https://www.thermofisher.com/us/en/home/references/protocols/cell-and-tissue-analysis/protocols/viability-staining-flow-cytometry.html]
- 39. To dye or not to dye? Understanding the different viability ... [https://www.ptglab.com/news/blog/to-dye-or-not-to-dye-understanding-the-different-viability-dyes-available-for-flow-cytometry/?srsltid=AfmBOoq1uT-AeT5lOb-KsV1HKoENrlXrAzqca3PQvYgPdrGov0_OUWaB]
- 40. Flexible Viability Dye for Flow Cytometry [https://www.akadeum.com/technology/flow-cytometry/flexible-viability-dye-for-flow-cytometry-how-does-live-dead-stain-work/?srsltid=AfmBOop2EcM1kph3eaXgj638wf-epBjtm22iJpznCiZzhlV8ONQtCuMs]
- 41. A flow cytometry method for safe detection of bacterial ... [https://pubmed.ncbi.nlm.nih.gov/37786349/]
- 42. Viability Stain Automated Cell Counting [https://logosbio.com/how-to-choose-the-right-viability-stain-for-automated-cell-counting-tb-eb-ao-pi-and-fda-pi-compared/]
- 43. Flow Cytometry Troubleshooting Guide [https://www.cellsignal.com/learn-and-support/troubleshooting/flow-cytometry-troubleshooting-guide?srsltid=AfmBOoqf3aP5SCC3fZ8RefI_i4r_VVHn47F7BiMfWZjVcarW4hicgZXQ]
- 44. Flow Cytometry Troubleshooting Guide [https://www.novusbio.com/support/support-by-application/flow-cytometry/troubleshooting?srsltid=AfmBOorV5767njVUdFDUR7QthH5pYm2N-VIyac1kMqi_aJ-XT6AcCB6H]
- 45. Application of flow cytometry for rapid bacterial ... [https://www.sciencedirect.com/science/article/pii/S2405844023063545]
- 46. Raman cell sorting for single-cell research - PubMed Central [https://pmc.ncbi.nlm.nih.gov/articles/PMC11145634/]
- 47. Detecting and classifying metabolic activity ... [https://pubmed.ncbi.nlm.nih.gov/40453474/]
- 48. Single-cell Raman spectroscopy identifies Escherichia coli ... [https://www.frontiersin.org/journals/microbiology/articles/10.3389/fmicb.2022.936726/full]
- 49. LLMs- and object detection-enhanced active-matrix digital ... [https://www.nature.com/articles/s41378-025-00962-y]
- 50. Recent Methods for the Viability Assessment of Bacterial ... [https://pmc.ncbi.nlm.nih.gov/articles/PMC9500772/]
- 51. Troubleshooting Tips for Fluorescence Staining [https://biotium.com/tech-tips-protocols/troubleshooting-tips-for-fluorescence-staining/]
- 52. Cellular Fluorescence Microscopy Troubleshooting & Best ... [https://www.aatbio.com/resources/application-notes/cellular-fluorescence-microscopy-troubleshooting-best-practices]
- 53. Defining bacterial heterogeneity and dormancy with the ... [https://www.sciencedirect.com/science/article/abs/pii/S2214799322000042]
- 54. Identification of the reporter gene combination that shows ... [https://pubmed.ncbi.nlm.nih.gov/38300967/]
- 55. How to Choose the Right Reporter Gene [https://en.vectorbuilder.com/resources/vector-academy/troubleshooting/reporter-gene.html]
- 56. Efficient microbial colony growth dynamics quantification ... [https://www.nature.com/articles/s41598-020-72979-4]
- 57. When an antibiotic fails: MIT scientists are using AI to target ... [https://news.mit.edu/2024/mit-scientists-are-using-artificial-intelligence-target-sleeper-bacteria-0408]
- 58. Artificial Intelligence-Assisted Nanosensors for Clinical ... [https://pubmed.ncbi.nlm.nih.gov/41149307/]
- 59. New nano-sensor developed can detect deadly infections ... [https://dst.gov.in/new-nano-sensor-developed-can-detect-deadly-infections-minutes]
- 60. Nanomaterial-based sensors for microbe detection: a review [https://pmc.ncbi.nlm.nih.gov/articles/PMC11289191/]
- 61. Harnessing AI to Revolutionize Antibiotic Discovery [https://asm.org/articles/2025/august/ai-next-frontier-antibiotic-discovery]
- 62. The importance of the viable but non-culturable state in ... [https://pmc.ncbi.nlm.nih.gov/articles/PMC4040921/]
- 63. Identification of population of bacteria from culture negative ... [https://bmcsurg.biomedcentral.com/articles/10.1186/s12893-020-01016-y]
- 64. Strategies for culturing active/dormant marine microbes [https://pmc.ncbi.nlm.nih.gov/articles/PMC10077298/]
- 65. Means, Ranges and Replicates: Improving Microbial Plate ... [https://www.ejpps.online/post/means-ranges-and-replicates-improving-microbial-plate-counting]
- 66. Journal of Microbiological Methods [https://www.sciencedirect.com/science/article/abs/pii/S0167701221001081]
- 67. A digital plating platform for robust and versatile microbial ... [https://www.nature.com/articles/s41598-025-11525-6]
- 68. Clinical Diagnostics of Bacterial Infections and Their ... [https://pmc.ncbi.nlm.nih.gov/articles/PMC10135054/]
- 69. Resuscitation-promoting factor (Rpf) terminates dormancy ... [https://pmc.ncbi.nlm.nih.gov/articles/PMC12090717/]
- 70. Keys to Cultivating Uncultured Microbes [https://pmc.ncbi.nlm.nih.gov/articles/PMC4676551/]
- 71. Survival and rapid resuscitation permit limited productivity ... [https://www.nature.com/articles/s41467-024-46920-6]
- 72. Absolute quantification of VBNC state formation and ... [https://pubmed.ncbi.nlm.nih.gov/41122686/]
- 73. Biofilms: structure, resistance mechanism, emerging control ... [https://pubs.rsc.org/en/content/articlehtml/2025/pm/d5pm00094g]
- 74. Comparison of two fluorescent probes in preclinical non- ... [https://www.nature.com/articles/s41598-020-78362-7]
- 75. Evaluation of peptide-based probes towards in vivo ... [https://pmc.ncbi.nlm.nih.gov/articles/PMC7429274/]
- 76. Flow cytometry study of Escherichia coli treated with ... [https://www.frontiersin.org/journals/microbiology/articles/10.3389/fmicb.2025.1592471/full]
- 77. Setting standards for reproducibility in gut microbiome research [https://www.nature.com/articles/d42473-018-00136-7]
- 78. New ultra-sensitive method for detecting bacterial spores [https://www.umu.se/en/news/new-ultra-sensitive-method-for-detecting-bacterial-spores_12047886]
- 79. Repeatability and reproducibility assessment in a large-scale population-based microbiota study: case study on human milk microbiota | Microbiome | Full Text [https://microbiomejournal.biomedcentral.com/articles/10.1186/s40168-020-00998-4]
- 80. Experimental methods and modeling techniques for ... [https://www.sciencedirect.com/science/article/pii/S0734975011000425]
- 81. Heterogeneity in pragmatic randomised trials - PubMed Central [https://pmc.ncbi.nlm.nih.gov/articles/PMC9615398/]
- 82. A Leader's Guide to Heterogeneous Treatment Effects [https://www.causalconversations.com/post/heterogenous/]
- 83. Open Research Handbook: Reproducibility [https://libguides.reading.ac.uk/open-research/reproducibility]
- 84. Seasonally and niche-differentiated diversity of active ... [https://www.nature.com/articles/s42003-025-08789-z]
- 85. Uncovering the Metabolic Strategies of the Dormant Microbial ... [https://pmc.ncbi.nlm.nih.gov/articles/PMC6529542/]
- 86. How Dormant Bacteria Return to Life [https://hms.harvard.edu/news/how-dormant-bacteria-return-life]
- 87. The Thinking Undead: How Dormant Bacteria Calculate Their ... [https://today.ucsd.edu/story/the-thinking-undead-how-dormant-bacteria-calculate-their-return-to-life]
- 88. Dormancy contributes to the maintenance of microbial diversity [https://pmc.ncbi.nlm.nih.gov/articles/PMC2851880/]
- 89. Troubleshooting: Bacterial Transformation [https://www.goldbio.com/blogs/articles/troubleshooting-bacterial-transformation?srsltid=AfmBOoqAra9niCYbJnm8Th5uWniSy1TEBtuzAAWLMMYTC6JP2Ocf_oLU]
- 90. Antibacterial nanoagents: an emerging arsenal against ... [https://pmc.ncbi.nlm.nih.gov/articles/PMC12537890/]
- 91. Diagnostic Testing Accuracy: Sensitivity, Specificity, Predictive ... [https://www.ncbi.nlm.nih.gov/books/NBK557491/]
- 92. Variation in sensitivity and specificity of diverse diagnostic ... [https://www.sciencedirect.com/science/article/pii/S0895435625001490]
- 93. A META-EPIDEMIOLOGICAL STUDY [https://pubmed.ncbi.nlm.nih.gov/40339825/]
- 94. Improved Sensitivity for Molecular Detection of Bacterial and ... [https://pmc.ncbi.nlm.nih.gov/articles/PMC4313132/]
- 95. Quantitative assessment of cell population diversity in single ... [https://pmc.ncbi.nlm.nih.gov/articles/PMC6211764/]
- 96. Challenges in Single-Cell RNA Seq Data Analysis & ... [https://www.elucidata.io/blog/challenges-and-solutions-in-single-cell-rna-seq-data-analysis]
- 97. 5 tips for successful single-cell RNA-seq [https://www.takarabio.com/about/bioview-blog/tips-and-troubleshooting/5-tips-to-make-your-single-cell-rna-seq-experiments-a-success?srsltid=AfmBOooD80Ufh_Xaax_lMbrxn4Nxvp8hMwiIsKTccgGthTjCq_NHlXyD]
- 98. The Normalcy of Dormancy - PMC - PubMed Central [https://pmc.ncbi.nlm.nih.gov/articles/PMC3743100/]
- 99. Pathogen Discovery, Detection, and Diagnostics - NCBI - NIH [https://www.ncbi.nlm.nih.gov/books/NBK221492/]
- 100. A Review of Modern Methods for the Detection ... [https://www.mdpi.com/2076-2607/11/5/1111]
- 101. Revolutionary Detection Method for Food Safety and Hygiene [https://www.azosensors.com/news.aspx?newsID=16234]
- 102. Waterborne pathogens detection technologies: advances ... [https://www.frontiersin.org/journals/microbiology/articles/10.3389/fmicb.2023.1286923/full]
- 103. Detection Methodologies for Pathogen and Toxins: A Review [https://pmc.ncbi.nlm.nih.gov/articles/PMC5580025/]
- 104. multiDGD: A versatile deep generative model for multi- ... [https://www.nature.com/articles/s41467-024-53340-z]
- 105. Guidance for Multi-Omics and Multi-Modal Data Integration ... [https://aws.amazon.com/solutions/guidance/multi-omics-and-multi-modal-data-integration-and-analysis/]
- 106. Multimodal analysis identifies microbiome changes linked to ... [https://microbiomejournal.biomedcentral.com/articles/10.1186/s40168-024-01948-0]
- 107. A multimodal integration pipeline for accurate diagnosis ... [https://pmc.ncbi.nlm.nih.gov/articles/PMC11253137/]
- 108. Guidance for multi-Omics and multi-modal data integration ... [https://www.amazon.science/code-and-datasets/guidance-for-multi-omics-and-multi-modal-data-integration-and-analysis-on-aws]
- 109. awslabs/guidance-for-multi-omics-and-multi-modal-data- ... [https://github.com/awslabs/guidance-for-multi-omics-and-multi-modal-data-integration-and-analysis-on-aws]