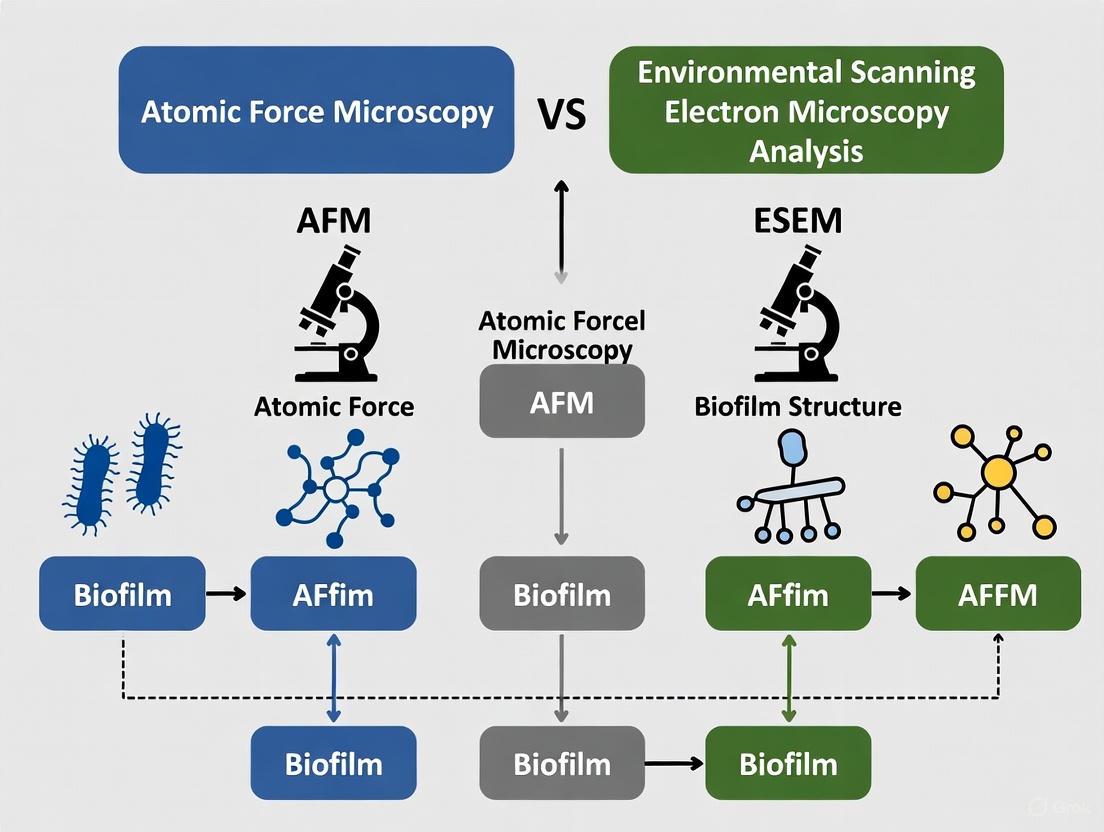
AFM vs. Environmental SEM: A Researcher's Guide to Biofilm Structure Analysis
This article provides a comprehensive comparative analysis of Atomic Force Microscopy (AFM) and Environmental Scanning Electron Microscopy (ESEM) for characterizing biofilm structure, targeting researchers and drug development professionals.
AFM vs. Environmental SEM: A Researcher's Guide to Biofilm Structure Analysis
Abstract
This article provides a comprehensive comparative analysis of Atomic Force Microscopy (AFM) and Environmental Scanning Electron Microscopy (ESEM) for characterizing biofilm structure, targeting researchers and drug development professionals. It covers the foundational principles of both techniques, details methodological protocols for biofilm imaging, addresses common troubleshooting and optimization challenges, and validates findings through comparative analysis and multi-modal approaches. The review synthesizes key takeaways to guide the selection and application of these powerful imaging tools in biomedical and clinical research, ultimately aiding in the development of effective anti-biofilm strategies.
Understanding Biofilms and the Microscopy Tools to Decipher Them
Bacterial biofilms are complex, surface-associated microbial communities encapsulated within a self-produced matrix of Extracellular Polymeric Substances (EPS) [1]. This matrix, composed of polysaccharides, proteins, extracellular DNA (eDNA), and lipids, provides structural integrity and confers formidable resistance to antimicrobial agents and host immune responses [1] [2]. This resilience makes biofilm-associated infections a significant clinical challenge, contributing to persistent diseases and complicating treatment strategies, especially with the rise of antimicrobial resistance (AMR) in ESKAPE pathogens [2]. Understanding the intricate architecture of biofilms is therefore paramount for developing effective countermeasures.
The precise quantification and visualization of biofilm structure, from initial cellular attachment to the formation of complex three-dimensional communities, requires advanced imaging technologies. Among these, Atomic Force Microscopy (AFM) and Environmental Scanning Electron Microscopy (ESEM) have emerged as powerful, yet fundamentally different, tools. This guide provides an objective, data-driven comparison of these two core techniques to aid researchers in selecting the optimal methodology for their specific biofilm research objectives.
Atomic Force Microscopy (AFM): Probing Nanoscale Surfaces and Forces
Atomic Force Microscopy (AFM) operates by scanning a sharp, nanometer-scale probe across a sample surface. It measures the forces between the probe and the sample to generate high-resolution topographical images and quantitative maps of nanomechanical properties [3] [4]. A significant advantage of AFM is its ability to operate under physiological conditions (in liquids), allowing researchers to observe biofilms in their native, hydrated state without destructive sample preparation [4] [5].
AFM excels in applications that require nanoscale resolution and the measurement of physical forces. It is unparalleled for visualizing fine structures like flagella and pili [4], mapping cell surface hydrophobicity [3], and directly quantifying the adhesive and mechanical forces that govern biofilm development through techniques like Single-Cell Force Spectroscopy (SCFS) [3]. Recent innovations, such as automated large-area AFM coupled with machine learning for image stitching, are overcoming traditional limitations by enabling high-resolution imaging over millimeter-scale areas, thus bridging the gap between cellular and macroscale organization [4].
Experimental Protocol for AFM Biofilm Analysis
Protocol: Large-Area AFM for Early Biofilm Formation [4]
- 1. Substrate Preparation: Treat glass coverslips with PFOTS or other relevant coatings to create a defined surface for bacterial attachment.
- 2. Biofilm Growth: Inoculate a petri dish containing the treated coverslips with the bacterial strain of interest (e.g., Pantoea sp. YR343) in liquid growth medium.
- 3. Sample Harvesting: At selected time points (e.g., 30 minutes for initial attachment), remove coverslips and gently rinse to remove non-adherent cells.
- 4. AFM Imaging:
- Mount the sample on the AFM stage.
- For large-area analysis, use an automated stage to capture multiple contiguous high-resolution images.
- Employ a soft cantilever suitable for biological samples. Scan in contact mode or another appropriate mode in liquid or air.
- 5. Data Processing: Use machine learning algorithms to seamlessly stitch individual images, followed by automated segmentation for cell detection, classification, and extraction of parameters like cell count, confluency, and orientation [4].
Diagram 1: AFM experimental workflow for biofilm analysis, highlighting automated large-area scanning and ML-driven data processing.
Environmental SEM (ESEM): Imaging in a Hydrated State
Environmental Scanning Electron Microscopy (ESEM) represents a significant advancement over conventional SEM. It allows for the imaging of uncoated, partially hydrated samples by maintaining a controlled gaseous environment in the specimen chamber [5]. This capability is crucial for biofilm research, as it minimizes the artifacts—such as EPS collapse and overall biofilm shrinkage—that are commonly associated with the rigorous dehydration and metal-coating required by traditional SEM [5].
ESEM is particularly powerful for revealing the three-dimensional architecture of mature biofilms and the intricate network of the EPS matrix at a resolution far superior to optical microscopy [5]. It provides detailed topographical and morphological information of biofilm surfaces, allowing researchers to observe the arrangement of microbial cells within the matrix and the overall community structure. While ESEM offers superior resolution for structural studies, it is generally not used for quantifying nanomechanical properties like adhesion or stiffness, which is a key strength of AFM.
Experimental Protocol for ESEM Biofilm Analysis
Protocol: ESEM for Native Biofilm Architecture [5]
- 1. Biofilm Growth: Grow biofilms on a suitable substrate relevant to the study (e.g., a medical implant material).
- 2. Sample Stabilization (Optional): For enhanced structural preservation, samples can be fixed with low concentrations of glutaraldehyde and/or stained with agents like ruthenium red or tannic acid to stabilize the EPS [5].
- 3. ESEM Imaging:
- Transfer the sample to the ESEM chamber without conductive coating.
- Carefully control the chamber environment: lower the pressure and adjust the temperature to maintain a hydrated state (high water vapor pressure). Typical conditions might include a temperature of ~5°C and a water vapor pressure of ~6-7 Torr.
- Use a low accelerating voltage (e.g., 10-30 kV) to minimize charging on the uncoated sample and reduce beam damage.
- 4. Image Analysis: Use 3D image analysis software to extract quantitative morphological parameters (e.g., biovolume, thickness, porosity) from the acquired images [5].
Diagram 2: ESEM experimental workflow for visualizing hydrated, native biofilm architecture with minimal sample preparation.
Direct Comparison: AFM vs. ESEM for Biofilm Research
The following tables synthesize core performance data and characteristics to facilitate a direct comparison between AFM and ESEM.
Table 1: Quantitative Performance Data Comparison
| Feature | Atomic Force Microscopy (AFM) | Environmental SEM (ESEM) |
|---|---|---|
| Best Resolution | ~0.1-1 nm (vertical) [3], ~20 nm (lateral) [3] | ~50-100 nm [5] |
| Typical Max Scan Area | Millimeter-scale (with automated systems) [4] | Not typically limited by scan area, but by chamber size |
| Single-Molecule Force Sensitivity | Yes (pico- to nanonewton range) [3] | No |
| Imaging Environment | Liquid (physiological), air, controlled atmosphere [4] [3] | Hydrated state with water vapor, low vacuum [5] |
| Key Measurable Parameters | Topography, adhesion force, stiffness, elasticity [3] [5] | Topography, 3D architecture, morphology [5] |
Table 2: Methodological Characteristics and Applications
| Characteristic | Atomic Force Microscopy (AFM) | Environmental SEM (ESEM) |
|---|---|---|
| Sample Preparation | Minimal; often requires rinsing but no fixation or coating [4] | Minimal; no conductive coating required; optional chemical stabilization [5] |
| Info Obtained | Topographical, nanomechanical, and functional properties | Primarily topological and morphological information |
| Strengths | Nanoscale resolution under physiological conditions; quantitative force measurement; can map chemical properties [4] [3] | Excellent for 3D visualization of hydrated structures; larger field of view than conventional AFM; high depth of field [5] |
| Limitations | Small scan area per image; slow scanning speed; potential for tip-induced surface damage [4] [5] | Lower resolution than AFM; potential for beam damage; not suitable for force spectroscopy [5] |
| Ideal Use Cases | Studying initial cell attachment, single-cell mechanics, adhesion forces, and fine appendages (flagella, pili) [4] [3] | Visualizing the 3D architecture of mature biofilms, EPS matrix organization, and community structure in a near-native state [5] |
Essential Research Reagent Solutions
Successful biofilm imaging relies on specialized reagents and materials. The following table outlines key solutions for both AFM and ESEM methodologies.
Table 3: Key Research Reagents and Materials for Biofilm Imaging
| Reagent/Material | Function | Application in |
|---|---|---|
| PFOTS-treated glass | Creates a hydrophobic, defined surface to study specific bacterial attachment dynamics [4]. | AFM |
| Soft Cantilevers | AFM probes with low spring constants, essential for imaging soft biological samples without damage [3]. | AFM |
| Ruthenium Red (RR) | A stain used to stabilize and preserve the delicate EPS matrix during sample preparation for electron microscopy [5]. | ESEM |
| Tannic Acid (TA) | Used in staining protocols to cross-link and stabilize biofilm components, improving structural integrity for SEM/ESEM [5]. | ESEM |
| Congo Red | A dye that binds to curli amyloid fibers and cellulose; used to track ECM production and purification [6]. | Biofilm culture (pre-imaging) |
| Calcofluor White | A fluorescent dye that binds to polysaccharides like cellulose; used for qualitative assessment of EPS [6]. | Biofilm culture (pre-imaging) |
The choice between AFM and ESEM is not a matter of which technology is superior, but which is more appropriate for the specific research question. AFM is the unequivocal tool for quantitative, nanoscale functional analysis—measuring the forces and mechanical properties that define biofilm behavior under physiological conditions. In contrast, ESEM provides unparalleled insight into the complex 3D topography and architecture of hydrated, intact biofilms at a mesoscale.
The future of biofilm imaging lies in the integration of multimodal approaches and the adoption of advanced data analysis techniques. Combining AFM with complementary techniques like confocal laser scanning microscopy (CLSM) can correlate nanomechanical data with biochemical information [5] [7]. Furthermore, the application of machine learning and artificial intelligence for automated image analysis, segmentation, and data interpretation is transforming both AFM and ESEM workflows, enabling the extraction of robust quantitative data from complex images and accelerating the pace of discovery in biofilm research [4] [7]. This synergistic use of technologies will be crucial for developing novel strategies to combat biofilm-associated clinical challenges.
Atomic Force Microscopy (AFM) is a very-high-resolution type of scanning probe microscopy (SPM), with demonstrated resolution on the order of fractions of a nanometer, more than 1000 times better than the optical diffraction limit [8]. In the context of biofilm structure analysis, AFM unlocks the invisible nanoscale world, allowing researchers to explore microbial communities critical in medical, industrial, and environmental contexts [9] [10]. Biofilms are multicellular communities of microbial cells held together by self-produced extracellular polymeric substances (EPS), and understanding their assembly, structure, and environmental responses is key to developing effective control and mitigation strategies in healthcare and industry [10].
AFM's versatility lies in its ability to not only capture three-dimensional topographic images but also perform a wide range of surface metrology tailored to the needs of scientists and engineers [9]. For biofilm research, this capability is exceptionally powerful—AFM can achieve high resolution with Ångström-level height accuracy while requiring minimal sample preparation, preserving the native state of biological samples [10]. When compared to Environmental Scanning Electron Microscopy (ESEM) for biofilm analysis, AFM provides complementary information: ESEM offers qualitative structural overviews, while AFM delivers quantitative topographic data and mechanical properties at the nanoscale [11].
Fundamental Principles of AFM Operation
Core Components and Sensing Mechanism
The underlying principle of AFM involves surface sensing using an extremely sharp tip mounted on a flexible cantilever [12] [8]. This tip is used to image a sample by raster scanning across the surface line by line. As the tip contacts the surface, the cantilever bends, and this bending is detected using a laser diode and a split photodetector [12]. The key components of a typical AFM system include:
- Cantilever: A small spring-like lever typically made of silicon or silicon nitride [8]
- Sharp tip: Fixed to the free end of the cantilever with a tip radius of curvature on the order of nanometers [8]
- Laser system: A laser beam reflects off the cantilever onto a position-sensitive photodetector (PSPD) [9]
- Piezoelectric scanner: Enables precise movement of the tip or sample in x, y, and z directions with atomic-scale precision [8]
- Feedback loop: Monitors tip-sample interactions and adjusts scanning parameters to maintain constant force or height [8]
According to Hooke's law, forces between the tip and the sample lead to a deflection of the cantilever [8]. These forces include mechanical contact force, van der Waals forces, capillary forces, chemical bonding, electrostatic forces, and magnetic forces [8]. Even nanoscale deflections alter the laser's path on the PSPD, allowing the detection system to track height variations (topography) and force interactions (mechanical, electrical, magnetic) [9].
Primary Imaging Modes
AFM operates in several distinct modes, each optimized for different sample types and measurement requirements:
Contact Mode: This is the most basic AFM mode for measuring topography [9]. The cantilever scans while applying a constant force onto the sample surface. As the tip passes over surface features, the cantilever deflects, and a feedback loop maintains constant deflection by adjusting the scanner height, thereby mapping the surface topography [9].
Tapping Mode (also called intermittent contact mode): In this alternative technique, the cantilever oscillates at or near its resonance frequency just above the surface [9] [12]. The tip makes intermittent contact with the surface, reducing lateral forces and minimizing potential sample damage [12]. As the tip approaches the sample surface, the oscillation amplitude decreases, and the feedback loop corrects for these amplitude deviations to generate topography images [9].
Non-Contact Mode: In this technique, the cantilever oscillates just above the surface without making contact [9]. A precise, high-speed feedback loop prevents the cantilever tip from crashing into the surface, keeping the tip sharp and leaving the surface untouched [9]. This mode is particularly useful for measuring soft or easily damaged samples.
AFM Operational Workflow: This diagram illustrates the key steps in AFM operation, from sample loading to final 3D image reconstruction.
Comparative Analysis: AFM vs. Environmental SEM for Biofilm Research
Technical Specifications and Capabilities
Table 1: Technical comparison between AFM and Environmental SEM for biofilm characterization
| Parameter | Atomic Force Microscopy (AFM) | Environmental SEM (ESEM) |
|---|---|---|
| Resolution | Sub-nanometer vertical resolution; atomic-level possible [9] [8] | Lower resolution than AFM; limited by electron beam interaction volume [11] |
| Sample Environment | Ambient air or liquid conditions; near-physiological conditions possible [10] [13] | Partial vacuum environment; hydrated samples possible with specialized chambers [11] |
| Sample Preparation | Minimal preparation required; can image native biofilm state [9] [10] | Often requires fixation, dehydration, or metallic coating to prevent charging [11] |
| Information Type | Quantitative 3D topography with Ångström-level height accuracy [9] | Qualitative 2D surface representation with shadowing effects [14] |
| Additional Properties | Nanomechanical properties (stiffness, adhesion), electrical properties, magnetic properties [9] [8] | Elemental composition analysis possible with EDS attachment [14] |
| Sample Damage Risk | Low to moderate (depending on mode and force applied) [12] | Potential beam damage, especially to uncoated biological samples [14] |
| Imaging Speed | Relatively slow (minutes to hours per image) [10] | Fast image acquisition (seconds to minutes per image) [14] |
| Cost | Starting at ~$30,000 for basic systems [14] | ~$70,000 for tabletop systems to >$500,000 for full-size systems [14] |
Experimental Data from Biofilm Studies
Table 2: Experimental results from comparative studies of bacterial biofilms using AFM and ESEM
| Study Focus | AFM Findings | ESEM Findings | Reference |
|---|---|---|---|
| Sulfate-Reducing Bacteria on Steel | Quantitative surface roughness measurements; pit depth and diameter measurements with nanometer precision [11] | Qualitative structural information on biofilm organization; limited quantitative data [11] | Biofouling, 1996 [11] |
| Pantoea sp. YR343 Biofilm Assembly | Visualization of flagellar structures (~20-50 nm height); honeycomb patterning of cells; detailed EPS structure [10] | Not specifically reported in available study | Communications Biology, 2025 [10] |
| General Biofilm Imaging Capabilities | Cell dimensions (2 μm length, 1 μm diameter); flagellar interactions; mechanical properties mapping [10] | Overview of biofilm architecture; larger field of view; spatial distribution patterns [11] | Multiple Sources [11] [10] |
Experimental Protocols for Biofilm Analysis
AFM Protocol for Biofilm Imaging
Sample Preparation Methodology:
- Substrate Selection: Use freshly cleaved mica, glass coverslips, or specially treated surfaces (e.g., PFOTS-treated glass) for optimal cell attachment [10]
- Biofilm Growth: Inoculate surfaces with bacterial suspension in appropriate growth medium. For Pantoea sp. YR343, incubation times ranged from ~30 minutes for initial attachment studies to 6-8 hours for cluster formation [10]
- Rinsing: Gently rinse samples with buffer solution (e.g., PBS) or deionized water to remove unattached cells while preserving biofilm integrity [10]
- Drying: For conventional AFM imaging, air-dry samples; for liquid imaging, maintain hydration with appropriate fluid cell [10]
Imaging Parameters:
- Mode Selection: Use tapping mode for minimal sample disturbance or contact mode for higher resolution on robust samples [9] [12]
- Scan Size: Typically 1-100 μm for overview images, down to 100 nm-1 μm for high-resolution cellular features [10]
- Scan Rate: 0.5-2 Hz, optimized to balance image quality and acquisition time [10]
- Cantilever Selection: Standard silicon nitride cantilevers with spring constants of 0.1-5 N/m for biological samples [8]
Large-Area AFM Protocol: Recent advancements enable automated large-area AFM approaches capable of capturing high-resolution images over millimeter-scale areas [10]. This protocol involves:
- Automated raster scanning of multiple adjacent regions
- Machine learning-assisted image stitching with minimal overlap between scans
- Computational analysis for cell detection, classification, and parameter extraction (cell count, confluency, shape, orientation) [10]
ESEM Protocol for Comparative Biofilm Studies
Sample Preparation:
- Fixation: Use glutaraldehyde (2-4%) in buffer for primary fixation, followed by osmium tetroxide (1-2%) for secondary fixation [11]
- Dehydration: Gradual ethanol or acetone series (30%, 50%, 70%, 90%, 100%) [11]
- Mounting: Attach samples to aluminum stubs using conductive adhesive
- Optional Coating: For high-resolution imaging, apply thin (2-10 nm) metal coating (gold, platinum) using sputter coater [11]
Imaging Parameters:
- Accelerating Voltage: 5-20 kV, optimized to balance resolution and sample damage
- Pressure: 0.1-2.0 Torr, depending on sample hydration requirements
- Working Distance: 5-15 mm for optimal resolution and signal detection
- Detector Selection: Use gaseous secondary electron detector (GSED) for topographic contrast
Advanced AFM Applications in Biofilm Research
Beyond Topography: Multimodal AFM Characterization
Modern AFM systems extend far beyond simple topographic imaging, offering multiple characterization modes relevant to biofilm research:
Mechanical Property Mapping:
- Force Modulation Microscopy (FMM): The cantilever is oscillated while scanning, with amplitude changes indicating local surface hardness [9]
- Nanoindentation: The AFM tip indents the sample surface, with loading-unloading curves providing quantitative data on hardness and elasticity [9]
- Force-Distance Spectroscopy: Measures adhesion forces, Young's modulus, and other mechanical properties through approach-retract curves [9]
Electrical Property Characterization:
- Conductive AFM (C-AFM): Measures current flow between a conductive tip and electrically-biased sample to map local conductivity [9]
- Kelvin Probe Force Microscopy (KPFM): Maps surface potential and work function in non-contact mode [9]
- Electrostatic Force Microscopy (EFM): Probes ferroelectric regions and charge distributions on sample surfaces [9]
Chemical Sensing:
- Photo-induced Force Microscopy (PiFM): Provides chemical contrast based on molecular vibrational spectroscopy [9]
- Tip-Enhanced Raman Spectroscopy (TERS): Combines AFM with Raman spectroscopy for nanoscale chemical analysis [9]
Recent Technological Advancements
High-Speed AFM (HS-AFM): Advanced HS-AFM systems enable the observation of dynamic processes in near-physiological conditions with sub-second temporal resolution [13]. This capability is particularly valuable for studying biofilm development, cellular responses to environmental stimuli, and molecular interactions in real-time.
Machine Learning Integration: AI and machine learning are transforming AFM applications in four key areas [10]:
- Automated Region Selection: ML algorithms identify optimal scanning regions based on initial survey images
- Scanning Optimization: AI enhances tip-sample interactions, corrects distortions, and reduces scanning time
- Data Analysis: Automated segmentation, classification, and feature detection in AFM images
- Virtual AFM Simulation: Predictive modeling of AFM experiments before physical execution
AFMfit Computational Analysis: The AFMfit software package enables interpretation of conformational dynamics from AFM experiments through flexible fitting procedures that scale to many single molecules in AFM images [13]. This approach uses nonlinear normal mode analysis to associate each molecule with its conformational state, processing hundreds of AFM images in minutes on a single workstation [13].
Essential Research Reagents and Materials
Table 3: Key research reagents and materials for AFM-based biofilm studies
| Item | Function/Application | Specifications |
|---|---|---|
| Silicon Nitride Cantilevers | Primary sensing element for biofilm imaging | Spring constant: 0.1-5 N/m; Tip radius: <10 nm [8] |
| PFOTS-Treated Substrates | Surface modification for controlled cell attachment | (Perfluorooctyltrichlorosilane) creates hydrophobic surface [10] |
| Mica Disks | Atomically flat substrate for high-resolution imaging | Freshly cleaved surface provides optimal flatness [10] |
| Liquid Imaging Cells | Maintenance of hydrated conditions during scanning | Enables imaging in buffer solutions or growth media [10] |
| Image Analysis Software | Quantitative analysis of topographic and mechanical data | Custom algorithms for large-area stitching and ML-based classification [10] |
| AFM Calibration Grids | Instrument verification and performance validation | Periodic structures with known pitch and height [8] |
Atomic Force Microscopy provides unparalleled capabilities for nanoscale topographical mapping of biofilms, offering significant advantages in quantitative 3D imaging, minimal sample preparation, and operation under physiological conditions. While Environmental SEM offers complementary capabilities for larger-area surveys and elemental analysis, AFM excels at providing quantitative mechanical, electrical, and functional properties at the nanoscale.
The integration of advanced computational methods, including machine learning and automated image analysis, is further enhancing AFM's utility in biofilm research. These developments enable researchers to bridge the scale gap between nanoscale cellular features and millimeter-scale biofilm architecture, providing unprecedented insights into biofilm organization, dynamics, and response to environmental challenges.
For researchers studying biofilm structure and function, AFM represents a powerful tool that complements traditional electron microscopy approaches, particularly when quantitative topographic data, nanomechanical properties, or imaging under native conditions are required. The continuing evolution of AFM technology promises even greater capabilities for understanding and manipulating these complex microbial communities in the future.
The study of complex biological structures like biofilms demands imaging techniques capable of capturing high-resolution details in conditions that preserve native sample structure. For researchers investigating biofilm architecture, the choice between Environmental Scanning Electron Microscopy (ESEM) and Atomic Force Microscopy (AFM) involves critical trade-offs between resolution, environmental control, sample preparation, and operational complexity. ESEM revolutionizes imaging by allowing hydrated, uncoated samples to be examined in their natural state through controlled gaseous environments, overcoming the traditional SEM limitations of high vacuum requirements [15]. Meanwhile, AFM provides exceptional nanoscale resolution of surface properties and mechanical interactions without requiring extensive sample preparation [4] [16]. This guide objectively compares these technologies, providing experimental data and methodologies to help researchers select the optimal approach for their specific biofilm research applications.
Technical Comparison: ESEM vs. AFM for Biofilm Analysis
Table 1: Core Technical Capabilities of ESEM and AFM for Biofilm Research
| Feature | Environmental SEM (ESEM) | Atomic Force Microscopy (AFM) |
|---|---|---|
| Resolution | ~50 nm to 100 nm [17] | Sub-nanometer to molecular scale [4] [16] |
| Sample Environment | Hydrated conditions with controlled pressure and temperature (e.g., 1°C, water vapor) [18] [15] | Ambient, liquid, or controlled environments [4] |
| Sample Preparation | Minimal; no conductive coating required [15] | Minimal; may require surface attachment [4] |
| Key Information | Topography, composition (with EDS), 3D architecture [17] [15] | Topography, mechanical properties (adhesion, stiffness), molecular interactions [4] [16] |
| Max Imaging Area | Several millimeters [17] | Millimeters with automated large-area systems [4] |
| Deep Layer Imaging | Limited surface information | Nanomechanical mapping can infer subsurface properties [16] |
Table 2: Experimental Outputs and Research Applications
| Parameter | ESEM | AFM |
|---|---|---|
| Quantifiable Data | Porosity, particle distribution, thickness [18] | Cellular dimensions, surface roughness, viscoelastic properties [4] [17] |
| Typical Biofilm Findings | 3D organization, Eps structure in hydrated state [18] | Honeycomb patterning, flagellar interactions (20-50 nm height) [4] |
| Dynamic Process Study | Hydration/dehydration cycles, crystallization [18] [15] | Real-time surface attachment, mechanical property changes [16] |
| Complementary Techniques | TEM, EDS, Monte Carlo simulations [18] | Fluorescence microscopy, CLSM, machine learning analysis [4] |
Experimental Protocols for Biofilm Imaging
ESEM Protocol for Hydrated Biofilms
The following protocol, adapted from recent research, enables the acquisition of fast 3D data from hydrated biofilm samples under environmental conditions [18]:
- Sample Preparation: Deposit the biofilm on a suitable substrate (e.g., a 400-mesh TEM copper grid). For liquid samples, a droplet containing the specimen can be placed on the grid.
- Loading and Stabilization: Transfer the sample to a Peltier-cooled stage. For ETEM, place the grid on a cryo-holder and close the protective tab to prevent drying before insertion.
- Environmental Control: Introduce water vapor into the chamber. Precisely adjust the temperature (e.g., to 1°C) and water vapor pressure to maintain a stable hydrated state, following the dew curve of water to prevent condensation or dehydration.
- Eucentric Alignment and Drift Correction: Use automated software (e.g., M-SIS) to perform precise eucentric positioning. Implement a live drift correction algorithm that anticipates and corrects for drift during tilt-series acquisition without a validation step to minimize electron dose.
- Tilt-Series Acquisition: Automatically acquire a series of images over a tilt range (e.g., ±70°) using STEM detectors (Bright-Field and Annular Dark-Field). Control the electron dose precisely to avoid beam damage to the sensitive biofilm material.
- 3D Reconstruction: Process the acquired tilt-series images using tomographic reconstruction software to generate a 3D model of the biofilm structure.
ESEM Tomography Workflow for Hydrated Biofilms
Large-Area Automated AFM Protocol
This protocol leverages machine learning to enable high-resolution imaging of biofilm assembly over millimeter-scale areas, capturing previously obscured spatial heterogeneity [4]:
- Surface Treatment and Inoculation: Treat glass coverslips with PFOTS or other relevant coatings to modify surface properties. Inoculate the surface with the bacterial strain (e.g., Pantoea sp. YR343) in growth medium.
- Incubation and Rinsing: Incubate for selected time points (e.g., 30 minutes for initial attachment). Gently rinse the coverslip to remove unattached (planktonic) cells.
- Drying: Air-dry the sample before imaging. Note that AFM can also be operated in liquid for native state imaging.
- Large-Area Scanning Setup: Initiate the automated large-area AFM system. Define the target millimeter-scale region and set scanning parameters.
- Automated Image Acquisition and Stitching: The system automatically captures multiple high-resolution images across the defined area with minimal overlap. Use machine learning algorithms to seamlessly stitch individual images into a single, large-area map.
- Machine Learning Analysis: Implement automated image segmentation, cell detection, and classification to extract parameters such as cell count, confluency, cell shape, and orientation from the large-area dataset.
Automated Large-Area AFM Workflow for Biofilms
The Scientist's Toolkit: Key Reagent Solutions
Table 3: Essential Research Reagents and Materials
| Item | Function in ESEM | Function in AFM |
|---|---|---|
| Aluminum Hydroxide Gel | Model beam-sensitive, porous hydrogel for methodology validation [18] | - |
| Gold Nanoparticles (10 nm) | Electron-dense tracer to evaluate penetration and distribution within hydrogels [18] | - |
| PFOTS-treated Glass | - | Creates a defined hydrophobic surface for studying bacterial attachment dynamics [4] |
| Pantoea sp. YR343 | - | Model gram-negative, flagellated bacterium for studying early biofilm assembly patterns [4] |
| Magnetotactic Bacteria | Model for studying hydrated, native-state specimens producing intracellular nanoparticles [18] | - |
| L-Aspartic Acid | Used in studies of hydration processes and crystallization inhibition [19] | - |
ESEM and AFM offer complementary strengths for comprehensive biofilm analysis. ESEM excels in visualizing the 3D architecture of hydrated, complex samples in conditions that minimize preparation artifacts, providing crucial insights into native biofilm organization [18] [15]. AFM delivers unparalleled resolution of surface features and nanomechanical properties, enabling the quantification of cellular interactions and material properties critical for understanding biofilm resilience [4] [16]. The choice between these techniques depends fundamentally on the research question: ESEM is ideal for studying holistic 3D structure in hydrated conditions, while AFM is superior for investigating surface morphology, molecular interactions, and mechanical properties. A combined methodological approach, leveraging the strengths of both technologies, provides the most powerful strategy for advancing biofilm structure analysis in drug development and microbiological research.
In the study of biofilm structure analysis, selecting the appropriate imaging technique is critical for obtaining accurate and meaningful data. The choice often centers on the fundamental trade-off between the rich three-dimensional (3D) quantitative data provided by techniques like Atomic Force Microscopy (AFM) and the high-depth-of-field two-dimensional (2D) images from Environmental Scanning Electron Microscopy (ESEM). This guide provides an objective comparison of these methodologies, framing them within the broader context of a research thesis. It is designed to help researchers, scientists, and drug development professionals select the optimal tool for their specific investigative goals, supported by experimental data and detailed protocols.
Atomic Force Microscopy (AFM) is a powerful tool that provides detailed 3D surface topography of biofilms under ambient conditions, yielding quantitative data on physical properties such as surface roughness and mechanical strength [20]. In contrast, Environmental Scanning Electron Microscopy (ESEM) allows for the visualization of biofilms in their hydrated state without extensive sample preparation, producing high-depth-of-field 2D images that excel in showcasing overall biofilm architecture and cell distribution [11]. While both can be used to study biofilms in-situ, their underlying operational principles and data output differ significantly.
The table below summarizes the core differences between these two imaging approaches:
Table 1: Core Technical Differences Between 3D Quantitative and 2D High-DOF Imaging
| Feature | 3D Quantitative Imaging (e.g., AFM) | 2D High-DOF Imaging (e.g., ESEM) |
|---|---|---|
| Primary Data Output | Quantitative 3D height maps and surface parameters [20] | Qualitative or semi-quantitative 2D micrographs with extensive depth of field [11] |
| Dimensional Information | Provides Z-axis height data, enabling volume and roughness calculations [20] | Provides X and Y spatial information; depth is inferred from shadows and perspective |
| Sample Environment | Can be performed in ambient air or liquid conditions [20] | Requires a controlled, humid environment to maintain hydrated samples [11] |
| Key Measurable Parameters | Surface roughness, bacterial cell height/width, EPS capsule thickness, pit depth/diameter, mechanical properties [11] [20] | Qualitative structural organization, cell morphology, and biofilm distribution [11] |
| Resolution | Sub-nanometer vertical resolution; nanometer lateral resolution [20] | High lateral resolution (can reach nanometer level), but no direct Z-axis measurement |
Quantitative Data Comparison
The choice between 3D and 2D imaging has a direct impact on the type and quality of data obtained. AFM's 3D quantitative capability allows for precise measurements of nanoscale features, while ESEM's 2D images offer a broader, in-focus contextual view.
Table 2: Comparison of Quantitative Data Output from AFM and ESEM
| Measurement Parameter | AFM (3D Quantitative) | ESEM (2D High-DOF) |
|---|---|---|
| Surface Roughness | Directly quantified from height data (e.g., RMS, Ra) [11] | Not directly measurable; inferred qualitatively from texture |
| Bacterial Cell Dimensions | Height and width of individual cells measured with nanometer resolution [20] | Width can be measured; height cannot be directly determined from a single image |
| EPS and Flagella | Thickness and width of exopolymeric capsules and flagella can be quantified [11] | Visualized but not easily quantified due to lack of Z-axis data |
| Surface Deterioration | Depth and diameter of individual pits on metal surfaces can be precisely measured [11] | Pits are visible, but depth information is absent |
| Data Structure | Rich, matrix-based data suitable for statistical analysis and 3D modeling | Pixel-based image data suitable for qualitative assessment and 2D morphometry |
Experimental Protocols for Biofilm Analysis
AFM Protocol for 3D Quantitative Analysis
This protocol outlines the procedure for obtaining quantitative 3D surface data from bacterial biofilms using AFM.
- Sample Preparation: Grow a biofilm on a suitable substrate (e.g., a piece of steel or mica). Gently rinse with a buffer solution to remove non-adherent planktonic cells. For imaging in ambient conditions, the sample can be air-dried, though living biofilms can be analyzed in liquid cells [20].
- Instrument Calibration: Calibrate the AFM cantilever using a standard reference sample to ensure accurate force and distance measurements.
- Image Acquisition: Mount the sample on the AFM stage. Select an appropriate cantilever (typically a soft cantilever for biological samples to minimize damage). Operate in contact mode or tapping mode to scan the biofilm surface. Multiple scans over different regions (e.g., 10 μm x 10 μm areas) should be performed to ensure representative data [11].
- Data Processing: Use the AFM's accompanying software to analyze the obtained height images. Apply a flattening algorithm to remove background tilt. From the processed 3D height map, extract quantitative parameters such as:
- Height Distributions: To analyze biofilm quality and uniformity [20].
- Surface Roughness: Calculated as the root mean square (RMS) of height deviations.
- Morphological Metrics: Measure the dimensions (height, width) of bacterial cells and the thickness of extracellular polymeric substances (EPS) [11].
ESEM Protocol for 2D High-Depth-of-Field Imaging
This protocol describes the steps for acquiring high-depth-of-field images of hydrated biofilms using ESEM.
- Sample Preparation: Grow the biofilm on a steel surface (e.g., carbon steel or AISI 316 stainless steel) under stagnant conditions [11]. Do not dehydrate or coat the sample with conductive materials, as ESEM allows for the observation of hydrated specimens.
- Chamber Stabilization: Place the sample in the ESEM chamber. Carefully introduce water vapor to achieve a chamber pressure that maintains a stable hydration state (typically several torr). The temperature of the sample stage is controlled to precisely manage condensation and evaporation rates.
- Image Acquisition: Use a low accelerating voltage (typically 10-30 kV) to minimize sample damage. Adjust the pressure and temperature to find the "hydration equilibrium" where the biofilm remains hydrated without excessive water condensation. Capture micrographs at various magnifications to visualize the overall biofilm architecture and individual cells [11].
- Post-Processing: The resulting images are 2D micrographs. While they provide excellent depth of field, quantitative analysis is limited to 2D metrics (e.g., projected surface area coverage, cell counting) unless stereo-pair imaging is employed for 3D reconstruction.
Workflow and Logical Relationships
The following diagram illustrates the decision-making workflow and the distinct logical pathways for data acquisition and analysis when using AFM versus ESEM for biofilm research.
The Scientist's Toolkit: Essential Research Reagents & Materials
Successful biofilm imaging requires specific materials and reagents. The following table lists key items used in the featured experimental protocols.
Table 3: Essential Research Reagents and Materials for Biofilm Imaging
| Item | Function/Description | Primary Use Case |
|---|---|---|
| Carbon Steel / Stainless Steel (AISI 316) Surfaces | Common substrates for growing biofilms under stagnant conditions, allowing study of biofilm-metal interactions and surface deterioration [11]. | AFM, ESEM |
| Mica Substrates | An atomically flat, inert surface ideal for high-resolution AFM imaging of individual bacterial cells and initial adhesion studies [11]. | AFM |
| Ciprofloxacin | A broad-spectrum antibiotic used in research to study the effects of antimicrobial agents on biofilm surface topography and integrity [20]. | AFM (treatment studies) |
| Cantilevers (AFM Probes) | Microscopic tips on a cantilever that physically probe the sample surface. Soft cantilevers are used for biological samples to prevent damage [20]. | AFM |
| Buffer Solutions (e.g., PBS) | Used to gently rinse biofilm samples, removing non-adherent cells while preserving the structural integrity of the biofilm matrix. | AFM, ESEM |
| Culture Media for SRB / Acidophilic Bacteria | Specific nutrient media required to grow and maintain the biofilms of study organisms, such as sulfate-reducing bacteria (SRB) or mixed acidophilic populations [11]. | Biofilm Cultivation |
Practical Protocols: Applying AFM and ESEM to Biofilm Research
In the study of biofilm structure, researchers often face a critical choice between advanced microscopy techniques, primarily Atomic Force Microscopy (AFM) and Environmental Scanning Electron Microscopy (ESEM). Each method offers distinct advantages and limitations, but the quality of the final data is profoundly influenced by the sample preparation pathway chosen. Proper sample preparation is not merely a preliminary step; it is the foundation for obtaining biologically relevant, artifact-free data. This guide provides a detailed comparison of AFM and ESEM for biofilm research, focusing specifically on methodologies that minimize preparation-induced artifacts across different imaging environments. By presenting standardized protocols and quantitative comparisons, we aim to equip researchers with the knowledge to select appropriate techniques and optimize preparation workflows for their specific biofilm studies, particularly in pharmaceutical and biomedical applications where preserving native biofilm physiology is paramount.
Fundamental Technique Comparison: AFM vs. ESEM
AFM and ESEM operate on fundamentally different physical principles, which dictates their respective sample preparation requirements and analytical capabilities. AFM employs a physical probe to scan surfaces and measure tip-sample interactions, producing three-dimensional topographical data with exceptional vertical resolution [21]. Crucially, AFM can operate in various environments—including air, vacuum, and liquid—enabling imaging of hydrated biological samples in near-physiological conditions [21] [22]. This versatility significantly reduces the need for extensive sample manipulation that might alter native biofilm architecture.
In contrast, ESEM utilizes a focused electron beam for surface imaging, generating detailed two-dimensional projections of surface morphology [21] [22]. While traditional SEM requires high vacuum and conductive coatings, ESEM allows for imaging under controlled humidity conditions, reducing some preparation requirements for hydrated samples. However, even ESEM may still necessitate specific sample stabilization to prevent structural collapse under electron beam examination [11].
Table 1: Core Technical Characteristics of AFM and ESEM
| Parameter | Atomic Force Microscopy (AFM) | Environmental SEM (ESEM) |
|---|---|---|
| Resolution | Sub-nanometer vertical, <1-10 nm lateral [21] | 1-10 nm lateral [21] |
| Imaging Environment | Vacuum, air, or liquid (full physiological buffer) [21] [22] | Controlled pressure and humidity [11] |
| Dimensional Data | True 3D topography (X, Y, Z coordinates) [22] | 2D projection image [22] |
| Sample Preparation Complexity | Minimal to moderate (see Sections 3.1 & 4.1) | Moderate to high (see Sections 3.2 & 4.2) |
| Primary Artifact Sources | Tip convolution, improper immobilization, force-induced deformation | Dehydration, conductive coating, structural collapse |
| Quantitative Mechanical Data | Yes (nanomechanical mapping) [23] [24] | No |
Figure 1: Biofilm Imaging Decision Workflow. This diagram outlines the fundamental preparation pathways for analyzing biofilm structures using AFM (in liquid or air) and ESEM, highlighting the key steps that influence artifact formation.
Experimental Protocols for Artifact Minimization
AFM in Liquid: Preserving Native Physiological Conditions
Imaging biofilms in liquid by AFM preserves their native state and provides unparalleled insight into structural and mechanical properties under physiological conditions. The following protocol, adapted from studies on Pseudomonas aeruginosa aggregates, ensures minimal disturbance to the biofilm architecture [23].
Detailed Protocol:
- Sample Immobilization: Use poly-L-lysine-coated glass slides or mica substrates. Prepare the coating by applying a 0.1% (w/v) aqueous poly-L-lysine solution to a clean substrate for 15 minutes, followed by rinsing with deionized water and air drying.
- Biofilm Transfer: Gently transfer the biofilm aggregate from culture medium (e.g., Synthetic Cystic Fibrosis Sputum Medium - SCFM2) onto the coated substrate. Avoid pipetting that creates high shear forces; instead, use a wide-bore pipette tip or carefully submerge the substrate into the culture.
- Rinsing: To remove loosely attached planktonic cells, immerse the substrate gently in a compatible isotonic buffer (e.g., phosphate-buffered saline, PBS). Perform this step with minimal agitation to prevent disruption of the aggregate structure.
- AFM Imaging: Mount the sample in the AFM liquid cell and immerse in the appropriate buffer. Employ AFM modes that minimize applied force, such as PeakForce Tapping or quantitative imaging modes, using soft cantilevers (spring constants of 0.06–0.1 N/m) with spherical colloidal probes to reduce local pressure and prevent sample damage [23] [24].
Key Artifact Minimization Strategies:
- Probe Selection: Spherical colloidal probes (radius ~2.5 µm) provide well-defined geometry and reduce indentation pressure on soft biological samples compared to sharp pyramidal tips, thereby minimizing deformation [24].
- Force Control: Maintain the maximum applied force below 5 nN for ultra-soft biofilms and below 30 nN for more developed structures to avoid mechanical distortion [24].
- Hydration Maintenance: Imaging in a liquid cell prevents dehydration artifacts, allowing observation of the biofilm's true hydrated architecture and enabling the measurement of nanomechanical properties like elastic modulus in a native-like state [23].
AFM in Air: Balancing Convenience and Structural Integrity
AFM imaging in air can be a practical alternative, though it introduces the risk of dehydration artifacts. The protocol focuses on drying techniques that preserve structural integrity.
Detailed Protocol:
- Immobilization: Immobilize the biofilm on a suitable solid substrate (e.g., PFOTS-treated glass, mica, or steel) as described for liquid imaging [4] [11].
- Controlled Rinsing: Gently rinse the sample with a volatile buffer (e.g., ammonium acetate) or deionized water to remove culture salts that could form crystalline artifacts upon drying.
- Critical Point Drying (CPD): This is the gold-standard method. Dehydrate the sample through a graded ethanol or acetone series (e.g., 30%, 50%, 70%, 90%, 100%, 100%), with 15-minute incubations at each step. Then, transfer the sample to a critical point dryer using liquid CO₂ as the transition fluid to remove the dehydrant without subjecting the biofilm to destructive surface tension forces.
- AFM Imaging: Mount the dried sample on the AFM stage. When imaging in air, static charge can sometimes be an issue; using a sharp tip (nominal radius <10 nm) and standard tapping mode can provide high-resolution topographical data of the dried structure.
Key Artifact Minimization Strategies:
- Critical Point Drying: CPD is crucial for preventing the collapse of delicate extracellular polymeric substances (EPS) and cellular structures caused by the surface tension of receding water during air-drying [4].
- Alternative: Controlled Air-Drying: If CPD is unavailable, allow the sample to dry slowly in a humidified chamber. While this is less effective than CPD, it can still mitigate some of the rapid collapse associated with fast drying.
ESEM Preparation for Biofilms
ESEM reduces the vacuum constraints of conventional SEM, but careful preparation remains essential to stabilize the biofilm for electron beam imaging.
Detailed Protocol:
- Chemical Fixation: Stabilize the biofilm's microstructure by applying a primary fixative such as 2.5% glutaraldehyde in a 0.1 M sodium cacodylate buffer (pH 7.4) for a minimum of 2 hours at 4°C.
- Rinsing and Post-Fixation: Rinse the sample several times with the same buffer to remove excess fixative. Optionally, apply a secondary fixative (1% osmium tetroxide) for 1 hour to enhance contrast and further stabilize lipids.
- Dehydration: Gradually dehydrate the sample using a graded ethanol series (e.g., 30%, 50%, 70%, 80%, 90%, 100%, 100%), allowing 10-15 minutes per step.
- ESEM Imaging: Transfer the fixed and dehydrated sample to the ESEM chamber. The chamber can maintain a water vapor pressure that helps reduce charging effects, allowing for imaging of uncoated or lightly coated samples. However, for high-resolution imaging, a thin (several nanometers) conductive coating of gold/palladium may still be necessary.
Key Artifact Minimization Strategies:
- Gentle Fixation: Proper fixation is critical to prevent shrinkage or swelling of cells and the EPS matrix. Using a buffered fixative at a cool temperature helps preserve native morphology.
- Minimizing Coating: Leverage the ESEM's hydrated imaging mode to avoid conductive coatings, which can obscure ultrafine details like flagella or pore structures in the EPS. If coating is unavoidable, use a very thin, uniform layer [11].
Comparative Experimental Data and Applications
Quantitative Data Comparison
The choice of imaging technique and preparation method directly impacts the quantitative data extracted from biofilms, particularly measurements of topography and mechanical properties.
Table 2: Measurable Parameters in Biofilm Research: AFM vs. ESEM
| Parameter | AFM in Liquid | AFM in Air (with CPD) | ESEM |
|---|---|---|---|
| Surface Roughness (Ra) | Yes (quantitative, nm) [25] | Yes (quantitative, nm) [11] | Qualitative assessment only |
| Cell Dimensions | Yes (accurate height/width) [4] | Yes (potentially shrunk) [11] | Yes (lateral dimensions only) [11] |
| Elastic (Young's) Modulus | Yes (0.1 kPa - MPa range) [23] [24] | No (sample is rigid) | No |
| EPS & Flagella Visualization | Excellent (e.g., ~20-50 nm flagella) [4] | Good (if properly dried) [4] | Moderate (can be obscured by coating) [11] |
| Nanoscale Pitting on Metals | Indirect (via topography) | Excellent (quantitative depth profile) [11] | Good (qualitative) [11] |
Notable experimental findings include:
- Mechanical Properties: AFM force spectroscopy on P. aeruginosa aggregates in liquid revealed a significantly higher average elastic modulus (218.7 ± 118.7 kPa) compared to individual planktonic cells (50.8 ± 35.8 kPa), highlighting the mechanical resilience of multicellular structures [23].
- High-Resolution Structure: Large-area AFM of Pantoea sp. YR343 in air (after preparation) visualized not only cellular arrangements but also flagellar structures approximately 20-50 nm in height, forming intricate networks between cells [4].
- Surface Corrosion: AFM topography of stainless steel surfaces after biofilm removal provided quantitative measurements of pit depth and diameter, directly linking biofilm activity to metal deterioration [11].
The Scientist's Toolkit: Essential Research Reagents
Successful sample preparation relies on a set of key materials and reagents, each serving a specific function to preserve biofilm structure.
Table 3: Essential Reagents for Biofilm Preparation for AFM and ESEM
| Reagent / Material | Function | Application Context |
|---|---|---|
| Poly-L-Lysine | A positively charged polymer that promotes adhesion of negatively charged bacterial cells to substrates like glass and mica. | AFM sample immobilization in liquid and air [23]. |
| PFOTS-Treated Glass | A silanized glass surface that is highly hydrophobic, used to study biofilm formation on specific surface chemistries. | AFM sample immobilization [4]. |
| Glutaraldehyde | A cross-linking fixative that stabilizes protein structures and the overall architecture of the biofilm. | Primary fixation for ESEM and sometimes for AFM in air [11]. |
| Critical Point Dryer | An instrument that removes liquid from a sample without crossing the liquid-vapor phase boundary, preventing collapse. | Essential preparation step for high-resolution AFM in air. |
| Spherical Colloidal Probes | AFM tips with a micrometric spherical particle attached; reduce local pressure on soft samples for reliable mechanical testing. | AFM force spectroscopy in liquid on soft biofilms and aggregates [24]. |
| Soft Cantilevers (0.01-0.1 N/m) | Cantilevers with low spring constants; enable imaging and force measurement on soft samples with minimal indentation force. | AFM in liquid and on soft biological samples [23] [24]. |
Figure 2: Artifact Identification and Mitigation Strategy Map. This troubleshooting diagram links common artifacts encountered in biofilm imaging with practical solutions to minimize them.
The selection between AFM and ESEM for biofilm structure analysis is not a matter of identifying a superior technique, but rather of choosing the right tool for specific research questions. AFM, particularly when performed in liquid, is unparalleled for studies requiring quantitative nanomechanical data and high-resolution topography of biofilms in a hydrated, near-native state. Its minimal sample preparation workflow is a significant advantage for preserving native architecture. Imaging in air with AFM, especially after CPD, offers a robust alternative for high-resolution topological analysis when liquid imaging is not feasible.
ESEM provides valuable insights into biofilm morphology in a pseudo-hydrated state and can handle larger, more complex samples. However, it requires more extensive preparation and does not provide direct mechanical property data or true 3D topography. Ultimately, the most effective research strategy may often involve a complementary use of both techniques, leveraging their respective strengths to build a comprehensive understanding of biofilm structure and function. By adhering to the detailed preparation protocols outlined in this guide, researchers can significantly minimize artifacts and generate reliable, high-quality data to advance drug development and microbiological research.
For researchers investigating the intricate architecture of biofilms and hydrogels, preserving native hydration is arguably the most critical and challenging step in sample preparation. The structural integrity of these delicate, water-laden biological matrices is entirely dependent on their aqueous environment. Conventional scanning electron microscopy (SEM) requires a high-vacuum environment and extensive sample preparation, including complete dehydration, chemical fixation, and conductive coating. These processes inevitably introduce artifacts, such as shrinkage, collapse, or cracking, which distort the very structures researchers aim to study [26] [27]. This limitation created a pressing need for a technology that could bridge the gap between the vacuum requirements of electron optics and the hydrated reality of biological samples. Environmental Scanning Electron Microscopy (ESEM) emerged as a powerful solution, enabling the direct observation of wet, uncoated, and insulating materials by maintaining a controlled gaseous environment in the specimen chamber [28]. This guide provides a detailed, objective comparison of ESEM sample preparation, framing it within the broader context of a research toolkit that includes Atomic Force Microscopy (AFM) for biofilm analysis.
Theoretical Foundation: How ESEM Manages Hydrated Samples
The core innovation of ESEM lies in its ability to operate with a significant pressure of gas in the sample chamber, typically a few torr of water vapor, while the electron gun remains at high vacuum [27]. This environment is the key to managing hydration without resorting to destructive dehydration protocols.
The Pressure-Limiting Aperture System
A system of pressure-limiting apertures maintains the pressure differential between the high-vacuum gun area and the higher-pressure sample chamber. This allows the primary electron beam to reach the sample with minimal scattering.
Gas Ionization for Signal Amplification and Charge Neutralization
The environmental gas, often water vapor, plays multiple crucial roles. When the primary electron beam strikes the sample, it generates secondary electrons (SE). These SE collide with gas molecules, which ionize and create a cascade of additional electrons and positive ions. This cascade amplifies the SE signal, which is then collected by a specialized detector. Furthermore, the positive ions are drawn to any negatively charged (non-conductive) areas on the sample, effectively neutralizing charge buildup. This eliminates the need for a conductive metal coating on insulating samples like biofilms [28] [27].
Precise Control of Hydration State
The sample temperature and water vapor pressure can be precisely controlled to maintain the sample in a fully hydrated state. By carefully varying these two parameters, the experimenter can create conditions of 100% relative humidity at the sample surface, preventing water loss. Conversely, the conditions can be manipulated to study dynamic processes like controlled drying or re-hydration in situ [29].
Experimental Protocols: Key Methodologies for ESEM Hydration Management
Several established protocols enable researchers to leverage ESEM for hydrated sample analysis. The following are key methodologies cited in the literature.
The Extended Low-Temperature Method (ELTM) for Plant and Biofilm Samples
This protocol, developed for delicate plant tissues but highly applicable to susceptible biofilms, stabilizes samples without chemical intervention.
- Objective: To stabilize a highly hydrated sample for high-resolution observation in ESEM and enable its transfer to atmospheric pressure for storage or further analysis without structural collapse.
- Materials: Fresh sample, ESEM with a Peltier cooling stage.
- Procedure: [29]
- Initial Stabilization: The fresh, hydrated sample is placed on the cooled stage. The chamber is pumped down to approximately 200 Pa while the stage is simultaneously cooled to -20°C. This simultaneous cooling and pumping removes surface water via sublimation while preserving internal hydration.
- Imaging: The now-stabilized sample can be imaged at higher resolution than a fully wet sample, with increased resistance to electron beam damage.
- Transfer Preparation (The "Extended" Step): To vent the chamber and retrieve the sample, the chamber pressure is first slowly decreased to its minimum (∼10 Pa). The sample temperature is then gradually raised to room temperature. This slow, step-wise process removes residual water from the sample's inner structure, preventing the destructive forces of surface tension that would occur if the sample were vented while still fully hydrated.
- Supporting Data: A study imaging Oxalis acetosella leaves showed that while the fully hydrated state in ESEM was prone to beam damage and collapse at high magnification, the same sample after ELTM preparation exhibited minimal morphological changes and allowed high-resolution imaging of delicate wax structures [29].
Direct Hydration Control for Dynamic In-Situ Studies
This approach leverages the ESEM's environmental control to observe processes in real-time.
- Objective: To observe the response of a biofilm or hydrogel to changing humidity or the introduction of solutions.
- Materials: Hydrated sample, ESEM with precise temperature and gas pressure control.
- Procedure: [28]
- The sample is introduced in a hydrated state.
- The water vapor pressure and sample temperature are set to maintain 100% relative humidity, as confirmed by the presence of a stable meniscus on water droplets.
- To initiate a controlled drying experiment, the temperature can be incrementally raised or the chamber pressure slowly lowered. The structural response of the biofilm matrix (e.g., shrinkage, folding, crack formation) can be recorded in real-time.
- Application: This method is invaluable for studying the mechanical stability of biofilms under osmotic stress or the swelling/deswelling behavior of synthetic hydrogels.
Comparative Analysis: ESEM vs. AFM and Conventional SEM for Biofilm Research
To objectively position ESEM within the scientist's toolkit, its performance must be compared against primary alternatives. The following table and analysis provide a direct comparison based on key performance metrics.
Table 1: Technical Comparison of AFM, ESEM, and Conventional SEM for Biofilm Analysis
| Feature | Atomic Force Microscopy (AFM) | Environmental SEM (ESEM) | Conventional SEM |
|---|---|---|---|
| Resolution | Sub-nanometer [14] | Nanometer-range (lower than SEM in high vacuum) [27] | Sub-nanometer to a few nanometers [14] |
| Sample Environment | Vacuum, air, or liquid (full physiological conditions) [14] [30] | Hydrated vapor environment (∼100% RH) or low vacuum [28] | High vacuum only [30] |
| Sample Preparation | Minimal (immobilization on substrate); no coating [14] [4] | Minimal (no dehydration or coating typically needed) [28] | Extensive (dehydration, chemical fixation, conductive coating) [26] [31] |
| Dimensional Data | True, quantitative 3D topography with sub-nanometer Z-resolution [30] | 2D projection with qualitative 3D appearance due to shadowing; no direct height measurement [30] | 2D projection; no intrinsic height data [30] |
| Key Artifacts | Tip convolution, potential sample damage from tip force [4] | Possible beam damage, slight structural changes from initial stabilization [29] | Major artifacts: shrinkage, collapse, and extraction from dehydration [26] |
| Additional Capabilities | Nanomechanical mapping (stiffness, adhesion), molecular recognition [4] | Elemental analysis via EDS is possible [28] | High-resolution elemental analysis and mapping (EDS/WDS) [30] |
Performance Comparison and Data Interpretation
The data in Table 1 reveals a clear trade-off between fidelity to native conditions and ultimate resolution or analytical power.
- Preservation of Native Structure: AFM and ESEM are superior to conventional SEM for this critical parameter. AFM achieves this by operating in liquid, and ESEM by maintaining a hydrating gas environment. Conventional SEM, by necessity, destroys the native hydrated structure during preparation. One study on alginate hydrogels noted that freeze-drying for conventional SEM could alter pore size and overall architecture, while ESEM was identified as a way to avoid such shrinkage artifacts [26].
- Resolution and Information Depth: Conventional high-vacuum SEM generally offers the highest potential resolution for surface details. ESEM resolution is compromised slightly by electron beam scattering in the chamber gas but remains sufficient to resolve bacterial cells and fine matrix structures [27]. AFM provides the highest Z-axis resolution for surface topography but cannot image subsurface features.
- Analytical Flexibility: Conventional SEM and ESEM are coupled with Energy-Dispersive X-ray Spectroscopy (EDS) for elemental analysis—a capability AFM lacks. Conversely, AFM is unparalleled in its ability to measure a wide range of nanomechanical and physical properties (e.g., elasticity, adhesion forces) under physiological conditions [4] [30].
Integrated Workflow: Selecting the Right Tool for Biofilm Research
The choice between AFM, ESEM, and SEM is not a matter of identifying a single "best" technique, but of selecting the most appropriate tool based on the specific research question. The following diagram illustrates a logical workflow for technique selection.
The Scientist's Toolkit: Essential Reagents and Materials for ESEM
Successful ESEM analysis of hydrated biofilms requires access to specific laboratory equipment and materials. The following table details key solutions for this field.
Table 2: Essential Research Reagent Solutions for ESEM Biofilm Studies
| Item | Function | Application Notes |
|---|---|---|
| Peltier Cooling Stage | Precise control of sample temperature. | Fundamental for ESEM. Allows for stabilization of hydrated samples by controlling condensation and evaporation rates [29]. |
| Hydration Cell / Capsule | Encloses sample with humid environment. | Some systems use specialized capsules to maintain hydration, acting as a mini-environment [27]. |
| Conductive Adhesive Tabs | Secures sample to stub. | Essential for creating a reliable electrical path to ground, mitigating charging on non-conductive samples. |
| Water Vapor Gas Supply | Provides the environmental gas for the chamber. | High-purity water is used to generate the vapor that enables the imaging of hydrated samples and charge neutralization. |
| ELTM-Compatible Sample Stubs | Holds sample during in-situ preparation. | Standard aluminum or copper stubs are used, but must be compatible with the cooling stage and the entire preparation protocol [29]. |
The development of ESEM and its associated sample preparation protocols, such as the ELTM, has fundamentally advanced our ability to characterize hydrated soft materials like biofilms. By managing hydration without destructive dehydration, ESEM provides a critical window into the native-state architecture of these complex systems. When viewed within the broader scientific toolkit, ESEM occupies a unique niche, complementing the quantitative nanomechanical power of AFM and the high-resolution analytical capabilities of conventional SEM. The choice of technique is not mutually exclusive; a correlative approach using multiple methods often yields the most comprehensive understanding. For the researcher aiming to visualize biofilm structure as it exists in a hydrated, functioning state, ESEM is an indispensable and powerful technology.
In the critical field of biofilm research, understanding microbial community structure and function at the nanoscale is paramount for addressing challenges in healthcare and drug development. Atomic Force Microscopy (AFM) and Environmental Scanning Electron Microscopy (ESEM) have emerged as two powerful, yet fundamentally different, techniques for visualizing and analyzing these complex biological systems. While ESEM allows for the observation of hydrated samples in a low-vacuum environment, providing high-resolution images of biofilm topography, its resolution (typically >50 nm) and capability remain outmatched by AFM for mechanical property mapping [5] [31]. AFM operates by scanning a sharp probe across a surface to measure interatomic forces, enabling it to reconstruct topographical images with sub-nanometer resolution under physiological conditions without requiring extensive sample preparation [4] [32]. This unique capability allows researchers to not only visualize biofilm morphology but also quantitatively map nanomechanical properties such as stiffness, adhesion, and viscoelasticity – critical parameters influencing biofilm resilience and drug resistance [33] [34]. This guide objectively compares the performance of these two techniques through experimental case studies, providing researchers with the data necessary to select the appropriate methodology for their specific biofilm analysis challenges.
Experimental Comparison: Technique Fundamentals and Performance Metrics
The fundamental differences between AFM and ESEM begin with their underlying operating principles, which directly dictate their application range, resolution capabilities, and the types of data they can generate. The table below summarizes the core characteristics of each technique:
Table 1: Fundamental Comparison of AFM and ESEM Techniques
| Parameter | Atomic Force Microscopy (AFM) | Environmental SEM (ESEM) |
|---|---|---|
| Operating Principle | Measures force between sharp probe and sample surface [32] | Scans focused electron beam; detects emitted electrons in a gaseous environment [5] |
| Key Measurables | Topography, nanomechanical properties (elasticity, adhesion), surface charges [32] [34] | Topography, surface texture, ultrastructural details [5] |
| Resolution | Sub-nanometer to nanometer lateral resolution [32] | Typically >50 nm resolution [5] |
| Sample Environment | Air or liquid (physiological conditions possible) [4] [32] | Low vacuum (hydrated samples possible) [5] |
| Sample Preparation | Minimal; often requires only immobilization [35] | Less extensive than conventional SEM but may still require staining [5] |
| Primary Advantages | Nanomechanical mapping, quantitative force measurement, works under physiological conditions [33] | Good for hydrated samples, provides high-resolution overview images, faster large-area imaging [5] |
The choice between these techniques is further clarified by a direct comparison of their performance in key analytical categories relevant to biofilm research:
Table 2: Performance Comparison for Biofilm Analysis
| Analysis Category | AFM Performance & Output | ESEM Performance & Output |
|---|---|---|
| Topographical Imaging | 3D surface reconstruction with nanometer Z-resolution; reveals individual cells and fine appendages [4] | High-resolution 2D images with great depth of field; reveals overall biofilm architecture [5] |
| Nanomechanical Property Mapping | Excellent. Directly measures elasticity (Young's modulus), adhesion forces, and viscoelasticity via force-distance curves [34] | Not Possible. Provides no direct mechanical property data [31] |
| Chemical/Specific Identification | Possible with functionalized tips (chemical functional groups), but not inherent [32] | Can be combined with Energy Dispersive X-ray Spectroscopy (EDX) for elemental analysis [31] |
| Real-Time Dynamics in Liquid | Excellent. Capable of tracking dynamic processes like antimicrobial action over time in fluid [33] | Limited. Although hydrated, true real-time studies in liquid are challenging [5] |
Case Study 1: Unveiling Early Biofilm Assembly with Large-Area AFM
Experimental Protocol and Methodology
A groundbreaking 2025 study utilized an automated large-area AFM approach to overcome the traditional limitation of small scan areas (<100 µm), enabling high-resolution imaging over millimeter-scale areas to capture the spatial heterogeneity of early biofilm formation [4].
Key Steps in the Experimental Protocol:
- Surface Preparation: Glass coverslips were treated with PFOTS (1H,1H,2H,2H-Perfluorooctyltriethoxysilane) to create a defined surface for bacterial attachment [4].
- Bacterial Culture and Inoculation: The gram-negative bacterium Pantoea sp. YR343, known for its plant-growth-promoting properties and ability to form biofilms, was grown in a liquid growth medium. Petri dishes containing the prepared coverslips were inoculated with the bacterial culture [4].
- Sample Harvesting: At selected time points (e.g., ~30 minutes and 6-8 hours post-inoculation), coverslips were gently removed from the petri dish, rinsed to remove unattached (planktonic) cells, and air-dried prior to imaging [4].
- Automated Large-Area AFM Imaging: An AFM system with automated stage control was used to capture multiple contiguous high-resolution images over a millimeter-sized area. These images were seamlessly stitched together using machine learning algorithms [4].
- Data Analysis: Machine learning-based image segmentation and analysis tools were employed to automatically extract quantitative parameters such as cell count, confluency, cell shape, and orientation from the large-area AFM datasets [4].
Key Findings and Data Output
This methodology yielded unprecedented insights into the early stages of biofilm development:
- Cellular Morphology: AFM imaging confirmed rod-shaped Pantoea cells with dimensions of approximately 2 µm in length and 1 µm in diameter [4].
- Visualization of Flagella: The high resolution of AFM enabled clear visualization of flagellar structures, measuring ~20–50 nm in height and extending tens of micrometers across the surface. Control experiments with a flagella-deficient strain confirmed the identity of these appendages [4].
- Spatial Organization: After 6-8 hours of growth, cells formed clusters with a distinctive honeycomb pattern. AFM revealed that flagellar structures were bridging gaps between cells, suggesting a role in cellular coordination beyond initial surface attachment [4].
Table 3: Quantitative Data from Large-Area AFM Study of Pantoea sp. YR343 [4]
| Parameter | Measured Value | Significance |
|---|---|---|
| Cell Dimensions | ~2 µm (length) x ~1 µm (diameter) | Provides baseline morphological data for individual cells. |
| Flagella Height | 20 – 50 nm | Demonstrates AFM's capability to resolve nanoscale biological structures. |
| Spatial Pattern | Honeycomb-like clusters | Reveals a previously obscured level of organization in early biofilm assembly. |
Diagram 1: Large-Area AFM Workflow.
Case Study 2: Quantifying Drug-Biofilm Interactions via AFM Nanomechanics
Experimental Protocol and Methodology
AFM's ability to function as a force spectrometer makes it ideal for quantifying the effects of therapeutic compounds on biofilms. A 2023 study investigating the antivirulent properties of phytochemicals against multidrug-resistant (MDR) bacteria provides an excellent example [36].
Key Steps in the Experimental Protocol:
- Biofilm Growth: Biofilms of pathogenic bacteria such as Staphylococcus aureus, Streptococcus pyogenes, and Pseudomonas aeruginosa were grown on appropriate substrates [36].
- Phytochemical Treatment: Mature biofilms were treated with potential anti-biofilm agents, such as the phytochemicals guanosine and phytol, at a specific concentration (e.g., 0.250 mg/mL) [36].
- AFM Topographical Imaging: Tapping mode AFM in air or liquid was used to image the topography of treated and untreated (control) biofilms. This mode was chosen to minimize lateral forces that could damage soft biological samples [32] [36].
- Force Spectroscopy Measurements: The AFM tip was used to perform force-distance curves on the biofilm surface. By measuring the cantilever's deflection as the tip approaches and retracts from the surface, these curves provide information on the sample's elastic modulus (Young's modulus) and adhesion forces [32] [34].
- Data Correlation: Topographical changes observed in AFM images were correlated with alterations in mechanical properties derived from force spectroscopy to build a comprehensive picture of the treatment's effect [36].
Key Findings and Data Output
This approach provided quantitative and visual evidence of the anti-biofilm activity:
- Topographical Disruption: AFM topographical imaging showed that guanosine significantly disrupted the integrity of the biofilm structures of S. aureus, S. pyogenes, and P. aeruginosa [36].
- Altered Mechanical Properties: Force spectroscopy measurements on the treated biofilms would typically reveal changes in elasticity and adhesion, indicating a breakdown of the structural integrity provided by the extracellular polymeric substance (EPS) [34].
- Synergy with SEM: The study complemented AFM data with SEM imaging, which provided broader, high-resolution views of the disrupted biofilm architecture, validating the AFM findings [36].
Table 4: AFM Applications in Assessing Anti-Biofilm Drug Actions [33] [36] [34]
| Application | AFM Measurement | Typical Outcome/Data |
|---|---|---|
| Morphological Change | High-resolution topographic imaging | Visualization of membrane damage, cell shrinkage, or EPS disruption. |
| Stiffness Change | Young's Modulus from force curves | Altered elasticity indicates compromised structural integrity. |
| Adhesion Change | Adhesion force from force curves | Reduced adhesion may correlate with decreased surface attachment. |
The Scientist's Toolkit: Essential Reagents and Materials
Successful execution of AFM or ESEM biofilm studies requires specific materials and reagents. The following table details key items and their functions in the featured experiments.
Table 5: Research Reagent Solutions for AFM Biofilm Studies
| Item | Function/Application | Experimental Context |
|---|---|---|
| PFOTS-Treated Substrata | Creates a defined, hydrophobic surface to promote and study controlled bacterial attachment [4]. | Used in the large-area AFM study of Pantoea sp. YR343 early attachment [4]. |
| Functionalized AFM Tips | Cantilevers with chemically modified tips (e.g., with specific ions or molecules) to measure specific binding forces or surface properties [32]. | Used in advanced AFM modes to probe ligand-receptor interactions or map chemical heterogeneity [32]. |
| Guanosine & Phytol | Natural phytochemicals investigated for their anti-biofilm properties against multidrug-resistant pathogens [36]. | Applied as therapeutic agents to treat mature biofilms, with effects quantified by AFM and SEM [36]. |
| Flagella-Deficient Mutant Strains | Genetically modified control bacteria used to confirm the identity of observed nanostructures as flagella [4]. | Served as a critical control in the Pantoea study to validate AFM identification of flagellar appendages [4]. |
Integrated Workflow: Combining AFM and ESEM for Comprehensive Analysis
While AFM and ESEM are powerful individually, an integrated approach leverages the strengths of both to provide a more comprehensive understanding of biofilm structure and function. The following workflow outlines a synergistic protocol:
Diagram 2: Correlative AFM-ESEM Analysis.
Synergistic Protocol:
- Parallel Sample Preparation: Prepare identical biofilm samples on suitable substrates (e.g, glass chips compatible with both techniques).
- ESEM for Architectural Context: First, image the samples using ESEM. This provides a high-resolution, broad-field overview of the biofilm's 3D architecture, revealing large-scale features like water channels, mushroom-shaped structures, and overall distribution [5] [35].
- AFM for Nanoscale Functional Analysis: Use AFM to analyze equivalent regions of interest identified by ESEM. AFM delivers:
- Data Correlation and Interpretation: Overlay or correlate the datasets. The ESEM image provides the spatial context to correctly interpret the AFM mechanical maps. For instance, a region appearing dense in ESEM can be confirmed as mechanically rigid by AFM, linking structure directly to function [31].
The experimental data and case studies presented in this guide clearly delineate the applications of AFM and ESEM in biofilm research. ESEM excels as a tool for rapid, high-resolution architectural imaging, providing essential overviews of biofilm topography and ultrastructure with minimal sample preparation compared to conventional SEM [5]. AFM, however, is unparalleled in its capacity for functional nanomechanical characterization, operating under physiological conditions to quantify properties like elasticity and adhesion that are fundamental to biofilm resilience and drug response [33] [34].
For researchers and drug development professionals, the choice is not necessarily binary. For comprehensive analysis, an integrated approach that leverages ESEM for broad structural context and AFM for detailed functional probing at the nanoscale offers the most powerful path forward. This synergistic methodology promises to accelerate our understanding of biofilm dynamics and enhance the development of targeted anti-biofilm therapies.
Biofilms, complex microbial communities encased in a self-produced extracellular polymeric substance (EPS), are a major focus of research due to their significant impact in medical, industrial, and environmental contexts. Their resilience against antibiotics and disinfectants is a primary concern in healthcare, driving the need for advanced imaging techniques that can reveal their intricate structure and composition. Among the most powerful tools for this task are Environmental Scanning Electron Microscopy (ESEM) and Atomic Force Microscopy (AFM). This guide provides an objective comparison of these two technologies, framing their performance within the broader thesis of AFM vs. ESEM for biofilm structure analysis, and is supported by experimental data and protocols relevant to researchers and drug development professionals.
AFM vs. ESEM: A Technical Showdown for Biofilm Imaging
The choice between AFM and ESEM is pivotal and depends on the specific research questions. The table below summarizes their core operational differences.
Table 1: Fundamental Comparison of AFM and ESEM for Biofilm Research
| Feature | Atomic Force Microscopy (AFM) | Environmental SEM (ESEM) |
|---|---|---|
| Operating Principle | A physical probe (tip) scans the surface, measuring mechanical forces [4] [14]. | A focused electron beam scans the sample; emitted electrons create the image [5] [14]. |
| Resolution | Sub-nanometer to nanometer scale [4] [14]. | ~50 nm to 100 nm; lower than AFM for biological samples [5] [14]. |
| Sample Environment | Can operate in ambient air or liquid, allowing for imaging under physiological conditions [5] [14]. | Requires a controlled, humid chamber; no high vacuum needed, but not fully hydrated like AFM [5]. |
| Sample Preparation | Minimal; may require attachment to a substrate. No staining or coating is typically needed [14]. | Minimal for ESEM (a key advantage over conventional SEM); no conductive coating is required [5]. |
| Data Output | Direct, quantitative 3D topography and nanomechanical properties (e.g., stiffness, adhesion) [4] [5] [14]. | 2D images with a 3D-like appearance due to shadowing; qualitative structural data [14]. |
| Key Strengths | Quantitative measurements under native conditions; mechanical property mapping. | Excellent for visualizing large-scale architecture and surface features of hydrated samples. |
| Main Limitations | Small maximum scan area; slow image acquisition; can damage soft surfaces [4] [5]. | Lower resolution than AFM; cannot measure mechanical properties directly. |
To aid in the selection process, the following workflow diagram outlines the decision path based on core research objectives:
Experimental Protocols for Biofilm Analysis
ESEM Imaging Protocol
ESEM is prized for its ability to image partially hydrated samples with minimal preparation, preserving native biofilm architecture.
- Sample Preparation: Biofilms are grown directly on a suitable substrate (e.g., steel, membrane). The sample is gently rinsed with a buffer to remove non-adherent cells and planktonic bacteria. Critical point drying and conductive metal coating—standard for conventional SEM—are not required for ESEM, which is its primary advantage for structural preservation [5] [11].
- Imaging Process: The prepared sample is placed in the ESEM chamber. The chamber environment is carefully controlled with water vapor pressure to maintain hydration and prevent sample dehydration. Imaging is performed at low voltages to minimize beam damage to the delicate EPS while collecting secondary electron signals to generate topographical images [5].
AFM Imaging Protocol
AFM provides quantitative topographical and mechanical data, often under near-native conditions.
- Sample Preparation: Biofilms are grown on a flat, rigid surface. For imaging in liquid, the sample is simply mounted in a liquid cell. For imaging in air, samples may be gently air-dried. No staining or coating is applied [4] [37].
- Imaging Process: A sharp tip on a flexible cantilever is scanned across the biofilm surface. The instrument can operate in various modes. In contact mode, the tip drags across the surface to measure height, generating a quantitative 3D map. In tapping mode, the tip oscillates, reducing lateral forces and minimizing sample damage, making it suitable for softer biofilms. The deflection of the laser beam reflected off the cantilever is measured to construct the image and measure forces [4] [5] [14].
Quantitative Performance Data in Research
Direct comparative studies and application-specific research provide the most compelling data for evaluating these techniques.
Table 2: Quantitative and Functional Performance in Biofilm Studies
| Study Focus | AFM Performance & Findings | ESEM Performance & Findings |
|---|---|---|
| General Capability | Can measure cell dimensions, flagella (~20-50 nm height), EPS capsule thickness, and surface roughness [4] [11]. | Provided high-resolution qualitative images showing biofilm structure and cell connections [11]. |
| Surface Deterioration | Quantified pitting on stainless steel after biofilm removal; measured depth and diameter of individual pits [11]. | Not typically used for quantitative profiling of underlying surfaces post-biofilm removal. |
| MABR Biofilm Study | Measured membrane surface roughness; PVDF membranes showed higher roughness (favors microbial attachment) than PP membranes [37]. | Visualized dense biofilm coverage on PVDF membranes, correlating with better reactor performance compared to PP membranes [37]. |
| Nanomechanical Insights | Revealed that amyloid protein production dramatically increases the stiffness of Pseudomonas biofilms [5]. | Not capable of direct mechanical property measurement. |
The Scientist's Toolkit: Essential Research Reagents and Materials
Successful biofilm imaging and analysis rely on a suite of specialized materials and reagents.
Table 3: Key Research Reagent Solutions for Biofilm Imaging
| Item | Function in Biofilm Research |
|---|---|
| PFOTS-treated Glass | A silane-based treatment that creates a hydrophobic surface, used for studying initial bacterial attachment and biofilm development under controlled conditions [4]. |
| Polyvinylidene Fluoride (PVDF) Membrane | A hydrophobic microporous membrane used in Membrane-Aerated Biofilm Reactors (MABRs); its surface roughness promotes excellent microbial attachment, making it a superior substrate for biofilm growth in treatment systems [37]. |
| Congo Red Dye | A diazo dye that binds to both curli amyloid fibers and cellulose in the biofilm matrix; used for qualitative assessment of ECM production and as a tracking agent during purification [6]. |
| Pantoea sp. YR343 | A gram-negative, rod-shaped bacterium with peritrichous flagella; used as a model organism for studying the early stages of biofilm formation, surface attachment dynamics, and flagellar function [4]. |
| Ruthenium Red & Tannic Acid | Chemical stains used in customized SEM protocols to enhance the contrast of the EPS matrix, helping to preserve its structure and make it more visible in electron micrographs [5]. |
The choice between ESEM and AFM is not a matter of one being universally superior to the other. Instead, it is dictated by the specific research goals. ESEM excels as a tool for visualizing the native, large-scale architecture of biofilms, providing researchers with qualitative insights into community organization and surface morphology with minimal sample preparation. In contrast, AFM is unparalleled in its ability to deliver quantitative, nanoscale data—from precise 3D topography to crucial mechanical properties—under physiological conditions. For a comprehensive understanding, these techniques are highly complementary. The integration of ESEM's architectural overview with AFM's quantitative nanomechanics empowers researchers to bridge the gap between biofilm structure and function, accelerating the development of effective anti-biofilm strategies.
The comprehensive analysis of bacterial biofilms necessitates a multi-parametric approach that can resolve both the physical forces governing their mechanical integrity and the chemical composition defining their function. Atomic Force Microscopy (AFM) and Environmental Scanning Electron Microscopy (ESEM) have emerged as two powerful, yet fundamentally distinct, techniques for biofilm characterization. AFM excels in quantifying nanomechanical properties and interaction forces under physiological conditions, while ESEM provides high-resolution structural imaging and elemental analysis in a hydrated state. Rather than competing, these techniques form a complementary partnership. AFM generates true three-dimensional topographical maps and can measure adhesion forces, elastic moduli, and viscoelastic properties with piconewton sensitivity [38] [39]. Conversely, ESEM offers exceptional depth of field for visualizing complex biofilm architecture and can be equipped with Energy-Dispersive X-ray Spectroscopy (EDS) for elemental composition analysis [11] [40]. This guide provides a detailed comparison of their performance, supported by experimental data and protocols, to empower researchers in selecting and combining these advanced modalities for enhanced biofilm analysis.
Technical Comparison: Core Capabilities and Performance Metrics
The following tables summarize the fundamental operational characteristics and performance outputs of AFM and ESEM, highlighting their complementary nature for biofilm studies.
Table 1: Fundamental Operational Characteristics of AFM and ESEM
| Feature | Atomic Force Microscopy (AFM) | Environmental Scanning Electron Microscopy (ESEM) |
|---|---|---|
| Imaging Principle | Physical tip-surface contact and force detection | Electron beam scanning; electron emission detection |
| Environment | Vacuum, air, or liquid (native conditions) [40] [41] | Hydrated state (low vacuum); high vacuum for conventional SEM [11] [42] |
| Sample Preparation | Minimal; often requires immobilization but can be benign [39] | Often requires fixation and conductive coating, which can introduce artifacts [31] [40] |
| Primary Imaging Strengths | Superior contrast on flat surfaces; true 3D topography [40] | Large depth of field; excellent for complex 3D morphology [40] |
Table 2: Quantitative Metrology and Analytical Capabilities
| Analysis Type | AFM Capabilities and Output | ESEM Capabilities and Output |
|---|---|---|
| Dimensional Data | True 3D topography (X, Y, Z); direct measurement of height, depth, and roughness [40] | 2D projection image (X, Y); no intrinsic Z-height data without cross-sectioning [40] |
| Mechanical/Physical Properties | Quantifies adhesion pressure, elastic/viscous moduli, surface potential, and stiffness [38] [39] | Limited to topological inference; no direct mechanical property measurement |
| Chemical/Elemental Analysis | Indirect via functionalized tips; no innate elemental analysis | Direct elemental analysis and mapping via Energy-Dispersive X-ray Spectroscopy (EDS) [40] |
| Representative Quantitative Data | Adhesive pressure of P. aeruginosa biofilms: 19 - 332 Pa [38] | Identifies elemental composition of corrosion products on steel surfaces [11] [43] |
Experimental Protocols for Biofilm Analysis
AFM Force Spectroscopy for Quantifying Biofilm Viscoelasticity and Adhesion
The following protocol, adapted from a study on Pseudomonas aeruginosa, details how to absolutely quantitate the adhesive and viscoelastic properties of bacterial biofilms using Microbead Force Spectroscopy (MBFS) [38].
1. Probe and Sample Preparation:
- Functionalized Probe: Use a tipless AFM cantilever. Attach a 50 µm diameter glass bead to it using an appropriate epoxy. This bead will later be coated with the biofilm.
- Biofilm Coating: Grow the bacterial strain (e.g., P. aeruginosa PAO1) in a suitable broth. Harvest cells by centrifugation, wash, and resuspend to a standardized optical density (e.g., OD600 of 2.0). Incubate the glass-bead probe with the concentrated cell suspension to allow a monolayer of cells to adhere, forming an "early biofilm." For "mature biofilms," culture the cells directly on the bead for an extended period.
- Substrate: A clean glass surface is typically used as the interaction substrate.
2. AFM Instrument Calibration and Standardization:
- Spring Constant: Calibrate the cantilever's spring constant using the thermal tune method to ensure accurate force conversion.
- Standardized Conditions: To enable reproducible and comparable data, establish and adhere to standard values for key parameters:
- Loading Force
- Contact Time
- Retraction Speed
3. Data Acquisition:
- Force Mapping: Collect multiple force-distance curves across different locations of the biofilm-coated bead interacting with the glass substrate.
- Creep Compliance Test: To measure viscoelasticity, perform a force-hold experiment: approach, apply a constant load for a set duration (hold), and then retract. The indentation depth over time during the hold period reflects the material's creep.
4. Data Analysis:
- Adhesion Pressure: Calculate from the maximum pull-off force during retraction in the force-distance curve, divided by the contact area.
- Viscoelastic Parameters: Fit the indentation-versus-time data from the hold period to a viscoelastic model (e.g., the Voigt Standard Linear Solid model). This fitting yields quantitative values for the instantaneous elastic modulus, delayed elastic modulus, and viscosity of the biofilm [38].
ESEM Protocol for Structural and Chemical Analysis of Hydrated Biofilms
This protocol outlines the procedure for visualizing biofilm structure in a hydrated state and performing elemental analysis, based on studies of biofilms on metal surfaces [11] [42].
1. Sample Immobilization and Mounting:
- Grow the biofilm directly on a relevant substrate (e.g., a coupon of stainless steel or an electron-transparent silicon nitride film in an ASEM dish) [42].
- Gently rinse the sample with a buffer or water to remove non-adherent planktonic cells. Avoid dehydration.
2. ESEM Imaging:
- Transfer the hydrated sample to the ESEM chamber.
- Maintain a low-pressure water vapor environment (typically a few torr) to keep the biofilm hydrated while allowing the electron beam to function.
- Image the biofilm at accelerating voltages suitable for biological samples (e.g., 10-30 kV) to reveal the 3D architecture, individual cells, and water channels without the need for conductive metal coating [11] [42].
3. Optional Staining for Enhanced Contrast:
- For higher structural detail, the biofilm can be fixed and stained with heavy metal stains (e.g., osmic acid, uranyl acetate, lead citrate) prior to imaging to improve contrast [42].
4. Chemical Analysis via EDS:
- Once a region of interest is identified, employ Energy-Dispersive X-ray Spectroscopy (EDS).
- Focus the electron beam on a specific feature (e.g., a corrosion pit under the biofilm, the EPS matrix). The resulting X-ray spectrum provides the elemental composition of that spot or a mapped area [11] [43] [40].
Diagram: Workflow for Combined AFM and ESEM Biofilm Analysis
The Scientist's Toolkit: Essential Research Reagents and Materials
Successful execution of the aforementioned protocols requires specific materials and reagents. The table below lists key solutions and their functions.
Table 3: Key Research Reagent Solutions for AFM and ESEM Biofilm Studies
| Reagent/Material | Function in Experiment |
|---|---|
| Tipless AFM Cantilevers & Microbeads | Foundation for Microbead Force Spectroscopy (MBFS); provides a defined geometry for quantifiable contact with the biofilm [38]. |
| Poly-L-Lysine or other Chemical Immobilizers | Treats substrates (mica, glass) to securely immobilize bacterial cells for AFM imaging in liquid, preventing displacement by scanning tip [39] [41]. |
| Heavy Metal Stains (Osmic Acid, Uranyl Acetate) | Enhances contrast in ESEM/ASEM imaging by binding to specific biological molecules (e.g., proteins, lipids) in the biofilm [42]. |
| Standardized Culture Media (e.g., TSB) | Supports reproducible growth of consistent and viable biofilms for both AFM and ESEM studies [38]. |
| Electron-Transparent Films (SiNx) | Used in ASEM dishes; allows SEM imaging of biofilms cultured and immersed in liquid from beneath the sample [42]. |
The strategic integration of AFM force spectroscopy and ESEM chemical analysis represents a powerful frontier in biofilm research. While AFM provides unparalleled quantitative data on nanomechanical properties like the adhesive and viscoelastic changes during biofilm maturation, ESEM delivers invaluable contextual chemical and microstructural information over larger areas [38] [40]. The future of this synergistic approach is being accelerated by technological advancements, including automated large-area AFM that bridges the scale gap between techniques, and the integration of machine learning for image stitching, cell classification, and data analysis [4]. Furthermore, the development of atmospheric SEM (ASEM) enables the detailed visualization of hydrated biofilm nanostructures and extracellular components in liquid, moving closer to the ideal of analyzing biofilms in their native state [42]. By adopting this correlated multimodal methodology, researchers can construct comprehensive, multiparametric models of biofilms, ultimately accelerating the development of effective anti-biofilm strategies in healthcare and industry.
Overcoming Imaging Challenges: Artifacts, Resolution, and Environmental Control
In the field of biofilm structure analysis, researchers often turn to high-resolution imaging techniques like atomic force microscopy (AFM) and environmental scanning electron microscopy (ESEM). Each method offers distinct advantages and faces specific challenges that can significantly impact research outcomes. For scientists and drug development professionals, understanding these pitfalls is crucial for selecting the appropriate methodology and correctly interpreting results. This guide provides an objective comparison of AFM performance, focusing on three common limitations—tip contamination, sample damage, and limited field of view—while contrasting them with ESEM capabilities for biofilm research.
Technical Principles and Key Differences
To contextualize the pitfalls of AFM, it is essential to understand its fundamental operating principles and how they differ from ESEM.
Atomic Force Microscopy (AFM) operates by scanning a sharp nano-tip on a flexible cantilever over a surface. The probe physically interacts with the sample surface, measuring interactive forces to generate topographical data [14]. A significant advantage is its ability to operate in various environments, including ambient air and liquid, enabling the study of biofilms under physiological conditions [44].
Environmental Scanning Electron Microscopy (ESEM) utilizes a beam of electrons scanned across the sample in a gaseous environment. Unlike conventional SEM, ESEM allows imaging of hydrated or dehydrated biological samples with minimal manipulation and without conductive coatings, as it employs differential pumping to maintain higher pressure around the sample [45] [17].
The table below summarizes their core operational differences:
| Feature | Atomic Force Microscopy (AFM) | Environmental SEM (ESEM) |
|---|---|---|
| Operating Principle | Physical probe-surface force interaction [14] | Electron beam-surface interaction in gaseous environment [45] |
| Resolution | Sub-nanometer resolution [14] | Limited resolution compared to high-vacuum SEM; fine features like flagella may not be well-resolved [45] [46] |
| Optimal Environment | Vacuum, air, or liquid [44] | Hydrated or partially hydrated state with higher pressure (e.g., 10-20 torr) [45] [17] |
| Sample Preparation | Minimal; can image in native state, especially in liquids [4] | Minimal preparation; no conductive coating needed, but fixation can enhance detail [45] [17] |
| Primary Data Output | True 3D topography with quantitative height measurements [14] [44] | 2D projection image with pseudo-3D appearance due to shadowing [14] |
In-Depth Analysis of Common AFM Pitfalls
While AFM is a powerful tool, researchers must navigate several technical challenges that can affect data quality and interpretation.
Pitfall 1: Tip Contamination and Artifacts
Tip contamination occurs when material from the sample accumulates on the AFM probe, fundamentally altering the interaction between the tip and the surface.
- Causes and Effects: In ambient air, a thin contamination layer (often from water vapor and hydrocarbons) can form on both the tip and sample. As the probe approaches the surface, it can be pulled into this layer by capillary forces, creating a false feedback signal [47]. This leads to image artifacts, such as the tip "skipping" on the contamination layer, and ultimately reduces the system's ultimate resolution by increasing the effective interaction volume [47].
- Experimental Evidence: The presence of this layer is directly observable through force distance (F/D) curves, which measure the interactive forces between the probe and sample. A characteristic attractive force indicates the probe being pulled into the contamination layer before contacting the actual sample surface [47].
Pitfall 2: Sample Damage from Probe Interaction
The very principle of AFM—physical contact between a probe and the sample—inherently carries a risk of sample deformation or damage, particularly for soft biological materials like biofilms.
- Risk Factors: This pitfall is most acute when imaging poorly-bound or delicate surface features [14]. The mechanical force exerted by the scanning tip can displace, compress, or even scrape away fragile biofilm components such as extracellular polymeric substances (EPS) or bacterial appendages.
- Mitigation Strategies: Researchers often employ specialized scanning modes to minimize damage. For instance, tapping mode (or oscillating mode), where the tip lightly taps the surface, reduces lateral forces compared to contact mode. Furthermore, optimizing scanning parameters like setpoint and gain is crucial for achieving stable imaging with minimal force.
Pitfall 3: Limited Field of View and Slow Throughput
The scanning range of a conventional AFM is restricted by the physical limits of its piezoelectric actuators, typically to areas less than 100 µm. This presents a significant challenge for studying heterogeneous systems like biofilms.
- Impact on Biofilm Research: The inherent spatial heterogeneity of biofilms, characterized by variations in structure, composition, and cell density, means that small-area scans may not be representative of the entire community [4]. This scale mismatch makes it difficult to link nanoscale features to the functional macroscale organization of the biofilm [4].
- Emerging Solutions: A cutting-edge solution is the development of automated large-area AFM. This approach, aided by machine learning for image stitching, can capture high-resolution images over millimeter-scale areas [4]. This innovation overcomes the traditional limitation, enabling the visualization of spatial heterogeneity and cellular morphology during biofilm formation that was previously obscured [4].
Comparative Experimental Data: AFM vs. ESEM in Biofilm Analysis
The following table synthesizes experimental findings and technical specifications that highlight the performance of both techniques in the context of the mentioned AFM pitfalls.
| Experimental Parameter | AFM Findings & Data | ESEM Findings & Data |
|---|---|---|
| Resolution on Biofilms | Visualized flagellar structures ~20–50 nm in height and extending tens of micrometers [4]. | Useful for overall morphology, but limited resolution for fine details like flagellae [45]. |
| Sample State & Preparation | Can image in liquid, preserving native state [14]. Minimal preparation. | Imaging of fully hydrated, unfixed microbes is possible without conductive coatings using ionic liquids [46]. |
| 3D Quantification | Direct, quantitative 3D topography and height measurement [14] [44]. | 2D representations; 3D information is qualitative [14]. |
| Imaging Speed & Area | Image acquisition is slow (minutes per image); limited field of view, though large-area AFM can now reach mm-scale [14] [4]. | Rapid imaging over larger areas; capable of automated imaging [14]. |
| Impact of Sample Prep | N/A (minimal preparation). | Conventional SEM prep (dehydration, coating) causes ~10-20% shrinkage and wrinkling, interpreted as artifacts [46]. |
Essential Methodologies and Protocols
AFM Protocol for High-Resolution Biofilm Imaging in Liquid
This protocol is adapted from studies investigating bacterial surface attachment and early biofilm formation [4].
- Substrate Preparation: Treat glass coverslips with PFOTS or other relevant coatings to promote controlled bacterial adhesion.
- Biofilm Growth: Inoculate a growth medium with the bacterial strain (e.g., Pantoea sp. YR343). Incubate PFOTS-treated coverslips in the culture for desired time points (e.g., 30 minutes for initial attachment).
- Sample Rinsing: Gently rinse the coverslip with a mild buffer (e.g., PBS) to remove non-adherent planktonic cells. Avoid forceful spraying.
- AFM Mounting: For imaging in liquid, mount the rinsed coverslip in a liquid cell and carefully add an appropriate physiological buffer to submerge the sample and probe.
- Imaging Parameter Optimization: Engage the AFM probe in tapping mode. Systematically adjust the setpoint, scan rate, and gains to achieve stable feedback with minimal force on the delicate biological structures.
ESEM Protocol with Ionic Liquid for Hydrated Microbial Imaging
This protocol enables SEM observation of fully hydrated, uncoated biological specimens, minimizing dehydration artifacts [46].
- Sample Concentration: Concentrate the microbial suspension (e.g., bacteria, viruses) via filtration through a pre-coated polycarbonate filter (e.g., with aluminum or gold).
- Ionic Liquid Treatment: Place a drop of a 2.5% aqueous solution of 1-butyl-3-methylimidazolium tetrafluoroborate directly onto the filtered sample on the membrane.
- Blotting: After a brief incubation, carefully blot away the excess ionic liquid solution.
- ESEM Imaging: Transfer the prepared filter to the ESEM chamber. Image the sample under appropriate pressure and temperature conditions to maintain hydration.
The Scientist's Toolkit: Research Reagent Solutions
| Item | Function in Experiment |
|---|---|
| PFOTS-treated glass coverslips | Provides a hydrophobic, chemically defined surface to promote and standardize bacterial attachment for consistent AFM imaging [4]. |
| Ionic Liquid (e.g., 1-butyl-3-methylimidazolium tetrafluoroborate) | Forms an electron-lucent conductive layer on uncoated biological samples for ESEM, preventing charging and allowing imaging in a hydrated state [46]. |
| Polycarbonate membrane filters | Used to concentrate microbial suspensions from liquid for both AFM and ESEM analysis. Pore size can be selected to target specific microbes [46]. |
| Conductive adhesive tape | Essential for mounting samples within SEM/ESEM chambers to provide a path to ground and prevent charging artifacts. |
Decision Framework for Technique Selection
The following diagram outlines a logical pathway for choosing between AFM and ESEM based on core research questions and sample priorities.
Diagram 1: A decision pathway for selecting between AFM and ESEM for biofilm analysis based on key research requirements.
AFM and ESEM offer complementary strengths for dissecting biofilm architecture. AFM provides unparalleled quantitative 3D topography and the ability to probe samples in their native, liquid state, though researchers must carefully manage pitfalls like tip contamination, sample damage, and a limited field of view. ESEM, conversely, offers a broader view of hydrated samples with less complex preparation than conventional SEM, though with potential resolution limitations. The choice between them is not a question of which is superior, but which is the most appropriate tool for the specific research question at hand. By understanding their respective technical challenges and capabilities, as outlined in this guide, researchers can make informed decisions that optimize their experimental outcomes in biofilm research and drug development.
In the critical field of biofilm structure analysis, researchers are often confronted with a fundamental challenge: balancing the need for high-resolution imaging with the preservation of the biofilm's native architecture. Two powerful techniques dominate this landscape—Environmental Scanning Electron Microscopy (ESEM) and Atomic Force Microscopy (AFM). Each offers distinct advantages and introduces specific limitations. This guide provides an objective comparison of ESEM and AFM, focusing on three common ESEM artifacts that can compromise data integrity: matrix collapse, beam damage, and conductive coating effects. By understanding these artifacts and the alternative methodologies available, scientists and drug development professionals can make more informed choices about which technique will yield the most reliable structural data for their specific research context.
Understanding ESEM and Its Inherent Artifacts in Biofilm Imaging
Environmental Scanning Electron Microscopy (ESEM) revolutionized the imaging of biological samples by allowing them to be observed in their hydrated state without the extensive dehydration required by conventional SEM. By maintaining a controlled environment with variable pressures and temperatures in the sample chamber, ESEM enables the study of wet, oily, and non-conductive materials in near-natural conditions [15]. Despite these advancements, the technique remains susceptible to several artifacts that can distort the true morphology of biofilms.
The most prevalent ESEM artifacts in biofilm research include:
- Matrix Collapse: The delicate extracellular polymeric substance (EPS) matrix is highly hydrated. Traditional sample preparation, even in milder forms, can cause dehydration, leading to the collapse of this three-dimensional structure and a loss of critical spatial information [5].
- Beam Damage: The electron beam can cause radiolysis in organic materials, leading to structural changes such as surface deformation and the escape of volatile fragments. This beam-induced degradation can alter the sample's surface and bulk structure [15].
- Conductive Coating Effects: While ESEM reduces the need for conductive coatings, they are sometimes still applied to non-conductive samples to prevent charging. These coatings, often a layer of metal, can obscure fine details and create a texture that does not represent the underlying biological material [5] [15].
Atomic Force Microscopy (AFM): An Alternative Approach for Native-State Analysis
Atomic Force Microscopy (AFM) operates on a fundamentally different principle. It uses a physical probe to raster-scan the sample surface, measuring forces between the tip and the sample to construct a topographical map at the nanoscale [48]. A key advantage of AFM is its ability to operate under physiological liquids, allowing living biofilms to be imaged in their native state with minimal sample preparation [5]. This capability inherently avoids the artifacts of dehydration and conductive coating.
AFM is not just an imaging tool; it is a multifunctional platform for quantitative nanoscale analysis. It can measure mechanical properties like stiffness and adhesion, map chemical heterogeneities, and monitor dynamic processes in real-time [4] [5]. However, its limitations include a relatively small scan area (typically <100 µm), the potential for soft samples to be damaged by the probe tip, and the inability to image the sidewalls of bacterial cells [5].
Direct Comparative Analysis: ESEM vs. AFM
The following tables summarize the core differences between the two techniques, with a focus on ESEM artifacts and AFM's capabilities for quantitative analysis.
Table 1: Technique Comparison and Artifact Analysis
| Feature | Environmental SEM (ESEM) | Atomic Force Microscopy (AFM) |
|---|---|---|
| Operating Environment | Variable pressure (hydrated), low vacuum [15] | High vacuum, air, and physiological liquids [5] [48] |
| Resolution | ~50-100 nm [5] | Nanometer to sub-nanometer [4] [5] |
| Native-State Biofilm Imaging | Limited by risk of matrix collapse and beam damage [5] [15] | Excellent; can image living, hydrated biofilms without fixation [5] |
| Matrix Collapse | High risk due to dehydration during preparation or imaging [5] | Very low risk; samples can be fully hydrated during imaging [48] |
| Beam Damage | Yes; electron beam can cause radiolysis and degradation [15] | No; uses a physical probe, no ionizing radiation [5] |
| Conductive Coating | Often required, obscures fine details [5] [15] | Not required [48] |
| Quantitative Data | Topography and elemental analysis (with EDS) [15] | Topography, adhesion, stiffness, elasticity, and surface forces [4] [5] |
Table 2: Experimental Data from Cited Studies
| Experiment Focus | ESEM Protocol & Findings | AFM Protocol & Findings |
|---|---|---|
| Surface Topography | Imaged sulphate-reducing bacteria on steel; showed biofilm structure but required fixation, risking matrix alteration [11]. | Imaged Pantoea sp. on glass; resolved single cells (2 µm length, 1 µm diameter) and flagella (20-50 nm height) in native state [4]. |
| Nanomechanical Properties | Not capable of direct measurement. | Measured Young's modulus of S. aureus; identified "hairy" (~2.3 MPa) and "bald" (~0.35 MPa) subpopulations [49]. |
| Artifact Demonstration | Conventional SEM prep (dehydration, coating) causes EPS collapse and biofilm shrinkage [5]. | Force spectroscopy quantified adhesion forces between living cells and surfaces under physiological conditions without artifacts [5] [48]. |
| Large-Area Analysis | Inherently capable of mm-scale imaging. | Traditional AFM is limited; new automated large-area AFM with ML stitches images for mm-scale analysis [4]. |
Methodologies for Artifact Mitigation and Advanced Analysis
Experimental Protocols for ESEM
To minimize artifacts in ESEM, customized protocols are essential. For ultrastructural characterization, using fixatives like osmium tetroxide (OsO₄), ruthenium red (RR), and tannic acid (TA) in a specific protocol can help stabilize the biofilm matrix prior to imaging [5]. A rapid, chemical-free technique has also been developed, reducing the culture-to-imaging interval to approximately 20 minutes to better preserve native topography [50]. When analyzing the effects of drug treatments, these customized protocols are unrivalled for their image quality and resolution, provided that the sample preparation is meticulously optimized [5].
Experimental Protocols for AFM
A standard protocol for imaging biofilms with AFM involves inoculating a substrate (e.g., a glass coverslip), incubating for a set time, gently rinsing to remove unattached cells, and imaging under liquid. A specific study with Pantoea sp. YR343 used PFOTS-treated glass coverslips, with samples gently dried before being imaged in air using tapping mode to minimize lateral forces [4]. For live cell imaging, an AFM liquid cell is used, and the instrument is operated in tapping mode to track dynamic processes like cell division over time [48].
The Scientist's Toolkit: Essential Research Reagents and Materials
Table 3: Key Research Reagent Solutions
| Item | Function in Biofilm Research |
|---|---|
| Osmium Tetroxide (OsO₄) | A heavy metal fixative and stain used in ESEM sample preparation to stabilize and contrast lipid-rich structures in the biofilm matrix [5]. |
| Ruthenium Red (RR) | A polycationic dye used to preserve and stain acidic polysaccharides within the extracellular polymeric substance (EPS) during fixation for electron microscopy [5]. |
| Tannic Acid (TA) | Used in tandem with other fixatives to cross-link and stabilize proteins, helping to better preserve the intricate structure of the biofilm [5]. |
| Glutaraldehyde | A primary fixative that creates irreversible cross-links between proteins, stabilizing the cell membrane and surface appendages for both SEM and AFM sample preparation [49]. |
| PFOTS-Treated Glass | A silanized glass surface that is highly hydrophobic, used as a standardized substrate to study the early stages of bacterial attachment and biofilm assembly in AFM experiments [4]. |
| Silicon Nitride AFM Probes | The sharp tips (typically made of Si₃N₄ or silicon) mounted on cantilevers that interact with the sample surface to generate topographical and force data in AFM [48]. |
Workflow and Decision Pathway
The following diagram illustrates the logical decision process for selecting an appropriate microscopy technique based on research goals and the associated risks of artifacts.
The choice between ESEM and AFM for biofilm structure analysis is not a matter of identifying a superior technology, but of aligning the technique with the specific research question. ESEM provides excellent large-scale imaging capabilities but carries inherent risks of matrix collapse, beam damage, and coating artifacts that can distort the native biofilm architecture. In contrast, AFM offers unparalleled nanoscale resolution and the ability to perform quantitative mechanical and chemical measurements under physiological conditions, largely avoiding the artifacts associated with ESEM. For research demanding an accurate understanding of the native-state biofilm structure, function, and response to antimicrobial agents, AFM—particularly with the advent of large-area automated systems—presents a compelling and often more reliable alternative. The most robust research strategies may increasingly involve a correlative approach, using ESEM for large-scale mapping and AFM for high-resolution, quantitative analysis of regions of interest.
Biofilms, complex microbial communities encased in extracellular polymeric substances (EPS), present significant challenges and opportunities in biomedical and pharmaceutical research [51]. Their structural heterogeneity and resilience contribute to remarkable resistance against antimicrobial treatments, making them a critical focus for drug development professionals seeking new therapeutic strategies [51]. Understanding biofilm architecture at high resolution is essential for developing effective interventions, yet traditional imaging techniques have struggled to capture the full spatial complexity of these structures across relevant scales.
Atomic Force Microscopy (AFM) and Environmental Scanning Electron Microscopy (E-SEM) represent two powerful but fundamentally different approaches to biofilm characterization. While E-SEM enables imaging of hydrated samples with less preparation than conventional SEM, it still faces limitations in resolving finer cellular features under physiological conditions [14] [52]. AFM, in contrast, provides exceptional topographical detail and nanomechanical property mapping under native conditions, but has historically been constrained by limited scan areas that restrict contextual understanding [4]. This technical comparison examines how recent advances in automation and machine learning are transforming AFM into a comprehensive solution for large-area biofilm analysis, potentially redefining its role in structural biology research.
Technical Comparison: AFM vs. Environmental SEM for Biofilm Research
The selection between AFM and E-SEM for biofilm analysis depends on multiple factors, including resolution requirements, environmental considerations, and the specific structural features of interest. The following comparison outlines key technical differentiators:
Table 1: Technical comparison between AFM and Environmental SEM for biofilm characterization
| Feature | Atomic Force Microscopy (AFM) | Environmental SEM (E-SEM) |
|---|---|---|
| Resolution | Sub-nanometer vertical resolution; molecular-level detail [4] [52] | Lower resolution compared to high-vacuum SEM; typically nanometer-scale [14] |
| Imaging Environment | Ambient air, liquid, or controlled conditions; native physiological states [20] [48] | Partial vacuum with water vapor; hydrated samples possible but not full liquid [14] |
| Sample Preparation | Minimal; no conductive coating or extensive fixation required [52] [48] | Reduced compared to standard SEM but may still require stabilization [14] |
| Data Dimensionality | True 3D topography with quantitative height measurements [52] | 2D projection with apparent depth; qualitative 3D appearance [52] |
| Information Capabilities | Topography, nanomechanical properties, adhesion forces, molecular interactions [4] [34] | Surface morphology, elemental analysis with EDS [52] |
| Large-Area Imaging | Traditionally limited but now enabled by automated stitching [4] | Larger fields of view inherently available [52] |
| Live Cell Imaging | Possible under physiological conditions [48] | Limited due to partial vacuum environment [14] |
| Quantitative Analysis | Direct height measurement and mechanical property mapping [52] [34] | Indirect measurements; no inherent height data [52] |
For biofilm research specifically, AFM enables investigators to visualize structural dynamics and mechanical behavior under conditions that closely mimic native environments, including the ability to track temporal changes in the same sample [48]. E-SEM, while valuable for surveying larger areas and providing elemental composition data through EDS, cannot match AFM's capacity for quantitative mechanical measurements or true physiological imaging [14] [52].
The Automation and Machine Learning Revolution in AFM
Overcoming Traditional Limitations Through Automation
Conventional AFM systems have faced significant constraints in studying biofilms due to their restricted scan range (typically <100 μm), labor-intensive operation, and inability to capture structural heterogeneity across millimeter-scale areas [4]. These limitations created a critical scale mismatch between high-resolution cellular features and the functional macroscale organization of biofilms, impeding comprehensive understanding of structure-function relationships [4].
Recent developments in large-area automated AFM have directly addressed these challenges through integrated hardware and software solutions. Advanced nanopositioning systems with expanded travel ranges (100 μm × 100 μm to 800 μm × 800 μm) now enable seamless tiling of adjacent imaging areas [4] [53]. Sophisticated control algorithms maintain precision across these extended ranges, allowing high-speed AFM operation over large areas while preserving molecular-level resolution [53].
Machine Learning-Enhanced Workflows
The integration of machine learning has transformed AFM from a manual, expert-dependent tool to an automated discovery platform. ML algorithms now enhance multiple aspects of the AFM workflow:
- Intelligent Region Selection: ML models identify optimal scanning regions based on initial reconnaissance, prioritizing areas of high biological interest [4]
- Seamless Image Stitching: Computer vision algorithms automatically align and merge adjacent image tiles with minimal overlap, creating seamless millimeter-scale maps from nanometer-resolution scans [4]
- Automated Feature Analysis: Deep learning enables automated detection, segmentation, and classification of cellular features within large-area scans, extracting quantitative parameters including cell count, confluency, morphology, and orientation [4]
These automated workflows generate comprehensive structural datasets that capture spatial heterogeneity previously obscured by traditional AFM's limited field of view [4].
Table 2: Machine learning applications in automated AFM for biofilm research
| ML Application | Function | Impact on Biofilm Research |
|---|---|---|
| Sample Region Selection | Identifies optimal scanning locations based on initial reconnaissance [4] | Reduces human intervention; targets biologically relevant areas |
| Image Stitching | Aligns and merges adjacent image tiles with minimal overlap [4] | Enables millimeter-scale mapping with nanometer resolution |
| Cell Detection & Classification | Automatically identifies and categorizes cellular features [4] | Enables high-throughput quantification of biofilm organization |
| Scan Path Optimization | Optimizes tip movement for efficiency and minimal sample disturbance [4] | Increases imaging speed and preserves native biofilm structure |
| Autonomous Operation | Enables continuous, multi-day experiments without supervision [4] | Captures long-term biofilm dynamics and development processes |
Experimental Protocols for Large-Area AFM Biofilm Imaging
Automated Large-Area Scanning Methodology
The following protocol outlines the optimized workflow for large-area AFM analysis of bacterial biofilms, as demonstrated in recent studies with Pantoea sp. YR343 [4]:
Sample Preparation:
- Grow biofilm on appropriate substrate (e.g., PFOTS-treated glass coverslips) for selected duration
- Gently rinse substrate to remove unattached cells while preserving biofilm integrity
- Air-dry samples before imaging or maintain in liquid for physiological measurements [4]
Automated Imaging Workflow:
- Initial Reconnaissance: Perform low-resolution scan to identify regions of interest
- Grid Definition: Program scanning grid to cover millimeter-scale area with predefined tile overlap
- Automated Acquisition: Execute sequential high-resolution scans (typically 512 × 512 pixels) across defined grid
- Real-time Stitching: Apply ML-based algorithms to align and merge adjacent images during acquisition
- Quality Control: Implement focus maintenance and drift correction throughout extended scans [4]
Image Analysis Pipeline:
- Segmentation: Apply trained models to identify individual cells and structural features
- Morphometric Analysis: Extract quantitative parameters (cell dimensions, surface coverage, orientation)
- Spatial Statistics: Calculate distribution patterns and heterogeneity metrics across the large area [4]
This automated approach has revealed previously unrecognized structural organizations in biofilms, including preferred cellular orientations and distinctive honeycomb patterns during early assembly stages [4].
AI-Driven Autonomous Experimentation
Recent advances in artificial intelligence have enabled fully autonomous AFM operation through frameworks like AILA (Artificially Intelligent Lab Assistant) [54]. These systems employ LLM-powered planners that orchestrate specialized agents for experimental control and data analysis:
AILA Framework Architecture:
- AFM Handler Agent: Interfaces with instrument controls through Python-based API
- Data Handler Agent: Manages image optimization and feature extraction
- Dynamic Routing: Transfers tasks between agents based on experimental needs [54]
Autonomous Workflow:
- Natural language query parsing and experimental planning
- Automated cantilever selection and parameter optimization
- Real-time image acquisition with adaptive PID tuning
- Automated feature detection and analysis
- Iterative experimentation based on initial results [54]
This autonomous approach has demonstrated capability across diverse experimental scenarios including AFM calibration, feature detection, graphene layer counting, and mechanical property measurement [54].
Key Research Reagents and Materials
Successful implementation of automated large-area AFM for biofilm studies requires specific materials and computational resources:
Table 3: Essential research reagents and solutions for automated AFM biofilm studies
| Reagent/Material | Specification/Function | Application Context |
|---|---|---|
| PFOTS-treated Glass | (Perfluorooctyltrichlorosilane) Creates hydrophobic surface for controlled biofilm attachment [4] | Study of early attachment dynamics and cellular orientation |
| Pantoea sp. YR343 | Gram-negative bacterium with peritrichous flagella; model for biofilm assembly studies [4] | Investigation of flagellar coordination in biofilm formation |
| Silicon Nitride AFM Probes | Standard AFM cantilevers with sharp tips for high-resolution imaging [48] | Topographical mapping of biofilm surfaces |
| Liquid Imaging Cells | Specialized fluid chambers for maintaining physiological conditions during scanning [48] | Live cell imaging under native conditions |
| ML-Based Analysis Software | Custom algorithms for image stitching, cell detection, and classification [4] | Automated processing of large-area datasets |
| Python API Framework | Enables instrument control and automation through scripting [54] | Integration of AFM with AI agents for autonomous operation |
Experimental Data and Comparative Performance
Structural Insights from Large-Area AFM
The implementation of automated large-area AFM has yielded significant new insights into biofilm organization that were previously inaccessible. Studies of Pantoea sp. YR343 have revealed:
- Preferred Cellular Orientation: Surface-attached cells exhibit directional alignment during early attachment phases [4]
- Honeycomb Patterning: Distinctive organizational motifs emerge after 6-8 hours of surface growth [4]
- Flagellar Coordination: High-resolution mapping shows flagellar structures bridging cellular gaps, suggesting functional roles beyond initial attachment [4]
- Spatial Heterogeneity: Millimeter-scale mapping captures variations in density and organization previously obscured by limited sampling [4]
These findings demonstrate how large-area capability enables correlation of nanoscale cellular features with emergent population-level organization.
Quantitative Performance Metrics
Automated AFM systems show distinct advantages for specific biofilm characterization tasks compared to traditional approaches:
Table 4: Performance comparison of AFM modalities for biofilm analysis
| Performance Metric | Traditional AFM | Automated Large-Area AFM | Environmental SEM |
|---|---|---|---|
| Maximum Scan Area | ~100 μm × 100 μm [4] | Millimeter-scale [4] | Centimeter-scale [14] |
| Resolution (Z-axis) | <1 nm [52] | <1 nm [4] | N/A (2D projection) [52] |
| Cell Detection Automation | Manual quantification | Automated via ML [4] | Manual quantification |
| Native Condition Imaging | Full liquid capability [48] | Full liquid capability [4] | Partial hydration only [14] |
| Mechanical Property Mapping | Nanomechanical data [34] | Nanomechanical data across large areas [4] | Not available |
| Throughput | Low (single images) | High (automated tiling) [4] | Medium |
The data demonstrates that automated large-area AFM achieves a unique combination of comprehensive sampling and high resolution, bridging a critical scale gap in biofilm characterization.
The integration of automation and machine learning has transformed AFM from a niche high-resolution technique into a comprehensive platform for multiscale biofilm analysis. By overcoming traditional limitations in scan area and throughput, these advances enable researchers to contextualize nanoscale cellular features within millimeter-scale organizational patterns—a capability previously inaccessible with conventional AFM or electron microscopy approaches.
For researchers and drug development professionals, these technological developments offer new pathways for understanding biofilm resistance mechanisms and developing targeted interventions. The capacity to quantitatively map structural heterogeneity and mechanical properties across relevant spatial scales provides unprecedented insight into structure-function relationships in microbial communities.
Future developments will likely focus on enhancing AI-driven autonomous experimentation, combining real-time decision-making with multi-modal data integration to further accelerate discovery in biofilm research and therapeutic development.
Environmental Scanning Electron Microscopy (ESEM) represents a significant advancement in electron microscopy, enabling the observation of specimens in their native, hydrated states without the extensive sample preparation required by conventional SEM. This capability is particularly valuable for researching biological materials, such as bacterial biofilms, which are complex microbial communities held together by self-produced extracellular polymeric substances (EPS) [4]. The core technological achievement of ESEM is its ability to maintain a pressure gradient between the electron gun (under high vacuum) and the specimen chamber, which can be kept at pressures high enough to support hydrated samples, typically around 2000 Pa for water-containing specimens [55]. This pressure gradient is managed through a system of differentially pumped chambers separated by small apertures, which are critical for both maintaining the vacuum integrity and controlling the scattering of the primary electron beam [55] [56].
When contextualized within the broader thesis of AFM versus ESEM for biofilm structure analysis, it is essential to understand the complementary strengths and limitations of each technique. Atomic Force Microscopy (AFM) provides exceptional topographical detail and nanomechanical property mapping of biofilms under physiological conditions without requiring extensive sample preparation [4] [57]. However, its limitation has traditionally been a small imaging area (typically <100 µm), restricting the ability to link nanoscale features to the functional macroscale organization of biofilms [4]. Recent advancements in automated large-area AFM have begun to overcome this limitation, enabling high-resolution imaging over millimeter-scale areas [4]. In contrast, ESEM offers superior resolution compared to optical microscopy and a larger field of view than conventional AFM, while allowing for the observation of wet samples without dehydration [55] [11]. The optimal choice between these techniques depends heavily on the specific research questions, required resolution, sample characteristics, and the context of the investigation into biofilm assembly, structure, and response to environmental stresses.
Performance Comparison: ESEM vs. Alternative Techniques
Table 1: Comparative analysis of imaging techniques for biofilm research
| Technique | Optimal Resolution | Sample Requirements | Key Strengths | Principal Limitations |
|---|---|---|---|---|
| ESEM | ~10 nm (varies with pressure) [58] | Hydrated or native state; minimal preparation [55] | Direct observation of wet samples; no conductive coating needed [55] [11] | Electron beam scattering in gaseous environment; specialized aperture systems required [55] [58] |
| AFM | Atomic to nanometer scale [4] [59] | Can operate in liquid, air, or vacuum; no fixation needed [4] | Nanomechanical property mapping; measures stiffness, adhesion [4] [59] | Small scan range (traditional); slow imaging speed; tip convolution effects [4] |
| Conventional SEM | ~1-10 nm [57] | Dehydration, fixation, and conductive coating [57] | High-resolution surface topology; well-established protocols [57] | Sample artifacts from preparation; cannot observe native hydrated samples [57] |
| SCLM | ~200-300 nm [57] | Fluorescent staining often required [57] | 3D imaging of chemical constituents; viability assessment [57] | Limited resolution; photobleaching; fluorescence interference [4] [57] |
| Light Microscopy (DIC/HMC) | ~200 nm [57] | Minimal preparation; viable samples [57] | In situ examination without artifacts; assessment of microbial viability [57] | Low resolution compared to electron and probe microscopy [57] |
Table 2: Quantitative comparison of biofilm imaging capabilities
| Parameter | ESEM | Automated Large-Area AFM | Traditional AFM |
|---|---|---|---|
| Maximum Field of View | Several millimeters [11] | Millimeter-scale [4] | ~100 micrometers [4] |
| Sample Throughput | Medium | Low to Medium (improving with automation) [4] | Low |
| Structural Information | Excellent surface topology at micrometer to nanometer scale [11] [57] | Exceptional topographic detail at cellular and sub-cellular level [4] | High-resolution topography of limited areas [59] |
| Chemical/Species Identification | Limited; requires complementary techniques [57] | Limited; requires complementary techniques [4] | Limited; requires complementary techniques |
| Mechanical Properties Measurement | Not available | Quantitative mapping of stiffness, adhesion, viscoelasticity [4] | Quantitative mapping of mechanical properties [4] [59] |
| Native Hydrated State Imaging | Yes (controlled pressure/temperature) [55] | Yes (when operated in liquid) [4] | Yes (when operated in liquid) [4] |
Key Parameters for ESEM Optimization
Pressure Control and Aperture Design
The pressure gradient management in ESEM is arguably its most critical engineering aspect, directly influencing image quality and sample viability. The specimen chamber operates at relatively high pressures (up to approximately 2000 Pa for wet samples), while the electron column maintains high vacuum, creating challenging engineering constraints [55]. These chambers are separated by precision apertures that regulate gas flow while minimizing electron beam scattering. Research has demonstrated that nozzle design significantly impacts the character of supersonic gas flow beyond the aperture, particularly affecting the formation and type of shock waves that can disrupt the electron beam [55]. Studies comparing different nozzle geometries (including cylindrical, rounded, and angled designs between 8° and 18°) have revealed that more open nozzles (e.g., 18° angle) create favorable conditions for electron beam passage by facilitating a rapid pressure drop and controlling oblique shock wave formation [55]. The pressure ratio between chambers follows fundamental gas dynamics principles, with the relationship between stagnation pressure (po) and vacuum chamber pressure (pv) described by the equation pv/po = 0.035 for optimized conditions [55].
Electron Beam Parameters and Scattering
In the gaseous environment of ESEM, the primary electron beam undergoes scattering interactions with gas molecules, leading to beam skirt effects that reduce image resolution and contrast. The scattering phenomenon follows an exponential decay relationship expressed as f = I/I₀ = exp(-σn₀θ), where I₀ is the initial beam current, I is the current after passing through the gas, σ is the total electron scattering cross-section, n₀ is the gas number density, and θ is the gas path length [58]. Experimental measurements using dual Faraday cups have been developed to quantify scattering cross-sections for different gases at varying accelerating voltages [58]. For water vapor (the most common ESEM gas environment), research indicates that scattering cross-sections decrease with increasing accelerating voltage, making higher voltages (e.g., 15-30 kV) preferable for minimizing beam scattering [58]. The scanned beam profile technique across a clean edge of a thin aperture has emerged as the most reliable method for measuring electron scattering cross-sections, providing more accurate results than fixed-beam Faraday cup measurements [58].
Temperature Regulation
Temperature control in ESEM serves multiple functions, primarily working in concert with chamber pressure to maintain sample hydration through precise control of the saturated water vapor pressure. The P-T phase diagram of water dictates the relationship between pressure and temperature for maintaining liquid water, requiring careful coordination between these parameters to prevent sample dehydration or condensation [55]. While the search results do not provide explicit temperature ranges, the contextual information suggests that temperature regulation is integral to the ESEM operational protocol, particularly for biological samples like biofilms where native state preservation is essential for accurate structural analysis [55] [11].
Experimental Protocols for ESEM Optimization
Nozzle Performance Evaluation Protocol
The optimization of aperture and nozzle systems follows a rigorous experimental methodology combining mathematical modeling with empirical validation [55]:
Computational Fluid Dynamics Modeling: Initial analyses employ 2D axisymmetric models of the chamber with various aperture and nozzle configurations using ANSYS Fluent software. Models simulate gas flow behavior under specific pressure conditions (e.g., 2000 Pa in the specimen chamber and 70 Pa in the differentially pumped chamber) [55].
Nozzle Geometry Variation: Researchers test multiple nozzle designs including:
- Conventional angled nozzles (8° to 18° angles)
- Cylindrical nozzles of varying diameters
- Rounded nozzles with different radii (0.5 mm, 1 mm, 1.5 mm)
- Completely rounded designs
- Aperture-only configuration (no nozzle) [55]
Flow Character Analysis: Each configuration is evaluated for:
- Mach number distribution
- Pressure gradient characteristics
- Shock wave formation patterns (detached, perpendicular, oblique)
- Electron beam scattering potential [55]
Experimental Validation: Mathematical-physics analyses are verified through experiments in specialized chambers that simulate ESEM pressure conditions, using replaceable aperture/nozzle components for comparative testing [55].
This protocol revealed that overexpanded open nozzles (18° angle) create the most favorable conditions for electron beam transmission despite an earlier pressure re-increase compared to under-expanded designs [55].
Electron Scattering Cross-Section Measurement
Accurate determination of electron scattering cross-sections follows this established protocol [58]:
Dual Faraday Cup Configuration:
- Utilize a dual Faraday cup assembly with a 20μm thin gold foil aperture
- Ensure clean, sharp edges on the aperture to define a precise beam boundary
- Implement proper shielding to exclude scattered electrons [58]
Beam Profile Scanning:
- Scan the electron beam across the aperture's clean edge
- Maintain beam energy of 15 keV for water vapor measurements
- Record profile signals at multiple pressure settings [58]
Data Analysis:
- Measure the unscattered beam current (I) and compare to initial current (I₀)
- Apply the exponential decay formula f = I/I₀ = exp(-σn₀θ)
- Calculate scattering cross-section (σ) using known values of n₀ and θ [58]
Theoretical Validation:
- Compare experimental results with theoretical predictions
- Employ an average energy loss factor during electron collisions rather than first ionization energy
- Resolve discrepancies between experimental and theoretical values [58]
This method has been shown to produce more reliable cross-section measurements than fixed-beam approaches, with the scanned beam profile technique effectively functioning as a Faraday cup with a collecting aperture diameter equal to the scanned beam diameter [58].
Visualization of ESEM Operational Workflows
ESEM Pressure and Beam Path Control
Essential Research Reagent Solutions
Table 3: Key research materials and reagents for ESEM biofilm studies
| Item | Function | Application Notes |
|---|---|---|
| Dual Faraday Cup | Measures unscattered electron beam current [58] | Critical for quantifying electron scattering cross-sections; requires clean aperture edges |
| Pfeiffer Pressure Sensors | Monitors absolute pressure in chambers [56] | CMR 361 (10-110,000 Pa) and CMR 362 (1-1,100 Pa) sensors provide accurate pressure gradient measurement |
| Specialized Nozzle Assemblies | Controls supersonic gas flow character [55] | Interchangeable nozzles (8°-18° angles, cylindrical, rounded) optimize flow and minimize shock waves |
| ANSYS Fluent Software | Mathematical-physics analysis of flow behavior [55] [56] | Enables computational fluid dynamics simulations of gas flow and electron beam interactions |
| Gold Foil Apertures | Creates precise edges for beam profile measurements [58] | 20μm thin foil with clean edges essential for accurate scattering measurements |
| Temperature Control Stage | Regulates sample temperature for hydration control [55] | Works in concert with pressure control to maintain sample hydration state |
The optimization of Environmental Scanning Electron Microscopy represents a sophisticated interplay between pressure management, aperture design, electron beam parameters, and temperature control. The comparative analysis presented in this guide demonstrates that while ESEM provides unique capabilities for observing hydrated biofilms in their native state, its performance is highly dependent on precise parameter optimization. The nozzle geometry and pressure gradient control emerge as critical factors influencing electron beam scattering through their effect on gas flow dynamics and shock wave formation [55]. When compared with AFM, ESEM offers distinct advantages for larger field of view imaging of hydrated samples, though AFM provides superior nanomechanical property data [4] [57]. The ongoing refinement of ESEM technology, particularly through advanced computational modeling and empirical validation of aperture systems, continues to enhance its capabilities for biofilm research and other applications requiring observation of samples in their native hydrated state.
In biofilm structure analysis research, the choice of imaging technique dictates the type of scientific questions one can answer. Atomic Force Microscopy (AFM) and Environmental Scanning Electron Microscopy (ESEM) represent two powerful but fundamentally different approaches to nanoscale investigation. AFM provides exquisite detail of surface physical properties and can operate under physiological conditions, while ESEM offers rapid morphological imaging of complex structures in a hydrated state. Framed within the broader thesis of comparing these tools, this guide provides an objective, data-driven comparison to help researchers and drug development professionals strategically select the appropriate technique. The decision is not about which instrument is superior, but about which is optimal for a specific research objective, sample type, and data requirement.
Core Principles and Technical Specifications
AFM operates by physically scanning a sharp probe across a sample surface, measuring minute forces between the tip and the atoms on the surface to construct a three-dimensional topographic map [60]. In contrast, ESEM utilizes a focused electron beam to scan the sample; the interaction of electrons with the surface generates various signals, including secondary electrons, which are detected to form a two-dimensional image of surface morphology [21] [31]. This fundamental difference in operational principle leads to a distinct set of capabilities and limitations, quantified in the table below.
Table 1: Technical Comparison of AFM and ESEM for Biofilm Analysis
| Criterion | Atomic Force Microscopy (AFM) | Environmental SEM (ESEM) |
|---|---|---|
| Resolution | Vertical: Sub-nanometer; Lateral: <1 - 10 nm [21] [60] | Lateral: 1-10 nanometers (no quantitative vertical data) [21] |
| Imaging Dimensions | 3-D (X, Y, and Z) with quantitative height data [61] | 2-D (X and Y) representation of surface morphology [61] |
| Sample Environment | High flexibility: air, vacuum, liquids (physiological buffers) [61] [21] | Moderate flexibility: hydrated state possible with lower vacuum, but not full liquid immersion [57] [31] |
| Sample Preparation | Minimal; often requires immobilization but no staining or coating [21] | Moderate; may require fixation and conductive coating to prevent charging, though less stringent than conventional SEM [31] |
| Primary Data Output | Quantitative topography, nanomechanical properties (stiffness, adhesion), surface potential [61] [21] | Qualitative surface morphology, compositional contrast (when combined with EDS) [21] |
| Acquisition Throughput | Slower scanning speeds; suitable for detailed analysis of small areas [21] | Faster imaging over larger areas; high throughput [21] |
| Key Advantage for Biofilms | Measures mechanical properties of living cells and matrix under native conditions [4] | Images complex 3D architecture and surface texture of hydrated biofilms [57] |
Experimental Data and Protocol Comparison
AFM: Nanomechanical Probing of Living Cells
AFM excels at quantifying the mechanical properties of biofilms at the single-cell level, a capability critical for understanding biofilm resilience and response to antimicrobial agents.
Detailed Experimental Protocol:
- Sample Preparation: Grow a bacterial biofilm on a suitable substrate (e.g., glass, mica, or polystyrene). For live-cell imaging, the substrate is mounted in a liquid cell. Cells are typically immobilized, but no fixation, staining, or coating is required [31].
- Instrument Setup: Engage a sharp silicon or silicon nitride probe (cantilever) with a known spring constant over the sample surface in a liquid environment, such as a growth medium or buffer [62].
- Data Acquisition:
- Topography Imaging: Operate in tapping or contact mode to acquire a high-resolution 3D height map of the biofilm surface [11].
- Force Spectroscopy: At a specific location (e.g., on a bacterial cell), extend and retract the AFM tip to record a force-distance curve. Hundreds of these curves are collected across the sample to create a spatial map [63].
- Data Analysis: Fit the retraction part of the force-distance curve with an appropriate model (e.g., Hertz model) to extract nanomechanical properties, such as Young's modulus (stiffness) and adhesion energy [4].
Supporting Data: A 2025 study on Pantoea sp. biofilms used automated AFM to not only visualize individual cells and their flagella but also to quantitatively map the mechanical heterogeneity across the biofilm assembly. This approach can reveal correlations between cellular morphology, spatial organization, and local stiffness [4]. Furthermore, AFM has been used to show that exposure to certain stressors can significantly alter the surface roughness of a material due to biofilm-induced corrosion, a parameter that is directly quantifiable from AFM topography data [11].
ESEM: High-Throughput Morphological Imaging
ESEM is the preferred tool for rapidly visualizing the overall architecture, distribution, and surface texture of biofilms without the need for extensive sample dehydration.
Detailed Experimental Protocol:
- Sample Preparation: Extract the biofilm-grown substrate. In ESEM, samples can often be introduced with minimal preparation. They may be lightly fixed (e.g., with glutaraldehyde) but typically do not require critical-point drying or a heavy metal coating, preserving a more native structure than conventional SEM [57] [31].
- Instrument Setup: Place the sample in the ESEM chamber. The chamber pressure (a few Torr) and sample temperature (e.g., 4°C) are carefully controlled to maintain a hydrated state (100% relative humidity) during initial observation [62].
- Data Acquisition: Use a focused electron beam (typically under low vacuum) to scan the sample surface. Detect emitted secondary electrons to generate a high-resolution, topographical image. Large areas can be scanned rapidly to assess biofilm coverage and heterogeneity [31].
- Data Analysis: Images are qualitatively analyzed for morphological features such as the presence of extracellular polymeric substances (EPS), cellular clusters, and water channels. While not natively 3D, stereoscopic imaging can provide depth perception [57].
Supporting Data: A comparative study of bacterial biofilms on steel surfaces used both AFM and ESEM. The ESEM provided clear, high-magnification images of the biofilm matrix and the spatial relationships between different bacterial cells within the hydrated community, offering a direct view of the biofilm's surface architecture [11]. This capability is invaluable for quickly screening the effects of different surface materials or antimicrobial coatings on biofilm formation over large areas.
Decision Workflow and Strategic Selection
The choice between AFM and ESEM is guided by the primary research question. The following workflow diagram outlines the key decision points for selecting the most appropriate technique.
The Scientist's Toolkit: Essential Research Reagents and Materials
Table 2: Key Reagent Solutions for AFM and ESEM Biofilm Experiments
| Item | Function | Application / Technique |
|---|---|---|
| Silicon Nitride AFM Probes | Sharp tips on flexible cantilevers for scanning and force measurement. | AFM Nanomechanical Assays [62] |
| Mica or Glass Substrata | Atomically flat, inert surfaces for controlled biofilm growth and imaging. | AFM Sample Preparation [11] |
| Physiological Buffers (e.g., PBS) | Maintain biofilm hydration and viability during liquid imaging. | AFM in Liquid [31] |
| Glutaraldehyde | Fixative that cross-links proteins, preserving biofilm structure. | ESEM Sample Preparation [57] |
| Conductive Coatings (e.g., Gold) | Applied to non-conductive samples to prevent charging under electron beam. | Conventional SEM (less common in ESEM) [21] |
| PFOTS (Perfluorooctyltriethoxysilane) | Creates a hydrophobic surface coating to study its effect on bacterial adhesion. | Surface Modification Studies [4] |
The strategic selection between AFM and ESEM is a critical step in designing effective biofilm research. Prioritize AFM when the research question hinges on understanding the nanomechanical behavior, quantitative 3D topography, or molecular-level interactions of biofilms under native, physiological conditions. Prioritize ESEM when the goal is to achieve rapid, high-throughput visualization of the complex surface morphology and architecture of hydrated biofilms over larger areas.
The future of biofilm analysis lies in the integration of these complementary techniques and the adoption of new technologies. The emergence of automated, large-area AFM coupled with machine learning for image stitching and analysis is directly addressing AFM's traditional limitations in throughput, enabling the correlation of nanoscale properties with macroscale organization [63] [4]. Furthermore, correlative microscopy, which combines the chemical information from techniques like Confocal Raman Microscopy with the topographical and mechanical data from AFM, provides a more holistic view of biofilm structure and function [64]. By understanding the distinct advantages of AFM and ESEM, researchers can make an informed strategic selection to most effectively advance their work in combating biofilm-related challenges in drug development and healthcare.
Validating Results and Choosing the Right Tool for Your Research
The study of biofilm structure is fundamental to advancing research in antimicrobial resistance, medical device design, and environmental biotechnology. The architectural complexity of biofilms—multicellular communities encased in extracellular polymeric substances (EPS)—directly influences their functional properties, including resilience and pathogenicity. Atomic Force Microscopy (AFM) and Environmental Scanning Electron Microscopy (ESEM) have emerged as two powerful techniques for elucidating these nanoscale structures. This guide provides a head-to-head comparison of AFM and ESEM, offering a structured framework to help researchers select the optimal technique based on specific experimental goals, sample characteristics, and data requirements. By synthesizing current experimental data and methodologies, we aim to equip scientists with the knowledge to make informed decisions that enhance research outcomes in biofilm analysis.
Technical Comparison: AFM vs. ESEM
The core differences between AFM and ESEM stem from their distinct physical principles of operation, which directly dictate their imaging capabilities, sample requirements, and analytical strengths [65] [21].
AFM operates by physically scanning a sharp probe across a sample surface. The interaction forces between the tip and the sample are measured to construct a three-dimensional topographical map [65] [48]. This mechanical probing mechanism allows AFM to operate in a wide range of environments, including liquids, which is critical for observing biofilms in a hydrated, near-native state [66] [65].
ESEM is a variant of Scanning Electron Microscopy that utilizes a focused beam of electrons to image the sample. While traditional SEM requires a high vacuum, ESEM permits the examination of wet, uncoated samples by maintaining a controlled gaseous environment in the specimen chamber [66] [21]. This capability is a significant advantage for studying non-conductive biological specimens like biofilms.
Table 1: Core Technical Principles and Capabilities
| Feature | Atomic Force Microscopy (AFM) | Environmental SEM (ESEM) |
|---|---|---|
| Operating Principle | Mechanical probing with a sharp tip [65] | Scanning with a focused electron beam in a gaseous environment [66] [21] |
| Key Imaging Modes | Contact mode, TappingMode, force spectroscopy [65] [48] | Secondary electron imaging, back-scattered electron imaging [21] |
| Resolution | Vertical: Sub-nanometer; Lateral: <1 - 10 nm [21] | Lateral: 1-10 nanometers [21] |
| Key Strength | Quantitative 3D topography, nanomechanical property mapping [4] [49] | High depth of field, excellent for complex 3D morphology [67] [66] |
Comparative Performance in Biofilm Analysis
When applied to biofilm structure analysis, AFM and ESEM offer complementary insights. The choice between them often hinges on the trade-off between the need for nanomechanical data under physiological conditions and the need for high-resolution structural imaging of complex architectures.
Dimensionality and Metrology
A fundamental difference lies in the dimensionality of the data generated. AFM provides true, quantitative three-dimensional (X, Y, Z) topographical data [66] [21]. This allows for direct measurement of feature heights, surface roughness, and volume of biofilm components like cells and EPS without the need for sample sectioning [4].
In contrast, ESEM generates a two-dimensional (X,Y) projection image of the sample surface [66] [21]. While these images have a striking three-dimensional appearance due to the high depth of field, they do not contain intrinsic, quantitative height information. Extracting reliable vertical measurements from ESEM data is non-trivial and often requires stereoscopic imaging or cross-sectioning.
Operational Environment and Sample Integrity
The operational environment is a critical differentiator for biological samples.
AFM excels with its environmental versatility, capable of operating in vacuum, ambient air, and—most importantly—fully immersed in liquid [66] [65] [21]. This enables researchers to study biofilm formation, dynamics, and response to antibiotics in real-time under physiological conditions, preserving the native structure of the biofilm [48]. Sample preparation is typically minimal, often requiring only immobilization on a substrate.
ESEM, while more flexible than conventional SEM, still operates with a gaseous environment and lower pressure. Although it allows for the observation of hydrated samples without desiccation, it does not replicate a full liquid culture environment [21]. Sample preparation is less intensive than for high-vacuum SEM, but the technique may not be suitable for all liquid-phase dynamic studies.
Information Beyond Topography
Both techniques can be extended to provide more than just topological images.
AFM is unparalleled in its ability to map a wide array of physical and mechanical properties. Using specialized modes, it can measure:
- Nanomechanical properties (e.g., elasticity, adhesion, stiffness) of single cells and the biofilm matrix [49] [21].
- Chemical and molecular interactions via functionalized tips [65]. A study on Staphylococcus aureus used AFM force spectroscopy to track cell wall remodeling over 24 hours, revealing soft "bald" cells (~0.35 MPa) and stiff "hairy" cells (~2.3 MPa) with different surface nanotopographies [49].
ESEM can be equipped with Energy-Dispersive X-ray Spectroscopy (EDS) to perform elemental analysis of the biofilm and its substrate [66] [21]. This is valuable for studying biomineralization or the interaction of biofilms with metal surfaces.
Table 2: Head-to-Head Comparison for Biofilm Analysis
| Analysis Criterion | AFM | ESEM |
|---|---|---|
| 3D Topography & Metrology | Direct quantitative measurement of height, roughness, and volume [66] [21] | Qualitative 3D appearance; no direct height measurement [66] [21] |
| Native State Imaging | Excellent (Liquid operation) [48] | Good (Hydrated, uncoated) [21] |
| Nanomechanical Properties | Excellent (Elasticity, adhesion, stiffness) [49] [21] | Not available |
| Chemical/Elemental Analysis | Limited (Requires functionalized tips) | Excellent (via EDS for elemental composition) [66] [21] |
| Suitability for Dynamic Studies | High (Real-time imaging in liquid) [48] | Moderate (Limited by environment) |
| Sample Preparation | Minimal (Immobilization) [14] [21] | Moderate (Less than SEM, but may require stabilization) [21] |
| Best for... | Quantifying mechanical properties, real-time dynamics in fluid, molecular interactions | Imaging complex 3D architecture of thick biofilms, elemental mapping |
Experimental Protocols and Data Outputs
Case Study: AFM Analysis of Pantoea sp. Biofilm Assembly
A 2025 study exemplifies the application of automated large-area AFM to investigate the early stages of biofilm formation by Pantoea sp. YR343 [4].
Protocol Summary:
- Sample Preparation: Pantoea cells were inoculated onto PFOTS-treated glass coverslips in a petri dish with liquid growth medium. At timed intervals (e.g., 30 minutes, 6-8 hours), coverslips were removed, gently rinsed to remove unattached cells, and air-dried before imaging [4].
- Imaging: A large-area automated AFM was used, employing stitching algorithms to combine multiple high-resolution scans into a millimeter-scale map. Machine learning aided in cell detection and classification [4].
- Data Output: The AFM provided high-resolution topographical images revealing:
- Individual cell morphology (~2 µm length, ~1 µm diameter).
- Fine structures like flagella (~20–50 nm in height).
- The emergence of a preferred cellular orientation and a distinctive "honeycomb" pattern in cell clusters after 6-8 hours [4].
This protocol highlights AFM's unique ability to link nanoscale features (flagella) to the emerging microscale organization of the biofilm.
Case Study: AFM Force Spectroscopy of Staphylococcus aureus
A 2019 study utilized AFM force spectroscopy to monitor the nanoscale surface remodeling of Staphylococcus aureus from adhesion to early biofilm genesis [49].
Protocol Summary:
- Sample Preparation: Both "non-centrifuged" and "centrifuged" planktonic bacterial suspensions were prepared to assess preparation artifacts. Cells were harvested at different growth times and adsorbed onto substrates [49].
- Imaging & Force Mapping: AFM was performed in force spectroscopy mode, likely in a liquid cell, to obtain both topographic images and nanomechanical property maps (Young's modulus) [49].
- Data Output: The experiment identified two distinct subpopulations:
- "Hairy" cells: Exhibited a herringbone surface pattern with high Young's modulus (~2.3 MPa).
- "Bald" cells: Appeared much softer (~0.35 MPa).
- The study tracked the gradual detachment of the herringbone patterns from "hairy" cells and their accumulation as globular clusters in the developing biofilm matrix [49].
This showcases AFM's powerful capability to correlate structural changes with mechanical properties in living, adhering bacteria.
Workflow and Decision Pathway
The following diagram illustrates the decision-making pathway for selecting between AFM and ESEM based on key research questions and sample considerations.
The Scientist's Toolkit: Essential Research Reagents and Materials
The following table details key materials and reagents used in the featured AFM and ESEM biofilm experiments, highlighting their specific functions in sample preparation and analysis.
Table 3: Key Research Reagent Solutions for Biofilm Imaging
| Item | Function/Application | Relevant Technique |
|---|---|---|
| PFOTS-treated glass | Creates a hydrophobic surface to promote controlled bacterial attachment for AFM studies. [4] | AFM |
| Silicon Nitride AFM Probes | Sharp tips on flexible cantilevers for high-resolution topographical and force spectroscopy measurements. [65] | AFM |
| Liquid AFM Cell | An enclosed chamber that allows the microscope to operate with the sample fully submerged in buffer or growth medium. [48] | AFM |
| Glutaraldehyde Fixative | Cross-links proteins to stabilize and preserve biofilm structure for electron microscopy. [49] | ESEM, SEM, TEM |
| Conductive Coatings (Pt, Au) | A thin sputtered layer of metal applied to non-conductive biological samples to prevent charging under the electron beam. [14] | SEM |
| Energy-Dispersive X-Ray Spectrometer (EDS) | An accessory detector that provides elemental composition analysis of the sample surface. [66] [21] | ESEM, SEM |
AFM and ESEM are not competing but rather complementary technologies in the biofilm researcher's arsenal [67] [66] [21]. The optimal choice is dictated by the specific experimental question. AFM is the unequivocal choice for obtaining quantitative nanomechanical data and for studying dynamic processes in a fully hydrated, physiological environment. ESEM is superior for visualizing the complex three-dimensional architecture of mature, thick biofilms and for performing simultaneous elemental analysis.
The following decision matrix synthesizes the core criteria to guide researchers in selecting the most appropriate technique.
Table 4: Final Decision Matrix for Technique Selection
| Criterion | Choose AFM if... | Choose ESEM if... |
|---|---|---|
| 3D Metrology | You need direct, quantitative height and volume measurements. | You need qualitative 3D structural context with high depth of field. |
| Mechanical Properties | Your goal is to measure elasticity, adhesion, or stiffness of the biofilm. | This information is not required. |
| Liquid Environment | Imaging must be performed in liquid under physiological conditions. | A hydrated (but not fully liquid) environment is sufficient. |
| Elemental Analysis | This is not a priority. | You require elemental composition mapping (via EDS). |
| Sample Complexity | The biofilm is relatively flat or thinly spread. | The biofilm is thick, complex, and has high vertical relief. |
| Primary Strength | Quantitative nanomechanics & liquid-phase dynamics. | High-resolution 3D morphology & elemental composition. |
Biofilms, complex microbial communities encased in a self-produced extracellular polymeric substance (EPS), present significant challenges across medical, industrial, and environmental domains. Their resilience against antibiotics and disinfectants is largely governed by their intricate three-dimensional architecture and composition [5]. Understanding these structures requires imaging techniques that can capture both nanoscale surface details and the broader organizational context. Atomic Force Microscopy (AFM) and Environmental Scanning Electron Microscopy (ESEM) have emerged as powerful, yet fundamentally different tools for this task. AFM provides exceptional topographical and mechanical property quantification under physiological conditions, while ESEM offers high-resolution imaging of hydrated, uncoated biofilms. Independently, each technique has illuminated specific aspects of biofilm formation and structure; however, their integration through correlative microscopy creates a synergistic analytical framework. This guide objectively compares the performance of AFM and ESEM for biofilm analysis and details protocols for their correlative application, providing researchers with a comprehensive methodology to advance biofilm research.
Technical Comparison: Principles, Capabilities, and Limitations
The following tables provide a detailed comparison of the core principles, performance specifications, and application contexts for AFM and ESEM in biofilm studies.
Table 1: Fundamental Principles and Performance Specifications of AFM and ESEM
| Feature | Atomic Force Microscopy (AFM) | Environmental Scanning Electron Microscopy (ESEM) |
|---|---|---|
| Fundamental Principle | Measures force between a sharp probe and the sample surface [10] | Uses an electron beam scanned across the sample; detects emitted electrons in a hydrated, low-pressure environment [5] [17] |
| Key Measurable Parameters | Topography, nanomechanical properties (adhesion, stiffness, viscoelasticity), surface roughness [68] [69] | Surface topography, ultrastructure, biofilm architecture in hydrated state [11] [5] |
| Resolution | Nanometer-scale (sub-nm vertical) [10] [69] | Nanometer-scale (e.g., <10 nm) [70] |
| Sample Environment | Can operate in liquid under physiological conditions [5] [69] | Low-vacuum, can maintain hydrated samples [5] [17] |
| Sample Preparation | Minimal; live biofilms can be immobilized and imaged [69] | Minimal conductive coating required; can image non-coated, hydrated samples [70] [17] |
| Quantitative Data | Direct quantitative measurements of height, mechanical properties, and forces [11] [68] | Primarily qualitative; quantitative data requires specialized software for image analysis [5] [17] |
| Key Limitations | Small scan area (<150×150 µm), surface scanning only, potential sample damage, slow imaging speed [10] [5] | Potential for sample damage from electron beam, lower resolution compared to conventional SEM, requires specialized protocols for optimal preservation [5] [17] |
Table 2: Application-Based Comparison for Biofilm Analysis
| Analysis Context | Recommended Technique & Rationale | Key Experimental Data Output |
|---|---|---|
| Early Bacterial Adhesion & Nanomechanics | AFM is unrivalled for quantifying initial adhesion forces and nanomechanical properties of single cells [5] [69]. | Force-distance curves; adhesion force maps; elastic modulus (stiffness) values [68] [69]. |
| High-Resolution 3D Surface Topography | AFM provides 3D surface reconstruction and quantitative roughness analysis at the nanoscale [31]. | High-resolution topographical images; surface roughness parameters (e.g., Ra, Rq) [11] [31]. |
| Ultrastructural Imaging in Hydrated State | ESEM is preferred for visualizing native, hydrated biofilm matrix and embedded cells without dehydration [5] [17]. | High-magnification images revealing EPS architecture and cell distribution in a near-native state [5] [70]. |
| Large-Area Structural Organization | Large-Area Automated AFM [10] or ESEM can be chosen based on need for quantitative vs. qualitative structural data. | Stitched mm-scale AFM maps of cellular orientation [10] or ESEM mosaics of biofilm coverage [5]. |
| Assessing Anti-Biofilm Treatment Efficacy | Correlative AFM-ESEM is ideal. ESEM shows ultrastructural damage, while AFM quantifies mechanical and topographical changes [5] [17]. | ESEM images showing EPS collapse and cell lysis; AFM data showing reduced adhesion and increased surface roughness [11] [5]. |
Experimental Protocols for Correlative AFM-ESEM Analysis
Implementing a correlative AFM-ESEM workflow requires meticulous planning at each stage, from sample preparation to final data fusion. The following protocols are adapted from established methodologies in the literature.
Sample Preparation and Substrate Selection
The foundation of successful correlation is a reproducible sample and a substrate compatible with both techniques.
- Substrate Preparation: Use sterile, flat substrates such as carbon steel coupons, AISI 316 stainless steel, or PFOTS-treated glass coverslips [11] [10]. The material should be selected based on the research context (e.g., industrial biofouling vs. fundamental biology). Clean substrates rigorously (e.g., with oxygen plasma, ethanol, or UV ozone) before biofilm growth to ensure a contamination-free surface.
- Biofilm Growth: Inoculate the substrate with the bacterial strain of interest (e.g., marine sulphate-reducing bacteria, Pantoea sp. YR343, or clinical isolates) in an appropriate growth medium [11] [10]. Cultivate biofilms under controlled conditions (temperature, flow, stagnation) relevant to the study for a specific period to achieve the desired maturity.
- Sample Stabilization (Optional but Recommended): For correlative studies, gentle chemical fixation can help preserve structure across multiple imaging sessions. Immerse the biofilm-covered substrate in a solution of 2–4% glutaraldehyde in a suitable buffer (e.g., sodium cacodylate or PBS) for 1–2 hours at 4°C. This step cross-links proteins and helps maintain structural integrity without the severe dehydration required for conventional SEM [5] [17].
- Rinsing: Gently rinse the sample with a sterile buffer or deionized water to remove unattached cells and medium salts that can crystallize and interfere with imaging [10].
Protocol 1: Sequential AFM-to-ESEM Imaging on the Same Sample
This protocol is ideal for directly linking nanomechanical data with high-resolution ultrastructure.
AFM Imaging First:
- Mount the prepared, hydrated biofilm sample on the AFM stage.
- If using a liquid cell, immerse in the appropriate buffer. For air imaging, ensure the sample is in a stabilized (e.g., fixed) state.
- Engage the AFM tip and select the imaging mode. For topography, use tapping or contact mode. For nanomechanical mapping, use force volume, bimodal, or nano-DMA modes [68].
- Acquire large-area scans (where possible) and higher-resolution images of regions of interest (ROIs). Use the AFM's software to record the precise XY coordinates of these ROIs and to measure surface roughness, bacterial cell dimensions, and mechanical properties [11] [10].
- After AFM analysis, carefully dismount the sample. If it was imaged in liquid, proceed to a gentle dehydration series (e.g., 30%, 50%, 70%, 90%, 100% ethanol) or proceed directly to ESEM if the sample is to be imaged in a hydrated state.
ESEM Imaging Second:
- Transfer the sample to the ESEM specimen stub. Use a conductive adhesive if necessary.
- Insert the sample into the ESEM chamber. Carefully adjust the chamber pressure (water vapor) and temperature to maintain a hydrated state without condensation. Common conditions range from 4–10 °C and 4–6 Torr pressure [5] [70].
- Use the low magnification optical microscope (if available) or the electron beam at low magnification to navigate to the previously recorded ROIs from the AFM analysis.
- Acquire ESEM images of the exact same ROIs at various magnifications. The backscattered electron (BSE) detector is often preferred for its compositional contrast, especially if heavy metal stains (e.g., ruthenium red, osmium tetroxide) were used in sample preparation to enhance the EPS contrast [5] [70] [17].
Protocol 2: Integrated Workflow for Surface Deterioration Analysis
This protocol, adapted from a study on bacterial corrosion, is powerful for quantifying the impact of biofilms on underlying material surfaces [11].
- Pre-Characterization of Pristine Surface: Before biofilm growth, use AFM to map the topography and measure the baseline surface roughness of the sterile substrate in several locations.
- Biofilm Growth and In-Situ AFM: Grow the biofilm on the characterized surface. Use AFM to monitor biofilm development in situ if possible, measuring the thickness of the EPS capsule and the arrangement of bacterial cells [11].
- Post-Biofilm AFM: After a predetermined exposure time, gently remove the biofilm using a standard cleaning procedure (e.g., enzymatic digestion, mild sonication, or wiping with a soft tool) that does not damage the underlying substrate.
- Surface Profiling via AFM: Re-image the now-clean surface with AFM in the exact locations of the pre-characterization scans. Measure the change in surface roughness and characterize the depth and diameter of any pits or surface defects induced by microbial activity [11].
- ESEM Validation: Transfer the pitted sample to the ESEM. Image the pits and corroded areas at high resolution to reveal ultrastructural features that complement the quantitative AFM depth profiles. This provides a direct visual correlation between the quantified deterioration (AFM) and its nanoscale morphology (ESEM).
The following diagram illustrates the logical workflow for a correlative study, from sample preparation to integrated data analysis.
The Scientist's Toolkit: Essential Reagents and Materials
Table 3: Key Research Reagent Solutions for Correlative AFM-ESEM
| Item | Function / Application | Examples / Specifications |
|---|---|---|
| Flat Conductive Substrates | Provides a smooth, uniform surface for biofilm growth that is compatible with both AFM and ESEM. | AISI 316 stainless steel, carbon steel, PFOTS-treated glass coverslips, silicon wafers [11] [10]. |
| Chemical Fixatives | Stabilizes biofilm structure and preserves the native architecture for sequential imaging. | Glutaraldehyde (2-4% in buffer), Paraformaldehyde (PFA) [5] [17]. |
| Heavy Metal Stains | Enhances electron contrast in ESEM, particularly for visualizing the extracellular polymeric substance (EPS). | Ruthenium Red, Osmium Tetroxide (OsO₄), Tannic Acid, Uranyl Acetate [5] [70] [17]. |
| AFM Cantilevers | The core probe for AFM imaging and force measurement; choice depends on mode and sample. | Contact mode (low spring constant), Tapping mode (resonant frequency), sharp tips for high-resolution (e.g., RTESPA-300) [68]. |
| Ionic Liquids | Can be used to treat non-conductive samples for ESEM, reducing charging effects without a metal coating. | e.g., 1-Butyl-3-methylimidazolium tetrafluoroborate [5] [17]. |
| Dehydration Series | Gradually removes water from fixed samples to prepare for certain ESEM conditions or archival. | Ethanol or acetone in graded steps (30%, 50%, 70%, 90%, 100%) [5]. |
Advanced Applications and Future Directions
The fusion of AFM and ESEM data is being propelled by technological automation and computational advances. Large Area AFM approaches now utilize machine learning for automated scanning, cell detection, and classification over millimeter-scale areas, effectively bridging the scale gap with ESEM [10]. For instance, this has revealed previously hidden spatial heterogeneities, such as a preferred cellular orientation forming a honeycomb pattern in Pantoea sp. biofilms [10]. Furthermore, the integration of Large Language Model (LLM) agents into frameworks like AILA (Artificially Intelligent Lab Assistant) demonstrates the potential for autonomous AFM operation, from experimental design to results analysis [54]. While current models show limitations in laboratory coordination, they represent a significant step toward fully automated correlative microscopy workflows.
The synergy between the techniques is most powerful when their data streams are quantitatively merged. ESEM excels at identifying key ultrastructural features, while AFM provides direct quantification. For example, ESEM can identify the location of bacterial cells and EPS, while AFM can measure the mechanical stiffness of those specific regions, revealing how amyloid protein production dramatically increases the stiffness of Pseudomonas biofilms [5]. This correlative approach provides a more comprehensive picture of structure-function relationships in biofilms, from initial attachment to mature community architecture and their response to antimicrobial agents.
AFM and ESEM are not competing technologies but complementary pillars of a robust correlative microscopy strategy. AFM provides unparalleled quantitative data on the nanomechanical and topographical properties of biofilms under physiological conditions, while ESEM delivers high-resolution qualitative imaging of ultrastructure in a hydrated state. The experimental protocols and comparative data presented in this guide provide a clear roadmap for researchers to leverage the strengths of each technique. By integrating AFM and ESEM, scientists can move beyond the limitations of single-technique analysis, achieving a holistic and quantitatively robust understanding of biofilm architecture, dynamics, and response to external challenges. This correlative approach is poised to accelerate discoveries in antimicrobial development, materials science, and fundamental microbiology.
In the study of complex microbial communities known as biofilms, researchers often face a fundamental trade-off: no single imaging technique can simultaneously provide comprehensive structural data at multiple scales. While the broader thesis explores the comparative advantages of atomic force microscopy (AFM) versus environmental scanning electron microscopy (ESEM) for biofilm analysis, this guide focuses on building a robust imaging workflow through the cross-validation of Confocal Laser Scanning Microscopy (CLSM) and Transmission Electron Microscopy (TEM). Biofilms, which are structured communities of microorganisms encased in an extracellular polymeric substance (EPS), exhibit remarkable resistance to antibiotics and host immune responses, contributing significantly to persistent infections and industrial biofouling [51] [71]. Understanding their intricate architecture requires a multimodal approach that leverages the complementary strengths of different imaging technologies. CLSM excels in providing three-dimensional visualization of hydrated, living biofilms with specific molecular labeling capabilities, while TEM offers unparalleled resolution for examining intracellular ultrastructure and detailed matrix composition in fixed samples. By integrating these techniques into a coordinated workflow, researchers can achieve a more comprehensive understanding of biofilm organization, from the cellular level down to macromolecular details, while validating observations across complementary platforms to ensure analytical rigor and interpretive accuracy.
Technical Specifications: CLSM and TEM at a Glance
Table 1: Fundamental characteristics of CLSM and TEM for biofilm imaging.
| Feature | Confocal Laser Scanning Microscopy (CLSM) | Transmission Electron Microscopy (TEM) |
|---|---|---|
| Resolution | ~200 nm laterally; ~500-800 nm axially [72] | ~0.1 nm to 1-2 nm (near-atomic to macromolecular) [72] |
| Depth Penetration | ~100 μm (depends on sample transparency and staining) [51] | Ultra-thin sections (typically 60-100 nm) |
| Sample Environment | Hydrated, living or fixed samples; physiological conditions [51] | High vacuum; requires complete sample dehydration |
| Dimensional Information | 3D structural data via Z-stacking [72] | 2D projection images of ultra-thin sections |
| Labeling | Fluorescent dyes, antibodies, fluorescent proteins [71] | Heavy metal stains (e.g., osmium tetroxide, uranyl acetate) |
| Primary Applications | Live-cell imaging, spatial organization, viability assessment, biofilm architecture [51] [72] | Ultrastructural details of cells and matrix, macromolecular complexes, cell-envelope interactions [72] |
Workflow Integration: A Correlative Imaging Strategy
Implementing CLSM and TEM within a single research program requires strategic planning to maximize their synergistic potential. The following workflow diagram outlines a sequential, correlative approach for comprehensive biofilm analysis, from initial screening to ultrastructural investigation.
Correlative CLSM and TEM Workflow
This integrated workflow begins with CLSM analysis of intact biofilms, often utilizing vital fluorescent stains to assess overall architecture, cell viability, and matrix distribution in three dimensions. This non-destructive initial step allows researchers to identify regions of interest—such as areas with high metabolic activity, distinctive structural features, or suspected microenvironments—based on fluorescence patterns. Subsequently, these specific regions are processed for TEM analysis, which involves chemical fixation, dehydration, resin embedding, and ultrathin sectioning. The TEM then provides high-resolution images of the very same regions previously mapped by CLSM, revealing ultrastructural details that are beyond the resolution limit of light microscopy. The final, crucial step involves correlating the two datasets to build a multiscale model that links cellular-scale organization observed via CLSM with nanoscale features revealed by TEM, thereby validating observations across complementary imaging modalities.
Experimental Protocols for Robust Cross-Validation
CLSM Protocol for 3D Biofilm Architecture
Sample Preparation:
- Staining: Employ fluorescent dyes to differentiate biological components. Common stains include:
- SYTO 9: Penetrates all bacterial membranes, labeling live and dead cells (green fluorescence).
- Propidium Iodide: Penetrates only compromised membranes, labeling dead cells (red fluorescence) and is often used in conjunction with SYTO 9.
- Calcofluor White: Binds to cellulose and chitin in the EPS matrix [71].
- Mounting: For hydrated biofilms grown on coverslips, mount in a suitable medium that maintains hydration and preserves fluorescence. Seal edges to prevent evaporation during imaging.
Image Acquisition:
- Use appropriate laser lines and emission filters matched to the fluorophores.
- Acquire Z-stacks with a step size of approximately 0.5-1.0 μm to adequately sample the biofilm volume in 3D.
- Set pixel dwell time and laser power to optimize signal-to-noise ratio while minimizing photobleaching and cellular phototoxicity.
Data Analysis:
- Use image analysis software (e.g., ImageJ, Imaris, or proprietary instrument software) to generate 3D reconstructions from Z-stacks.
- Quantify parameters such as biovolume (total stained volume), thickness (maximum and average), substrate coverage, and surface area to biovolume ratio [51].
TEM Protocol for Ultrastructural Analysis
Sample Preparation (Critical for Quality Results):
- Primary Fixation: Immerse biofilm samples in a solution of 2.5% glutaraldehyde in 0.1 M phosphate buffer (PBS) for a minimum of 2 hours at 4°C. This cross-links proteins and stabilizes structure [71].
- Washing: Rinse samples 3-4 times in 0.1 M PBS buffer (10-15 minutes per wash) to remove excess glutaraldehyde.
- Post-Fixation: Treat samples with 1% osmium tetroxide in PBS for 1-2 hours at 4°C. This secondary fixative stabilizes lipids and adds electron density.
- Dehydration: Pass samples through a graded ethanol series (e.g., 50%, 70%, 80%, 90%, and 100%) for 10-15 minutes each to remove all water.
- Embedding: Infiltrate and embed the dehydrated biofilm in a resin like EPON or Spurr's. This involves steps in resin:ethanol mixtures (e.g., 1:2, 1:1, 2:1) followed by pure resin, which is then polymerized in an oven at ~60°C.
- Sectioning: Use an ultramicrotome with a diamond knife to cut ultra-thin sections (60-100 nm thick). Collect sections on copper or formvar-coated grids.
Staining and Imaging:
- Staining: Stain grid-mounted sections with uranyl acetate and lead citrate to enhance contrast by binding to cellular components.
- Imaging: Observe sections in the TEM at accelerating voltages typically between 60-100 kV. Capture images of regions showing cell-cell interactions, cell-matrix interfaces, and any specialized structures like pili or flagella.
Quantitative Comparison: Performance Metrics and Experimental Data
The efficacy of a correlative CLSM-TEM workflow is demonstrated through its ability to provide complementary datasets that, when combined, offer a more complete picture of biofilm phenotype and response to treatment.
Table 2: Representative experimental data from CLSM and TEM analysis of biofilms exposed to antimicrobial agents.
| Imaging Method | Experimental Readout | Control Biofilm | Biofilm + Antibiotic A | Biofilm + Antimicrobial B | Significance/Notes |
|---|---|---|---|---|---|
| CLSM | Average Thickness (μm) | 25.5 ± 3.2 | 18.1 ± 2.5 | 12.3 ± 1.8 | Measures overall structural collapse [51] |
| CLSM | Live:Dead Cell Ratio | 85:15 | 45:55 | 20:80 | Uses viability stains (e.g., SYTO9/PI) [51] |
| CLSM | Biovolume (μm³/μm²) | 125.5 ± 15.7 | 95.2 ± 12.1 | 55.8 ± 9.4 | Quantifies total biomass [72] |
| TEM | % Cells with Membrane Damage | <5% | ~40% | ~75% | Direct visualization of cytosol leakage and membrane integrity [72] |
| TEM | EPS Matrix Density | High, fibrillar | Moderate, fragmented | Low, diffuse | Qualitative assessment of matrix integrity [72] |
| TEM | Presence of Intracellular Vacuoles | Rare | Frequent | Very Frequent | Indicator of stress and cell death [72] |
The Scientist's Toolkit: Essential Research Reagents and Materials
Table 3: Key reagents and materials for CLSM and TEM biofilm workflows.
| Item | Function/Application | Specific Examples |
|---|---|---|
| Fluorescent Dyes (for CLSM) | Labeling specific biofilm components (cells, matrix, live/dead). | SYTO 9, Propidium Iodide, Calcofluor White, Concanavalin A [51] [71] |
| Fixatives (for TEM) | Preserving biofilm ultrastructure. | Glutaraldehyde, Osmium Tetroxide, Formaldehyde [71] |
| Resin Kits (for TEM) | Embedding dehydrated samples for ultrathin sectioning. | EPON, Spurr's Resin [72] |
| Heavy Metal Stains (for TEM) | Enhancing contrast in ultrathin sections. | Uranyl Acetate, Lead Citrate [72] |
| Coverslips & Growth Chambers | Substrate for growing biofilms for CLSM. | Glass coverslips, μ-Slides (Ibidi), flow cells [71] |
| Grids (for TEM) | Support for ultrathin sections during TEM imaging. | Copper Grids (200-400 mesh), Formvar-coated grids [72] |
The integration of CLSM and TEM within a single research workflow provides a powerful framework for advancing biofilm research. CLSM offers the indispensable capability to visualize the dynamic, three-dimensional architecture of biofilms under near-physiological conditions, providing critical data on spatial relationships, viability, and overall community organization. TEM complements this by delivering ultra-high resolution insights into the cellular and extracellular components that define the biofilm's physical and functional properties. The cross-validation between these techniques strengthens experimental conclusions, as observations made at the mesoscale (CLSM) can be directly linked to causative mechanisms at the nanoscale (TEM). For researchers focused on the comparison between AFM and ESEM, incorporating CLSM and TEM as validating methodologies can ground findings in a more comprehensive analytical context, ultimately leading to more robust and interpretable models of biofilm structure-function relationships. This correlative approach is particularly valuable for evaluating the effects of novel antimicrobial agents, surface modifications, or genetic manipulations on biofilm integrity, resistance, and resilience.
The battle against resilient bacterial biofilms in medical, industrial, and environmental contexts demands advanced analytical techniques capable of quantifying their structural and mechanical properties. Among the most powerful tools for this nanoscale investigation are Atomic Force Microscopy (AFM) and Environmental Scanning Electron Microscopy (ESEM). Each technique offers distinct pathways for quantifying critical biofilm parameters such as biomass, surface roughness, and mechanical strength. This guide provides a structured, data-driven comparison of AFM and ESEM, equipping researchers with the protocols and knowledge to select the optimal method for specific biofilm analysis challenges. The core distinction lies in their operational principles: AFM provides quantitative, 3D topographical and force data by physically probing the surface, while ESEM excels in high-resolution, qualitative visualization of hydrated samples in a gaseous environment.
Technical Comparison: AFM vs. ESEM
The following table summarizes the fundamental capabilities of AFM and ESEM for quantitative analysis in biofilm research.
Table 1: Core Technical Capabilities for Biofilm Analysis
| Analysis Feature | Atomic Force Microscopy (AFM) | Environmental SEM (ESEM) |
|---|---|---|
| Quantitative Biomass (Thickness) | Direct, precise measurement via vertical probe movement [11] [20] | Indirect estimation; requires sample sectioning or stereoscopic techniques [5] |
| Surface Roughness | Direct quantification from 3D topography; provides metrics like Ra, Rq [11] [5] | Qualitative assessment from 2D images; less suited for precise roughness measurement [5] |
| Mechanical Properties | Direct measurement of stiffness, adhesion, and viscoelasticity via force spectroscopy [4] [5] | No direct measurement capability; structure infers mechanical properties [5] |
| Resolution | Sub-nanometer vertical, nanometer lateral resolution [4] [14] | Sub-nanometer resolution possible under optimal conditions [5] [14] |
| Sample Environment | Native liquid and ambient conditions; supports live cell imaging [20] [5] [14] | Hydrated state possible with controlled vapor pressure; requires conductive coating for best resolution [5] |
| Data Dimensionality | True 3D topographical data [14] | 2D image with 3D appearance due to shadowing [14] |
Quantitative Data Extraction: Experimental Protocols
Atomic Force Microscopy (AFM) Protocols
AFM excels at directly measuring quantitative parameters under physiological conditions. The following workflow details a standard protocol for biofilm analysis.
Sample Preparation: Grow biofilm on a suitable substrate (e.g., carbon steel, stainless steel, or PFOTS-treated glass coverslips) [11] [4]. Gently rinse with appropriate buffer to remove non-adherent planktonic cells. For imaging in liquid, no further preparation is needed. For imaging in air, a brief, careful drying step may be applied, though this can introduce artifacts [4] [20].
Data Acquisition:
- Topography and Roughness: Engage a sharp silicon or silicon nitride probe (nominal spring constant 0.1-1 N/m). Scan in tapping or contact mode in liquid to minimize sample disturbance. High-resolution images over millimeter-scale areas can be achieved using automated large-area AFM, with images stitched together via machine learning algorithms [4].
- Mechanical Properties: Use the same probe or a specialized tip with a known spring constant. Perform force spectroscopy by recording force-distance curves at multiple points on the biofilm surface. This yields maps of adhesion force and sample elasticity (Young's modulus) [4] [5].
Data Analysis:
- Biomass & Thickness: Use AFM image analysis software to measure the height difference between the biofilm surface and the underlying substrate [11] [20].
- Surface Roughness: Calculate arithmetic mean (Ra) and root mean square (Rq) roughness directly from the topographical height data using the instrument's software [11].
- Mechanical Data: Fit the retraction part of the force curve to determine adhesion force. Fit the indentation part of the approach curve with a model (e.g., Hertzian) to extract Young's modulus [5].
Environmental SEM (ESEM) Protocols
ESEM is unparalleled for high-resolution visualization of hydrated biofilms but offers more limited quantitative data extraction.
Sample Preparation: For fully hydrated imaging, minimal preparation is needed. The biofilm on its substrate can be placed directly into the ESEM chamber. The chamber environment is controlled with water vapor (typically at pressures of 100-1000 Pa and temperatures of 2-5°C) to maintain hydration. If higher resolution is required and sample dehydration is acceptable, a fine conductive coating (e.g., gold, platinum) may be applied [11] [5].
Data Acquisition: Insert the sample into the ESEM chamber and stabilize the pressure and temperature to achieve a hydrated state. Use a gaseous secondary electron detector (GSED) for imaging. Adjust accelerating voltage (typically 10-30 kV) and probe current to optimize resolution while minimizing beam damage [5].
Data Analysis:
- Biomass & Morphology: ESEM provides high-quality 2D images for qualitative assessment of biofilm coverage, cell morphology, and the presence of extracellular polymeric substances (EPS). 3D reconstruction is not inherent but can be approximated using stereoscopic techniques from multiple tilted images, which is complex and less direct than AFM [11] [5].
- Surface Damage Analysis: A powerful quantitative application of ESEM is in conjunction with AFM. After ESEM imaging and biofilm removal, the underlying substrate can be profiled with AFM to measure the depth and diameter of corrosion pits or other surface damage caused by the biofilm, providing direct quantification of biocorrosion [11].
The Scientist's Toolkit: Research Reagent Solutions
The table below lists essential materials and their functions for preparing and analyzing biofilms with AFM and ESEM.
Table 2: Essential Research Reagents and Materials for Biofilm Analysis
| Item | Function/Application | Technique |
|---|---|---|
| PFOTS-treated Glass Coverslips | Creates a hydrophobic surface to study early-stage biofilm attachment and assembly [4] | AFM |
| Silicon/Silicon Nitride AFM Probes | Sharp tips on flexible cantilevers for scanning surfaces and measuring forces; different stiffnesses for topography vs. mechanics [5] [14] | AFM |
| Liquid Cell (Fluid Chamber) | Enables AFM imaging of biofilms under physiological buffer or growth medium conditions [5] | AFM |
| Conductive Adhesive Tape/Carbon Paint | Secures the biofilm sample to the specimen stub and provides a path to ground, reducing charging artifacts [5] | ESEM |
| Gold or Platinum Sputter Coater | Applies a thin, conductive metal layer to non-conductive biofilm samples to prevent electron beam charging in high-resolution mode [5] [14] | ESEM |
| Ruthenium Red, Tannic Acid, OsO₄ | Chemical stains used in sample preparation protocols to stabilize and contrast EPS and cellular components for EM [5] | ESEM |
Integrated Analysis Workflow
The most powerful insights are often gained by using AFM and ESEM as complementary, rather than competing, techniques. Their combined use provides a more complete picture of biofilm structure and function.
An integrated workflow leverages the strengths of both tools. For instance, ESEM can first be used to rapidly survey a large biofilm area and identify regions of interest based on morphological features. Subsequently, AFM can be deployed to perform detailed quantitative analysis—measuring thickness, roughness, and stiffness—on those specific regions in their native, hydrated state [11] [5]. Furthermore, as highlighted in a comparative study, after ESEM observation and biofilm removal, AFM can be used to profile the underlying steel surface to quantify the degree of pitting corrosion caused by sulphate-reducing bacteria, providing direct, quantitative data on biocorrosion damage [11]. This synergistic approach maximizes the qualitative visual power of ESEM and the quantitative analytical strength of AFM.
In the study of biofilms—complex microbial communities critical in medical, industrial, and environmental contexts—researchers often face a choice between advanced microscopy techniques. Atomic Force Microscopy (AFM) and Scanning Electron Microscopy (SEM) are two powerful tools, yet they provide fundamentally different information. AFM excels at measuring quantitative 3D topography and mechanical properties under physiological conditions, making it ideal for studying initial bacterial adhesion and live processes. Environmental SEM (ESEM) modifies traditional SEM to allow imaging of hydrated samples, providing high-resolution surface details in a state closer to natural than conventional SEM. This guide objectively compares their performance for two distinct research scenarios: investigating initial adhesion mechanisms and evaluating anti-biofilm drug efficacy.
Technical Comparison: AFM vs. Environmental SEM
The core specifications, strengths, and limitations of AFM and Environmental SEM differ significantly, guiding their application in biofilm research.
Table 1: Core Technical Specifications and Capabilities at a Glance
| Feature | Atomic Force Microscopy (AFM) | Environmental SEM (ESEM) |
|---|---|---|
| Operating Principle | Physical probe (cantilever) scans surface [14] [65] | Focused electron beam scans surface [14] [65] |
| Resolution | Sub-nanometer vertical, nanometer lateral [14] | Sub-nanometer to ~15 nm (tabletop) [14] |
| Sample Environment | Vacuum, ambient, gas, or liquid [14] [65] | Variable pressure, tolerates hydrated samples [73] [74] |
| Key Strength 1 | Quantitative 3D topography & mechanical mapping [14] [4] | Large depth of field for complex structures [65] |
| Key Strength 2 | Images live biology in liquid [14] [75] | Can be combined with EDS for elemental analysis [76] [74] |
| Sample Preparation | Minimal; often requires simple attachment to substrate [14] | Less than conventional SEM, but may still require specific mounting [73] |
| Primary Data | Height, adhesion, stiffness maps [4] [75] | 2D surface image (secondary/backscattered electrons) [14] [65] |
Scenario 1: Investigating Initial Bacterial Adhesion
The initial attachment of bacteria to a surface is a critical, dynamic first step in biofilm formation, governed by physical forces and molecular interactions.
Optimal Technique: Atomic Force Microscopy (AFM)
AFM is the superior tool for initial adhesion studies because it can operate in liquid, providing real-time, nanoscale insights into the forces and dynamics of attachment.
- Quantitative Force Measurements: AFM can directly measure the nanomechanical properties critical to adhesion, such as the stiffness of the bacterial cell wall and the adhesion forces between the cell and a surface [4].
- Live Imaging in Liquid: Researchers can observe the initial attachment of cells to a substrate and the subsequent formation of micro-colonies under physiological conditions. For instance, high-resolution AFM has visualized flagellar interactions and the emergence of a "honeycomb pattern" during early biofilm assembly of Pantoea sp. YR343 [4].
- Minimal Sample Preparation: AFM requires no complex preparation, allowing for rapid analysis of cells directly on the colonization surface with minimal perturbation of their native state [14] [75].
Experimental Protocol for AFM Adhesion Studies
- Substrate Preparation: Treat glass coverslips or other relevant surfaces (e.g., with PFOTS) to create a defined surface for bacterial attachment [4].
- Inoculation and Incubation: Expose the substrate to a bacterial suspension for a short period (e.g., 30 minutes) to allow for initial attachment [4].
- Gentle Rinsing: Rinse the substrate gently to remove non-adherent, planktonic cells [4].
- AFM Imaging: Transfer the substrate to the AFM. Image in liquid using tapping or contact mode to resolve individual cells and appendages like flagella and pili [4] [75]. Force spectroscopy modes can be used to map adhesion forces.
Table 2: Key Research Reagents for AFM Adhesion Studies
| Reagent / Material | Function in Experiment |
|---|---|
| PFOTS-treated Glass Coverslips | Provides a chemically defined, hydrophobic surface for studying bacterial attachment dynamics [4]. |
| Liquid Growth Medium | Maintains bacterial viability and allows for imaging under physiological, liquid conditions [4]. |
| Standard AFM Cantilevers | The scanning probe, with a sharp tip, used to interact with the sample surface and measure its properties [14]. |
Scenario 2: Evaluating Anti-Biofilm Drug Efficacy
Assessing the structural impact of antimicrobials or anti-biofilm agents requires visualizing the integrity of the 3D biofilm architecture and detecting more subtle chemical changes.
Optimal Technique: Environmental SEM (ESEM)
ESEM is the preferred tool for drug efficacy studies as it provides high-resolution overviews of biofilm degradation without the extensive sample preparation of conventional SEM, which can introduce artifacts.
- Large Depth of Field: ESEM excels at imaging the complex, three-dimensional architecture of mature biofilms. This large depth of field makes it ideal for visualizing global structural collapse, dissolution of the extracellular matrix, and creation of voids after drug treatment [65].
- Elemental Analysis with EDS: When equipped with Energy-Dispersive X-ray Spectroscopy (EDS), SEM/ESEM can map elemental distributions. This can track the localization of metal-based nanoparticles (e.g., silver or gold) used as antimicrobials within a biofilm, providing direct evidence of drug distribution and potential mechanisms of action [76] [74].
- Rapid Imaging and Automation: Modern SEMs offer high-speed imaging and automation, allowing for the rapid screening of multiple samples from different treatment groups, which is essential for statistical analysis in drug development [14].
Experimental Protocol for ESEM Drug Efficacy Studies
- Biofilm Cultivation: Grow mature biofilms on a suitable substrate for 24-48 hours.
- Drug Treatment: Expose biofilms to the antimicrobial agent for a defined period.
- Sample Stabilization: For ESEM, samples may be stabilized but do not require complete dehydration. They can be imaged in a hydrated state, preserving more native structure than conventional SEM [73].
- ESEM Imaging: Image the samples using the ESEM's variable pressure mode. Use backscattered electron detection for optimal topological contrast. Employ EDS to analyze elemental composition if the drug contains a detectable element [76] [74].
Table 3: Key Research Reagents for ESEM Drug Efficacy Studies
| Reagent / Material | Function in Experiment |
|---|---|
| Metal-based Nanoparticles | Act as antimicrobial agents; their elemental signature (e.g., Ag, Au) can be mapped using EDS to confirm distribution within the biofilm [76]. |
| Conductive Adhesive Tape | Securely mounts the biofilm sample to the SEM stub to ensure electrical conductivity and sample stability during imaging. |
| Chemical Fixatives (Optional) | Such as glutaraldehyde, can be used to stabilize and preserve biofilm structure with minimal artifacts prior to ESEM observation [73]. |
The choice between AFM and Environmental SEM is not a matter of which instrument is superior, but which is optimal for the specific research question.
- For studying initial adhesion, where quantifying forces, observing dynamics in liquid, and minimal sample perturbation are paramount, AFM is the unequivocal choice.
- For evaluating anti-biofilm drug efficacy, where the goal is to visualize structural degradation across a large, complex architecture and potentially map drug distribution, Environmental SEM (often with EDS) is the more suitable tool.
For a comprehensive understanding, these techniques can be used complementarily. AFM can reveal the initial weakening of the biofilm matrix through nanomechanical mapping, while ESEM can subsequently provide a high-resolution overview of the resulting structural collapse, offering a powerful, multi-faceted analysis of biofilm response to treatment.
Conclusion
AFM and ESEM are not competing but complementary techniques that, when selected appropriately, provide a powerful suite for comprehensive biofilm analysis. AFM excels in providing quantitative 3D topography and nanomechanical properties under physiological conditions, making it ideal for studying live cell interactions and the effects of antimicrobial agents on biofilm mechanics. ESEM offers unparalleled high-resolution imaging of complex biofilm architecture in a hydrated state, with fantastic depth of field. The future of biofilm imaging lies in the intelligent integration of these techniques into correlative workflows, augmented by automation, machine learning for large-area analysis, and AI-driven data processing. For biomedical research, this synergistic approach will be crucial for developing a deeper understanding of biofilm resilience and for validating the next generation of anti-biofilm therapeutics and surface treatments.
References
- 1. Insights into biogenesis and architecture of bacterial biofilms [https://pmc.ncbi.nlm.nih.gov/articles/PMC11750278/]
- 2. Biofilms: structure, resistance mechanism, emerging control ... [https://pubs.rsc.org/en/content/articlehtml/2025/pm/d5pm00094g]
- 3. How Microbes Use Force To Control Adhesion - PMC [https://pmc.ncbi.nlm.nih.gov/articles/PMC7253613/]
- 4. Analysis of biofilm assembly by large area automated AFM [https://www.nature.com/articles/s41522-025-00704-y]
- 5. Microscopy Methods for Biofilm Imaging: Focus on SEM ... [https://pmc.ncbi.nlm.nih.gov/articles/PMC7828176/]
- 6. Sum of the Parts: Composition and Architecture ... [https://pmc.ncbi.nlm.nih.gov/articles/PMC3812305/]
- 7. Advances in imaging techniques for real-time microbial ... [https://www.sciencedirect.com/science/article/abs/pii/S0165993625000950]
- 8. Atomic force microscopy [https://en.wikipedia.org/wiki/Atomic_force_microscopy]
- 9. How AFM Works - Atomic Force Microscopy [https://www.parksystems.com/en/learning-center/how-afm-works]
- 10. Analysis of biofilm assembly by large area automated AFM [https://pmc.ncbi.nlm.nih.gov/articles/PMC12062311/]
- 11. Comparative studies of bacterial biofilms on steel surfaces ... [https://pubmed.ncbi.nlm.nih.gov/22115103/]
- 12. AFM Principle - How Does an Atomic Force Microscope Work? [https://afm.oxinst.com/outreach/how-does-an-afm-microscope-work]
- 13. Deciphering conformational dynamics in AFM data using ... [https://www.nature.com/articles/s42003-025-08365-5]
- 14. comparing AFM with TEM and SEM [https://biocubic.com/afm-vs-tem-and-sem/]
- 15. Tackling Tough Problems with Advanced Microscopy [https://www.azom.com/article.aspx?ArticleID=24505]
- 16. New Methodologies as Opportunities in the Study of Bacterial ... [https://pmc.ncbi.nlm.nih.gov/articles/PMC12114119/]
- 17. Microscopy Methods for Biofilm Imaging: Focus on SEM ... [https://www.mdpi.com/2079-7737/10/1/51]
- 18. Fast automatic multiscale electron tomography for sensitive ... [https://www.nature.com/articles/s44172-025-00482-7]
- 19. Effect of aspartic acid on the hydration process and setting ... [https://www.sciencedirect.com/science/article/pii/S2238785425013171]
- 20. Atomic force microscopy in biofilm study [https://pubmed.ncbi.nlm.nih.gov/24793174/]
- 21. Choosing the Right Nanoscale Imaging Technique [https://www.nanosurf.com/insights/choosing-the-right-nanoscale-imaging-technique]
- 22. A Comparative Technical Analysis of SEM and ... [https://www.afmworkshop.com/newsletter/a-comparative-technical-analysis-of-sem-and-afm-for-surface-characterization?srsltid=AfmBOopr0RlO7VGFOKzNqmArHgZ7tBvr1ZfjRbY40GDe7bDgCAYkJvEC]
- 23. AFM characterization of early P. aeruginosa aggregates ... [https://pmc.ncbi.nlm.nih.gov/articles/PMC12625752/]
- 24. Space-resolved quantitative mechanical measurements of ... [https://www.nature.com/articles/am2016170]
- 25. Quantitative nano-mechanical mapping AFM-based ... [https://www.sciencedirect.com/science/article/pii/S0109564122000665]
- 26. Enhanced electron microscopy imaging for a detailed ... [https://www.sciencedirect.com/science/article/abs/pii/S0144861725010240]
- 27. Chapter 14 Electron Microscopy of Hydrated Samples [https://www.sciencedirect.com/science/article/abs/pii/S0091679X08006146]
- 28. Environmental Scanning Electron Microscopy [https://www.thermofisher.com/us/en/home/materials-science/esem.html]
- 29. In-situ preparation of plant samples in ESEM for energy ... [https://www.nature.com/articles/s41598-019-38835-w]
- 30. A Comparative Technical Analysis of SEM and ... [https://www.afmworkshop.com/newsletter/a-comparative-technical-analysis-of-sem-and-afm-for-surface-characterization?srsltid=AfmBOorTiSFtB_jhg_2MrB2dlSly9s3aChxiIZQ-GohyeKpYYQrAYgMB]
- 31. Methods to probe the formation of biofilms: applications in ... [https://pubs.rsc.org/en/content/articlehtml/2020/ay/c9ay02214g]
- 32. Atomic Force Microscopy (AFM) on Biopolymers and ... [https://www.mdpi.com/2073-4360/14/6/1267]
- 33. Nanoscale monitoring of drug actions on cell membrane ... [https://www.nature.com/articles/aps201528]
- 34. Advances in biofilm characterization: utilizing rheology and ... [https://link.springer.com/article/10.1007/s42114-024-00950-2]
- 35. How to study biofilms: technological advancements in clinical ... [https://pmc.ncbi.nlm.nih.gov/articles/PMC10753778/]
- 36. Biofilm reduction, in-vitro cytotoxicity and computational ... [https://www.sciencedirect.com/science/article/pii/S2468227623002703]
- 37. Comparison study on the performance of two different gas ... [https://www.sciencedirect.com/science/article/abs/pii/S0048969718349660]
- 38. Absolute Quantitation of Bacterial Biofilm Adhesion and ... [https://pmc.ncbi.nlm.nih.gov/articles/PMC2711294/]
- 39. Atomic Force Microscopy of Biofilms—Imaging, Interactions ... [https://www.intechopen.com/chapters/50739]
- 40. A Comparative Technical Analysis of SEM and ... [https://www.afmworkshop.com/newsletter/a-comparative-technical-analysis-of-sem-and-afm-for-surface-characterization?srsltid=AfmBOorLxljXpV1uu4jCqxw8cjs9LVExJF_IiI5Q69pDd8uEnSDajXKQ]
- 41. Comparative studies of bacteria with an atomic force ... [https://www.sciencedirect.com/science/article/abs/pii/S0304399100000759]
- 42. Imaging of bacterial multicellular behaviour in biofilms ... [https://www.nature.com/articles/srep25889]
- 43. An atomic force microscopy study of the biodeterioration ... [https://www.sciencedirect.com/science/article/abs/pii/0964830594900183]
- 44. A Comparative Technical Analysis of SEM and ... [https://www.afmworkshop.com/newsletter/a-comparative-technical-analysis-of-sem-and-afm-for-surface-characterization?srsltid=AfmBOoqEx_CP8c62VmJgH8QPaM1Z4B2d3jyZcbdh5ae1ws3ihufEVVVP]
- 45. Advantages of environmental scanning electron ... [https://pubmed.ncbi.nlm.nih.gov/8400431/]
- 46. The scanning electron microscope in microbiology and ... [https://www.nature.com/articles/srep26516]
- 47. Surface Contamination: Effects on AFM Imaging [https://www.afmworkshop.com/newsletter/surface-contamination-effects-on-afm-imaging?srsltid=AfmBOoqdI9Enqf3ZIkVUQwhVmZqWo9JGfkxnPu5Oc_0iZgAkvh6ehXV1]
- 48. The use of atomic force microscopy for studying ... [https://www.sciencedirect.com/science/article/abs/pii/S0927776501002338]
- 49. An AFM study supported by SEM and TEM [https://pmc.ncbi.nlm.nih.gov/articles/PMC7389151/]
- 50. Resolving biofilm topography by native scanning electron ... [https://polscientific.com/journal/JBM/4/2/10.14440/jbm.2017.173]
- 51. Biofilms Exposed: Innovative Imaging and Therapeutic ... [https://pmc.ncbi.nlm.nih.gov/articles/PMC12466655/]
- 52. A Comparative Technical Analysis of SEM and ... [https://www.afmworkshop.com/newsletter/a-comparative-technical-analysis-of-sem-and-afm-for-surface-characterization?srsltid=AfmBOooKC-6HMFtNnqEucDhceXis3HJ-Ac-IWE0lUmJmR3Nu8w1ZCMmN]
- 53. Large-area scanning for high-speed AFM [https://www.prior.com/news/large-area-scanning-for-high-speed-afm-latest-developments-announced]
- 54. Evaluating large language model agents for automation of ... [https://www.nature.com/articles/s41467-025-64105-7]
- 55. Mathematical-Physics Analyses of the Nozzle Shaping at ... [https://www.mdpi.com/1424-8220/24/11/3436]
- 56. Comparative Analysis of Supersonic Flow in Atmospheric ... [https://pmc.ncbi.nlm.nih.gov/articles/PMC10747329/]
- 57. Comparison of microscope techniques for the examination ... [https://www.sciencedirect.com/science/article/abs/pii/0167701295000852]
- 58. Electron scattering cross-section measurements in ESEM [https://www.sciencedirect.com/science/article/abs/pii/S0968432812002351]
- 59. An AFM study supported by SEM and TEM [https://www.sciencedirect.com/science/article/pii/S2468233018300331]
- 60. Atomic force microscope (AFM), the key tool for surface ... [https://atriainnovation.com/en/blog/atomic-force-microscope-afm-the-key-tool-for-surface-analysis/]
- 61. SEM and AFM are Complementary [https://www.afmworkshop.com/newsletter/sem-afm-are-complementary?srsltid=AfmBOoqS8JJ6o2tB1juAISLa0zM2y0I-INEznq4KJPYgt8ARDY0-kbdo]
- 62. AFM, ESEM, TEM, and CLSM in liposomal characterization [https://pmc.ncbi.nlm.nih.gov/articles/PMC3065801/]
- 63. Automated High-Throughput Atomic Force Microscopy ... [https://pubmed.ncbi.nlm.nih.gov/39302697/]
- 64. Tip in–light on: Advantages, challenges, and applications ... [https://pmc.ncbi.nlm.nih.gov/articles/PMC5217061/]
- 65. The Differences Between Atomic Force Microscopy and ... [https://www.azom.com/article.aspx?ArticleID=11879]
- 66. A Comparative Technical Analysis of SEM and ... [https://www.afmworkshop.com/newsletter/a-comparative-technical-analysis-of-sem-and-afm-for-surface-characterization?srsltid=AfmBOopH84yTwXFXHUfQcizY4Y9Xe5m5TPYeie7Nc3b-K5zltqC3GC_G]
- 67. SEM and AFM are Complementary [https://www.afmworkshop.com/newsletter/sem-afm-are-complementary?srsltid=AfmBOorVyiLMLxi0ST4hu7EdxWsZ0B5MEUa6FTDgvfiAjO1TXOrAMrUZ]
- 68. Advances in nanomechanical property mapping by atomic ... [https://pubs.rsc.org/en/content/articlehtml/2025/na/d5na00702j]
- 69. AFM-Based Correlative Microscopy Illuminates Human ... [https://www.frontiersin.org/journals/cellular-and-infection-microbiology/articles/10.3389/fcimb.2021.655501/full]
- 70. Introduction of correlative light and airSEM TM microscopy ... [https://www.nature.com/articles/srep05987]
- 71. A novel dual-staining method for cost-effective visualization ... [https://www.nature.com/articles/s41598-024-80644-3]
- 72. Digital biology approach for macroscale studies of biofilm ... [https://pubs.rsc.org/en/content/articlehtml/2023/dd/d3dd00048f]
- 73. Scanning Electron Microscope Market Size, Global Trends, ... [https://straitsresearch.com/report/scanning-electron-microscope-market]
- 74. Scanning Electron Microscopy (SEM) [https://cemas.osu.edu/capabilities/scanning-electron-microscopy-sem]
- 75. AFM imaging of microbial biofilms [https://biocubic.com/afm-of-biofilms/]
- 76. 6 Applications of SEM & EDS in Pharmaceutical Sciences [https://www.nanoscience.com/blogs/6-applications-of-sem-eds-in-pharmaceutical-sciences/]