AFM vs. Rheology: A Comprehensive Guide to Characterizing Biofilm Viscoelasticity for Biomedical Research
Understanding the viscoelastic properties of biofilms is critical for developing strategies to combat biofilm-associated infections and leverage beneficial biofilms in industry.
AFM vs. Rheology: A Comprehensive Guide to Characterizing Biofilm Viscoelasticity for Biomedical Research
Abstract
Understanding the viscoelastic properties of biofilms is critical for developing strategies to combat biofilm-associated infections and leverage beneficial biofilms in industry. This article provides a systematic comparison of Atomic Force Microscopy (AFM) and rheology, the two principal techniques for quantifying biofilm mechanics. We explore the foundational principles of biofilm viscoelasticity, detail the methodological workflows for both techniques, address common troubleshooting and optimization challenges, and present strategies for data validation and complementary use. Aimed at researchers, scientists, and drug development professionals, this review synthesizes current knowledge to guide the selection, application, and interpretation of mechanical characterization methods for complex biofilm systems.
Understanding Biofilm Viscoelasticity: Why Mechanical Properties Matter in Health and Disease
In the study of biofilm viscoelasticity, researchers rely on fundamental parameters to quantify how these complex biological materials behave under stress and deformation. The storage modulus (G') measures the solid-like, elastic energy stored in the material, the loss modulus (G") quantifies the liquid-like, viscous energy dissipated, and the creep compliance (J(t)) describes the time-dependent strain under a constant applied stress. The choice of characterization technique, whether bulk rheology or atomic force microscopy (AFM), significantly influences the measurement and interpretation of these parameters, as each method probes different aspects of the heterogeneous biofilm structure [1] [2] [3].
Parameter Definitions and Significance in Biofilms
The following table defines these core parameters and explains their significance in the context of biofilm research.
Table 1: Core Viscoelastic Parameters in Biofilm Research
| Parameter | Definition | Physical Significance in Biofilms |
|---|---|---|
| Storage Modulus (G') | The elastic component of the complex modulus, representing the energy stored and recovered per cycle during deformation [4]. | A higher G′ indicates a more rigid and structurally stable biofilm. This stiffness is often linked to a dense, crosslinked extracellular polymeric substance (EPS) network, providing mechanical robustness and resistance to external forces [2]. |
| Loss Modulus (G") | The viscous component of the complex modulus, representing the energy dissipated as heat per cycle during deformation [4]. | A higher G″ indicates a more fluid-like, dissipative material. This reflects the biofilm's ability to flow, rearrange, and absorb energy, which is crucial for adaptation to shear stresses and resilience [1]. |
| Creep Compliance (J(t)) | A time-dependent measure of a material's tendency to deform under a constant load, calculated as strain divided by stress [3]. | Creep compliance reveals the biofilm's long-term stability and structural integrity. A biofilm that creeps significantly over time may be more susceptible to detachment, while one that resists creep maintains its shape and attachment under persistent force [5]. |
The ratio of the loss modulus to the storage modulus, known as tan δ (G"/G'), is also a critical parameter. It defines the overall material character: a tan δ < 1 (G' > G") signifies a solid-like, elastic-dominant behavior, whereas a tan δ > 1 (G" > G') indicates a fluid-like, viscous-dominant behavior [1].
AFM vs. Rheology: A Technical Comparison
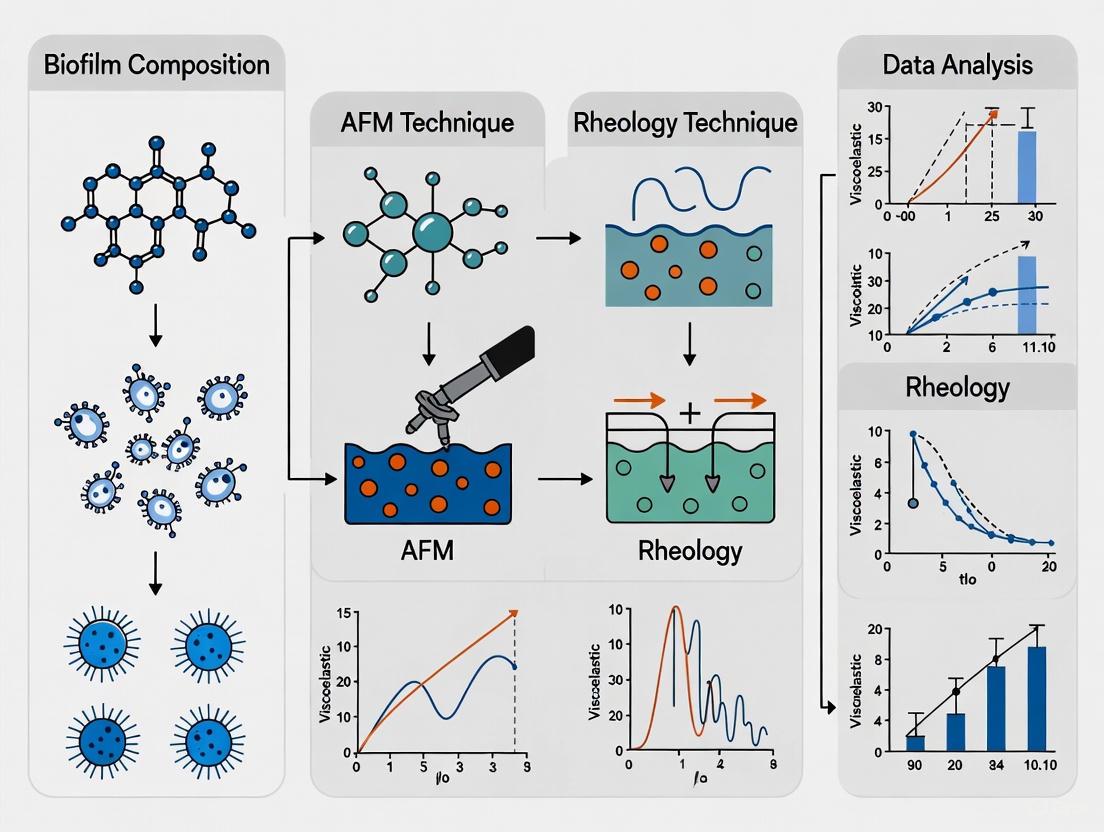
Atomic Force Microscopy (AFM) and rheology offer complementary insights but operate on fundamentally different principles and scales. The following workflow illustrates a combined approach for comprehensive biofilm characterization:
Diagram 1: Workflow for multi-scale biofilm viscoelasticity analysis.
The technical distinctions between the two techniques are significant and are summarized in the table below.
Table 2: Technical Comparison of AFM and Rheology for Biofilm Characterization
| Feature | Atomic Force Microscopy (AFM) | Bulk Rheology |
|---|---|---|
| Measurement Scale | Localized (Nanoscale to Microscale): Probes single cells, specific biofilm regions (e.g., voids vs. clusters), and matrix components [6] [3]. | Bulk (Macroscale): Averages the response of the entire sample (mm-scale), providing a global property [2]. |
| Spatial Resolution | High: Can map heterogeneity with single-cell or sub-cellular resolution [6] [7]. | Low: Provides a single value for the whole sample, obscuring local variations [3]. |
| Primary Parameters | - Local Storage & Loss Moduli (G', G") [7].- Local Creep Compliance, J(t) [7].- Adhesion forces and surface topography. | - Bulk Storage & Loss Moduli (G', G") [2] [4].- Bulk Creep Compliance, J(t) [5].- Complex viscosity. |
| Key Advantage | Reveals spatial heterogeneity and correlates structure with function at the microscale [1] [3]. | Excellent for assessing overall mechanical stability, response to environmental changes, and screening anti-biofilm agents [1] [2]. |
| Key Limitation | Small scan area (<100 µm) may not represent the entire biofilm; can be slow and require specialized operation [6]. | Requires significant sample volume; homogenization for measurement can destroy native biofilm architecture [2]. |
| Typical Experimental Output | Force-distance curves, topographical maps, nanomechanical property maps. | Flow curves, amplitude sweeps, frequency sweeps, creep-recovery curves. |
Experimental Data from Comparative Studies
Recent studies have quantified biofilm viscoelastic properties, highlighting how composition and technique influence the results.
Table 3: Experimental Viscoelastic Data from Biofilm Studies
| Biofilm System / Material | Technique | Experimental Conditions | Storage Modulus (G') | Loss Modulus (G") | Creep Compliance (J(t)) | Key Finding | Source |
|---|---|---|---|---|---|---|---|
| E. coli (at interface) | Interfacial Rheology | Maturation phase | 0.057 Pa·m | 0.016 Pa·m | Not Reported | The biofilm exhibited solid-dominant behavior (G' > G") at the air-liquid interface during maturation. | [4] |
| E. coli AR3110 (with Curli & pEtN-cellulose) | Microindentation & Shear Rheology | Native vs. Homogenized | Stiff in compression (microindentation) | Not Specified | Not Reported | Biofilms with a dense fiber network were stiffer. Homogenization for bulk rheology destroyed the macroscale structure, altering measured properties. | [2] |
| Carbon Black-Filled Rubber (Model Viscoelastic Solid) | DMA & Creep Test | Conversion from dynamic modulus | Master curve constructed | Master curve constructed | ~0.0055 (RMSE vs. experiment) | Demonstrated a reliable mathematical conversion between dynamic modulus (G*) and creep compliance, validating the link between oscillatory and transient tests. | [5] |
| Retinal Pigmented Epithelium (RPE) Cells | AFM-based Microrheology | Oscillatory test, power-law model | G₀ = 580 ± 60 Pa | Derived from complex modulus | J(t) = (1/E₀)(t/t₀)ᵝ E₀=580 Pa, β=0.17 | AFM successfully applied both oscillatory tests (for G* and G") and creep compliance on a biological sample, with parameters from different tests showing strong correlation. | [7] |
Detailed Experimental Protocols
To ensure reproducibility, below are detailed methodologies for key experiments cited in this guide.
AFM-based Creep Compliance and Oscillatory Microrheology
This protocol is used for local, single-cell measurements [7].
- Cell Preparation: Culture cells (e.g., hTERT-RPE1 cells) on a dish in a liquid environment at physiological temperature.
- AFM Setup: Use an AFM cantilever with a spherical indenter tip. Position the cantilever above the region of interest (e.g., the cell nucleus or periphery).
- Creep Compliance Test:
- Step 1: Approach the cell surface and apply a constant force.
- Step 2: Maintain this constant force while recording the indentation depth as a function of time.
- Step 3: Analyze the time-dependent strain (indentation) data. The creep compliance, J(t), is often described by a power-law model:
J(t) = (1/E₀)(t/t₀)ᵝ, where E₀ is the modulus scaling factor and β is the power-law exponent (fluidity) [7].
- Oscillatory Microrheology Test:
- Step 1: Position the cantilever at a set indentation depth on the cell.
- Step 2: Apply a small oscillatory stress (or strain) over a frequency range.
- Step 3: Measure the resulting oscillatory strain (or stress) and the phase shift between them.
- Step 4: Calculate the complex modulus G(ω), and from it, decompose the elastic storage modulus (G') and viscous loss modulus (G"*).
Bulk Shear Rheology of Macrocolony Biofilms
This protocol is used for measuring the bulk average properties of a biofilm [2].
- Biofilm Growth: Grow macrocolony biofilms (e.g., of E. coli strains) on nutritive agar plates for a defined period (e.g., 7 days).
- Sample Preparation (Destructive):
- Step 1: Scrape the biofilm from the agar substrate using a spatula.
- Step 2: Homogenize the collected biofilm material to create a uniform sample for rheometry. (Note: This step destroys the native biofilm architecture) [2].
- Sample Preparation (Non-Destructive): As an alternative, grow the biofilm directly on a semi-permeable membrane placed on the agar, allowing for transfer to the rheometer with less structural damage.
- Rheometry:
- Step 1: Load the biofilm sample onto the rheometer plate (e.g., a parallel plate geometry).
- Step 2: Perform an amplitude sweep to determine the linear viscoelastic region (LVER).
- Step 3: Within the LVER, conduct a frequency sweep to measure G'(ω) and G"(ω) as functions of angular frequency.
- Step 4: For creep compliance, apply a constant shear stress and measure the resulting strain over time. The creep compliance is calculated as
J(t) = γ(t) / σ₀, whereγ(t)is the time-dependent strain andσ₀is the applied constant stress.
Particle-Tracking Microrheology
This technique bridges micro- and macro-scales by measuring the motion of embedded probes within the biofilm [3].
- Biofilm Growth and Bead Implantation: Grow biofilms (e.g., of P. fluorescens) in the presence of fluorescent microparticles (e.g., 1 µm diameter carboxylate beads).
- Data Acquisition: Use Confocal Laser Scanning Microscopy (CLSM) to acquire time-lapsed images (xyt-stacks) of the beads' Brownian motion within the 3D biofilm structure.
- Data Analysis:
- Step 1: Track the trajectory of each bead over time.
- Step 2: For each trajectory, calculate the Mean Squared Displacement (MSD) as a function of lag time.
- Step 3: Calculate the local creep compliance, J(t), from the MSD using the Generalized Stokes-Einstein Relation:
J(t) = (3πa / kₚT) * MSD(t), whereais the bead radius,kₚis Boltzmann's constant, andTis temperature [3].
The Scientist's Toolkit: Essential Reagents and Materials
Table 4: Key Research Reagents and Solutions for Biofilm Viscoelasticity
| Item | Function in Research | Specific Examples / Notes |
|---|---|---|
| Bacterial Strains | Model organisms for studying biofilm formation and mechanics. | Escherichia coli K-12 mutants (varying Curli/Cellulose production) [2], Pseudomonas fluorescens [3], Pantoea sp. YR343 [6]. |
| Growth Media | Provides nutrients for consistent and reproducible biofilm growth. | Luria-Bertani (LB) broth, King B broth, Salt-free LB agar [2] [4] [3]. |
| Chemical Supplements | Modulate biofilm matrix composition and ionic environment. | Calcium chloride (CaCl₂) to study the effect of divalent cations on EPS cross-linking and mechanics [3]. |
| Fluorescent Probes | Enable visualization and tracking within the biofilm matrix. | Carboxylate microbeads (for particle-tracking microrheology) [3], fluorescent dyes for Confocal Laser Scanning Microscopy (CLSM) [8]. |
| AFM Cantilevers | Nanoscale probes for indentation and force measurement. | Tips with specific spring constants and geometries (e.g., spherical indenters for cell mechanics) [7]. |
| Rheometer Geometries | Interface for applying controlled stress/strain to bulk samples. | Parallel plates, cone-and-plate, or biconical disks (for interfacial rheology) [2] [4]. |
| Software Packages | Data analysis, model fitting, and visualization of rheological data. | Open-source tools like pyRheo for Python, used for fitting creep, stress relaxation, and oscillatory data with advanced viscoelastic models [9]. |
The relationships between these components in a typical research setup are visualized below:
Diagram 2: Key components and their relationships in biofilm viscoelasticity research.
The concept of biofilms as a "city of microbes" provides a powerful metaphor for understanding these structured microbial communities. Within this city, the Extracellular Polymeric Substance (EPS) matrix serves as the fundamental architectural framework, literally the "house of the biofilm cells" that determines the immediate conditions of life for embedded microorganisms [10]. This complex, dynamic assemblage of biopolymers—recently termed the "matrixome"—comprises not just polysaccharides but a wide variety of proteins, glycoproteins, glycolipids, extracellular DNA (e-DNA), and lipids that collectively establish the functional and structural integrity of biofilms [10] [11]. The composition of the EPS matrix is not merely structural; it provides emergent properties including surface adhesion, spatial and chemical heterogeneities, synergistic polymicrobial interactions, antimicrobial recalcitrance, and biofilm virulence [11].
Understanding the mechanical properties of this living material, particularly its viscoelasticity—the simultaneous exhibition of viscous liquid-like and elastic solid-like behavior—is crucial for both controlling pathogenic biofilms and exploiting beneficial ones. This guide provides an objective comparison of two principal methodologies—Atomic Force Microscopy (AFM) and rheology—for quantifying biofilm viscoelastic properties, offering researchers a framework for selecting appropriate techniques based on their specific research requirements.
Methodological Comparison: AFM vs. Rheology for Viscoelasticity Assessment
Core Technical Principles and Measurement Capabilities
Atomic Force Microscopy (AFM) operates through a physical probe with a nanoscale tip that scans across or indents into a biofilm surface, directly measuring force-displacement relationships. This technique provides nanoscale spatial resolution, allowing for the mapping of local mechanical properties including elastic modulus, adhesive forces, and cohesive energy [12] [1]. Recent applications have enabled the in situ measurement of cohesive energy levels within moist biofilms, with values ranging from 0.10 ± 0.07 nJ/μm³ in upper layers to 2.05 ± 0.62 nJ/μm³ in deeper regions of 1-day-old biofilms [12]. The technique is particularly valuable for assessing region-specific properties and interfacial interactions.
Rheology, typically employing parallel plate or cone-plate geometries, applies controlled stresses or strains to bulk biofilm samples to measure their mechanical response. This approach provides bulk material properties including complex modulus (G*), storage modulus (G'- elastic component), loss modulus (G"- viscous component), and creep compliance [1] [13]. Rheology excels in characterizing the time-dependent, deformation-response behaviors of biofilms under conditions mimicking fluid shear environments, with studies demonstrating that biofilm viscoelasticity facilitates resistance to detachment and enables rolling migration in response to fluid shear [1].
Table 1: Fundamental Characteristics of AFM and Rheology for Biofilm Viscoelasticity Research
| Feature | Atomic Force Microscopy (AFM) | Rheology |
|---|---|---|
| Core Principle | Mechanical probing with nanoscale tip | Application of controlled stress/strain to bulk sample |
| Spatial Resolution | Nanoscale to microscale | Bulk/averaged measurement |
| Measurement Scale | Localized (nano- to micro- level) | Macroscopic (millimeter scale) |
| Primary Mechanical Parameters | Elastic modulus, adhesion force, cohesive energy | Storage/loss moduli, complex viscosity, creep compliance |
| Key Strength | Mapping spatial heterogeneity; measures under humidity | Simulates fluid shear conditions; established protocols |
| Main Limitation | Limited to surface/subsurface regions; small sampling area | Requires substantial biofilm volume; limited spatial data |
Experimental Protocols for Viscoelasticity Quantification
AFM Cohesive Energy Measurement Protocol
The following protocol for measuring biofilm cohesive energy using AFM has been adapted from established methodologies [12]:
Biofilm Cultivation: Grow biofilms on appropriate substrates (e.g., membrane test modules, glass coverslips) using relevant microbial strains and culture conditions. For mixed culture environmental biofilms, inoculate with activated sludge and cultivate in reactors with defined nutrient feed (e.g., sodium acetate, ammonium chloride) [12].
Sample Preparation: Extract substrate with attached biofilm and equilibrate in a humidity-controlled chamber (e.g., ~90% relative humidity using saturated NaCl solution) for approximately 1 hour to maintain consistent hydration without excess water [12].
Atomic Force Microscopy Setup:
- Mount biofilm sample on AFM stage with humidity control.
- Select appropriate cantilevers (e.g., V-shaped Si₃N₄ tips with spring constant of 0.58 N/m).
- Establish non-perturbative imaging parameters (low applied load ~0 nN).
Cohesive Energy Measurement Sequence:
- Obtain initial topographic image of a 5×5 μm region at low applied load.
- Zoom to a 2.5×2.5 μm subregion and perform abrasive scanning under elevated load (40 nN) with repeated raster scans.
- Return to low load and capture post-abrasion 5×5 μm topographic image.
- Calculate displaced biofilm volume through image subtraction.
- Determine frictional energy dissipation from cantilever deflection during abrasion.
- Compute cohesive energy (nJ/μm³) as the ratio of frictional energy to displaced volume [12].
The experimental workflow for AFM cohesive energy measurement is summarized in the following diagram:
Microrheology Creep Compliance Protocol
Particle-tracking microrheology, which can be considered a bridge between traditional AFM and bulk rheology, offers an alternative approach for assessing local mechanical properties within biofilms [3]:
Fluorescent Bead Preparation: Prepare carboxylate fluorescent microbeads (1 μm diameter) by repeated centrifugation and resuspension in MilliQ water to remove surfactant contaminants, followed by final suspension in sterile PBS buffer [3].
Bead Implantation and Biofilm Growth: Add fluorescent beads to culture medium at final concentration of 5×10⁵ beads mL⁻¹ during biofilm cultivation. For P. fluorescens biofilms, grow on partially submerged coverslips in King B broth with appropriate antibiotics at 28°C with shaking [3].
Confocal Laser Scanning Microscopy: Acquire time-series image stacks (xyt-) using CLSM with appropriate excitation/emission wavelengths for both biofilm cells (e.g., mCherry at 559/603 nm) and embedded beads (e.g., 488/519 nm). Collect images through a 60× oil objective with z-step of 1 μm and time increments of 2.25 seconds for approximately 135 seconds [3].
Particle Trajectory and Mean Square Displacement Analysis:
- Track bead movements using particle tracking software (e.g., Diatrack).
- Calculate Mean Square Displacement (MSD) for each trajectory: MSD = ⟨Δr²(τ)⟩ = ⟨r(t+τ) - r(t)⟩².
- Classify beads into mobile and confined populations based on statistical analysis of trajectory ranges and standard deviations [3].
Creep Compliance Calculation: Compute local creep compliance (J) from MSD data: J = (3πd)/(4kBT) × ⟨Δr²(t)⟩, where d is bead diameter, kB is Boltzmann constant, and T is temperature [3].
Comparative Experimental Data and Technical Performance
Quantitative Measurement Comparisons
Direct comparison of experimental data reveals how these techniques provide complementary information about biofilm mechanical properties, influenced by environmental factors such as ionic composition and cultivation time.
Table 2: Experimentally Measured Viscoelastic Parameters by AFM and Microrheology
| Technique | Biofilm System | Experimental Conditions | Measured Parameters | Key Findings |
|---|---|---|---|---|
| AFM Cohesive Energy [12] | Mixed culture (activated sludge) | 1-day biofilm; with/without 10 mM Ca²⁺ | Cohesive energy: 0.10 to 2.05 nJ/μm³ (increasing with depth) | Calcium increased cohesion from 0.10 ± 0.07 to 1.98 ± 0.34 nJ/μm³ |
| Particle-Tracking Microrheology [3] | Pseudomonas fluorescens | 24h vs 48h; with/without 15 mM Ca²⁺ | Creep compliance (J) | Calcium supplementation and longer incubation (48h) increased elasticity (lower J) |
| AFM Friction Analysis [12] | Mixed culture (activated sludge) | Humidity-controlled (90% RH) | Frictional energy dissipation | Energy dissipation correlated with biofilm depth and composition |
| Bulk Rheology [1] | Staphylococcus aureus | Fluid shear conditions | Storage (G') and loss (G") moduli | Biofilms exhibited solid-like behavior (G' > G") facilitating resistance to detachment |
Technical Performance and Practical Considerations
The selection between AFM and rheology involves important practical considerations that affect their applicability for specific research scenarios:
Table 3: Technical Performance and Practical Implementation Comparison
| Performance Metric | Atomic Force Microscopy (AFM) | Rheology |
|---|---|---|
| Spatial Resolution | High (nanometer scale) [12] [1] | Low (millimeter scale, bulk average) [3] |
| Sample Preparation | Moderate (requires flat substrate, humidity control) [12] | Simple to moderate (may require sample stacking) [1] |
| Measurement Environment | Humidity control for hydrated samples [12] | Full hydration possible in solvent chamber [1] |
| Measurement Throughput | Low (single point or small area mapping) [1] | High (bulk properties in single measurement) [13] |
| Data Interpretation | Complex (requires contact mechanics models) [12] [1] | Straightforward (direct viscoelastic parameters) [1] [3] |
| Specialized Requirements | Vibration isolation, humidity control [12] | Precise temperature control, significant biofilm biomass [1] |
The Scientist's Toolkit: Essential Research Reagents and Materials
Successful implementation of biofilm viscoelasticity research requires specific reagents and materials tailored to each methodology:
Table 4: Essential Research Reagents and Materials for Biofilm Viscoelasticity Studies
| Category | Specific Items | Function/Application | Methodology |
|---|---|---|---|
| Biofilm Cultivation | Membrane test modules [12], Flow cell reactors [1] | Provide controlled surfaces for reproducible biofilm growth | Both AFM & Rheology |
| Chemical Modulators | Calcium chloride (10-15 mM) [12] [3] | Increases biofilm cohesion by cross-linking anionic EPS components | Both AFM & Rheology |
| AFM-Specific Consumables | Si₃N₄ cantilevers (0.58 N/m spring constant) [12], Humidity control chambers [12] | Enable force measurement and biofilm hydration maintenance | AFM |
| Microrheology Materials | Fluorescent carboxylate microbeads (1 μm) [3], Diatrack software [3] | Serve as probes for local mechanical properties within biofilms | Microrheology |
| Rheology Accessories | Parallel plate geometries [1], Solvent traps [1] | Prevent sample dehydration during extended measurements | Rheology |
| EPS Components | Alginate, cellulose, amyloid proteins, e-DNA [10] | Key structural determinants of biofilm mechanical properties | Both (for mechanistic studies) |
Research Applications and Strategic Implementation
Application-Specific Workflow Selection
The choice between AFM and rheology should be guided by specific research questions and application requirements, as each technique offers distinct advantages for different scenarios:
AFM is optimally suited for:
- Spatial mapping of mechanical heterogeneity within biofilms [12] [1]
- Nanoscale interactions including cell-EPS and EPS-EPS interactions [12]
- Thin or early-stage biofilms where bulk methods lack sensitivity [12]
- Surface-dominated phenomena such as adhesion and cohesion [12]
Rheology is preferable for:
- Bulk material properties under conditions mimicking natural environments [1] [13]
- Time-dependent studies of biofilm development and maturation [1]
- High-throughput screening of anti-biofilm agents or matrix modifiers [1]
- Fluid-structure interactions relevant to industrial flow conditions [13]
Integrated Workflow for Comprehensive Characterization
For comprehensive biofilm characterization, researchers are increasingly adopting integrated approaches that combine multiple techniques. The following workflow illustrates how AFM and rheology can be complementary:
This integrated approach acknowledges that biofilm mechanics span multiple scales—from nanoscale polymer interactions to bulk material behavior—requiring complementary techniques for complete characterization.
The comparative analysis of AFM and rheology for biofilm viscoelasticity research reveals distinct yet complementary capabilities. AFM provides unparalleled spatial resolution for mapping mechanical heterogeneity at the nanoscale, making it ideal for investigating localized matrix properties and interfacial interactions. Rheology delivers robust characterization of bulk viscoelastic properties under conditions relevant to natural and industrial environments, enabling prediction of biofilm behavior under fluid shear and mechanical stress.
The optimal methodology selection depends fundamentally on the research question: AFM for structure-function relationships at the micro- and nanoscale, and rheology for bulk material properties and time-dependent behaviors. For comprehensive understanding, integrated approaches that combine these techniques with advanced imaging and molecular analysis offer the most powerful strategy for elucidating the complex structure-property relationships within the EPS matrixome that define biofilm function and resistance.
Linking Mechanical Properties to Biofilm Survival and Virulence in Infections
Bacterial biofilms represent a primary mode of growth for microorganisms in nature, forming structured communities encased in a self-produced extracellular polymeric substance (EPS) matrix that confers significant survival advantages [14] [15]. These biophysical communities exhibit complex viscoelastic properties that directly influence their persistence and pathogenicity in clinical settings [14]. The mechanical characteristics of biofilms—blending both solid-like elastic behavior and liquid-like viscous flow—enable them to withstand mechanical and chemical challenges, facilitating resistance to both host immune responses and antimicrobial treatments [1] [14]. Understanding and quantifying these properties has become crucial for developing effective anti-biofilm strategies, with atomic force microscopy (AFM) and rheology emerging as the two principal characterization techniques [1]. This guide provides a comparative analysis of these methodologies, examining their respective capabilities in elucidating the structure-function relationships that underpin biofilm-associated infections and their recalcitrance to treatment.
Technical Comparison: AFM vs. Rheology for Biofilm Analysis
Fundamental Principles and Measurement Capabilities
Atomic Force Microscopy (AFM) operates through physical interaction between a nanoscale tip and the biofilm surface, enabling direct measurement of mechanical properties at micro- and nanoscale resolutions [1] [16]. This technique provides three-dimensional topography imaging alongside quantitative assessment of adhesive forces and local viscoelastic parameters through approaches such as microbead force spectroscopy (MBFS) and creep-compliance testing [16] [17] [12]. In contrast, bulk rheology characterizes the mechanical response of biofilm samples to applied shear stresses, typically using rotational or oscillatory rheometers to measure viscoelastic moduli that represent the average mechanical behavior across the entire sample volume [14]. This method quantifies key parameters such as storage modulus (G'), loss modulus (G"), and complex viscosity, which define how biofilms dissipate energy under deformation [14].
Direct Comparative Analysis of Techniques
The table below summarizes the core technical attributes and performance characteristics of AFM versus rheology for biofilm viscoelasticity research:
Table 1: Technical comparison of AFM and rheology for biofilm viscoelasticity assessment
| Characteristic | Atomic Force Microscopy (AFM) | Bulk Rheology |
|---|---|---|
| Measurement Principle | Force sensing via cantilever deflection [16] | Applied shear stress/strain [14] |
| Spatial Resolution | Nanoscale to microscale (nm-μm) [16] [17] | Macroscopic (mm-scale) [14] |
| Primary Mechanical Outputs | Adhesive forces, Young's modulus, cohesive energy [16] [12] | Storage/loss moduli (G', G"), yield stress, viscosity [14] |
| Key Strengths | Nanoscale mapping, adhesion quantification, minimal sample preparation [16] [17] | Bulk material properties, time-dependent behavior, standardized protocols [14] |
| Inherent Limitations | Limited volume assessment, potential surface artifacts [16] | No spatial heterogeneity data, requires substantial sample [14] |
| Typical Experimental Output | Adhesive pressure: 19-332 Pa [16]; Cohesive energy: 0.10-2.05 nJ/μm³ [12] | Shear moduli: Pa – kPa range [14] |
| Sample Requirements | Small surface-adhered biofilms [16] | Larger volume samples (mL) [14] |
Experimental Design and Workflow
The following diagram illustrates the fundamental operational principles and experimental workflows for both AFM and rheology in biofilm mechanics research:
Diagram 1: AFM and Rheology Experimental Workflows
Linking Mechanical Properties to Biofilm Virulence
Viscoelasticity as an Adaptive Survival Mechanism
The viscoelastic character of biofilms represents a fundamental adaptive strategy that enhances their survival in hostile environments, particularly during infection [14]. This mechanical duality enables biofilms to dissipate energy through viscous flow while maintaining structural integrity through elastic recovery, providing resistance to both mechanical clearance attempts and antimicrobial penetration [14]. The EPS matrix composition—including polysaccharides, proteins, extracellular DNA, and lipids—directly determines these mechanical properties, with specific components such as calcium ions cross-linking polymer chains to increase cohesive strength [15] [12]. This cross-linking enhances the matrix's ability to withstand physiological shear forces in infection contexts, such as blood flow in endocarditis or urinary flow in catheter-associated infections [14].
Quantitative Relationships Between Mechanics and Pathogenicity
Research has established direct correlations between measurable mechanical parameters and biofilm virulence phenotypes. Key relationships include:
- Increased cohesion and adhesion directly enhance biofilm persistence on biological and synthetic surfaces, with measured cohesive energy values ranging from 0.10 nJ/μm³ in underdeveloped biofilms to 2.05 nJ/μm³ in mature, robust structures [12].
- Yield stress and strain determine the mechanical point at which biofilm structure fails, with higher yield points correlating with increased resistance to physiological shear forces and immune cell-mediated clearance [14].
- Viscoelastic spectra, characterized through frequency-dependent moduli, reveal structural organization that impedes antibiotic diffusion, with more elastic-dominated biofilms demonstrating greater resistance to penetration [14].
The following diagram illustrates how specific mechanical properties contribute to distinct virulence mechanisms in biofilm-associated infections:
Diagram 2: Mechanical Properties Driving Biofilm Virulence
Experimental Protocols for Biofilm Mechanics
AFM Microbead Force Spectroscopy (MBFS) for Adhesion and Viscoelasticity
The MBFS technique provides a standardized approach for quantifying biofilm adhesive and viscoelastic properties under native conditions [16]. The protocol involves:
- Probe Preparation: Attach a 50-μm diameter glass bead to a tipless AFM cantilever, then coat with biofilm cells by incubating with bacterial suspension (OD₆₀₀ = 2.0) [16].
- System Calibration: Precisely determine cantilever spring constant (typically 0.015–0.060 N/m) using the thermal fluctuation method to ensure accurate force measurements [16].
- Force Measurement: Approach the biofilm-coated bead toward a clean glass surface with defined contact parameters (loading pressure, retraction speed, contact time) to maintain standardized conditions across experiments [16].
- Data Analysis: Calculate adhesive pressure from retraction force curves and model creep compliance data using a Voigt Standard Linear Solid model to extract instantaneous (E₁) and delayed (E₂) elastic moduli along with viscosity (η) [16].
Macro-Rheology for Bulk Viscoelastic Characterization
Oscillatory shear rheology provides characterization of bulk biofilm viscoelastic properties through a standardized protocol:
- Sample Loading: Carefully transfer intact biofilm to rheometer plate, ensuring minimal structural disruption, then lower upper plate to appropriate gap height (typically 0.5-1mm) [14].
- Strain Sweep: Apply oscillatory shear at constant frequency (e.g., 1 Hz) with increasing strain amplitude (0.01-100%) to determine the linear viscoelastic region and identify yield point [14].
- Frequency Sweep: Within linear region, measure storage (G') and loss (G") moduli across frequency range (e.g., 0.01-100 rad/s) to characterize time-dependent mechanical response [14].
- Creep-Recovery: Apply constant shear stress below yield point and monitor strain evolution over time, then remove stress and measure recovery, modeling data with Burgers model to extract viscoelastic parameters [14].
Essential Research Reagents and Materials
Successful experimental assessment of biofilm mechanics requires specific reagents and instrumentation. The following table details key research solutions for both AFM and rheology-based approaches:
Table 2: Essential Research Reagents and Instrumentation for Biofilm Mechanics
| Category | Specific Reagent/Instrument | Research Function | Application Examples |
|---|---|---|---|
| AFM Consumables | Tipless cantilevers (CSC12/Tipless) | Base for microbead attachment in MBFS [16] | Pseudomonas aeruginosa biofilm adhesion studies [16] |
| Glass microbeads (50 μm diameter) | Defined geometry for quantifiable contact area [16] | Standardized adhesion measurements [16] | |
| Rheology Accessories | Parallel plate geometry (e.g., 20-40mm diameter) | Applied controlled shear stress to biofilm samples [14] | Bulk viscoelastic moduli measurement [14] |
| Chemical Modulators | Calcium chloride (10 mM) | Increases biofilm cohesion via ionic cross-linking [12] | Cohesive energy studies in activated sludge biofilms [12] |
| Biofilm Cultivation | Membrane bioreactors | Supports reproducible biofilm growth on retrierable surfaces [12] | Cohesion depth profiling [12] |
| Model Organisms | Pseudomonas aeruginosa PAO1 | Well-characterized gram-negative biofilm former [16] | Genetic determinants of mechanics [16] |
Integrated Approaches and Future Perspectives
The complementary nature of AFM and rheology suggests that integrated methodological approaches provide the most comprehensive understanding of biofilm mechanical properties [1]. While rheology characterizes bulk material behavior relevant to biofilm persistence under fluid shear, AFM reveals nanoscale heterogeneities in mechanical properties that may initiate detachment or govern localized antibiotic penetration [1] [16]. Emerging techniques including microrheology and microsensor technology further enrich this analytical landscape by enabling characterization of local mechanical environments and chemical gradients within biofilms [18].
Future advances in biofilm mechanics research will likely focus on in situ characterization during antimicrobial treatments, real-time monitoring of mechanical changes during biofilm development, and standardized methodologies enabling direct comparison between research studies [14]. Additionally, the connection between mechanical properties and therapeutic efficacy is driving interest in phage-based therapies and engineered phage-derived enzymes that degrade specific EPS matrix components, altering biofilm mechanical integrity and enhancing antibiotic penetration [15] [19]. These approaches represent promising avenues for combating biofilm-associated infections by specifically targeting the mechanical traits that underpin their resilience.
The extracellular polymeric substance (EPS) is a complex matrix that determines the structural integrity and functional properties of bacterial biofilms. Among its diverse components, proteinaceous fibers and polysaccharides play a predominant role in defining mechanical stability. This guide objectively compares two key EPS biopolymers—curli amyloid fibers and cellulose fibrils—through the analytical lenses of atomic force microscopy (AFM) and rheology. These techniques provide complementary insights: AFM reveals nanoscale structural and mechanical properties, while rheology quantifies bulk viscoelastic behavior. Understanding how EPS composition influences biofilm material properties is crucial for developing anti-biofilm strategies in medical contexts and optimizing beneficial biofilms in industrial applications.
Fundamental Properties of Curli and Cellulose
Table 1: Fundamental Characteristics of Curli Amyloid and Cellulose Fibers
| Property | Curli Amyloid Fibers | Cellulose Nanofibrils |
|---|---|---|
| Chemical Nature | Proteinaceous functional amyloid [20] | Polysaccharide [21] |
| Primary Function | Major proteinaceous biofilm matrix component; structural scaffolding [20] | Provides structural integrity in bacterial and plant-based biofilms [21] |
| Key Structural Subunits | CsgA (major subunit), CsgB (nucleator) [20] | Cellulose chains assembled into fibrils [22] |
| Supramolecular Structure | Cross-β spine architecture; stacked β-helical subunits forming robust fibrils [20] [23] | Crystalline and amorphous regions in fibrillar networks [22] |
| Typical Width/Height | 4-6 nm (width) [20]; ~1.7 nm (AFM height) [24] | Varies with processing; reduced dimensions after homogenization [21] |
| Unique Properties | Extreme stability (SDS-resistant); Congo red birefringence [20] | High tensile strength; biodegradability; shear-thinning behavior [22] [21] |
Experimental Data on Mechanical and Viscoelastic Properties
Table 2: Experimentally Measured Mechanical and Viscoelastic Properties
| Material & System | Technique | Key Findings | Quantitative Data |
|---|---|---|---|
| Curli (in vitro CsgA fibers) | High-speed AFM [24] | Polar growth with "stop-and-go" dynamics; one-step nucleation | Fiber height: 1.7 ± 0.4 nm; Burst elongation at high subunit concentrations |
| Curli (E. coli biofilm) | AFM-based cohesiveness measurement [12] | Cohesive energy increases with biofilm depth and calcium addition | 0.10 ± 0.07 nJ/µm³ (top) to 2.05 ± 0.62 nJ/µm³ (deep layers); +Ca²⁺: up to 1.98 ± 0.34 nJ/µm³ |
| Cellulose Nanofibrils (0.5% w/w) | Bulk Rheology [22] | True gel-like behavior; strain stiffening >10% strain; viscosity increases with UHPH processing pressure | Enhanced rheology proportional to UHPH pressure (500-3500 bar) |
| Pseudomonas fluorescens Biofilm | Particle-tracking Microrheology [25] | Creep compliance primarily determined by void zones; higher heterogeneity in 48h vs 24h biofilms | Region-specific compliance: void zones > 5x more compliant than cluster regions |
Methodologies for EPS Analysis
Atomic Force Microscopy (AFM) Protocols
AFM for Curli Assembly Kinetics
- Sample Preparation: Purified CsgA monomers are isolated from E. coli and stored in denaturing buffer (e.g., with hexafluoroisopropanol). Polymerization is initiated by buffer exchange into native conditions [24].
- Imaging Protocol: Time-lapse AFM is performed in tapping mode under liquid or ambient conditions. A sharp silicon nitride tip (typical spring constant ~0.58 N/m) is used. Images are captured consecutively with minimal delay to monitor real-time fiber growth [24] [26].
- Data Analysis: Fiber length is measured over time to calculate elongation rates. "Stop-and-go" dynamics are quantified by analyzing growth bursts and stagnation periods from time-resolved image stacks [24].
AFM for Biofilm Cohesiveness
- Sample Preparation: Biofilms are grown on solid substrates (e.g., membrane). For in situ measurement, samples are equilibrated in a humidity chamber (~90%) to maintain hydration without submersion [12].
- Measurement Protocol: Topography is first imaged at low force (~0 nN). A defined region is then repeatedly scanned (4x raster scans) at high applied load (40 nN) to induce abrasion. Post-abrasion topography is re-imaged at low force [12].
- Data Analysis: The volume of removed biofilm is calculated from height differences. Cohesive energy is computed as the frictional energy dissipated per unit volume ablated [12].
Rheological Characterization Protocols
Bulk Rheology of Cellulose Suspensions
- Sample Preparation: Microcrystalline cellulose suspensions (0.5-1% w/w) are processed using ultra-high-pressure homogenization (UHPH) at pressures ranging from 500 to 3500 bar [22].
- Measurement Protocol: A cone-and-plate rheometer is used. Amplitude sweep tests are performed to determine the linear viscoelastic region. Frequency sweeps (e.g., 0.1-100 rad/s) at a fixed strain within the linear region quantify storage (G') and loss (G'') moduli. Flow curves measure viscosity versus shear rate [22] [21].
- Data Analysis: Gel-like behavior is confirmed if G' > G'' across the frequency range. Power-law relationships are used to analyze the dependence of modulus on fibril concentration and aspect ratio [27].
Particle-Tracking Microrheology of Biofilms
- Sample Preparation: Fluorescent carboxylated microbeads (1 µm diameter) are incorporated into the biofilm during growth. Surfactants are removed via repeated centrifugation and resuspension in MilliQ water before adding to culture media [25].
- Measurement Protocol: Confocal Laser Scanning Microscopy (CLSM) acquires time-lapse image stacks (xyt) of beads embedded in the biofilm at different horizontal planes (bottom, middle, top). Tracking is performed for ~135 seconds [25].
- Data Analysis: Particle trajectories are analyzed using software like Diatrack. Mean Square Displacement (MSD) is calculated for each trajectory. Creep compliance (J) is derived from the MSD using the Generalized Stokes-Einstein relationship: J(t) = (3πa / kBT) * MSD(t), where a is bead radius [25].
Structural and Mechanical Relationships
The diagram illustrates how the distinct nanoscale architectures of curli and cellulose directly dictate the bulk mechanical properties of the biofilm. Curli's cross-β spine architecture, composed of stacked β-helical subunits, confers extreme robustness and resistance to surfactants like SDS [20] [23]. In contrast, cellulose forms a fibrillar network that, when homogenized, produces suspensions exhibiting true gel-like behavior with notable strain-stiffening at large deformations [22]. These fundamental structure-property relationships are quantifiable through the complementary techniques of AFM and rheology.
The Scientist's Toolkit: Key Reagents and Materials
Table 3: Essential Research Reagents and Solutions
| Reagent/Material | Function in Research | Application Context |
|---|---|---|
| Thioflavin T (ThT) | Fluorescent dye that exhibits enhanced emission upon binding amyloid structures. | Monitoring kinetics of curli fibrillation in vitro [20] [24]. |
| Congo Red | Histological dye that undergoes spectral shift when bound to β-sheet structures. | Macroscopic identification of curli-producing bacteria via colony staining [20]. |
| Ultra-High-Pressure Homogenizer | Applies intense shear forces to disintegrate cellulose fibers into nanofibrils. | Production of cellulose nanofibrils (CNFs) with defined morphology [22] [21]. |
| Carboxylated Fluorescent Microbeads | Inert probes embedded within the biofilm matrix for tracking Brownian motion. | Particle-tracking microrheology to measure local viscoelastic properties [25]. |
| CsgC Protein | A natural, dedicated inhibitor of curli fibrillation. | Studying curli assembly mechanisms; potential anti-biofilm agent [24]. |
Integrated Technique Comparison: AFM vs. Rheology
AFM and rheology provide fundamentally different but highly complementary data. AFM excels in resolving nanoscale structure and heterogeneity, directly visualizing single curli fibers and measuring local cohesive forces [24] [12]. Rheology captures the emergent, bulk mechanical behavior of the entire EPS network, quantifying overall stiffness (G') and energy dissipation (G'') [1] [22]. For instance, AFM revealed the polar growth and stop-and-go dynamics of single curli fibers [24], while bulk rheology characterized the gel-like, shear-thinning behavior of cellulose networks [22] [21]. Particle-tracking microrheology bridges these scales, providing spatially resolved mechanical data within the biofilm [25]. A complete analysis of EPS mechanics therefore requires an integrated methodological approach.
How Environmental Cations like Calcium Influence Biofilm Cohesiveness and Stiffness
Biofilms represent the predominant mode of bacterial growth in nature, consisting of microbial communities encased within a self-produced matrix of extracellular polymeric substances (EPS). The physical integrity of this matrix—its cohesiveness and stiffness—is fundamental to biofilm survival, governing its resistance to mechanical disruption and environmental stresses. Among various environmental factors, cations, particularly calcium (Ca²⁺), play a disproportionately significant role in determining these mechanical properties. Calcium ions influence biofilm architecture through specific interactions with anionic components of the EPS, primarily alginates and other polysaccharides, acting as molecular cross-linkers that enhance structural stability.
The investigation of biofilm mechanical properties presents substantial technical challenges, driving the development and refinement of characterization techniques. Two methodologies have emerged as particularly prominent: atomic force microscopy (AFM) and rheology. AFM provides nanoscale resolution of surface properties and local mechanical variations, while rheology characterizes bulk viscoelastic behavior. This guide objectively compares experimental data generated by these techniques, providing researchers with a structured framework for evaluating how cations modulate biofilm material properties and selecting appropriate methodologies for specific research questions.
Calcium cations enhance biofilm cohesiveness and stiffness primarily through ionic cross-linking of anionic functional groups within the extracellular polymeric substance. The biofilm matrix is rich in biopolymers like alginate, which contain guluronic acid residues possessing carboxyl groups. Divalent cations such as Ca²⁺ form coordinated ionic bridges between these carboxyl groups on adjacent polymer chains, creating a stable, interconnected three-dimensional network often described as an "egg-box" structure. This cross-linking densifies the polymer matrix, increasing its mechanical rigidity and resistance to deformation.
The following diagram illustrates this cross-linking mechanism and its structural consequences:
This cross-linking phenomenon has been quantitatively demonstrated across multiple biofilm systems. Research on mucoid Pseudomonas aeruginosa biofilms revealed a critical calcium concentration threshold where the elastic modulus increases dramatically, beyond which it stabilizes, indicating saturation of binding sites [28]. Similarly, studies of drinking water biofilms showed that high divalent ion conditions produce stiffer biofilms with higher calcium carbonate content, directly linking cation-mediated composition to mechanical properties [29].
Quantitative Comparison: AFM vs. Rheology in Measuring Cation Effects
The experimental measurement of cation-induced changes in biofilm mechanics employs distinct methodologies, each with characteristic parameters, scales, and applications. The following table summarizes key quantitative findings from both AFM and rheological approaches, highlighting how calcium cations influence specific mechanical parameters across different biofilm systems.
Table 1: AFM-Based Measurements of Cation Effects on Biofilm Mechanics
| Biofilm System | Calcium Concentration | Mechanical Parameter | Measurement Effect | Experimental Protocol |
|---|---|---|---|---|
| Pseudomonas aeruginosa SG81 (model biofilm) [28] | Variation across concentrations | Apparent Young's modulus (stiffness) | Strong increase beyond critical concentration, then plateau | Uniaxial compression of biofilm-grown filters (1 μm/s) |
| Activated sludge (mixed culture) [12] | 10 mM CaCl₂ added during cultivation | Cohesive energy | Increased from 0.10 ± 0.07 to 1.98 ± 0.34 nJ/μm³ | AFM abrasion test: scan-induced wear measurement under 40 nN load |
| P. aeruginosa PAO1 (wild-type vs. mutant) [30] | Native environmental levels | Adhesive pressure (mature biofilm) | 19 ± 7 Pa (wild-type) | Microbead force spectroscopy with closed-loop AFM |
| Drinking water biofilms [29] | High hardness groundwater | Local stiffness via AFM indentation | Significantly higher vs. low hardness biofilms | AFM force mapping at biofilm surface |
Table 2: Rheological Measurements of Cation Effects on Biofilm Mechanics
| Biofilm System | Calcium Concentration | Mechanical Parameter | Measurement Effect | Experimental Protocol |
|---|---|---|---|---|
| Pseudomonas fluorescens [3] | 15 mM CaCl₂ supplementation | Creep compliance (via particle tracking) | Reduced compliance (increased stiffness) | Single particle tracking microrheology combined with CLSM |
| Escherichia coli [31] | Native medium composition | Interfacial storage modulus (G′) during maturation | Reached 0.057 Pa·m | Interfacial rheology with biconical disk geometry |
| P. aeruginosa (rheometer studies) [29] | Multivalent ion exposure | Bulk stiffness | Significant increase after exposure | Parallel plate rheometry of harvested biofilms |
| Model P. aeruginosa biofilm [1] | Calcium-alginate crosslinking | Viscoelastic properties | Enhanced elasticity and yield stress | Bulk rheological characterization |
Experimental Protocols: Methodologies for Characterizing Cation Effects
Atomic Force Microscopy Approaches
AFM Abrasion Test for Cohesive Energy Measurement This method quantifies biofilm cohesion by measuring the energy required to dislodge unit volume of biofilm material [12]. Biofilms are grown on appropriate substrates (e.g., membrane filters), equilibrated at controlled humidity (∼90%), and mounted on the AFM stage. Researchers first collect a baseline topographic image of a 5×5 μm region at minimal load (∼0 nN). They then select a 2.5×2.5 μm subregion for abrasive scanning under elevated load (40 nN) with repeated raster scans. Post-abrasion, another low-force image captures the altered topography. The cohesive energy (nJ/μm³) is calculated from the frictional energy dissipated during scanning and the volume of displaced biofilm determined by image subtraction.
Microbead Force Spectroscopy for Adhesive and Viscoelastic Properties This technique uses bead-functionalized AFM cantilevers to measure adhesive pressures and viscoelastic parameters over defined contact areas [30]. Biofilms are grown under standardized conditions relevant to the cation concentrations being investigated. Force measurements are performed with a closed-loop AFM system using cantilevers modified with micron-sized beads to ensure defined contact geometry. Adhesive pressure is calculated from pull-off forces normalized to the bead contact area. Viscoelastic parameters are obtained by fitting creep compliance data to mechanical models (e.g., Voigt Standard Linear Solid model), providing instantaneous elastic modulus, delayed elastic modulus, and viscosity values that characterize the time-dependent mechanical response.
Rheological Approaches
Particle-Tracking Microrheology This in situ technique quantifies local mechanical properties within biofilms by tracking the motion of embedded probe particles [3]. Researchers incorporate fluorescent microbeads (typically 1 μm diameter) into the biofilm during growth. Using confocal laser scanning microscopy, they acquire time-lapse images of bead positions within the biofilm matrix. From these trajectories, the mean square displacement (MSD) is calculated for particles in different biofilm regions (voids, clusters) and at different heights. The creep compliance J(t) is then derived using the generalized Stokes-Einstein relationship: J(t) = (3πd/4kBT)⟨Δr²(t)⟩, where d is bead diameter, kB is Boltzmann's constant, T is temperature, and ⟨Δr²(t)⟩ is the MSD. This approach reveals how calcium supplementation reduces creep compliance, indicating increased stiffness.
Interfacial Rheology of Biofilm Formation This methodology monitors the viscoelastic properties of biofilms in real-time during development [31]. A rheometer equipped with a biconical disk geometry is positioned at the interface between the growth medium and air or oil. As biofilms form at this interface, the rheometer applies oscillatory shear strains and measures the mechanical response. The complex viscosity (mPa·s), storage modulus (G′), and loss modulus (G″) are tracked throughout biofilm development, typically showing distinct phases corresponding to attachment, maturation, and dispersion. This approach captures how cation-mediated matrix development influences bulk viscoelasticity during the transition from reversible attachment to mature, cross-linked biofilms.
Technical Comparison: AFM versus Rheology for Biofilm Mechanics
The selection between AFM and rheology involves significant trade-offs spanning spatial resolution, sample requirements, and analytical capabilities, as summarized in the following diagram:
Atomic Force Microscopy excels in spatial resolution, capable of mapping mechanical properties at the nanoscale and detecting heterogeneity within biofilm ultrastructure [12] [30]. AFM requires minimal sample preparation and can operate under physiological conditions, preserving native biofilm architecture. However, its primary limitation is the restriction of measurements to surface and near-surface regions (typically up to 5 μm depth), potentially missing deeper structural changes induced by cation cross-linking [29]. AFM-based methods are particularly valuable for investigating local cohesive energy and nanoscale adhesion forces.
Rheology provides comprehensive bulk mechanical characterization, capturing the volume-averaged response of the entire biofilm sample [1] [31]. This approach is ideal for monitoring real-time changes in viscoelastic properties during biofilm development and in response to environmental perturbations. The principal limitations include the requirement for substantial biofilm quantities (often requiring harvesting and processing) and the loss of spatial information. Rheology excels in quantifying the macroscopic consequences of cation-mediated cross-linking, such as increased elastic modulus and complex viscosity.
Essential Research Reagents and Materials
Table 3: Key Research Reagent Solutions for Studying Cation-Biofilm Interactions
| Reagent/Material | Function in Research | Specific Application Examples |
|---|---|---|
| Calcium Chloride (CaCl₂) | Controlled calcium ion source for cross-linking studies | Concentration-dependent stiffness studies in P. aeruginosa [28] [3] |
| Alginate-Based Hydrogels | Model biofilm matrix for controlled mechanical studies | Imitation biofilm systems for cleaning validation [13] |
| Carboxylated Microbeads | Probe particles for microrheology measurements | Tracking local mechanical properties in P. fluorescens biofilms [3] |
| Functionalized AFM Tips | Nanoscale force measurement and mapping | Microbead force spectroscopy for adhesive pressure quantification [30] |
| Membrane Filters | Growth substrate for standardized biofilm cultivation | Uniaxial compression testing of model biofilms [28] |
| Hydroxyapatite Disks | Biomimetic tooth enamel surface for oral biofilm studies | 3D-bioprinted S. mutans biofilm studies [32] |
| Sodium Hexametaphosphate | Scale inhibitor and calcium chelator for control studies | Examining polyphosphate effects on drinking water biofilm stiffness [29] |
| Quartz Crystal Microbalances | Real-time mass and viscoelasticity monitoring | E. coli biofilm formation monitoring with dissipation [31] |
Research Recommendations and Future Perspectives
The experimental evidence consistently demonstrates that environmental cations, particularly calcium, significantly enhance biofilm cohesiveness and stiffness through ionic cross-linking mechanisms. The methodological approach should be guided by specific research questions: AFM is optimal for investigating localized mechanical properties, nanoscale heterogeneity, and surface adhesion, while rheology provides superior characterization of bulk viscoelasticity and time-dependent mechanical evolution.
Future methodological developments will likely focus on correlative approaches that integrate multiple techniques, such as combining AFM with confocal microscopy for simultaneous structural and mechanical analysis [3], or using quartz crystal microbalance with dissipation (QCM-D) with interfacial rheology for multi-scale assessment [31]. Advanced 3D-bioprinting of model biofilms [32] also presents promising opportunities for creating standardized platforms to systematically investigate cation effects across genetically defined microbial communities. These integrated approaches will further elucidate how cationic cross-linking influences biofilm mechanics across multiple spatial and temporal scales, with significant implications for mitigating problematic biofilms in industrial, medical, and environmental contexts.
Methodological Deep Dive: Practical Protocols for AFM and Rheology in Biofilm Analysis
Atomic Force Microscopy (AFM) force spectroscopy and nanoindentation are two powerful techniques for characterizing the nanomechanical properties of materials. While they share the common principle of using a sharp tip to probe a sample's response to applied force, their operational approaches, historical development, and primary strengths differ. AFM force spectroscopy is a technique rooted in the scanning probe microscopy family, originally developed for high-resolution surface imaging. It measures force-distance curves by tracking the deflection of a cantilever as it interacts with the sample surface, providing both topographical information and localized mechanical properties [33]. In contrast, nanoindentation is an evolution of traditional hardness testing, specializing in quantitative mechanical property measurement through precise analysis of load-displacement data during controlled indentation cycles [33]. Both techniques have become indispensable for studying viscoelastic properties of complex biological systems, particularly microbial biofilms, where understanding mechanical behavior is crucial for developing anti-biofilm strategies and optimizing biofilm-based bioprocesses [34].
The investigation of biofilm viscoelasticity represents a particularly challenging application where both techniques offer complementary insights. Biofilms, as living structured ecosystems, exhibit time-dependent mechanical properties that influence their stability, stress resistance, and dispersal mechanisms [34]. The matrix accounts for up to 90% of the dry mass of biofilms and is fundamentally linked to their mechanical resilience [34]. Researchers aiming to understand biofilm mechanics or screen anti-biofilm treatments must navigate the relative strengths and limitations of AFM force spectroscopy and nanoindentation to select the most appropriate characterization method for their specific microbiological objectives.
Technical Comparison: Capabilities and Limitations
AFM force spectroscopy and nanoindentation offer distinct advantages for nanomechanical characterization. The table below summarizes their key technical characteristics:
Table 1: Technical comparison between AFM force spectroscopy and nanoindentation
| Characteristic | AFM Force Spectroscopy | Nanoindentation |
|---|---|---|
| Spatial Resolution | 1-10 nm lateral, <0.1 nm vertical resolution [33] | Typically >100 nm [33] |
| Force Resolution | ~10% uncertainty in force calibration [33] | ~1 nN force resolution [33] |
| Primary Measurements | Adhesion, elastic modulus, deformation, surface topography [35] [33] | Hardness, elastic modulus, viscoelastic properties [33] |
| Quantitative Accuracy | Lower for absolute force measurement [33] | High precision for hardness and modulus; standardized (ISO 14577) [33] |
| Maximum Applicable Force | Typically <100 μN [33] | Significantly higher forces possible |
| Environmental Flexibility | Operates in liquids, gases, vacuum; ideal for hydrated biofilms [33] | Primarily controlled atmosphere; specialized systems for liquids |
| Sample Requirements | Minimal preparation; can image native biofilms [36] | Often requires smooth surfaces; roughness affects data quality [33] |
| Data Interpretation | Complex for heterogeneous materials; model-dependent [33] | Well-established theoretical frameworks [33] |
Key Strengths and Limitations
AFM force spectroscopy excels in its exceptional spatial resolution, allowing researchers to map mechanical properties across heterogeneous biofilm surfaces and target specific microstructural features [33]. Its ability to operate in physiological liquid environments enables the study of fully hydrated, living biofilms in near-native conditions, providing critical insights into biofilm mechanics as they exist in natural and clinical settings [36]. Furthermore, AFM can correlate topographical information with mechanical properties in a single measurement, revealing structure-function relationships within complex biofilm architectures [6].
However, AFM faces challenges in quantitative force measurement accuracy, with force calibration uncertainties often exceeding 10% [33]. The technique is also restricted in the maximum applicable forces (typically below 100 μN), limiting testing to relatively soft materials or shallow indentation depths in harder substances [33]. Data interpretation for viscoelastic materials remains complex, requiring appropriate contact mechanics models that account for time-dependent behavior [35].
Nanoindentation provides superior quantitative accuracy for mechanical property measurement, with well-established theoretical frameworks for data interpretation and international standardization (ISO 14577) that enable reliable comparison across instruments and laboratories [33]. Modern systems achieve exceptional force and displacement resolutions (approximately 1 nN and below 0.1 nm, respectively), allowing characterization of thin films as shallow as 10 nm [33]. The technique can accommodate higher maximum forces than typical AFM, expanding its applicability to stiffer materials.
The primary limitation of nanoindentation for biofilm studies is its spatial resolution constraint (typically >100 nm), making it challenging to isolate individual microstructural elements in heterogeneous biofilms [33]. Sample preparation is more critical, as surface roughness significantly impacts data quality, often requiring smoothing procedures that may alter native biofilm structure [33]. While specialized systems exist for liquid environments, most conventional nanoindentation is performed in controlled atmospheres, potentially compromising the physiological relevance for biofilm characterization.
Experimental Approaches for Biofilm Viscoelasticity
AFM Force Spectroscopy Methodologies
Force Volume Mapping is a fundamental AFM mode for nanomechanical characterization, based on acquiring force-distance curves (FDCs) at each pixel of the sample surface [35]. These curves are generated by modulating the tip-sample distance while recording cantilever deflection, typically using triangular or sinusoidal waveforms. The resulting FDCs are transformed into mechanical parameter maps by fitting to appropriate contact mechanics models [35]. In biofilm applications, the hysteresis between approach and retraction curves provides direct evidence of viscoelastic behavior, indicating energy dissipation processes within the extracellular polymeric substance matrix [35].
Microbead Force Spectroscopy (MBFS) represents a specialized approach for biofilm characterization that enhances reproducibility and quantitative analysis. This method utilizes a glass or colloidal bead (typically 50 μm diameter) attached to a tipless AFM cantilever, which is coated with the bacterial biofilm of interest [16]. The bead is brought into controlled contact with a clean surface while accurately gathering force versus distance data over time. This approach combines the defined contact geometry of a spherical probe with the sample flexibility of cell-coated tips [16]. Adhesive properties are deduced from retraction curves, while viscoelastic parameters are determined from indentation versus time plots during the contact hold period [16].
Standardized MBFS protocols have been developed to minimize variability, specifying parameters such as loading pressure, retraction speed, and contact time to enable meaningful comparison across experiments [16]. For instance, in a study of Pseudomonas aeruginosa biofilms, MBFS revealed that adhesive pressures of PAO1 and wapR early biofilms were 34 ± 15 Pa and 332 ± 47 Pa, respectively, demonstrating the method's sensitivity to genetic differences [16].
Nano-DMA (Dynamic Mechanical Analysis) approaches adapt principles from macroscopic rheology for AFM-based nanomechanical characterization. In this method, the tip is first approached to a predefined setpoint force (1-20 nN) to establish contact, then an oscillatory signal is applied while the tip remains in contact [35]. The resulting low-amplitude tip oscillation (10-50 nm) is recorded and transformed into force as a function of time, with the material's viscoelastic properties encoded in the time lag between indentation and applied force [35]. The frequency of oscillation can be varied from a few to hundreds of Hz, enabling characterization of rate-dependent mechanical behavior in biofilms.
Nanoindentation Approaches
Creep Compliance Testing is a valuable nanoindentation method for characterizing biofilm viscoelasticity. In this approach, a constant load is applied to the biofilm surface using a calibrated indenter tip (typically Berkovich or spherical geometry), and the time-dependent displacement is recorded throughout the loading cycle [16]. The resulting creep data is fitted to viscoelastic models, such as the Voigt Standard Linear Solid model, to extract parameters including instantaneous and delayed elastic moduli, and viscosity [16]. This method has been successfully applied to quantify how biofilm maturation and genetic modifications affect mechanical properties, with studies showing that instantaneous and delayed elastic moduli in P. aeruginosa are drastically reduced by lipopolysaccharide deficiency and biofilm maturation [16].
Continuous Stiffness Measurement (CSM) techniques represent a significant advancement in nanoindentation capability, allowing dynamic measurement of mechanical properties as a function of indentation depth. This method superimposes a small oscillatory force on the primary loading signal during indentation, enabling simultaneous measurement of storage modulus (elastic response), loss modulus (viscous response), and hardness throughout the entire indentation cycle [33]. The technique significantly enhances data acquisition efficiency and reliability for viscoelastic materials like biofilms, providing comprehensive depth-dependent property profiles rather than single-point measurements.
Table 2: Experimental data from biofilm mechanical characterization studies
| Biofilm System | Technique | Key Mechanical Findings | Reference |
|---|---|---|---|
| Pseudomonas aeruginosa PAO1 (early biofilm) | Microbead Force Spectroscopy | Adhesive pressure: 34 ± 15 Pa | [16] |
| P. aeruginosa wapR mutant (early biofilm) | Microbead Force Spectroscopy | Adhesive pressure: 332 ± 47 Pa | [16] |
| P. aeruginosa PAO1 (mature biofilm) | Microbead Force Spectroscopy | Adhesive pressure: 19 ± 7 Pa | [16] |
| P. aeruginosa wapR mutant (mature biofilm) | Microbead Force Spectroscopy | Adhesive pressure: 80 ± 22 Pa | [16] |
| P. aeruginosa (wild-type vs. mutant) | Voigt Viscoelastic Model fitting | Drastic reduction of elastic moduli with LPS deficiency and maturation | [16] |
| Dental adhesives (polymer comparison) | Nanoindentation creep testing | Modulus values: 2.4-4.2 GPa; demonstrated overestimation by elastic analysis | [37] |
Research Reagent Solutions and Essential Materials
Table 3: Essential materials and reagents for AFM and nanoindentation biofilm studies
| Item | Function/Application | Specifications |
|---|---|---|
| AFM Cantilevers | Force transduction | Rectangular tipless for bead attachment; spring constant: 0.01-0.08 N/m [16] |
| Microbead Probes | Defined contact geometry | 50 μm diameter glass beads for standardized adhesion measurements [16] |
| Functionalized Tips | Specific interactions | Chemically modified tips for targeted molecular studies |
| Calibration Standards | System verification | Reference samples with known mechanical properties |
| Liquid Cells | Physiological imaging | Environment control for hydrated biofilm studies [36] |
| Biofilm Growth Substrata | Sample preparation | PFOTS-treated glass, silicon substrates, medical-grade materials [6] |
Emerging Trends and Future Outlook
The field of nanomechanical characterization is rapidly evolving, with several emerging trends enhancing both AFM force spectroscopy and nanoindentation capabilities. Machine learning and artificial intelligence are transforming AFM operation and data analysis, enabling automated scanning, enhanced image processing, and intelligent data interpretation [38] [6]. These advancements are particularly valuable for biofilm research, where inherent heterogeneity necessitates statistical analysis across large sample areas. ML algorithms now enable automated cell detection, classification, and segmentation in AFM images, significantly improving analysis efficiency for complex biofilm structures [6].
High-speed nanomechanical mapping represents another significant advancement, addressing the traditional limitation of slow data acquisition in detailed mechanical characterization. Recent developments in photothermal cantilever actuation and off-resonance tapping modes have dramatically increased imaging rates, enabling the study of dynamic processes in biofilms and other soft materials [35]. For instance, sinusoidal modulation methods have achieved rates of 0.4 frames-per-second (512 × 256 pixels) for surface topography and mechanical property mapping [35].
Correlative microscopy approaches that combine AFM with complementary techniques are providing unprecedented multidimensional insights into biofilm systems. The integration of AFM with fluorescence microscopy, spectral imaging, and other characterization methods allows researchers to correlate nanomechanical properties with chemical composition and biological activity [38] [6]. This holistic approach is particularly powerful for investigating structure-function relationships in complex biofilm communities, linking mechanical behavior to molecular composition and spatial organization.
Large-area automated AFM systems are overcoming traditional limitations in scan range, enabling high-resolution imaging over millimeter-scale areas rather than the typical micrometer-scale regions [6]. This advancement is crucial for biofilm research, as it allows investigators to link nanoscale mechanical properties at the cellular level to the functional macroscale organization of biofilms. Automated image stitching algorithms combined with machine learning analysis now provide comprehensive views of biofilm heterogeneity and organization that were previously inaccessible [6].
AFM force spectroscopy and nanoindentation provide complementary approaches for characterizing the nanomechanical properties of microbial biofilms. AFM excels in high-resolution mapping of heterogeneous biofilm surfaces under physiological conditions, offering unparalleled insights into spatial variations of mechanical properties at the cellular level. Nanoindentation delivers superior quantitative accuracy for measuring viscoelastic parameters, with well-established theoretical frameworks that enable standardized comparison across studies. The choice between techniques depends heavily on research objectives: AFM force spectroscopy is preferable for correlating structural heterogeneity with mechanical properties in hydrated, living biofilms, while nanoindentation offers advantages for quantitative screening of biofilm mechanical responses to genetic modifications or antimicrobial treatments. Emerging trends including machine learning integration, high-speed mapping, and correlative microscopy are progressively enhancing both techniques, promising more comprehensive understanding of biofilm mechanics and their implications for healthcare, industrial, and environmental applications.
Bulk rheology is an indispensable tool for quantifying the macroscopic viscoelastic properties of biofilms, providing researchers with critical insights into their mechanical behavior and structural integrity. This technique applies controlled shear stresses or strains to a biofilm sample to measure its response, characterizing how these complex biological structures behave as both solids and liquids. In the context of infectious disease research and drug development, understanding biofilm mechanics is paramount, as their viscoelastic nature directly influences their resistance to mechanical removal and antimicrobial penetration [1]. While atomic force microscopy (AFM) excels at probing nanoscale mechanical properties at discrete locations, bulk rheology offers a complementary approach by measuring the averaged mechanical response of the entire biofilm sample, thus bridging the gap between local nanomechanics and macroscopic behavior [35] [1].
The fundamental principle of bulk rheology involves measuring a biofilm's response to applied deformation, typically through rotational shear in a controlled gap geometry. This enables the quantification of key viscoelastic parameters: the storage modulus (G′), which represents the solid-like elastic component that stores energy; the loss modulus (G″), which represents the liquid-like viscous component that dissipates energy; and complex viscosity (η*), which describes the overall resistance to flow [39]. These parameters are not merely abstract measurements—they directly correlate with biofilm functionality, including their ability to withstand fluid shear stresses in industrial pipelines, resist phagocytosis in medical infections, and maintain structural coherence during colonization [40] [1]. For drug development professionals, these mechanical properties offer potential targets for disrupting biofilm integrity, thereby enhancing the efficacy of antimicrobial treatments.
Fundamental Principles and Measured Parameters
Bulk rheology characterizes biofilms by applying well-defined shear deformations and precisely measuring the resulting mechanical response. The core principle hinges on the fact that biofilms, as viscoelastic materials, exhibit both elastic solid behavior (recoverable deformation) and viscous fluid behavior (irreversible flow), with the dominance of each component depending on the timescale of observation and environmental conditions [1]. In rotational rheometry, a biofilm sample is typically placed between two plates—a stationary bottom plate and a rotating top plate—with the resulting torque measured to determine the stress response. Alternatively, for interfacial rheology studies, a biconical disk geometry is positioned at the interface between the biofilm cultivation medium and air or oil to specifically measure the mechanical properties of the surface-adherent biofilm layer [39].
The primary parameters obtained from bulk rheology provide a comprehensive mechanical signature of the biofilm. The storage modulus (G′) quantifies the elastic component, representing the biofilm's ability to store deformation energy and return to its original shape when stress is removed—a property crucial for maintaining structural integrity against external forces. The loss modulus (G″) quantifies the viscous component, reflecting the biofilm's capacity to dissipate energy through irreversible flow—enabling adaptation to shear stresses and structural reorganization. The ratio of G″ to G′ defines the loss tangent (tan δ), which indicates whether the biofilm behaves more like a solid (tan δ < 1) or liquid (tan δ > 1) under specific conditions [1]. Additionally, complex viscosity (η*) represents the biofilm's overall resistance to flow under dynamic conditions, incorporating both elastic and viscous contributions [39]. These parameters are typically measured as functions of frequency, strain amplitude, and time, providing a comprehensive mechanical profile that reflects the biofilm's structural organization and compositional makeup.
Experimental Protocols for Biofilm Rheology
Sample Preparation and Measurement Methodologies
Implementing robust experimental protocols is essential for obtaining reliable and reproducible rheological data from biofilm samples. The process begins with careful sample preparation, where biofilms are typically grown directly on rheometer plates or transferred as intact samples using appropriate tools to minimize structural damage. For interfacial rheology measurements of bacterial clusters, researchers have employed a specific protocol where "the interfacial rheological characteristics of bacterial cluster layers were measured using a rheometer (MCR 302, Anton Paar, Austria) equipped with a biconical disk geometry. After achieving a zero-gap configuration, the tip of the bicone was carefully positioned at the interface between the cultivated medium and oil" [39]. This approach allows for the precise measurement of mechanical properties specifically at the critical interface where biofilms often form and function.
The actual measurement phase involves several standardized procedures to fully characterize the viscoelastic response. Strain sweep tests are first performed to identify the linear viscoelastic region (LVR), where properties remain independent of deformation amplitude—typically using strains between 0.1% and 10% for biofilms. Subsequently, frequency sweep tests are conducted within this LVR (usually from 0.01 to 100 rad/s) to evaluate how moduli depend on deformation timescale, revealing the biofilm's internal structure and relaxation mechanisms [1]. Time sweep measurements monitor the evolution of viscoelastic properties during biofilm development, treatment application, or environmental changes, providing insights into structural maturation or degradation processes. For comprehensive viscoelastic characterization, creep and recovery tests may also be employed, where a constant stress is applied, and the resulting deformation is monitored over time, followed by measurement of recovery after stress removal [1]. Throughout these measurements, temperature control is critical, as biofilm mechanics are highly temperature-sensitive, with most studies conducted at relevant physiological (e.g., 37°C) or environmental conditions depending on the research context.
Data Interpretation and Analysis Approaches
Interpreting rheological data from biofilms requires understanding the relationship between measured parameters and underlying structural features. A predominant elastic response (G′ > G″) across a wide frequency range typically indicates a well-developed, interconnected matrix capable of maintaining structural integrity, as observed in mature Pseudomonas aeruginosa biofilms where G′ values can be an order of magnitude higher than G″ [40]. Conversely, a more viscous response (G″ > G′) often characterizes early-stage biofilms or those with weakened structural networks. The frequency dependence of moduli provides additional structural insights: biofilms with strong covalent cross-links typically show minimal frequency dependence, while those dominated by physical entanglements exhibit stronger dependence [1].
The specific values of viscoelastic parameters vary significantly based on biofilm composition, strain, and growth conditions. For example, in E. coli biofilm studies using combined QCM-D and interfacial rheology, researchers observed "high complex viscosity and modulus values of 5.38 mPa·s and high complex modulus of 169.13 kPa" under optimal formation conditions in Luria-Bertani medium with 5% (v/v) inoculation [39]. Similarly, alginate-overproducing mucoid P. aeruginosa biofilms demonstrated distinct mechanical signatures compared to wild-type strains, with significantly different swelling behavior and elastic modulus due to their polyelectrolyte matrix composition [40]. These compositional influences highlight the importance of correlating rheological measurements with biochemical analyses to establish structure-property relationships. Advanced analysis may also involve modeling biofilm mechanics using frameworks from polymer physics, such as the scaling theory for polyelectrolyte networks, which has been applied to explain how alginate content drives matrix swelling and stability through the Donnan effect [40].
Comparative Analysis: Bulk Rheology vs. Atomic Force Microscopy (AFM)
The complementary nature of bulk rheology and AFM provides researchers with a powerful multi-scale approach to understanding biofilm mechanics. Each technique offers distinct capabilities, limitations, and spatial resolution, making them suitable for different research questions and applications. The following comparison table summarizes the key characteristics of each methodology:
Table 1: Technical Comparison between Bulk Rheology and Atomic Force Microscopy for Biofilm Characterization
| Characteristic | Bulk Rheology | Atomic Force Microscopy (AFM) |
|---|---|---|
| Measurement Scale | Macroscopic (bulk sample) | Nanoscopic (localized points) |
| Spatial Resolution | Low (averaged over sample) | High (nanometer scale) [35] |
| Primary Measured Parameters | Storage modulus (G'), Loss modulus (G"), Complex viscosity [39] | Young's modulus, Adhesion forces, Deformation [35] |
| Sample Environment | Controlled shear, temperature, and humidity [1] | Ambient air or liquid environments [35] |
| Throughput | Medium to High (full sample characterization) | Low (sequential point measurements) [35] |
| Information Obtained | Averaged viscoelastic properties, Bulk mechanical behavior [1] | Nanomechanical mapping, Surface topography, Heterogeneity [35] [41] |
| Key Applications | Monitoring biofilm maturation, Treatment efficacy screening, Material properties for modeling [40] [39] | Mapping local mechanical variations, Single-cell mechanics, Cell-surface interactions [35] [41] |
| Technical Complexity | Moderate (sample loading and geometry selection) | High (tip selection, calibration, and scan optimization) [35] |
Bulk rheology excels in providing averaged mechanical properties across entire biofilm samples, making it ideal for monitoring developmental processes, screening anti-biofilm treatments, and generating parameters for fluid dynamic models [1] [39]. For instance, rheological measurements have effectively captured how alginate production in mucoid P. aeruginosa significantly increases elastic modulus and swelling capacity compared to wild-type strains [40]. In contrast, AFM offers unparalleled nanoscale resolution, enabling researchers to map mechanical heterogeneity within biofilms, probe individual cells, and quantify adhesion forces at the cell-substrate interface [35] [41]. Advanced AFM techniques like force volume mapping and nanomechanical tomography can resolve local variations in stiffness and viscoelasticity that bulk methods necessarily average out [35]. However, this high resolution comes at the cost of throughput, as AFM requires sequential point measurements and careful tip calibration [35]. For comprehensive biofilm characterization, many research groups employ both techniques synergistically—using bulk rheology to establish overall mechanical behavior and AFM to investigate local structural features and heterogeneity that contribute to those bulk properties.
Essential Research Reagent Solutions and Materials
Conducting rigorous biofilm rheology studies requires specific instrumentation, reagents, and analytical tools. The selection of appropriate materials is critical for obtaining reliable and reproducible mechanical data. The following table catalogizes key research solutions essential for experimental work in this field:
Table 2: Essential Research Reagents and Tools for Biofilm Rheology Studies
| Category | Specific Examples | Function and Application |
|---|---|---|
| Rheometer Systems | Dynamic Rheometer (e.g., MCR 302, Anton Paar) [39] | Applies controlled shear deformation and measures biofilm mechanical response |
| Measurement Geometries | Parallel plates, Cone-plate, Biconical disk [39] | Define shear field and sample containment during measurements |
| Biofilm Model Organisms | Pseudomonas aeruginosa (mucoid and wild-type) [40], Escherichia coli [39] | Representative species for studying biofilm mechanics and antimicrobial resistance |
| Matrix Components | Alginate [40], Psl polysaccharide [40], Extracellular DNA (eDNA) | Key extracellular polymeric substances that determine biofilm mechanical properties |
| Antimicrobial Agents | N-acetyl cysteine (NAC) [40] | Matrix-penetrating antimicrobial for studying remnant matrix mechanics |
| Characterization Techniques | Particle Tracking Microrheology (PTM) [40], Quartz Crystal Microbalance with Dissipation (QCM-D) [39] | Complementary methods for assessing local mechanics and biofilm development |
| Culture Media | Luria-Bertani (LB) medium [39], Marine broth [39] | Standard growth media for biofilm cultivation under controlled conditions |
The integration of these research tools enables comprehensive mechanical characterization of biofilms. For instance, combining rheometer systems with particle tracking microrheology allows researchers to correlate bulk mechanical properties with local heterogeneities, providing insights into how matrix composition variations influence overall biofilm mechanics [40]. Similarly, using matrix-specific components like alginate or Psl polysaccharide in defined mutant strains enables systematic investigation of how individual matrix constituents contribute to viscoelastic behavior and mechanical stability [40]. The selection of appropriate antimicrobial agents, such as N-acetyl cysteine, further allows researchers to decouple the mechanical contributions of the matrix from those of living cells, revealing that remnant matrix structures can maintain significant mechanical functionality even after bacterial eradication [40].
Research Applications and Workflow Integration
Practical Implementation in Biofilm Research
Bulk rheology finds diverse applications across biofilm research, from fundamental mechanistic studies to applied antimicrobial development. In basic research, rheological measurements have revealed how environmental factors influence biofilm development, as demonstrated in E. coli studies where "biofilm formation and viscoelastic properties were continuously monitored in real-time, allowing for dynamic observation of biofilm development" across three distinct growth phases: surface attachment, maturation, and dispersion [39]. In applied settings, rheology serves as a crucial tool for evaluating anti-biofilm strategies, enabling researchers to quantify how chemical treatments, enzymatic degradation, or physical disruption methods alter mechanical integrity and stability. For example, studies on Pseudomonas aeruginosa biofilms have employed rheology to assess matrix changes after N-acetyl cysteine treatment, revealing that alginate-overproducing mucoid variants maintain higher elastic modulus and swelling capacity compared to wild-type strains despite bacterial eradication [40].
The integration of rheology with complementary analytical techniques creates powerful workflows for comprehensive biofilm characterization. A representative research workflow might begin with real-time monitoring of biofilm development using Quartz Crystal Microbalance with Dissipation (QCM-D) to track initial attachment and maturation phases through frequency and dissipation shifts [39]. This would be followed by bulk rheological characterization to quantify viscoelastic moduli and complex viscosity across different growth conditions or treatment regimens. Subsequently, confocal microscopy and particle tracking microrheology could assess local mechanical heterogeneity and structural features within the biofilm architecture [40]. Finally, atomic force microscopy might be employed to map nanoscale mechanical properties at specific locations of interest, connecting local matrix properties to bulk mechanical behavior [35] [41]. This multi-scale approach provides researchers with a comprehensive understanding of how molecular-level interactions and matrix composition translate to macroscopic mechanical properties that determine biofilm function and resistance.
Current Research Trends and Future Perspectives
The field of biofilm rheology continues to evolve with emerging methodologies and interdisciplinary approaches that enhance our understanding of biofilm mechanics. Recent advances include the integration of rheological measurements with microfluidic platforms that enable real-time visualization of structural changes during mechanical testing, providing direct correlations between mechanical response and architectural reorganization [42]. Additionally, the development of multi-scale modeling frameworks that incorporate rheological data into predictive models of biofilm behavior under fluid shear stresses represents a significant frontier in the field [1]. These models aim to bridge the gap between laboratory measurements and real-world biofilm performance in industrial, clinical, and environmental settings.
Machine learning approaches are also beginning to transform biofilm rheology, enabling automated analysis of complex mechanical spectra and identification of subtle patterns that correlate with specific biofilm states or treatment responses [43]. Furthermore, the increasing adoption of standardized protocols and reference materials addresses longstanding challenges in reproducibility and cross-study comparison [1]. As rheometer technology advances, with the market projected to grow steadily from USD 126 million in 2025 to USD 146 million by 2032, instrument capabilities continue to improve in sensitivity, temperature control, and compatibility with various measurement geometries [44]. These developments, combined with growing recognition of mechanical properties as critical factors in biofilm resilience, position bulk rheology as an increasingly essential tool in both fundamental research and applied antimicrobial development pipelines. For drug development professionals specifically, the ability to quantitatively assess how candidate compounds alter biofilm mechanics provides valuable predictive metrics for treatment efficacy beyond traditional viability assays alone.
The accurate assessment of biofilm mechanical properties, particularly viscoelasticity, is paramount for understanding biofilm resilience, dispersal, and resistance to treatment. The choice of sample preparation—whether to test biofilms in their native state or as homogenized samples—fundamentally shapes the experimental outcome and its biological relevance. This guide objectively compares these two paradigms within the context of a broader thesis comparing Atomic Force Microscopy (AFM) with rheology for biofilm viscoelasticity research. The selection between these preparation methods dictates the scale of analysis, influences which matrix components are prioritized, and determines the applicability of the data to real-world biofilm scenarios.
Comparative Analysis: Native vs. Homogenized Biofilm Samples
The core difference between these paradigms lies in the preservation of the biofilm's inherent spatial structure and heterogeneity. The table below summarizes the key characteristics and optimal applications for each approach.
Table 1: Core Characteristics and Applications of Native and Homogenized Biofilm Samples
| Feature | Native Biofilm Samples | Homogenized Biofilm Samples |
|---|---|---|
| Structural Integrity | Preserved in its original, intact state [3] [40] | Disrupted; original 3D architecture is lost [45] |
| Mechanical Heterogeneity | Retained; allows for region-specific measurement [3] [40] | Averaged out; results represent a bulk property [3] |
| Primary Analytical Techniques | Atomic Force Microscopy (AFM), Particle-Tracking Microrheology (PTM) [16] [3] | Bulk Rheometry (e.g., parallel plate rheometry) [3] |
| Data Output | Localized properties (e.g., adhesive pressure, elastic moduli at specific points) [16] [3] | Bulk average properties (e.g., shear modulus for the entire sample) [3] |
| Ideal for Studying | In-situ mechanics, spatial property mapping, surface adhesion, effect of localized matrix composition [16] [40] | Overall matrix contribution, screening mechanical responses to chemical treatments, flow resistance in pipelines [3] |
Quantitative Data Comparison
The choice of sample preparation directly impacts the numerical results obtained from mechanical testing. The following tables compile quantitative data from studies employing both paradigms, highlighting the measurable differences.
Table 2: Quantitative Data from Native Biofilm Analysis Techniques
| Biofilm Organism | Technique | Measured Property | Value | Citation |
|---|---|---|---|---|
| P. aeruginosa PAO1 (Early Biofilm) | AFM with Microbead Force Spectroscopy (MBFS) | Adhesive Pressure | 34 ± 15 Pa | [16] |
| P. aeruginosa PAO1 (Mature Biofilm) | AFM with Microbead Force Spectroscopy (MBFS) | Adhesive Pressure | 19 ± 7 Pa | [16] |
| P. aeruginosa wapR mutant (Early Biofilm) | AFM with Microbead Force Spectroscopy (MBFS) | Adhesive Pressure | 332 ± 47 Pa | [16] |
| P. fluorescens (24h & 48h Biofilms) | Particle-Tracking Microrheology (PTM) | Creep Compliance (region-specific) | Quantified for void and cluster regions | [3] |
Table 3: Technical Considerations for Homogenization Methods This table summarizes methods relevant to creating homogenized biofilm samples, though the cited study used them for food pathogen detection [45].
| Homogenization Method | Principle | Suitability for Biofilm Inner-Matrix | Key Considerations |
|---|---|---|---|
| Stomaching | Blending with movable paddles | Variable recovery | Common for cultivation, suitable for larger volumes [45] |
| Bead Milling | Bead-mediated grinding/milling | Good recovery with appropriate equipment | Highly adaptable; effective for tough matrices; requires optimization of bead type and time [45] [46] |
| Sonication | Application of ultrasound | Poor recovery | Risk of heat generation and cell lysis [45] |
Experimental Protocols for Key Techniques
Protocol for Native Biofilm Analysis via AFM Force Spectroscopy
This method quantifies adhesion and viscoelasticity under native conditions without disrupting the biofilm structure [16].
- Bacterial Strain and Growth: Pseudomonas aeruginosa PAO1 and isogenic mutants are grown overnight in Trypticase Soy Broth (TSB). Cells are harvested by centrifugation, washed twice in sterile deionized water, and adjusted to an optical density (OD600) of 2.0 [16].
- Biofilm Coating: A 50 µm diameter glass bead is attached to a tipless AFM cantilever. This microbead probe is then coated with the prepared bacterial cell suspension to create a biofilm-coated probe [16].
- Force Spectroscopy: The biofilm-coated probe is brought into controlled contact with a clean glass surface using a closed-loop AFM. Standardized conditions for loading pressure, retraction speed, and contact time are critical for reproducibility [16].
- Data Acquisition:
- Adhesion: Force versus distance curves during probe retraction are analyzed to determine the adhesive pressure between the biofilm and the surface [16].
- Viscoelasticity: Indentation versus time data, acquired while the probe maintains constant contact with the surface (hold period), is fitted to a Voigt Standard Linear Solid model to derive elastic moduli and viscosity [16].
Protocol for Native Biofilm Analysis via Particle-Tracking Microrheology (PTM)
PTM is a passive, in-situ technique that measures localized mechanical properties within an intact biofilm [3] [40].
- Biofilm Growth: mCherry-expressing Pseudomonas fluorescens is inoculated into centrifuge tubes containing a partially submerged glass coverslip and growth medium (King B broth with gentamicin). Green fluorescent carboxylate microbeads (1 µm diameter) are added to the medium. Biofilms are grown under static conditions for 24-48 hours [3].
- Sample Preparation: After growth, the coverslip with the native biofilm is carefully rinsed in phosphate-buffered saline (PBS) and placed in a chamber slide for microscopy [3].
- Confocal Microscopy and Data Collection: An Olympus FV1000 Confocal Laser Scanning Microscope (CLSM) is used to acquire 3D structural images of the biofilm and time-lapse image stacks (xyt-stacks) of the embedded beads. Bead movements are tracked over approximately 135 seconds [3].
- Data Analysis: Particle trajectories are used to calculate the Mean Square Displacement (MSD). The MSD is then converted into creep compliance (J), a fundamental viscoelastic property, using the formula: ( J = \frac{3\pi d}{4kB T} \langle \Delta r^2(t) \rangle ), where ( d ) is bead diameter, ( kB ) is Boltzmann's constant, and ( T ) is temperature [3].
Figure 1: Workflow for Particle-Tracking Microrheology (PTM) of native biofilms.
Protocol for Homogenized Sample Analysis via Bulk Rheometry
While not explicitly detailed in the search results for biofilms, the principle of bulk rheometry requires a homogenized sample. The protocol would involve:
- Biofilm Harvesting and Homogenization: Biofilms are typically scraped or swirled from their growth surface. The collected biomass is then homogenized using one of the methods in Table 3 (e.g., bead milling) to create a uniform suspension or paste [45] [46].
- Loading: The homogenized biofilm sample is loaded onto the plate of a parallel plate or cone-and-plate rheometer.
- Testing: Oscillatory shear tests are performed. A small, oscillating strain is applied, and the resulting stress is measured. This yields bulk average values for the storage modulus (G', elasticity) and loss modulus (G", viscosity) for the entire sample [3].
The Scientist's Toolkit: Research Reagent Solutions
The following table details key materials and reagents essential for conducting experiments in native and homogenized biofilm paradigms.
Table 4: Essential Research Reagents and Materials for Biofilm Viscoelasticity Studies
| Item | Function/Application | Specific Example |
|---|---|---|
| Tipless AFM Cantilevers | Serve as a base for attaching microbeads or other probes for force spectroscopy on native biofilms. | CSC12/Tipless/No Al Type E cantilevers [16] |
| Glass Microbeads | Provide a defined spherical contact geometry for quantifiable force measurements with AFM. | 50 µm diameter glass beads [16] |
| Fluorescent Microbeads | Act as probe particles embedded within the biofilm structure for Particle-Tracking Microrheology (PTM). | 1 µm diameter green fluorescent carboxylate beads (e.g., Sigma, L46) [3] |
| King B Broth | A standardized growth medium used for cultivating model biofilm organisms like Pseudomonas fluorescens. | Used for PTM studies with P. fluorescens [3] |
| Trypticase Soy Broth (TSB) | A rich general-purpose growth medium for cultivating a wide range of bacteria, including Pseudomonas aeruginosa. | Used for AFM force spectroscopy studies with P. aeruginosa [16] |
| N-Acetyl Cysteine (NAC) | A chemical treatment used to eradicate bacterial cells within a biofilm while leaving the structural matrix intact for studies on the remnant matrix. | Used to study the mechanical role of the matrix alone [40] |
| Bead Mill Homogenizer | Equipment used to disrupt and homogenize tough biofilm samples for bulk analysis. | FastPrep-24 system [45] |
The decision between native and homogenized sample preparation is not a matter of which is superior, but which is most appropriate for the research question. The native paradigm, enabled by techniques like AFM and PTM, is indispensable for understanding the spatially heterogeneous, in-situ mechanical behavior of biofilms, providing deep insights into structure-function relationships. In contrast, the homogenization paradigm, coupled with bulk rheology, offers a high-throughput way to assess the average mechanical contribution of the biofilm matrix as a material. A comprehensive research strategy will often leverage both paradigms to build a complete picture of biofilm viscoelasticity, from localized molecular interactions to bulk material behavior.
Quantifying the mechanical properties of biofilms is crucial for addressing their challenges in healthcare and industry. Biofilms are complex microbial communities embedded in extracellular polymeric substances (EPS), exhibiting both solid-like (elastic) and liquid-like (viscous) mechanical behavior, known as viscoelasticity [1]. This property determines a biofilm's ability to withstand mechanical and chemical challenges, making its accurate measurement essential for developing effective removal and control strategies [13].
This guide compares how Atomic Force Microscopy (AFM)-based nanorheology and traditional bulk rheology measure biofilm viscoelasticity. While bulk rheology provides macroscale averages, advanced AFM techniques like Photothermal AFM Nanorheology and Microbead Force Spectroscopy offer nanoscale resolution, revealing the profound mechanical heterogeneity within biofilm structures [1] [6]. We objectively compare their performance, supported by experimental data, to guide researchers in selecting the appropriate tool for their specific research questions.
Technique Fundamentals: Principles and Methodologies
Atomic Force Microscopy (AFM) at the Nanoscale
AFM operates by scanning a sharp probe (cantilever) across a sample surface. A laser beam deflection system measures cantilever movements, generating topographical images and quantifying interaction forces at the nanoscale [47]. AFM can image and measure forces under physiological conditions, which is vital for studying biological samples in their native state [48] [47]. For rheological measurements, the AFM tip, or a microbead attached to it, serves as a nanoscale indenter to probe local mechanical properties.
- Key AFM Operation Modes: The two primary imaging modes are contact mode (tip in constant contact, generating repulsion forces) and tapping mode (cantilever oscillating, minimizing sample damage). For force spectroscopy, the cantilever's vertical displacement is recorded to generate force vs. displacement curves, which are then fitted with mechanical models (e.g., Hertz model) to extract properties like Young’s modulus (stiffness) [47].
Bulk Rheology at the Macroscale
Bulk rheology characterizes the mechanical response of a sample, typically volumes in the milliliter range, to applied stresses or strains. It measures viscoelastic parameters like the storage modulus (G', elastic component) and loss modulus (G", viscous component) by subjecting the entire sample to rotational shear, oscillation, or flow [1] [13]. This provides an average measurement of the material's properties but lacks spatial resolution.
Direct Technique Comparison: Performance and Data
The table below summarizes a direct, objective comparison of the core capabilities of bulk rheology and AFM-based nanorheology for biofilm studies.
Table 1: Performance Comparison of Bulk Rheology and AFM-based Nanorheology for Biofilm Characterization
| Feature | Bulk Rheology | AFM-based Nanorheology |
|---|---|---|
| Measurement Scale | Macroscale (millimeter to centimeter) [1] | Nanoscale to microscale (single molecules to single cells) [47] [6] |
| Spatial Resolution | Low (averages entire sample volume) [1] | High (nanometer-level resolution) [48] [6] |
| Measured Parameters | Storage/Loss Modulus (G', G"), complex viscosity [1] [13] | Young's Modulus (E), adhesion forces, complex shear modulus (G*) [47] |
| Key Strength | Measures bulk viscoelastic behavior relevant for flow and large-scale deformation [13] | Reveals local mechanical heterogeneity; correlates structure with function [6] |
| Throughput | High (one measurement per sample) | Low (multiple measurements needed to map an area) [6] |
| Data Type | Averaged, population-level data | Spatially-resolved, single-cell/component data [6] |
| Typical Sample Environment | Controlled temperature, atmospheric conditions | Can operate in liquid under physiological conditions [48] [47] |
Quantitative Data from Experimental Studies
The following table presents quantitative findings from studies that utilized these techniques, highlighting the distinct data types each method generates.
Table 2: Experimental Data from Rheological and AFM Biofilm Studies
| Study Focus | Technique Used | Key Quantitative Findings | Context and Interpretation |
|---|---|---|---|
| Microbacterium lacticum Biofilms [13] | Bulk Rheology | Exhibited typical viscoelastic, solid-like behavior (G' > G") within the linear viscoelastic region (LVR). | Confirms the gel-like nature of the native biofilm at the bulk level, which is relevant for predicting its response to industrial cleaning flows. |
| Microbacterium lacticum Biofilms [13] | Tribology (Coefficient of Friction) | Coefficient of Friction (CoF) values ranged between 0.24 to 0.36. | Alginate-based imitation biofilms showed similar CoF to native biofilms, suggesting use for cleaning protocol validation. |
| Pantoea sp. YR343 Biofilm Assembly [6] | Large-Area Automated AFM | Individual bacterial cells: ~2 µm in length, ~1 µm in diameter. Flagellar structures: ~20–50 nm in height. | AFM's high resolution visualizes individual cells and subcellular structures like flagella, which are crucial for initial surface attachment and biofilm development. |
| Single-Cell Mechanics [47] | AFM Force Spectroscopy | Can detect forces as small as 7–10 pN. Enables measurement of cell stiffness (Young's modulus) changes in pathological conditions. | Demonstrates AFM's extreme sensitivity for measuring biomechanical properties of single cells, offering potential for nanodiagnostics. |
Experimental Protocols: Detailed Methodologies
Protocol for Bulk Rheological Characterization of Biofilms
This protocol is adapted from studies on Microbacterium lacticum biofilms [13].
- Biofilm Cultivation: Grow biofilms on appropriate substrates (e.g., 2B cold-rolled stainless-steel plates) under controlled conditions relevant to the study (e.g., temperature, nutrient availability).
- Sample Loading: Carefully remove the biofilm-coated substrate and mount it onto the rheometer's measuring system (e.g., parallel plate or cone-plate geometry). Ensure the entire biofilm structure is securely contained within the geometry.
- Strain Sweep Test: Perform an oscillatory strain sweep at a constant frequency and temperature to determine the Linear Viscoelastic Region (LVR), where the material's structure remains intact.
- Frequency Sweep Test: Conduct an oscillatory frequency sweep within the previously determined LVR. This measures the viscoelastic moduli (G' and G") as a function of frequency, revealing the time-dependent mechanical behavior.
- Data Analysis: Analyze the resulting data to extract the storage modulus (G'), loss modulus (G"), and complex viscosity. Compare these values across different biofilm strains or growth conditions.
Protocol for Nanomechanical Mapping using AFM
This protocol outlines the general workflow for characterizing biofilm mechanics with AFM [47] [6].
- Sample Preparation: For biofilms, this involves cultivating them directly on a flat substrate (e.g., glass, silicon wafer). Samples are then typically gently rinsed with a buffer solution to remove unattached cells and may be chemically fixed or measured under physiological liquid conditions [6].
- Cantilever Selection and Calibration: Choose a cantilever with an appropriate spring constant (typically 0.01 - 1 N/m for soft biological samples). Calibrate the cantilever's sensitivity and its precise spring constant using thermal tuning or a reference sample.
- AFM Imaging: First, acquire a high-resolution topographical image of the biofilm surface using tapping mode to minimize sample damage.
- Force Volume or Point Spectroscopy: Program the AFM to collect force-distance curves at a grid of points over the region of interest. In each curve, the tip approaches the surface, indents it, and then retracts.
- Data Processing and Analysis: Fit the approach section of the force-distance curves with a contact mechanics model (e.g., Hertz, Sneddon) to calculate the local Young's modulus (stiffness) at each point. Compile these values to create a nanomechanical property map of the biofilm.
Diagram 1: AFM Nanomechanical Workflow
The Scientist's Toolkit: Essential Research Reagents and Materials
Successful experimentation requires specific materials. The table below lists key reagents and their functions in biofilm viscoelasticity research.
Table 3: Essential Research Reagents and Materials for Biofilm Viscoelasticity Studies
| Reagent / Material | Function and Application in Research |
|---|---|
| Soft AFM Cantilevers (e.g., k = 0.01 - 1 N/m) | The core sensor for AFM; its flexibility allows accurate force measurement on soft biological samples without causing damage [47]. |
| Gold-Coated AFM Tips (for AFM-IR) | Used in photothermal techniques like AFM-IR; the gold coating enhances laser absorption and thermal sensitivity for chemical analysis [49]. |
| Stainless-S Steel Substrates (e.g., 2B cold-rolled) | A standard, relevant surface in the food industry for cultivating biofilms for both AFM and rheological testing [13]. |
| Alginate-Based Hydrogels | Used as synthetic biofilm imitations. They mimic the viscoelastic and tribological properties of native biofilms, useful for standardizing cleaning tests [13]. |
| Glutaraldehyde Fixative | A chemical fixative used to preserve the structure of biological samples (e.g., bacteria) for AFM imaging, though it may alter mechanical properties [49] [47]. |
| Silicon Wafers | An atomically flat substrate used for high-resolution AFM imaging of biological specimens, including biofilm sections and single cells [49] [6]. |
The field of biofilm biomechanics is rapidly advancing, driven by technological innovations. Key future trends include:
- Automation and Machine Learning: Automated large-area AFM, combined with machine learning for image stitching, cell detection, and analysis, is overcoming traditional limitations of small scan areas and labor-intensive operation [6]. This allows for high-resolution characterization over millimeter-scale areas, linking nanoscale features to macroscale biofilm organization.
- Artificial Intelligence (AI): AI is transforming AFM by optimizing scanning processes, enabling autonomous operation, and enhancing data analysis through automated segmentation and classification of complex structures [6].
- Correlative Microscopy: Integrating AFM with other analytical techniques, particularly fluorescence microscopy, is a powerful trend. This "hyphenation" of techniques allows researchers to correlate nanomechanical data with specific chemical identities and biological functions [38] [50].
In conclusion, the choice between bulk rheology and AFM-based nanorheology is not a matter of superiority but of scientific goal. Bulk rheology remains the optimal tool for understanding the macroscale flow and deformation behavior of biofilms, which is critical for predicting their response in industrial piping or during large-scale mechanical removal. In contrast, AFM-based techniques are unparalleled for investigating the nanoscale origins of mechanical heterogeneity, such as the role of individual EPS components, bacterial appendages, and surface interactions in biofilm assembly and resilience [1] [6]. As these techniques continue to evolve with greater automation, intelligence, and integration, they will provide deeper, multi-scale insights crucial for developing targeted strategies to combat biofilm-related challenges in medicine and industry.
{ARTICLE CONTENT START}
Complementary Micro-Rheological Approaches: Particle Tracking and Magnetic Tweezers
In the field of biofilm viscoelasticity research, selecting the appropriate micro-rheological tool is paramount for obtaining accurate and physiologically relevant data. This guide provides an objective comparison between two prominent techniques: Particle Tracking Microrheology and Magnetic Tweezers. We summarize their performance characteristics with quantitative data, detail standardized experimental protocols, and catalog essential research reagents. Within the broader thesis comparing Atomic Force Microscopy (AFM) with rheology, this analysis positions these complementary methods, highlighting how Particle Tracking offers passive, high-resolution mapping of local heterogeneity, while Magnetic Tweezers enable active, quantitative probing of mechanical properties under force.
Performance Comparison and Quantitative Data
The following table summarizes the core performance characteristics of Particle Tracking and Magnetic Tweezers, based on current experimental data.
Table 1: Performance Comparison of Particle Tracking and Magnetic Tweezers in Biofilm Rheology
| Feature | Particle Tracking Microrheology | Magnetic Tweezers |
|---|---|---|
| Fundamental Mode | Passive: Analyzes Brownian motion of embedded probes [51]. | Active: Applies controlled external force to measure response [52] [53]. |
| Measured Parameters | Mean-Squared Displacement (MSD), viscoelastic moduli (G', G"), diffusion coefficient [51]. | Creep compliance J(t), elastic compliance, viscosity, shear modulus [52]. |
| Force Application | Not applicable (passive technique). | 2 pN to over 100 pN, with high-resolution control (<0.1 pN demonstrated) [54] [53]. |
| Spatial Resolution | Micron-scale, maps heterogeneity [52] [51]. | Micron-scale (bead size), capable of 3D mapping within a biofilm [52]. |
| Temporal Stability | Suitable for short- to medium-term observation. | Exceptional; allows for driftless measurements over hours or days [55] [54]. |
| Key Advantage | Reveals spatial heterogeneity of mechanical properties without external perturbation [52] [51]. | Directly quantifies viscoelastic parameters under biologically relevant forces; intrinsic force-clamp [55] [52]. |
| Typical Elastic Compliance Range in Biofilms | Not explicitly quantified in results. | Can vary by three orders of magnitude within a single E. coli biofilm [52]. |
Detailed Experimental Protocols
Protocol for Particle Tracking Microrheology in Biofilms
This protocol outlines the procedure for passive microrheology using particle tracking, adapted from studies on bacterial biofilms [51].
- Probe Incorporation: Fluorescent or non-fluorescent micron-sized particles (0.1 - 1 µm in diameter) are introduced into the growth medium during the initial stages of biofilm formation. The mixed suspension is allowed to sediment under static conditions for approximately 1 hour to facilitate particle incorporation into the developing biofilm matrix [52].
- Biofilm Growth: Biofilms are grown under controlled flow conditions in a flow cell chamber. A continuous flow of nutrient medium is maintained to support growth and establish steady-state conditions for 1-3 days, depending on the desired maturity [51].
- Image Acquisition: The biofilm containing the embedded particles is imaged using confocal laser scanning microscopy (CLSM) or bright-field microscopy on an inverted microscope. A high-speed camera records video sequences of the particles' Brownian motion at a frequency of 30 Hz or higher for a set period (e.g., 20 seconds) [52].
- Particle Trajectory Analysis: The recorded video sequences are analyzed using particle tracking algorithms (e.g., in ImageJ) to extract the trajectories (x, y, z coordinates over time) of individual particles [52].
- Data Calculation: The Mean-Squared Displacement (MSD) is calculated from the particle trajectories. The viscoelastic moduli, including the storage modulus G'(ω) and loss modulus G"(ω), are then derived from the MSD using the Generalized Stokes-Einstein equation [51].
Protocol for Magnetic Tweezers Microrheology in Biofilms
This protocol describes an active microrheology approach using magnetic tweezers to map local viscoelasticity, as demonstrated in E. coli biofilms [52].
- Magnetic Probe Incorporation: Micrometric superparamagnetic beads (e.g., 2.8 µm diameter Dynabeads) are mixed with a bacterial suspension at a defined concentration (e.g., 2.5 × 10^6 beads/mL). This mixture is introduced into a flow cell capillary and allowed to sediment for 1 hour under static conditions before initiating continuous flow for the remainder of the biofilm growth period [52].
- Force Calibration: Prior to biofilm measurements, the force exerted on the magnetic beads is calibrated. Beads are dispersed in a solution of known viscosity (e.g., glycerol-water mixture). A magnetic force is applied, and the bead velocity is tracked. The force is calculated using Stokes' law, and a 3D calibration map of force versus position is created [52].
- Creep Compliance Measurement: Inside the mature biofilm, a constant magnetic force (ranging from 29 pN to 104 pN, as calibrated) is applied to an individual embedded magnetic bead. The resulting displacement of the bead over time (typically 20 seconds at 30 Hz sampling) is tracked using video microscopy [52].
- Viscoelastic Parameter Extraction: The time-dependent creep compliance, J(t), is calculated from the bead's deflection d(t) and the applied force ƒ using the equation: J(t) = d(t) · 6πR / f, where R is the bead radius. The resulting creep curve is then fitted to a mechanical model (e.g., Burger's model) to extract quantitative viscoelastic parameters such as elastic moduli and viscosities [52].
- Spatial Mapping: The process is repeated for multiple beads at different locations within the biofilm to construct a 3D map of the local viscoelastic properties, revealing mechanical heterogeneity [52].
Experimental Workflow Visualization
The diagram below illustrates the logical sequence and core components of a magnetic tweezers experiment for biofilm microrheology.
Diagram 1: Magnetic Tweezers Biofilm Workflow
The Scientist's Toolkit: Essential Research Reagents
The table below lists key materials required for the magnetic tweezers microrheology protocol detailed above.
Table 2: Essential Reagents for Magnetic Tweezers Biofilm Microrheology
| Item Name | Function / Description | Example from Research |
|---|---|---|
| Superparamagnetic Beads | Act as force probes embedded within the biofilm matrix. Their displacement under a magnetic field is tracked. | Dynabeads M-270 Amine, 2.8 µm diameter [52]. |
| Flow Cell Chamber | Provides a controlled environment for growing biofilms under continuous nutrient flow and shear stress. | Glass capillary flow chambers or PDMS-based microfluidic devices [52] [51]. |
| Bacterial Strain | The microorganism used to form the biofilm. Isogenic mutants allow linking mechanics to genetics. | Escherichia coli strains (e.g., expressing F pili or curli) [52]. |
| Growth Medium | Provides nutrients for bacterial growth and biofilm development. | Defined media such as M63B1 with glucose or complex media like Lysogeny Broth (LB) [52]. |
| Force Calibration Solution | A fluid of known viscosity used to calibrate the force applied to the magnetic beads. | Glycerol-water mixtures [52]. |
| Magnetic Tweezers Setup | Instrument comprising electromagnets and a microscope to apply force and track beads. | Custom-built setups with electromagnetic poles and an inverted bright-field microscope [52] [53]. |
{ARTICLE CONTENT END}
Overcoming Technical Challenges: A Guide to Optimizing AFM and Rheology Measurements
Preserving Biofilm Hydration and Native Structure During AFM Analysis
Biofilms are complex, multicellular microbial communities encased in a self-produced extracellular polymeric substance (EPS) matrix, which provides structural integrity and environmental protection [6] [43]. Understanding their mechanical viscoelastic properties is crucial for developing strategies to control biofilms in medical, industrial, and environmental contexts [56]. However, a significant challenge in this research lies in accurately measuring these properties without altering the biofilm's native structure through dehydration or mechanical disruption [57] [58].
Atomic Force Microscopy (AFM) and rheology represent two principal techniques for probing biofilm mechanics, each with distinct advantages and limitations regarding preservation of native conditions [56]. AFM offers nanoscale resolution and the ability to operate in physiological liquids, enabling measurement under conditions that maintain biofilm hydration [6] [58]. In contrast, conventional rheology provides bulk mechanical characterization but often requires sample manipulation that can compromise native structure [56]. This guide objectively compares the performance of these techniques, with particular emphasis on methodological approaches that preserve biofilm hydration and native architecture during AFM analysis.
Methodological Comparison: AFM vs. Rheology for Native Biofilm Analysis
Atomic Force Microscopy (AFM) for Native Condition Analysis
AFM operates by scanning a sharp probe across a surface to generate topographical images and measure nanomechanical properties through force-distance curves [58]. When applied to biofilms, AFM can be performed in liquid environments, preserving hydration and enabling characterization under physiological conditions [6] [58]. The technique provides high-resolution structural and functional information at the cellular and sub-cellular level, allowing researchers to visualize individual cells, flagella, and EPS components without extensive sample preparation that might alter native structure [6].
Key Methodological Considerations for Hydration Preservation:
- Liquid Imaging Chamber: AFM instruments equipped with liquid cells enable imaging in physiological buffers, maintaining biofilm hydration throughout analysis [58].
- Intermittent Contact (Tapping) Mode: This imaging mode reduces lateral forces and sample disturbance compared to contact mode, preserving delicate biofilm structures [58].
- Functionalized Probes: Tips modified with specific chemical groups or biological molecules can probe specific interactions while maintaining hydrated conditions [58].
- Large-Area Automated AFM: Recent advancements enable high-resolution imaging over millimeter-scale areas, capturing spatial heterogeneity while maintaining hydration [6].
Rheology for Bulk Mechanical Characterization
Rheology measures the flow and deformation of materials, providing bulk mechanical properties of biofilms such as viscoelastic moduli, yield stress, and compliance [56]. While valuable for understanding large-scale mechanical behavior, traditional rheological approaches often require sample homogenization or compression that disrupts native biofilm architecture [56].
Key Methodological Limitations for Native Structure Preservation:
- Sample Homogenization: Preparation for shear rheology often destroys the macroscale structure of biofilms, though the microscopic ECM architecture may remain intact [56].
- Dehydration Risk: Transferring biofilms to rheometer plates risks dehydration unless carefully controlled hydration chambers are used.
- Limited Spatial Resolution: Provides bulk mechanical properties without spatial heterogeneity information at cellular or microcolony scales [56].
Table 1: Performance Comparison of AFM and Rheology for Native Biofilm Analysis
| Parameter | Atomic Force Microscopy (AFM) | Shear Rheology |
|---|---|---|
| Hydration Preservation | Excellent (can operate in physiological buffers) | Moderate (risk of dehydration during sample loading) |
| Native Structure Maintenance | High (minimal sample preparation required) | Low (often requires sample homogenization) [56] |
| Spatial Resolution | Nanoscale (sub-cellular features) [6] | Macroscale (bulk properties only) |
| Mechanical Properties Measured | Elasticity, adhesion, viscoelasticity at microscale [58] | Bulk viscoelastic moduli (G', G"), yield stress [56] |
| Sample Throughput | Low to moderate (imaging is sequential) | High (bulk measurement) |
| Artifact Potential | Tip-sample interaction effects [58] | Homogenization-induced structural alterations [56] |
| Environmental Control | Precise temperature and buffer control | Limited once sample is loaded |
Table 2: Quantitative Data Comparison from E. coli Biofilm Studies [56]
| Measurement Type | Curli+ pEtN-Cellulose+ Biofilms | Curli-Deficient Biofilms | Technique Comparison |
|---|---|---|---|
| Compressive Stiffness (AFM) | High | Significantly reduced | AFM sensitive to matrix composition differences |
| Bulk Stiffness (Rheology) | Tissue-like elasticity | Softer mechanical response | Homogenization reduces structural contributions |
| Structural Stability | High (with pEtN modification) | Reduced | pEtN-cellulose crucial for stability |
| Post-Homogenization Structure | Microscopic ECM architecture may remain | Similar microscopic preservation | Macroscale structure destroyed in rheology prep [56] |
Experimental Protocols for Hydrated AFM Analysis
Immobilization Techniques for Hydrated Biofilm AFM
Proper immobilization is critical for successful AFM imaging of hydrated biofilms without structural alteration [58]. The immobilization must be secure enough to withstand lateral forces during scanning, yet benign enough to avoid physiochemical or physiological changes [58].
Mechanical Entrapment Protocol:
- Porous Membrane Method: Use membranes with pore diameters similar to bacterial cell dimensions (0.5-2µm) to physically trap cells while allowing nutrient exchange [58].
- PDMS Stamping Technique: Create polydimethylsiloxane (PDMS) stamps with microstructures (1.5-6µm wide, 1-4µm deep) using silicon wafer masters [58].
- Agar Immobilization: Embed biofilms in low-concentration agar (0.5-1%) to provide gentle restraint during imaging in liquid [58].
Chemical Attachment Protocol:
- Surface Functionalization: Treat glass or mica surfaces with poly-l-lysine (0.1% w/v) or trimethoxysilyl-propyl-diethylenetriamine to promote cell adhesion [58].
- Covalent Linkage: Use carbodiimide chemistry to crosslink bacterial surface proteins to amine-functionalized surfaces [58].
- Bio-affinity Immobilization: Employ antibody-functionalized surfaces or lectin-coated substrates for specific binding [58].
Large-Area Hydrated AFM Imaging Protocol
Recent advancements in automated large-area AFM enable comprehensive analysis of biofilm heterogeneity while maintaining hydration [6].
Automated Large-Area Scanning Protocol:
- Hardware Setup: Employ AFM systems with large-range piezoelectric actuators (capable of millimeter-scale travel) and liquid cells [6].
- Image Stitching: Capture multiple adjacent images with minimal overlap (5-10%) and use machine learning algorithms for seamless stitching [6].
- Hydration Maintenance: Implement continuous buffer perfusion systems to maintain physiological conditions during extended acquisitions [6].
- ML-Assisted Analysis: Apply machine learning for automated cell detection, classification, and morphological parameter extraction from large datasets [6].
Experimental Workflow for Hydrated AFM
Force Spectroscopy Protocol for Viscoelastic Measurements
AFM force spectroscopy enables quantitative measurement of biofilm mechanical properties under hydrated conditions [58].
Nanoindentation Protocol:
- Cantilever Selection: Use soft cantilevers (spring constant 0.01-0.1 N/m) with colloidal probes (2-5µm diameter) to minimize sample damage [58].
- Approach Rate Optimization: Employ approach rates (0.5-2µm/s) compatible with hydrated biofilm viscoelastic response [58].
- Force Curve Acquisition: Collect multiple force curves (100-1000) across biofilm surface to map heterogeneity [58].
- Data Analysis: Apply Hertz or Sneddon models to force curves to calculate elastic modulus, accounting for biofilm porosity and heterogeneity [58].
Technical Considerations for Native Structure Preservation
Minimizing Artifacts in Hydrated AFM Imaging
Preserving native biofilm structure during AFM analysis requires careful attention to potential artifacts:
Tip-Sample Interaction Effects:
- Force Optimization: Use minimal imaging forces (50-100pN) to avoid compressing or displacing hydrated EPS [58].
- Scan Rate Adjustment: Employ moderate scan rates (0.5-2Hz) to balance temporal resolution with reduced hydrodynamic forces [58].
- Cantilever Selection: Choose cantilevers with appropriate spring constants and sharp tips (10-20nm radius) for high-resolution imaging without excessive force [58].
Hydration Maintenance Strategies:
- Environmental Chambers: Use sealed liquid cells with temperature control to prevent evaporation during extended experiments [58].
- Buffer Compatibility: Employ physiologically relevant buffers (e.g., PBS, minimal media) that maintain bacterial viability without inducing osmotic stress [58].
- Perfusion Systems: Implement slow continuous flow systems for nutrient and waste exchange during long-term time-lapse studies [6].
Comparative Data Interpretation
When comparing AFM and rheology data for biofilm viscoelasticity, consider these methodological impacts:
Scale-Dependent Properties:
- AFM measures local, microscale properties that may differ significantly from bulk rheological measurements [56].
- Biofilm heterogeneity means point measurements may not represent overall mechanical behavior [6] [56].
Strain Rate Effects:
- AFM typically operates at higher effective strain rates than rheology, potentially affecting measured viscoelastic parameters [58].
- Direct comparison requires careful matching of experimental time scales [56] [58].
Technique Selection Logic
The Scientist's Toolkit: Essential Research Reagents and Materials
Table 3: Essential Research Reagents and Materials for Hydrated Biofilm AFM
| Item | Function | Application Notes |
|---|---|---|
| Polydimethylsiloxane (PDMS) Stamps | Mechanical immobilization of cells for hydrated imaging [58] | Customizable pore sizes for different bacterial morphologies |
| Poly-l-Lysine Coated Substrata | Chemical immobilization through electrostatic interactions [58] | Suitable for most bacterial species; may affect surface properties |
| Functionalized AFM Probes | Specific interaction measurement and targeted indentation [58] | Tips modified with chemical groups or biological ligands |
| Silicon Nitride Cantilevers | Standard probes for imaging in liquid environments [58] | Spring constants 0.01-0.5 N/m suitable for biofilms |
| Colloidal Probe Tips | Nanoindentation with well-defined geometry [58] | 2-5µm spheres for reliable mechanical property measurement |
| Physiological Buffer Systems | Maintenance of hydration and viability during imaging [58] | PBS, minimal media, or artificial saliva depending on application |
| Perfusion Chamber Systems | Continuous fluid exchange during time-lapse studies [6] | Maintains nutrient supply and waste removal |
| Machine Learning Software | Analysis of large-area AFM datasets and automated feature identification [6] | Enables quantitative analysis of biofilm heterogeneity |
Preserving biofilm hydration and native structure during AFM analysis requires careful methodological consideration but provides unparalleled insights into the true mechanical and structural properties of these complex microbial communities. While AFM excels at maintaining hydrated conditions and providing nanoscale resolution, rheology offers complementary bulk mechanical characterization. The choice between techniques should be guided by research objectives, with AFM providing superior preservation of native biofilm architecture when properly implemented. Recent advancements in large-area automated AFM, combined with machine learning analysis, promise to further enhance our ability to characterize biofilm heterogeneity under physiologically relevant conditions, potentially bridging the gap between micro- and macroscale mechanical properties.
Biofilm heterogeneity presents a significant challenge for researchers aiming to obtain representative and reproducible data, particularly in studies of mechanical properties like viscoelasticity. This inherent variability arises from spatial differences in environmental factors, community composition, and structural organization within biofilms [59]. Studies have demonstrated that even biofilms grown on a single material under controlled laboratory conditions exhibit substantial small-scale heterogeneity, with biofilm thickness of cm-sections varying up to 4-fold and total cell concentrations varying 3-fold [59] [60]. This heterogeneity is further amplified in real-world, uncontrolled environments where discontinuities in environmental conditions create even more pronounced structural and compositional variations [59].
For researchers comparing atomic force microscopy (AFM) and rheology for assessing biofilm viscoelasticity, this heterogeneity directly impacts measurement reliability and interpretation. Rheology provides bulk measurements of viscoelastic properties but may overlook micro-scale variations, while AFM enables nanoscale probing of mechanical interactions but requires careful consideration of sampling location to ensure representative data [1]. Understanding and addressing this heterogeneity through appropriate sampling strategies is therefore fundamental to generating meaningful comparisons between these analytical techniques and deriving accurate conclusions about biofilm mechanical behavior.
Biofilm heterogeneity manifests across multiple scales, from microscopic variations in matrix density to macroscopic differences in community structure across a surface. This heterogeneity stems from several fundamental sources that researchers must recognize when designing sampling protocols.
Spatial and Environmental Influences
Spatial heterogeneity in biofilms has been documented across various aquatic ecosystems and is primarily driven by localized differences in environmental factors rather than distance alone [59]. In engineered systems like drinking water distribution networks, dramatic variations occur due to diverse materials supporting microbial growth, variations in surface-to-volume ratios affecting attachment/detachment probabilities, differences in flow/stagnation regimes, and temperature fluctuations [59]. These factors create microenvironments that select for distinct community structures and matrix properties, directly impacting viscoelastic measurements.
Even within confined, controlled systems, heterogeneity persists. Research examining biofilms grown inside flexible shower hoses under controlled laboratory conditions for 12 months revealed surprising heterogeneity despite uniform conditions [59] [60]. The relative abundance of dominant taxa varied up to 5-fold across different sections of the same hose, indicating that intrinsic biological factors contribute significantly to heterogeneity beyond environmental variables [60].
Substratum Effects on Biofilm Composition
The substrate surface properties significantly influence biofilm development and community structure, creating another source of heterogeneity. Research comparing natural and artificial substrata has revealed substantial variations in bacterial and fungal community composition based on substratum properties and origin [61]. Studies found that no single substratum optimally represents overall biofilm biodiversity, suggesting that sampling strategies must account for substratum-specific selection effects [61].
Multivariate statistical analysis of denaturing gradient gel electrophoresis (DGGE) data has demonstrated that microbial community structure varies significantly between different substrata according to their properties and origin (natural or artificial, organic or inorganic) [61]. Interestingly, artificial substrata were not significantly less applicable than natural substrata for growing representative biofilms, but pooling multiple substratum types enabled higher bacterial and fungal biodiversity recovery [61].
Sampling Methodologies: Comparative Analysis of Efficiency and Applications
Selecting appropriate sampling methods is crucial for obtaining representative data on biofilm properties. The optimal technique depends on the specific research objectives, whether for microbiological analysis, mechanical property assessment, or community composition studies.
Conventional Sampling Methods and Limitations
Traditional biofilm sampling approaches include direct agar contact, swabbing, and the use of sterile cloths and sponges [62]. While simple and convenient, these methods often fail to effectively detach the biofilm from surfaces, particularly because bacteria remain trapped in the extracellular polymeric substance (EPS) matrix [62]. This limitation results in low recovery rates and potentially biased microbiological data, with risks of underestimating microbial populations or misrepresenting community structure.
The standard ASTM International method utilizing ultrasonication has demonstrated effectiveness for detaching Pseudomonas aeruginosa biofilms grown on stainless steel coupons, providing reproducible results [62]. However, this method is not always practically applicable to industrial equipment surfaces, prompting research into alternative approaches that balance efficiency with practical implementation.
Quantitative Comparison of Sampling Efficiencies
Recent comparative studies have systematically evaluated the efficiency of various sampling methods for recovering biofilms from surfaces. The table below summarizes key findings from a study evaluating different techniques for sampling Pseudomonas azotoformans PFl1A biofilms grown in a CDC biofilm reactor system:
Table 1: Comparison of biofilm sampling method efficiencies for Pseudomonas azotoformans PFl1A recovery
| Sampling Method | Recovery Efficiency (log CFU/cm²) | Statistical Significance | Practical Applications |
|---|---|---|---|
| Ultrasonication (ASTM Standard) | 8.74 ± 0.02 | Reference method | Laboratory settings, standardized testing |
| Scraping | 8.65 ± 0.06 | Not significant | Field applications, irregular surfaces |
| Synthetic Sponge | 8.75 ± 0.08 | Not significant | Processing plants, large surface areas |
| Sonicating Synthetic Sponge | 8.71 ± 0.09 | Not significant | Industrial equipment, complex geometries |
| Swabbing | 8.57 ± 0.10 | Significantly lower (p < 0.05) | Routine monitoring, accessible surfaces |
| Sonic Brushing | 8.60 ± 0.00 | Significantly lower (p < 0.05) | Dental applications, delicate surfaces |
Scanning electron microscopy validation of these methods revealed that while sonic brushing, synthetic sponge, and sonicating synthetic sponge all showed effective biofilm removal, only the latter two methods guaranteed superior release of bacterial biofilm into suspension [62]. The combination of sonication with synthetic sponge proved particularly effective for dislodging sessile cells from surface crevices, making it a promising alternative to standard ultrasonication for industrial applications [62].
Advanced Techniques for Characterizing Biofilm Viscoelastic Properties
The selection between AFM and rheology for assessing biofilm viscoelasticity depends on the scale and nature of information required, with each technique offering distinct advantages for specific research questions.
Atomic Force Microscopy for Nanoscale Characterization
AFM has emerged as a powerful tool for probing biofilm mechanical properties at the nanoscale, providing insights into localized variations that bulk techniques might miss. Advanced AFM methodologies enable quantitative assessment of key viscoelastic parameters:
Table 2: AFM applications in biofilm viscoelasticity characterization
| AFM Application | Measured Parameters | Research Insights | Technical Considerations |
|---|---|---|---|
| Microbead Force Spectroscopy (MBFS) | Adhesive pressure, elastic moduli, viscosity | Wild-type P. aeruginosa PAO1 early biofilms: 34 ± 15 Pa adhesive pressure; mutant strains showed significant differences [16] | Standardized conditions essential for comparable data |
| Cohesive Energy Measurement | Cohesive energy (nJ/μm³) | Increases with biofilm depth (0.10 ± 0.07 to 2.05 ± 0.62 nJ/μm³); calcium addition increases cohesiveness [12] | Requires humidity control; measures cell/EPS and EPS/EPS interactions |
| Friction and Wear Analysis | Volume displacement, frictional energy | Depth-dependent cohesive strength; correlation with EPS composition and ionic bridges [12] | Multiple scanning at elevated loads; specialized tip geometry |
A novel AFM technique developed for measuring cohesive energy in moist biofilms has demonstrated the ability to detect variations with biofilm depth and in response to environmental factors like calcium concentration [12]. This method quantifies both the volume of biofilm displaced and the corresponding frictional energy dissipated during scanning, enabling calculation of cohesive energy values that range from 0.10 ± 0.07 nJ/μm³ at the surface to 2.05 ± 0.62 nJ/μm³ in deeper regions [12].
Rheological Approaches for Bulk Properties
Rheology provides complementary information to AFM, characterizing the bulk viscoelastic properties of biofilms that govern their mechanical stability and resistance to fluid shear. Rheological models offer insights into biofilm behavior under diverse environmental conditions, aiding in predicting their response to mechanical and chemical challenges [1]. These bulk measurements are particularly valuable for understanding biofilm detachment processes and designing flow systems where overall mechanical behavior is more relevant than localized properties.
The integration of rheological data with micro-scale measurements from techniques like AFM helps elucidate the complex interplay between environmental factors and biofilm development, informing strategies for disinfection and product optimization [1]. This multi-scale approach is essential for comprehensively understanding biofilm viscoelasticity and addressing heterogeneity challenges in research.
Experimental Design: Protocols for Representative Sampling and Analysis
Implementing standardized protocols is essential for obtaining comparable data across different studies and minimizing variability introduced by sampling procedures.
AFM Cohesive Energy Measurement Protocol
The AFM method for measuring biofilm cohesive energy involves specific steps to ensure reproducibility [12]:
Biofilm Preparation: Grow biofilms on appropriate substrates (e.g., membrane test modules). For mixed culture biofilms, inoculate with activated sludge and cultivate in nutrient solution with defined hydraulic detention times.
Humidity Control: Equilibrate biofilm samples in a chamber with saturated NaCl solution (∼90% humidity) for 1 hour before measurement to maintain consistent water content.
Topographic Imaging: Collect initial non-perturbative topographic images of a 5×5 μm biofilm region at low applied load (∼0 nN) using V-shaped cantilevers with pyramidal Si3N4 tips.
Abrasive Scanning: Zoom to a 2.5×2.5 μm subregion and perform repeated raster scanning at elevated load (40 nN) for four scans to induce controlled abrasion.
Post-Abrasion Imaging: Return to low load and capture another 5×5 μm image of the abraded region.
Data Analysis: Subtract consecutive height images to determine volume of displaced biofilm. Calculate cohesive energy from the ratio of frictional energy dissipated to volume displaced.
This method has shown reproducibility across different biofilms, with four separate biofilms demonstrating similar depth-dependent increases in cohesive energy [12].
High-Resolution Spatial Sampling Strategy
For comprehensive assessment of biofilm heterogeneity, a high-resolution sampling approach is recommended [59] [60]:
Sample Processing: Collect biofilm-grown surfaces (e.g., 120 cm hose sections) and dissect into 20 × 6 cm pieces.
Spatial Orientation: Bisect each piece into top and bottom sections to account for orientation-dependent variability.
Fine Segmentation: Further cut each section into 5 × 1.2 cm segments (total 200 cm-sections per sample).
Biofilm Removal: Brush each section separately with an electric toothbrush into filtered water, followed by needle sonication to disrupt cell clusters (30s with 5×10% pulses at 40% power).
Analysis: Determine total cell concentrations via flow cytometry and characterize community composition through DNA analysis.
This methodology enables detailed analysis of spatial heterogeneity within individual biofilms, providing insights into structure and community composition across cm-to m-scales [59].
Research Reagent Solutions for Biofilm Viscoelasticity Studies
Selecting appropriate materials and reagents is crucial for standardized biofilm research. The following table outlines essential solutions for studying biofilm viscoelasticity:
Table 3: Essential research reagents for biofilm viscoelasticity studies
| Reagent/Material | Function in Research | Application Examples | Technical Considerations |
|---|---|---|---|
| Tipless Silicon Cantilevers (CSC12/Tipless) | Force spectroscopy measurements | Microbead force spectroscopy for adhesion and viscoelasticity quantitation [16] | Spring constant: 0.01-0.08 N/m; requires calibration |
| Polyolefin Flat Sheet Membrane | Biofilm growth substrate | Cohesive energy measurements; standardized surface properties [12] | 0.1-μm mean pore diameter; 34% porosity |
| Sodium Alginate | Biofilm imitation matrix | Tribological studies; viscoelastic behavior simulation [13] | Achieves similar coefficient of friction (0.24-0.36) to native biofilms |
| Gellan Gum | Hydrocolloidal biofilm imitation | Rheological comparisons; cleaning protocol development [13] | Can be formulated to match viscoelastic properties |
| Calcium Chloride (10 mM) | Matrix modifier | Cohesive strength enhancement; EPS cross-linking studies [12] | Increases cohesive energy from 0.10 to 1.98 nJ/μm³ |
Integrated Workflow for Representative Biofilm Sampling
The following diagram illustrates a comprehensive strategy for addressing biofilm heterogeneity in viscoelasticity research, integrating both AFM and rheological approaches:
Integrated Workflow for Biofilm Viscoelasticity Assessment
Addressing biofilm heterogeneity requires a multifaceted approach that combines appropriate substrate selection, efficient sampling methodologies, and complementary analytical techniques. For researchers comparing AFM and rheology in biofilm viscoelasticity studies, representative sampling is not merely a preliminary step but a fundamental consideration that directly impacts data interpretation and technological relevance.
The integration of high-resolution spatial sampling with both nanoscale (AFM) and bulk (rheology) characterization techniques provides a comprehensive framework for understanding biofilm mechanical properties across scales. By implementing standardized protocols and recognizing the inherent variability in biofilms, researchers can generate more reliable, reproducible data that advances both fundamental understanding and practical applications in biofilm management.
Future directions should focus on developing standardized biofilm imitation materials that replicate the mechanical properties of natural biofilms [13], enabling more controlled evaluation of sampling methods and cleaning protocols. Additionally, advanced spatial mapping techniques that correlate local composition with mechanical properties will further enhance our ability to address biofilm heterogeneity in viscoelasticity research.
The Pitfalls of Sample Homogenization in Rheology and Its Impact on Data Interpretation
The study of biofilm viscoelasticity is pivotal for advancing strategies to control persistent infections and combat microbial resistance. The mechanical properties of biofilms—a complex blend of elastic solid and viscous liquid behaviors—directly influence their stability, resistance to treatment, and dispersal mechanisms [34]. Characterizing these properties presents a significant challenge, with rheology and atomic force microscopy (AFM) emerging as two principal techniques. Rheology typically provides bulk-average measurements, while AFM offers nanoscale resolution of local properties. A fundamental, yet often overlooked, distinction lies in their sample preparation: rheology frequently requires sample homogenization, a process that disrupts the native biofilm architecture, while AFM typically allows for measurement under native conditions. This article objectively compares these methodologies, focusing on how sample homogenization in rheological approaches can compromise data interpretation and presents a critical pitfall in biofilm research. We provide supporting experimental data and detailed protocols to guide researchers in selecting the appropriate technique for their specific microbiological objectives.
Technical Comparison: Rheology vs. AFM for Biofilm Analysis
The following table summarizes the core technical differences between the two methods, highlighting the central issue of sample preparation.
Table 1: Core Technical Comparison between Rheology and AFM for Biofilm Viscoelasticity
| Feature | Bulk Rheology | Atomic Force Microscopy (AFM) |
|---|---|---|
| Sample Preparation | Often requires homogenization or scraping, disrupting native 3D structure [34] | Minimal preparation; can be performed in situ on hydrated, intact biofilms [16] [12] |
| Measurement Type | Bulk, volume-averaged properties | Surface and local nanomechanical properties |
| Spatial Resolution | Low (millimeter scale); obscures heterogeneity | High (nanometer to micrometer scale) [3] |
| Key Measured Parameters | Shear storage modulus (G'), loss modulus (G''), complex viscosity [63] | Adhesive pressure, instantaneous & delayed elastic moduli, viscosity [16] |
| Data Interpretation Pitfalls | Data represents an average; masks regional variations crucial to biofilm function [3] [34] | Risk of over-representing local properties; requires multiple measurements for statistical relevance |
| Ideal Application | Screening bulk material properties under different growth conditions [1] | Probing region-specific mechanics, cell-surface interactions, and structural role of EPS [64] |
The workflow diagrams below illustrate the fundamental methodological differences stemming from sample preparation, which directly impact the type of data acquired.
Figure 1: Fundamental workflow divergence between rheology and AFM. The critical step of homogenization in the rheology pathway alters the native biofilm structure prior to measurement.
The Homogenization Pitfall: Impact on Data and Interpretation
The process of homogenizing a biofilm for rheological analysis—often through scraping, blending, or vortexing—fundamentally alters its mechanical integrity. Biofilms are not homogeneous gels; they are structurally complex ecosystems with significant spatial heterogeneity. Particle-tracking microrheology studies have demonstrated that creep compliance (a measure of deformation under load) can vary drastically between dense bacterial clusters and the void zones within the same biofilm [3]. Homogenization destroys this architecture, leading to several key pitfalls:
- Loss of Structural Information: The biofilm matrix is a complex 3D network of extracellular polymeric substances (EPS), cells, and water channels. Homogenization shears this network, creating a more uniform but non-representative gel. This process masks the original spatial organization that governs mechanical stability and mass transport [34].
- Averaging of Mechanical Properties: Rheological measurements on homogenized samples provide a single value for parameters like elastic modulus (G') or viscosity. This bulk average obscures critical local variations. For instance, the base of a biofilm is often stiffer due to stronger adhesion and older cells, while the top layers are softer and more viscoelastic. This gradient, which influences detachment and dispersal, is invisible in homogenized samples [3] [34].
- Altered Response to Stimuli: A biofilm's mechanical response to chemical treatments, such as antibiotics or matrix-degrading enzymes, is likely location-specific. Homogenizing the sample precludes the study of diffusion-limited effects and differential vulnerability within the biofilm's architecture, potentially leading to an over- or under-estimation of a treatment's efficacy [34].
The following diagram conceptualizes how homogenization leads to a loss of critical mechanical information.
Figure 2: The information loss resulting from biofilm homogenization. The process destroys the native heterogeneity, converting a structurally complex material into a homogeneous gel and obscuring critical mechanical gradients and localized properties.
Supporting Experimental Data and Protocols
Quantitative Comparisons from Literature
The following tables compile experimental data that underscores the consequences of different measurement approaches.
Table 2: Viscoelastic Property Ranges Measured by Different Techniques on Pseudomonas aeruginosa Biofilms
| Technique | Sample State | Elastic Modulus / G' | Viscosity | Adhesive Pressure | Reference |
|---|---|---|---|---|---|
| Bulk Rheometry | Homogenized / Bulk | ~10 - 1000 Pa | ~1 - 100 Pa·s | Not Measured | [34] |
| AFM (Microbead Force Spectroscopy) | Native, Early Biofilm | - | - | 34 ± 15 Pa (WT) | [16] |
| AFM (Microbead Force Spectroscopy) | Native, Mature Biofilm | Instantaneous Elasticity: Drastically reduced with maturation | Reduced with maturation | 19 ± 7 Pa (WT) | [16] |
| Particle-Tracking Microrheology | Native, Localized in Voids | - | - | Creep Compliance highly dependent on region | [3] |
Table 3: Impact of Genetic and Environmental Modifications on Mechanics in Native State (via AFM)
| Biofilm Strain / Condition | Genetic/Environmental Change | Measured Mechanical Outcome (via AFM) |
|---|---|---|
| P. aeruginosa wapR mutant (LPS defect) | Truncated LPS core oligosaccharide | Adhesive pressure significantly higher than wild-type (332 ± 47 Pa vs 34 ± 15 Pa in early biofilm) [16] |
| Biofilm with CaCl₂ supplementation | Addition of divalent cations (10 mM Ca²⁺) | Cohesive energy increased from ~0.10 nJ/μm³ to ~1.98 nJ/μm³ [12] |
| Mature vs. Early Wild-Type Biofilm | Biofilm maturation | Prominent changes in adhesion and viscoelasticity; adhesive pressure decreases, elastic moduli reduce [16] |
Detailed Experimental Protocols
To ensure reproducibility and clarity in comparing these techniques, we outline standard protocols for both homogenization-dependent rheology and native-state AFM.
Protocol 1: Rotational Rheometry of Homogenized Biofilms
- Objective: To determine the bulk-average viscoelastic properties (G', G'') of a biofilm.
- Materials:
- Rheometer: Strain- or stress-controlled rheometer with parallel plate geometry (e.g., 20-40 mm diameter) [65].
- Growth Substrate: Biofilms grown on suitable surfaces (e.g., polycarbonate coupons, petri dishes).
- Homogenization Tools: Sterile cell scrapers or spatulas.
- Temperature Control Unit: To maintain physiological temperature (e.g., 37°C).
- Procedure:
- Biofilm Cultivation: Grow biofilms to the desired maturity under controlled conditions.
- Homogenization: Carefully scrape the biofilm biomass from the substrate surface using a sterile tool. Transfer the accumulated biomass into a microcentrifuge tube. For a more uniform paste, the biomass can be gently mixed or centrifuged into a pellet.
- Loading: Deposit the homogenized biofilm sample onto the lower plate of the rheometer. Bring the upper plate down to the desired measuring gap (e.g., 0.5 - 1.0 mm), carefully trimming excess material extruding from the plate edges.
- Equilibration: Allow the sample to equilibrate thermally for 5-10 minutes. Apply a small normal force to ensure good adhesion and prevent slip, but avoid excessive compression.
- Oscillatory Testing:
- Perform an amplitude sweep (e.g., 0.01% - 100% strain) at a fixed frequency (e.g., 1 Hz) to identify the linear viscoelastic region (LVR).
- Perform a frequency sweep (e.g., 0.1 - 100 rad/s) within the LVR to measure the evolution of G' (storage modulus) and G'' (loss modulus) with deformation rate.
- Data Analysis: Report the values of G' and G'' from the frequency sweep. A higher G' than G'' indicates solid-like (elastic) dominance, typical of structured biofilms [65] [34].
Protocol 2: AFM Microbead Force Spectroscopy on Native Biofilms
- Objective: To quantitatively measure the local adhesive and viscoelastic properties of an intact biofilm at the microscale.
- Materials:
- AFM System: Atomic force microscope with a closed-loop scanner and fluid cell for in situ measurements [16].
- Cantilevers: Tipless cantilevers with well-characterized spring constants (e.g., 0.01 - 0.08 N/m).
- Microbead Probes: 50 μm diameter glass beads, attached to the tipless cantilever using a suitable epoxy.
- Growth Substrate: Biofilms grown directly on glass-bottom Petri dishes or other AFM-compatible substrates.
- Procedure:
- Probe Functionalization: Coat the glass microbead with a confluent layer of the biofilm cells of interest by incubating it in a concentrated cell suspension (OD₆₀₀ ~2.0) [16].
- Calibration: Calibrate the cantilever's spring constant using the thermal tuning method [16].
- Mounting: Mount the biofilm-coated probe on the AFM. Place the substrate with the intact, hydrated biofilm on the scanner stage and immerse in the appropriate liquid medium.
- Force Measurement:
- Approach the biofilm-coated probe to the clean glass substrate (or another relevant surface) at a defined speed.
- Upon contact, apply a controlled loading force for a set "dwell time".
- Retract the probe at a defined speed to obtain a force-distance curve.
- Standardization: To enable cross-comparison, standardize key parameters: loading pressure, retraction speed, and contact time [16].
- Data Analysis:
- Adhesion: Calculate the adhesive pressure from the maximum pull-off force in the retraction curve divided by the contact area of the bead.
- Viscoelasticity: Fit the indentation-depth-vs-time data during the hold period to a viscoelastic model (e.g., Voigt Standard Linear Solid model) to extract parameters like the instantaneous elastic modulus (E₀), delayed elastic modulus (E₁), and viscosity (η) [16].
The Scientist's Toolkit: Essential Research Reagents and Materials
Table 4: Key Research Reagent Solutions for Biofilm Viscoelasticity Studies
| Item | Function in Research | Application Context |
|---|---|---|
| Tipless AFM Cantilevers | Base for attaching microbeads or cells for force spectroscopy; enables defined contact geometry [16]. | AFM-based adhesion and nanoindentation. |
| Functionalized Microbeads (e.g., 50μm glass) | Provide a quantifiable contact area for force measurements; can be coated with cells or chemicals [16]. | Standardized microbead force spectroscopy (MBFS). |
| Parallel Plate Rheometer Geometry | Applies controlled shear stress/strain to fluid or soft solid samples for bulk property measurement [65]. | Bulk rheology of homogenized biofilm pastes. |
| Quartz Crystal Microbalance with Dissipation (QCM-D) | Sensitively measures mass adsorption (frequency shift, Δf) and viscoelasticity (dissipation shift, ΔD) of adsorbed layers in real-time [63]. | Label-free, in-situ monitoring of early biofilm attachment and growth. |
| Confocal Laser Scanning Microscope (CLSM) | Resolves 3D structure of biofilms; can be combined with particle-tracking for microrheology [3]. | Correlating local mechanical properties (via embedded tracer beads) with biofilm architecture. |
| Poly(HEMA) & Collagen I Substrates | Tunable polymeric and biologically relevant surfaces for studying cell-substrate mechanical interactions [66]. | Investigating impact of substrate stiffness/viscoelasticity on biofilm formation. |
The choice between rheology and AFM is not a matter of which instrument is superior, but which is appropriate for the specific research question. The decision matrix hinges on the required scale of analysis and the acceptability of sample disruption.
- Use Bulk Rheology When: The objective is to screen the bulk material response of biofilms, such as evaluating the overall effect of a chemical treatment (e.g., biocides, enzymes) on biofilm cohesion [34], or studying flow-induced deformation in industrial settings. It is ideal when the property of interest is an average representative of the entire biomass.
- Use AFM When: The research aims to understand local mechanics, heterogeneity, and structure-function relationships. This is crucial for studies on adhesion mechanisms [16], the role of specific matrix components (e.g., LPS, EPS) [16] [12], and region-specific susceptibility to treatments. AFM is indispensable when preserving the native biofilm architecture is essential for valid data interpretation.
In conclusion, the pitfall of sample homogenization in rheology is a significant source of error and oversimplification in biofilm mechanics. It masks the inherent spatial heterogeneity that is a defining characteristic of biofilms and is critical to their function and resistance. While rheology provides valuable bulk material parameters, AFM and related nanoscale techniques offer a window into the true, heterogeneous mechanical nature of biofilms. A comprehensive understanding of biofilm viscoelasticity, therefore, often necessitates an integrated approach that combines the bulk perspective of rheology with the localized, native-state insights provided by AFM. This dual-mode strategy, leveraging the strengths of each technique while acknowledging their respective pitfalls—especially the destructive nature of homogenization—will enable more accurate models and more effective anti-biofilm strategies.
In the field of biofilm viscoelasticity research, atomic force microscopy (AFM) and rheology have emerged as two predominant techniques for characterizing mechanical properties. While AFM provides nanoscale resolution of surface morphology and local mechanical properties, rheology offers bulk measurements of viscoelastic behavior under deformation. Despite their complementary strengths, the reproducibility of results across different laboratories and studies remains a significant challenge due to variations in calibration methods, experimental protocols, and data analysis techniques. The need for standardized protocols such as the Standardized Nanoindentation Protocol (SNAP) and others has become increasingly urgent as biofilm mechanics research transitions from fundamental characterization to applied clinical and industrial applications. This guide objectively compares the performance of AFM and rheology for biofilm viscoelasticity research, with particular emphasis on calibration methodologies and standardization approaches that enhance reproducibility across experimental setups.
Technical Comparison: AFM vs. Rheology for Biofilm Viscoelasticity
Fundamental Operating Principles and Measurement Capabilities
Atomic force microscopy (AFM) operates by scanning a sharp tip attached to a flexible cantilever across a sample surface, measuring forces at the nanoscale to generate topographical images and quantify mechanical properties through force-distance curves. In biofilm research, AFM enables visualization of biofilm morphology, quantification of surface roughness, and probing of mechanical interactions at the nanoscale [1]. The technique provides exceptional spatial resolution, capable of characterizing local variations in biofilm mechanical properties that might be averaged out in bulk measurements. Recent advances have leveraged AFM to measure Young's modulus of biological structures including organoids, with protocols combining force-curve analysis with optimized probes [67].
Rheology, in contrast, measures the bulk viscoelastic properties of biofilms by applying controlled stresses or strains and measuring the resulting deformation response. This approach provides insights into biofilm viscoelastic properties that aid in monitoring and predicting their behavior under diverse environmental conditions [1]. Rheological characterization captures emergent mechanical behaviors that arise from the complex, multi-component nature of the biofilm extracellular polymeric substance (EPS) matrix, including shear-thinning, yield stresses, and time-dependent recovery [68]. These bulk measurements are particularly relevant for understanding biofilm behavior in industrial and clinical contexts where response to fluid flow and mechanical challenges determines persistence and efficacy.
Comparative Performance Metrics for Biofilm Characterization
Table 1: Technical Capabilities of AFM and Rheology for Biofilm Viscoelasticity Research
| Performance Metric | Atomic Force Microscopy (AFM) | Rheology |
|---|---|---|
| Spatial Resolution | Nanoscale (sub-μm) | Macroscale (bulk sample) |
| Measurement Type | Localized mechanical properties | Bulk viscoelastic properties |
| Primary Parameters | Young's modulus, adhesion forces, surface topography | Storage/loss moduli (G', G"), complex viscosity, yield stress |
| Sample Requirements | Small areas, solidly immobilized | Larger volumes, structurally intact |
| Environmental Control | Limited liquid cell options | Comprehensive temperature, humidity, and atmosphere control |
| Throughput | Low to moderate | Moderate to high |
| Data Interpretation | Complex modeling required (Hertz, Sneddon) | Direct calculation from fundamental rheological relationships |
| Biofilm Disruption Risk | High (local penetration) | Low (non-destructive strains) |
Calibration Standards and Protocols: Current Landscape
AFM Calibration Methodologies and Reference Materials
The accuracy of AFM force measurements hinges on proper calibration of cantilever stiffness, a persistent challenge in the field. The National Institute of Standards and Technology (NIST) has developed prototype reference cantilever arrays with nominal spring constants ranging from 0.02 N/m to 0.2 N/m to address this need [69]. These arrays demonstrate remarkable uniformity with variations of less than 1% in resonance frequency, enabling SI-traceable stiffness calibration. Independent calibration using an electrostatic force balance confirmed actual spring constants ranging from 0.0260 ± 0.0005 N/m (±1.9%) to 0.2099 ± 0.0009 N/m (±0.43%), establishing these devices as excellent candidates for small force calibration standards [69].
The move toward standardized force reconstruction in dynamic AFM modes represents another critical advancement. As force interactions are not directly measured but mathematically reconstructed from observables like amplitude, phase, or frequency shift, inconsistent application of reconstruction techniques has limited reproducibility and cross-study comparison [70]. Recent efforts have introduced open-source software packages that unify all widely used methods, enabling side-by-side comparisons across different formulations and supporting benchmarking for more consistent and interpretable AFM force spectroscopy [70].
Rheological Calibration Approaches for Biofilm Measurements
Rheological characterization of biofaces requires careful calibration of both instrumentation and experimental protocols. Unlike homogeneous materials, biofilms present particular challenges due to their soft, hydrated nature and structural heterogeneity. The linear viscoelastic region (LVR) must be empirically determined for each biofilm type to ensure measurements capture fundamental material properties rather than structural breakdown [13]. Furthermore, environmental control during measurement is crucial as biofilm viscoelastic properties are highly dependent on hydration, temperature, and nutrient availability [68].
Geometries for biofilm rheology must be selected to minimize slip and sample damage. Parallel plate geometries with roughened surfaces are commonly employed to overcome slip artifacts, while tribological measurements can provide insights into biofilm-surface interactions relevant to cleaning applications [13]. The development of biofilm imitations using hydrocolloidal materials like alginate and gellan has facilitated method validation and optimization without the variability inherent in cultivated biofilms [13]. These imitations demonstrate similar viscoelastic and tribological behavior to native biofilms, enabling standardized testing of cleaning protocols and mechanical characterization methods.
Implementing SNAP for AFM Nanoindentation of Biofilms
Core Principles of the Standardized Nanoindentation Protocol
The Standardized Nanoindentation Protocol (SNAP) establishes a consistent framework for conducting and analyzing AFM indentation experiments on soft biological materials. For biofilm applications, SNAP provides guidelines for probe selection, approach rate, maximum indentation force, and data analysis methods to enable reproducible measurements across different laboratories and instrumentation. Implementation begins with cantilever selection and calibration using reference materials, followed by validation on control samples with known mechanical properties [69].
A critical aspect of SNAP for biofilms is determining appropriate indentation depths that balance sufficient signal-to-noise with minimal structural damage. For most biofilm systems, indentation depths between 100-500 nm provide reliable measurements while remaining within the linear elastic response regime. The protocol also standardizes environmental conditions including fluid composition, temperature, and equilibration time to minimize confounding variables [67].
Experimental Workflow for SNAP-Compliant AFM Biofilm Characterization
Key Research Reagent Solutions for AFM Biofilm Characterization
Table 2: Essential Research Reagents and Materials for AFM Biofilm Studies
| Reagent/Material | Function | Application Notes |
|---|---|---|
| Reference Cantilever Arrays | Spring constant calibration | NIST-traceable, nominal values 0.02-0.2 N/m [69] |
| OCT Embedding Matrix | Tissue/organoid immobilization | Preserves structural integrity during slicing [67] |
| Functionalized AFM Probes | Specific adhesion measurements | Tips modified with ligands, antibodies, or chemical groups |
| Standard Polystyrene | Young's modulus reference | Validation of mechanical property measurements |
| Biofilm Imitation Materials | Method development | Alginate/gellan-based systems mimicking biofilm mechanics [13] |
| Fluidic Cell Systems | Hydration maintenance | Controlled liquid environment during measurement |
Standardization Protocols for Biofilm Rheology
Established Rheological Protocols for Viscoelastic Characterization
Standardized rheological protocols for biofilms must account for their time-evolving nature and sensitivity to environmental conditions. A hierarchical approach begins with amplitude sweep tests to determine the linear viscoelastic region (LVR), followed by frequency sweeps within this region to characterize time-dependent behavior, and finally transient tests such as creep-recovery or stress relaxation to probe specific viscoelastic responses [68]. For comparative studies, critical parameters including strain amplitude, frequency range, temperature, and hydration must be rigorously controlled and reported.
Recent interlaboratory studies have highlighted the importance of sample preparation methodology in achieving reproducible rheological measurements. Biofilms grown under standardized conditions with defined nutrient composition, surface characteristics, and incubation periods demonstrate significantly improved cross-study comparability [13]. Furthermore, the development of biofilm imitations using hydrocolloidal systems such as alginate or gellan provides reference materials for method validation, with alginate-based systems showing particular promise in tribological measurements [13].
Comparative Analysis Framework for AFM and Rheology Data
Emerging Technologies and Future Directions
AI-Driven Automation and Standardization
Artificial intelligence approaches are increasingly being deployed to address reproducibility challenges in biofilm mechanics characterization. The Artificially Intelligent Lab Assistant (AILA) framework represents a significant advancement, employing LLM-powered agents to automate AFM operations through standardized workflows [71]. This system coordinates specialized agents for experimental control (AFM Handler Agent) and data analysis (Data Handler Agent), potentially reducing human-introduced variability. Evaluation through the AFMBench suite, comprising 100 expert-curated experimental tasks, demonstrates that multi-agent frameworks significantly outperform single-agent approaches, though both remain sensitive to minor changes in instruction formatting or prompting [71].
Similar AI-driven approaches are being developed for rheological characterization, though standardized benchmarking analogous to AFMBench remains less established. The potential for these systems to implement complex calibration protocols consistently and document all methodological parameters exhaustively addresses key reproducibility challenges in biofilm viscoelasticity research. However, concerns regarding "sleepwalking" - where AI agents deviate from instructions - highlight the continued need for human oversight and validation [71].
Integrated Multi-Technique Standardization Frameworks
The future of reproducible biofilm mechanics research lies in integrated frameworks that combine multiple characterization techniques with standardized protocols. Such frameworks would enable comprehensive characterization across length scales, with AFM capturing nanoscale heterogeneity and rheology providing bulk mechanical response. Cross-validation between techniques is essential, as demonstrated by studies showing that purely elastic biofilm models underestimate growth rates and migration behaviors compared to viscoelastic representations with the same elastic modulus [72].
Community-wide standardization initiatives are increasingly important as biofilm research addresses more complex questions involving multiple species, environmental gradients, and dynamic conditions. The development of shared reference materials, standardized data formats, and open-source analysis tools will enhance comparability across studies and accelerate progress in understanding biofilm mechanics. Particularly valuable are biofilm imitation materials that can be distributed across laboratories to validate methods and facilitate direct comparison of results [13].
The comparison between AFM and rheology for biofilm viscoelasticity characterization reveals complementary strengths that, when integrated through standardized protocols, provide a more complete understanding of biofilm mechanical behavior. AFM offers unparalleled spatial resolution and nanomechanical sensitivity but requires extensive calibration and careful interpretation. Rheology provides robust bulk property measurements directly relevant to industrial and clinical applications but may overlook important local heterogeneities. Implementation of SNAP for AFM and parallel standardization efforts in rheology are critical for enhancing reproducibility across laboratories and studies. As AI-driven automation advances and community-wide standardization initiatives mature, the field moves toward increasingly predictive understanding of biofilm mechanics that can be reliably applied across diverse fields from medical device design to industrial process optimization.
The accurate quantification of biofilm viscoelasticity is paramount for advancing research in microbial pathogenesis, antibiotic efficacy, and industrial fouling control. Atomic force microscopy (AFM) has emerged as a powerful tool for characterizing these mechanical properties at the micro- and nanoscale, bridging a critical gap between traditional bulk rheology and cellular-level investigations. However, the transformation of raw force-indentation data into reliable mechanical parameters hinges entirely on the selection of an appropriate contact mechanics model. An improper choice can systematically bias results, leading to inaccurate conclusions about biofilm behavior and flawed comparisons with bulk rheological data.
This guide provides a comprehensive, experimental data-driven comparison of prevalent contact models—from the foundational Hertz model to more complex frameworks like the Standard Linear Solid (SLS) and adhesive models. We objectively evaluate their performance, limitations, and applicability for probing biofilm viscoelasticity, providing researchers with a practical framework for model selection within the broader context of correlative AFM-rheology studies.
Theoretical Foundations of Contact Mechanics Models
The mechanical interaction between an AFM tip and a sample is described by contact mechanics models, which mathematically relate the applied force to the resulting indentation and contact area. The choice of model depends critically on the material's properties and the experimental conditions.
The Hertz Model: The Elastic Foundation
The Hertz model is the most widely used contact model for AFM nanoindentation. It describes the non-adhesive contact between a rigid, spherical indenter and a perfectly linear elastic, isotropic half-space. The fundamental Hertz equation for a parabolic indenter is given by: [ F = \frac{4}{3} \frac{E}{1-\nu^2} \sqrt{R} \delta^{3/2} ] where ( F ) is the applied force, ( E ) is the Young's modulus, ( \nu ) is Poisson's ratio, ( R ) is the tip radius, and ( \delta ) is the indentation depth [73]. The model assumes small deformations, no surface adhesion, and purely elastic behavior. While its simplicity is attractive, its fundamental limitation for biofilms is its inability to account for time-dependent viscoelastic effects, such as creep or stress relaxation, which are hallmark features of these hydrated biological assemblies [1] [7].
The Standard Linear Solid (SLS) Model: Incorporating Viscoelasticity
The SLS model is a three-element mechanical model that combines a spring (representing instantaneous elasticity) in series with a spring and dashpot in parallel (representing a delayed elastic response). This configuration captures fundamental viscoelastic phenomena, making it highly relevant for biofilms. In AFM, the SLS framework can be applied to analyze both creep compliance and stress relaxation data.
- Creep Compliance: In a creep test, a constant stress ( \sigma0 ) is applied, and the time-dependent strain ( \epsilon(t) ) is measured. For the SLS model, the compliance ( J(t) = \epsilon(t)/\sigma0 ) is: [ J(t) = Jg + Jd \left(1 - e^{-t/\tau}\right) ] where ( Jg ) is the glassy (instantaneous) compliance, ( Jd ) is the delayed compliance, and ( \tau ) is the characteristic retardation time [7].
- Stress Relaxation: In a stress relaxation test, a constant strain ( \epsilon0 ) is applied, and the decaying stress ( \sigma(t) ) is measured. The relaxation modulus ( G(t) = \sigma(t)/\epsilon0 ) for the SLS model is: [ G(t) = Ge + (Gg - Ge) e^{-t/\tau\sigma} ] where ( Gg ) is the glassy modulus, ( Ge ) is the equilibrium modulus, and ( \tau_\sigma ) is the relaxation time [7].
Extended Models: Accounting for Adhesion and Power-Law Behavior
Biofilms often exhibit significant adhesion and more complex rheological behaviors that necessitate advanced models.
- Adhesive Models (JKR and DMT): These extend Hertzian mechanics to account for adhesive forces between the tip and sample. The Johnson-Kendall-Roberts (JKR) model is suitable for large, soft tips with strong adhesion, while the Derjaguin-Muller-Toporov (DMT) model applies to small, rigid tips with weak adhesion [74]. The transition between these regimes is governed by the Tabor parameter.
- Power-Law Rheology: Many biological materials, including cells and biofilms, exhibit a frequency-dependent complex modulus that follows a power-law relationship ( G^*(ω) = G0 (f/f0)^α ) over a wide frequency range, where ( α ) is the power-law exponent characterizing the fluidity of the material [7]. This model is often more adept at describing the soft glassy nature of biofilms than simple parameter-based models like SLS.
Quantitative Model Comparison: Performance and Limitations
A critical evaluation of contact models based on experimental data reveals their distinct advantages and systematic errors, particularly for soft, hydrated materials like biofilms.
Table 1: Key Contact Mechanics Models for AFM Biofilm Characterization
| Model | Theoretical Basis | Key Parameters Extracted | Primary Assumptions & Limitations | Best-Suited For |
|---|---|---|---|---|
| Hertz | Non-adhesive, elastic contact | Young's Modulus (E) | No adhesion, no viscoelasticity, small strains; systematically underestimates modulus in soft materials due to overestimated contact area [73]. | Purely elastic, non-adhesive materials; initial stiffness estimation. |
| Standard Linear Solid (SLS) | Spring-dashpot representation | Instantaneous (E₁) and delayed (E₂) moduli, relaxation time (τ) | Assumes discrete, exponential relaxation; may not capture broad distribution of relaxation times in complex biofilms [7]. | Materials with a single dominant relaxation process. |
| Power-Law | Structural damping model | Modulus scaling factor (G₀), Power-law exponent (α) | No characteristic relaxation time; can be difficult to relate to specific molecular structures. | Soft glassy materials & biofilms exhibiting a continuous spectrum of relaxation times [7]. |
| JKR | Adhesive contact (soft, large tip) | Work of adhesion (γ), Reduced modulus (K) | Large tip radius, strong adhesion, low stiffness (Tabor parameter μ > 5) [74]. | Highly adhesive, soft biofilms. |
| DMT | Adhesive contact (rigid, small tip) | Work of adhesion (γ), Reduced modulus (K) | Small tip radius, weak adhesion, high stiffness (Tabor parameter μ < 0.1) [74]. | Stiffer biofilms with weaker adhesion. |
Table 2: Experimental Data Showcasing Model-Dependent Outcomes
| Study Material | Hertz Model (Young's Modulus) | Power-Law / SLS Analysis | Key Finding & Implication |
|---|---|---|---|
| Polyvinyl Chloride (PVC) [73] | Underestimated due to inflated contact radius (error up to 57.9% with 2µm tip) | N/A | Finding: Finite element analysis proved the Hertz model overestimates the contact radius, directly leading to a lower calculated modulus. Implication: Hertz-based modulus values for soft materials, particularly at large indentations, are systematically biased and unreliable. |
| Retinal Pigmented Epithelium Cells [7] | Young's Modulus (E) from initial indentation | Strong correlation found between E and all parameters from power-law creep (E₀, β) and stress relaxation (T₀, γ). | Finding: Parameters from different rheological tests (creep, stress relaxation, oscillations) are highly correlated. Implication: The Young's modulus from Hertz is a useful initial guide but is part of a broader, interconnected viscoelastic profile best described by power-law or SLS models. |
| Micron Particles Adhesion [74] | N/A | Adhesion force calculated via JKR and DMT models (e.g., F = 0.2-2.5 x 10⁻⁷ N for R=1µm). | Finding: Adhesion forces are significant at micro-scale and model choice (JKR vs. DMT) depends on system properties. Implication: Ignoring adhesion in biofilm mechanics, as the Hertz model does, can lead to a fundamentally incorrect physical picture. |
Experimental Protocols for Robust Viscoelastic Characterization
The reliability of model fitting is contingent on rigorous experimental design and execution. Below are detailed protocols for key AFM-based microrheology measurements.
AFM Force Curve Acquisition and Basic Hertzian Fitting
This protocol outlines the standard method for collecting force-distance curves and extracting an apparent Young's modulus using the Hertz model.
- Probe Calibration: Calibrate the AFM cantilever's spring constant using the thermal tune method in fluid [7] [75]. Determine the optical lever sensitivity by engaging on a rigid, non-deformable surface (e.g., clean glass or silicon).
- Tip Characterization: Image the tip using scanning electron microscopy (SEM) or a characterisation grid to determine the exact tip radius (R). For spherical tips, use a colloid probe of known diameter [75].
- Sample Preparation: Grow biofilms on suitable substrates (e.g., glass, stainless steel coupons) relevant to the research context (medical, food industry) [76] [41]. Perform measurements in appropriate nutrient medium or buffer to maintain biofilm viability.
- Data Acquisition: Approach the biofilm surface at a controlled velocity (e.g., 1-2 µm/s) and acquire force-distance curves. Collect a statistically significant number of curves (n ≥ 25) from different locations to account for biofilm heterogeneity [73].
- Data Fitting:
- Use AFM manufacturer's software or custom scripts (e.g., in Igor Pro, MATLAB) to convert deflection vs. piezo displacement data into force vs. indentation curves.
- Identify the contact point and fit the extended portion of the approach curve with the Hertz model to extract the apparent Young's Modulus (E), assuming a typical Poisson's ratio (ν) of 0.5 for incompressible, hydrated biofilms [73].
Oscillatory Microrheology for Frequency-Dependent Properties
This protocol measures the complex shear modulus ( G^*(ω) = G'(ω) + iG''(ω) ) over a frequency range, providing a more complete viscoelastic profile.
- System Calibration:
- Piezoactuator Phase Lag: Record the deflection of a stiff cantilever in contact with a rigid substrate while oscillating the piezo. Calculate the phase shift Φ(ω) between the piezo drive and deflection signals across the frequency spectrum. This system-intrinsic lag must be subtracted from subsequent measurements [75].
- Cantilever Drag Coefficient: Immerse the cantilever in the measurement fluid. Record its deflection while oscillating at different frequencies and at varying distances from a substrate. Fit the data to determine the hydrodynamic drag coefficient b(0) at zero distance, which is used to correct for fluid inertia [75].
- Measurement: Engage the calibrated cantilever on the biofilm surface with a predefined setpoint force. Superimpose a multi-frequency sinusoidal oscillation (e.g., 1-500 Hz) on the piezo with a small amplitude (e.g., 5-10 nm) to remain in the linear viscoelastic regime.
- Data Analysis:
- For each frequency, extract the amplitude and phase of both the piezo drive signal and the cantilever deflection signal.
- Calculate the force ( F(ω) ) and indentation ( δ(ω) ) signals in the frequency domain.
- Apply the corrected formula for a spherical indenter to compute the complex shear modulus [75]: [ G^(ω) = \frac{F(ω)}{δ(ω)} \cdot \frac{2(1+ν)}{\sqrt{R δ_0}} - iωb(0) ]
- Extract the elastic (storage) modulus ( G'(ω) ) and the viscous (loss) modulus ( G''(ω) ) from the real and imaginary parts of ( G^(ω) ), respectively. These data can be fitted with a power-law or SLS model.
Creep Compliance and Stress Relaxation Tests
These time-domain tests are directly suited for fitting SLS and power-law models.
- Creep Compliance Test:
- Approach the biofilm and apply a rapid step force. Maintain this force constant and record the increasing indentation depth over time (typically several seconds) [7].
- Fit the resulting creep curve ( J(t) = δ(t)/F0 ) with the SLS compliance function ( J(t) = Jg + J_d (1 - e^{-t/τ}) ) or a power-law function ( J(t) = A t^β ) [7].
- Stress Relaxation Test:
- Approach the biofilm and rapidly indent to a predefined depth. Maintain this constant strain and record the decaying force required to hold it over time [7].
- Fit the resulting stress relaxation curve ( G(t) = F(t)/δ0 ) with the SLS relaxation function ( G(t) = Ge + (Gg - Ge) e^{-t/τ_σ} ).
The following workflow diagram illustrates the decision-making process for selecting an appropriate contact model based on the material's behavior and experimental data.
The Scientist's Toolkit: Essential Reagents and Materials
Successful AFM-based viscoelasticity studies of biofilms require specific materials and reagents, each serving a critical function in the experimental pipeline.
Table 3: Essential Research Reagents and Materials for AFM Biofilm Mechanics
| Item Name | Function / Application | Key Considerations |
|---|---|---|
| Colloidal Probe Cantilevers | Spherical tips (e.g., 1-20µm diameter) for well-defined contact geometry; essential for applying Hertz, SLS, and adhesive models. | Tip radius must be precisely known for accurate modulus calculation. Larger spheres reduce pressure and are better for soft biofilms [73]. |
| Sterile Stainless Steel Coupons | A standard, non-reactive surrogate surface for growing biofilms for medical device-related studies [76]. | Provides a reproducible and clinically relevant substrate for biofilm formation. |
| Polyacrylamide (PAAm) Hydrogels | Calibration standards with tunable, known elastic moduli for validating AFM system performance and analysis protocols [75]. | Allow researchers to verify the accuracy of their entire measurement chain from acquisition to model fitting. |
| Drip Flow Reactor (DFR) / CDC Biofilm Reactor (CDC-BR) | Standardized equipment for growing reproducible, high-density biofilms under controlled hydrodynamic conditions [76]. | Critical for generating biofilms with consistent architecture and mechanical properties for comparative studies. |
| Culture Media for Biofilm Growth | (e.g., for P. aeruginosa, V. cholerae) to cultivate mature, matrix-producing biofilms for mechanical testing. | Matrix composition directly governs viscoelasticity; defined media help ensure reproducibility [77] [41]. |
The integration of AFM with bulk rheology presents a powerful multi-scale approach to deciphering the mechanical nature of biofilms. However, as this guide demonstrates, the validity of the resulting data is inextricably linked to the choice of contact mechanics model. The Hertz model, while simple, provides only an initial, often inaccurate, elastic estimate for complex viscoelastic and adhesive biofilms. For a more physiologically relevant understanding, researchers should prioritize viscoelastic models like the SLS for discrete relaxation or the power-law model for the broad relaxation spectra characteristic of soft glassy materials. Furthermore, adhesive interactions, quantified by JKR or DMT models, must be evaluated and incorporated where significant. By applying this structured, model-aware methodology, researchers can generate robust, quantitative mechanical data, enabling stronger correlations across techniques and ultimately accelerating the development of effective anti-biofilm strategies.
AFM versus Rheology: A Head-to-Head Comparison for Data Validation and Integration
For researchers studying biofilm viscoelasticity, selecting the appropriate analytical technique is critical for generating meaningful data. The choice often centers on a fundamental trade-off: the nanoscale spatial resolution of Atomic Force Microscopy (AFM) versus the bulk averaging capabilities of rheology. Biofilms are inherently heterogeneous structures, with mechanical properties that can vary dramatically over micrometer scales and throughout their development stages. This guide provides an objective, data-driven comparison of AFM and rheology, detailing their performance, experimental protocols, and ideal applications to inform method selection for biofilm research and drug development.
Technical Comparison: AFM vs. Rheology
The following table summarizes the core performance characteristics and output parameters of AFM and rheology for biofilm viscoelasticity analysis.
Table 1: Core performance characteristics of AFM and rheology
| Feature | Atomic Force Microscopy (AFM) | Rheology |
|---|---|---|
| Spatial Resolution | Nanoscale to Micron Scale (force mapping on specific cells or matrix regions) [16] [78] | Bulk/Macroscale (provides an average for the entire sample) [3] [79] |
| Principal Outputs | Adhesive pressure (Pa); Instantaneous/Delayed elastic moduli (Pa); Apparent viscosity (Pa·s) [16] | Shear storage/loss moduli (G', G'' in Pa); Complex viscosity (mPa·s); Creep compliance [3] [79] |
| Measurement Type | Localized, surface-oriented properties (nanoindentation) [16] | Volume-averaged, bulk material properties [3] |
| Sample Environment | In situ; Native liquid conditions [16] | Ex situ; Typically requires sample extraction/loading [3] |
| Key Advantage | Quantifies region-specific property differences (e.g., mutant vs. wild-type strains) [16] | Characterizes the overall mechanical response, relevant for predicting bulk flow and deformation [80] [79] |
Experimental Protocols and Data Outputs
Atomic Force Microscopy (AFM) for Nanoscale Mapping
AFM-based techniques, such as force spectroscopy, enable direct quantification of adhesive and viscoelastic properties of biofilms under native conditions with high spatial resolution [16].
Typical Protocol (Microbead Force Spectroscopy - MBFS):
- Probe Functionalization: A tipless AFM cantilever is modified with a 50 µm diameter glass bead, which is then coated with the bacterial biofilm of interest [16].
- Force Measurement: The biofilm-coated bead is brought into controlled contact with a clean glass surface in a liquid environment. The instrument records force versus distance data during approach, contact, and retraction cycles [16].
- Data Analysis:
- Adhesion: Calculated as adhesive pressure (Pa) from the force required to separate the bead from the surface during retraction [16].
- Viscoelasticity: Determined by fitting the indentation-versus-time data during the hold period to a viscoelastic model (e.g., Voigt Standard Linear Solid model) to extract elastic moduli and viscosity [16].
Exemplary Quantitative Data: AFM can detect significant differences in mechanical properties between bacterial strains and at different growth stages, as shown in the table below.
Table 2: AFM-measured adhesive and viscoelastic properties of P. aeruginosa biofilms
| Biofilm Sample | Adhesive Pressure (Pa) | Instantaneous Elastic Modulus (Pa) | Delayed Elastic Modulus (Pa) | Apparent Viscosity (Pa·s) |
|---|---|---|---|---|
| PAO1 (Early) | 34 ± 15 | Data from model fitting [16] | Data from model fitting [16] | Data from model fitting [16] |
| PAO1 (Mature) | 19 ± 7 | Drastically reduced by mutation/maturation [16] | Drastically reduced by mutation/maturation [16] | Decreased for biofilm maturation [16] |
| wapR Mutant (Early) | 332 ± 47 | Drastically reduced by mutation/maturation [16] | Drastically reduced by mutation/maturation [16] | Decreased for biofilm maturation [16] |
| wapR Mutant (Mature) | 80 ± 22 | Drastically reduced by mutation/maturation [16] | Drastically reduced by mutation/maturation [16] | Decreased for biofilm maturation [16] |
Rheology for Bulk Material Characterization
Rheology measures the mechanical response of an entire biofilm sample, providing averaged values for key viscoelastic parameters.
Typical Protocol (Interfacial Rheology):
- Sample Preparation: Biofilms are grown directly on a substrate or extracted and loaded onto the rheometer measuring geometry (e.g., a cone-plate or biconical disk) [79].
- Oscillatory Testing: A small, oscillatory shear strain or stress is applied to the sample over a range of frequencies. The material's response is measured to determine its elastic and viscous components without causing structural failure [79].
- Data Analysis:
- Storage Modulus (G'): Quantifies the elastic, solid-like behavior of the biofilm.
- Loss Modulus (G''): Quantifies the viscous, liquid-like behavior.
- Complex Viscosity (η*): Represents the total resistance to flow [79].
Exemplary Quantitative Data: Rheology tracks the evolution of biofilm mechanical strength during growth, as demonstrated in the table below.
Table 3: Rheological parameters of E. coli biofilms during growth phases
| Growth Phase | Complex Viscosity (mPa·s) | Complex Modulus (kPa) | Storage Modulus, G' (Pa·m) | Loss Modulus, G'' (Pa·m) |
|---|---|---|---|---|
| Phase I: Initial Growth | Increasing | Increasing | Increasing | Increasing |
| Phase II: Maturation | ~5.38 | ~169.13 | ~0.057 | ~0.016 |
| Phase III: Dispersion | Decreasing | Decreasing | Decreasing | Decreasing |
Decision Workflow and Technical Implementation
The choice between AFM and rheology depends on the specific research question, as visualized in the following workflow.
The Scientist's Toolkit: Essential Research Reagents and Materials
Successful experimentation requires specific tools and materials. The following table lists key items for both AFM and rheology studies of biofilms.
Table 4: Essential research reagents and materials for biofilm viscoelasticity studies
| Item | Function | Example in Context |
|---|---|---|
| Tipless AFM Cantilevers | Base for functionalizing with microbeads or specific coatings for force spectroscopy [16]. | CSC12/Tipless/No Al Type E cantilevers [16]. |
| Microbeads (e.g., Glass) | Attached to cantilevers to create a defined contact geometry for quantifiable adhesion measurements [16]. | 50 µm diameter glass beads for Microbead Force Spectroscopy (MBFS) [16]. |
| Fluorescent Microspheres | Tracer particles embedded in biofilms for particle-tracking microrheology [3]. | 1 µm green fluorescent carboxylate beads for confocal microscopy-based tracking [3]. |
| Rheometer with Interfacial Geometry | Applies controlled shear deformation to measure bulk viscoelastic moduli of biofilm material [79]. | MCR 302 rheometer with a biconical disk geometry for air-liquid interface studies [79]. |
| QCM-D Sensor Crystals | Enables real-time, label-free monitoring of biofilm attachment and softness via frequency/dissipation shifts [79]. | AT-cut piezoelectric gold-quartz sensors (e.g., openQCM Q-1) [79]. |
AFM and rheology are not mutually exclusive but are complementary techniques. AFM excels in uncovering local mechanical heterogeneity at the nanoscale, providing crucial insights into structure-function relationships at the cellular level. In contrast, rheology is unparalleled for characterizing the overall mechanical integrity of a biofilm, yielding parameters essential for predicting bulk behavior in industrial or clinical settings. The optimal choice is dictated by the specific research question: AFM for "where" and "how" properties vary locally, and rheology for the collective "what" of the biofilm's mechanical strength. A combined approach, leveraging the strengths of both techniques, offers the most comprehensive understanding of biofilm viscoelasticity.
Characterizing the mechanical properties of biofilms is crucial for addressing biofilm-related challenges in medical, industrial, and environmental contexts. The viscoelastic nature of biofilms, which exhibit both solid-like and fluid-like behaviors, dictates their structural integrity, stress resistance, and dispersal mechanisms. This review objectively compares two principal techniques for assessing biofilm mechanics: atomic force microscopy (AFM) and rheology. We dissect their respective capabilities in measuring elastic and viscoelastic moduli across different length scales, supported by quantitative experimental data. Furthermore, we provide detailed methodologies for key experiments and outline essential research reagents, aiming to equip researchers and drug development professionals with the knowledge to select appropriate tools for bridging local nanoscale measurements with macroscopic material properties.
Biofilms are structured microbial communities encased in a self-produced extracellular polymeric substance (EPS) matrix. This matrix, which can constitute 50–90% of the biofilm's dry mass, is primarily responsible for its mechanical properties [18]. Biofilms display complex viscoelastic behavior, meaning they resist deformation like an elastic solid over short timescales but flow like a viscous fluid over longer periods [81]. Accurately measuring their mechanical properties—such as elastic modulus (stiffness) and complex shear modulus (viscoelasticity)—is essential for understanding biofilm detachment, controlling harmful biofilms, and optimizing beneficial ones [34].
A significant challenge in the field is the inherent heterogeneity of biofilms, which leads to substantial intra-sample and sample-to-sample variability. Compounding this, different measurement techniques often yield modulus values that can differ by several orders of magnitude for the same bacterial strain [34]. This discrepancy largely stems from the scale-dependency of the measurements; techniques like AFM probe local, nanoscale properties, while bulk rheology measures the averaged response of the entire biofilm. This guide directly compares AFM and rheology to help researchers interpret and bridge these disparate measurements.
Technique Comparison: AFM vs. Rheology
The following table summarizes the core characteristics of AFM and rheology for biofilm mechanics research.
Table 1: Core characteristics of AFM and Rheology for biofilm mechanics research
| Feature | Atomic Force Microscopy (AFM) | Bulk Rheology |
|---|---|---|
| Primary Measured Moduli | Young's Modulus (Elastic), Adhesion Force | Shear Modulus (G', G''), Complex Modulus (G*) |
| Measurement Scale | Local/Nanoscale (nm - µm) | Macroscopic/Bulk (mm) |
| Spatial Resolution | High (capable of single-cell or sub-cellular) | Low (bulk average of entire sample) |
| Typical Reported Values | 0.1 - 100 kPa (Young's Modulus) [16] | 10 - 1000 Pa (Shear Modulus) [82] [34] |
| Key Advantage | High-resolution mapping of heterogeneity | Standardized, replicates bulk mechanical stresses |
| Principal Limitation | Small scan area; potential surface damage | Does not capture local internal heterogeneity |
Quantitative Data Comparison
Experimental data from the literature highlight the scale-dependent differences in measured moduli.
Table 2: Representative mechanical properties measured by different techniques
| Biofilm Species | Technique | Measured Modulus | Reported Value | Source |
|---|---|---|---|---|
| Pseudomonas aeruginosa (PAO1) | AFM (Microbead Force Spectroscopy) | Instantaneous Elastic Modulus | 760 ± 150 Pa | [16] |
| Pseudomonas aeruginosa (PAO1) | AFM (Microbead Force Spectroscopy) | Apparent Viscosity | 28 ± 6 Pa·s | [16] |
| P. fluorescens | Particle-Tracking Microrheology | Creep Compliance (at 10s, Void Zones) | ~10⁻¹ Pa⁻¹ | [3] |
| Mixed-species biofilm | Optical Coherence Tomography (OCT) with FSI modeling | Young's Modulus | 70 - 700 Pa | [82] |
| Biofilms (General) | Bulk Rheology | Shear Modulus (G') | 1 - 10,000 Pa | [34] |
Experimental Protocols for Key Techniques
Atomic Force Microscopy (AFM) with Microbead Force Spectroscopy
Microbead Force Spectroscopy (MBFS) is a specialized AFM technique that allows for quantitative measurement of adhesion and viscoelasticity over a defined contact area [16] [30].
Detailed Protocol:
- Probe Preparation: A tipless silicon cantilever is functionalized with a 50-µm diameter glass microbead using a suitable epoxy. The cantilever's spring constant is accurately calibrated using the thermal tune method [16].
- Biofilm Coating: The microbead probe is coated with the bacterial biofilm by bringing it into gentle contact with a mature biofilm grown on an agar plate or submerged substrate, ensuring a monolayer of cells adheres to the bead surface.
- Force Spectroscopy: The biofilm-coated bead is approached into contact with a clean glass substrate in a fluid cell containing growth medium. A defined loading force (e.g., 500 pN) is applied for a set contact time (e.g., 1 second).
- Data Acquisition:
- Adhesion: The probe is retracted, and the force-versus-distance curve is recorded. The adhesive pressure is calculated from the pull-off force divided by the contact area.
- Viscoelasticity (Nanoindentation): During the hold period at constant load, the creep (increase in indentation depth over time) is recorded. This creep curve is fitted to a viscoelastic mechanical model (e.g., a Voigt Standard Linear Solid model) to derive parameters like the instantaneous elastic modulus (E₀), delayed elastic modulus (E₁), and apparent viscosity (η) [16].
Bulk Rheology
Bulk rheology measures the mechanical response of a large biofilm sample to an applied oscillatory shear stress [34] [81].
Detailed Protocol:
- Sample Preparation: Biofilms are grown directly on the rheometer's geometry (e.g., a parallel plate or cone-and-plate system) by inoculating the bacterial strain and cultivating it for the desired period under controlled conditions. A solvent trap is often used to prevent evaporation.
- Strain Sweep: Prior to measurement, a strain sweep test is performed at a fixed frequency to identify the linear viscoelastic region (LVER), where the material's properties are independent of the applied strain amplitude.
- Oscillatory Shear Test: Within the LVER, an oscillatory shear strain, γ = γ₀sin(ωt), is applied. The stress response of the biofilm, σ = σ₀sin(ωt + δ), is measured.
- Data Analysis: The viscoelastic moduli are extracted from the stress response:
- Elastic Storage Modulus (G'): G' = (σ₀/γ₀)cos(δ). This quantifies the solid-like, energy-storing component of the material.
- Viscous Loss Modulus (G''): G'' = (σ₀/γ₀)sin(δ). This quantifies the fluid-like, energy-dissipating component. The complex shear modulus is G* = G' + iG'' [81].
Particle-Tracking Microrheology
This technique probes local mechanical properties within the biofilm by tracking the motion of embedded particles [3].
Detailed Protocol:
- Tracer Embedment: Fluorescent or plain polystyrene microbeads (e.g., 1 µm diameter) are introduced during or after biofilm growth. The beads are thoroughly washed to remove surfactants before use.
- Image Acquisition: The biofilm with embedded beads is imaged using confocal laser scanning microscopy (CLSM). Time-lapse series (xyt-stacks) are acquired at different heights within the biofilm.
- Trajectory Analysis: Particle trajectories are registered from the time-lapse images using tracking software (e.g., Diatrack). The mean squared displacement (MSD), 〈Δr²(τ)〉, is calculated for each particle over various time lags (τ).
- Mechanical Property Calculation: The creep compliance, J(t), a measure of deformability, is calculated from the MSD using the generalized Stokes-Einstein relationship: J(t) = (3πa / 4k₋T) * 〈Δr²(t)〉, where 'a' is the bead radius, k₋ is Boltzmann's constant, and T is temperature [3]. This compliance can be related to the local viscoelastic moduli.
Workflow Visualization
The following diagrams illustrate the standard experimental workflows for AFM-based and rheology-based characterization.
AFM Force Spectroscopy Workflow
Bulk Rheology Workflow
Essential Research Reagent Solutions
A successful biofilm mechanics experiment relies on several key materials and reagents, as detailed below.
Table 3: Key research reagents and materials for biofilm mechanics studies
| Reagent/Material | Function/Application | Example Specifications |
|---|---|---|
| Tipless AFM Cantilevers | Base for functionalization with microbeads or for nanoindentation. | Mikromasch CSC12/Tipless; typical spring constant: 0.01-0.08 N/m [16]. |
| Glass or Polymer Microbeads | Spherical probes for defined contact area in force spectroscopy or as tracers in microrheology. | Diameter: 1-50 µm; often carboxylate-modified for coupling [16] [3]. |
| Fluorescent Microbeads | Tracers for particle motion visualization in microrheology combined with CLSM. | Diameter: 0.1-1 µm; common fluorophores: green (e.g., 488/519 nm) [3]. |
| Culture Media | Supports biofilm growth under standardized conditions. | Tryptic Soy Broth (TSB), King's B Broth, or other defined media [16] [3]. |
| Fixatives & Stains | Sample preservation and matrix component labeling for correlative microscopy. | Osmium Tetroxide, Ruthenium Red, Tannic Acid for SEM; fluorescent conjugates for CLSM [57]. |
The accurate characterization of biofilm viscoelasticity is paramount for understanding biofilm behavior in industrial, clinical, and environmental contexts. This guide objectively compares atomic force microscopy (AFM) and rheology, the two predominant techniques for quantifying these mechanical properties. The analysis reveals that the choice of measurement method is not neutral but introduces specific artifacts and biases, directly influencing the reported viscoelastic parameters. Data show that AFM typically reports elastic moduli in the 1-100 kPa range for bacterial biofilms, while bulk rheology often records values an order of magnitude lower (0.1-10 kPa). These discrepancies are not merely experimental error but systematic variations arising from fundamental differences in sample interaction, probed volume, and data interpretation. Understanding these technique-specific artifacts is critical for selecting the appropriate methodology, interpreting data across studies, and developing effective biofilm control strategies.
Biofilms are viscoelastic materials, meaning they exhibit both solid-like (elastic) and liquid-like (viscous) mechanical properties [83]. This mechanical duality is not a mere curiosity but is fundamental to their survival and function. Viscoelasticity contributes to a biofilm's ability to withstand mechanical disruption, promotes its expansion over surfaces, and is increasingly linked to its heightened tolerance against antimicrobials [83]. Consequently, the accurate measurement of these properties is essential for fundamental research and applied science.
However, biofilms are inherently complex and heterogeneous. Their structure varies spatially, with structural differences observed between the bottom, middle, and top layers [25], and temporally, as maturation alters their mechanical characteristics [16]. This complexity poses a significant challenge for mechanical characterization. No single technique provides a complete picture, and each method interacts with the biofilm in a unique way, potentially inducing measurement artifacts that influence the resulting data. This guide focuses on dissecting these artifacts for AFM and rheology, the two most common techniques, to provide researchers with a clear framework for methodological comparison and data interpretation.
Comparative Analysis of Measurement Techniques
Atomic Force Microscopy (AFM)
AFM operates by scanning a sharp tip or colloidal probe attached to a flexible cantilever across the sample surface. It measures force with piconewton sensitivity, allowing for the quantification of mechanical properties at the nanoscale [16] [58].
- Principle: The instrument measures cantilever deflection as a function of sample position. In force spectroscopy mode, the probe indents the sample, and the resulting force-distance curve is analyzed using mechanical models (e.g., Hertz, Sneddon, or viscoelastic extensions) to extract properties like elastic modulus and adhesion energy [84] [58].
- Typical Experimental Protocol:
- Probe Selection: A tipless cantilever is fitted with a spherical microbead (e.g., 50 µm diameter) to create a defined contact geometry [16].
- Calibration: The cantilever's spring constant is precisely calibrated using the thermal tune method [16].
- Sample Immobilization: Biofilms are grown on rigid substrates (e.g., glass coverslips). For single-cell analysis, chemical or mechanical immobilization is often required to prevent displacement during scanning [58].
- Data Acquisition: Force curves are collected at multiple locations across the biofilm surface. For viscoelastic analysis, creep tests (holding a constant load and measuring indentation over time) are performed [16] [84].
- Data Analysis: Force curves are fit to a viscoelastic model (e.g., the Voigt Standard Linear Solid model) to derive quantitative parameters such as the instantaneous elastic modulus ((E0)), delayed elastic modulus ((E1)), and viscosity (η) [16].
Bulk Rheology
Rheology characterizes the flow and deformation of materials under stress. In biofilm research, parallel plate rheometry is commonly used to measure the bulk average properties of a sample.
- Principle: A biofilm sample is sheared between two parallel plates. By applying controlled oscillatory stresses or strains, the instrument measures the material's viscoelastic response, typically reported as the storage modulus (G', elastic component) and loss modulus (G", viscous component) [1] [25].
- Typical Experimental Protocol:
- Sample Preparation: Biofilms are typically grown directly on the rheometer plate or carefully transferred as an intact plug to the instrument [1].
- Loading: The upper plate is lowered to a defined gap, encapsulating the biofilm sample and ensuring no slip at the interfaces.
- Data Acquisition: An amplitude sweep is performed to identify the linear viscoelastic region (LVER), where properties are independent of the applied strain. Subsequently, a frequency sweep within the LVER is conducted to measure G' and G" as a function of frequency.
- Data Analysis: The frequency-dependent moduli are used to characterize the biofilm's mechanical spectrum and its dominant solid-like or liquid-like behavior.
Emerging Techniques: Particle-Tracking Microrheology
Particle-tracking microrheology (PTM) is an in situ technique that complements AFM and bulk rheology.
- Principle: Fluorescent tracer beads are embedded within the biofilm structure. Using confocal laser scanning microscopy (CLSM), the Brownian motion of these beads is tracked over time [25].
- Data Analysis: The mean squared displacement (MSD) of the beads is calculated from their trajectories. The creep compliance, a measure of deformation under force, is then derived from the MSD using the Generalized Stokes-Einstein equation, providing local, region-specific viscoelastic properties [25].
The following workflow illustrates the logical process of selecting a technique based on research goals and interpreting results with artifacts in mind.
Quantitative Data Comparison
The following tables summarize typical quantitative outputs and the specific artifacts associated with each technique, providing a direct comparison of their performance characteristics.
Table 1: Comparison of Reported Viscoelastic Properties by Measurement Technique
| Technique | Typical Elastic Modulus Range | Spatial Resolution | Probable Artifact Influence | Key Measured Parameters |
|---|---|---|---|---|
| AFM | 1 - 100 kPa [16] | Nanoscale (µm-nm) | High (surface/local) | Instantaneous Modulus (E₀), Delayed Modulus (E₁), Viscosity (η), Adhesion Pressure |
| Bulk Rheology | 0.1 - 10 Pa (G') [1] [25] | Macroscale (mm) | High (bulk averaging) | Storage Modulus (G'), Loss Modulus (G''), Complex Viscosity (η*) |
| Particle-Tracking Microrheology | Creep Compliance: 10⁻² - 10⁻¹ Pa⁻¹ [25] | Microscale (µm) | Medium (probe size) | Creep Compliance (J), Mean Squared Displacement (MSD) |
Table 2: Technique-Specific Artifacts and Limitations
| Technique | Key Artifacts & Limitations | Impact on Reported Viscoelasticity |
|---|---|---|
| AFM | - Surface/localized measurement only [25]- Assumption of mechanical models (Hertz)- Probe-sample adhesion effects [84]- Potential sample deformation | - Overestimation of modulus if model is inappropriate- Data may not represent bulk biofilm properties- Adhesion forces can complicate indentation analysis |
| Bulk Rheology | - Averages properties over entire sample [25]- Requires large, homogeneous samples- Wall slip effects- Potential for sample destruction at high strain | - Masks spatial heterogeneity- May underestimate strength by including weak zones- Data can be skewed by sample preparation |
| Particle-Tracking Microrheology | - Sensitivity to bead-biofilm interactions [25]- Limited to low frequency range- Assumes tracer particles are passive | - Bead chemistry can influence local matrix, altering mobility- May not capture full viscoelastic spectrum |
Detailed Experimental Protocols
Microbead Force Spectroscopy (AFM) for Biofilms
This protocol, adapted from [16], standardizes force measurements for quantitative comparison of biofilm adhesion and viscoelasticity.
- Cantilever and Probe Preparation: Use a tipless cantilever. A 50 µm diameter glass bead is attached using a non-soluble epoxy to create a spherical probe with a defined contact area.
- Cantilever Calibration: Calibrate the cantilever's spring constant in fluid using the thermal noise method [16]. Cantilevers with a spring constant of 0.03 N/m are typical.
- Biofilm Coating: The glass bead probe is coated with the bacterial biofilm of interest by immersing it in a concentrated cell suspension (e.g., OD₆₀₀ = 2.0) for a defined period.
- Force Spectroscopy: The biofilm-coated probe is approached into contact with a clean glass substrate in liquid. A force curve is performed with standardized parameters:
- Loading Pressure: Pre-defined to ensure consistency.
- Contact Time: Held constant (e.g., 0.5-1 second) at maximum load for creep measurement.
- Retraction Speed: Kept constant for all experiments.
- Data Analysis:
- Adhesion: Calculated from the retraction curve's pull-off force, normalized by the contact area to report adhesive pressure in Pascals (Pa).
- Viscoelasticity: The creep data during the hold period is fitted to a Voigt Standard Linear Solid model to extract the instantaneous elastic modulus (E₀), delayed elastic modulus (E₁), and viscosity (η).
Particle-Tracking Microrheology for Regional Analysis
This protocol, based on [25], allows for in situ mapping of local mechanical properties within a biofilm.
- Tracer Bead Preparation: Carboxylated fluorescent microspheres (1 µm diameter) are washed via centrifugation in MilliQ water to remove surfactant.
- Biofilm Growth and Bead Implantation: Biofilms are grown on glass coverslips. The tracer beads are added to the growth medium at a concentration of 5 × 10⁵ beads/ml during cultivation, allowing them to be incorporated into the biofilm matrix.
- Confocal Microscopy: The biofilm is imaged using a CLSM. For rheology, time-series stacks (xyt) are acquired at different heights (bottom, middle, top) within the biofilm for approximately 135 seconds per plane.
- Particle Tracking and Analysis:
- Trajectory Registration: The Diatrack or similar software is used to track the Brownian motion of the beads from the time-series data.
- MSD Calculation: The mean squared displacement (MSD) is calculated for each bead trajectory.
- Creep Compliance: The creep compliance, J(t), is calculated from the MSD using the equation: (J = \frac{3\pi d}{4kB T} \langle \Delta r^2(t) \rangle ), where d is bead diameter, kB is Boltzmann's constant, and T is temperature [25].
- Regional Classification: Beads are classified as residing in "voids" or "clusters" based on the local biofilm structure imaged by CLSM, allowing for region-specific mechanical analysis.
The Scientist's Toolkit: Essential Research Reagents and Materials
Table 3: Key Reagents and Materials for Biofilm Viscoelasticity Analysis
| Item | Function in Experiment | Example Specifications |
|---|---|---|
| Tipless AFM Cantilevers | Base for attaching spherical probes for force spectroscopy. | Material: Silicon; Spring Constant: ~0.03 N/m [16] |
| Spherical Probe Microbeads | Creates defined contact geometry for quantifiable force measurements. | Material: Glass or Silica; Diameter: 50 µm [16] |
| Functionalized Beads (for PTM) | Acts as passive tracer particles to probe local matrix mechanics. | Material: Polystyrene; Diameter: 1 µm; Functionalization: Carboxylate [25] |
| Immobilization Substrates | Provides a rigid surface for biofilm growth and AFM analysis. | Material: Glass coverslips, often chemically treated (e.g., PFOTS) [6] |
| Calibration Standards | Verifies the accuracy of AFM cantilever spring constants. | - |
| Rheometer Parallel Plates | The interface that shears the biofilm sample for bulk measurement. | Diameter: 20-40 mm; Surface: Often roughened to prevent wall slip |
The measurement of biofilm viscoelasticity is inherently technique-dependent. AFM excels in providing high-resolution, nanoscale property mapping of surface and local features but is susceptible to artifacts from model assumptions and probe-sample interactions. In contrast, bulk rheology offers invaluable data on the macroscale mechanical behavior relevant to biofilm stability under flow but obscures critical spatial heterogeneity. Particle-tracking microrheology bridges these scales by quantifying internal, region-specific properties.
The significant discrepancies in reported elastic moduli—with AFM often reporting higher values than bulk rheology—are powerful evidence of technique-specific artifacts. These differences underscore that no single "correct" value for biofilm viscoelasticity exists independently of the measurement method. Therefore, researchers must align their technique choice with their specific scientific question, whether it concerns single-cell mechanics, bulk material behavior, or internal structural heterogeneity. A multi-technique approach, coupled with a critical awareness of the artifacts inherent in each method, is essential for a holistic and accurate understanding of biofilm mechanics and its implications for infection and survival.
The study of biofilm viscoelasticity is pivotal for addressing their recalcitrance in medical, industrial, and environmental contexts. Biofilms exhibit complex mechanical behaviors, behaving as viscoelastic materials that combine both solid-like and liquid-like properties [85]. This duality allows them to deform irreversibly over time to relieve stress (viscous response) while also deforming instantaneously and recovering when stress is removed (elastic response) [85]. No single technique can fully capture this complexity, as each method operates at different length scales, applies different stresses, and probes different aspects of the biofilm matrix. Atomic Force Microscopy (AFM) provides high-resolution nanomechanical mapping of localized properties, while rheology delivers bulk mechanical parameters essential for understanding large-scale behavior. Confocal Microscopy adds crucial spatial context by visualizing the complex heterogeneous architecture of biofilms. This guide objectively compares AFM with rheology for biofilm viscoelasticity research and demonstrates how their integration with confocal microscopy provides a comprehensive mechanical portrait essential for advancing anti-biofilm strategies and material design.
Technical Comparison: Atomic Force Microscopy vs. Rheology
The following table provides a direct comparison of the core technical capabilities of AFM and rheology in the context of biofilm viscoelasticity characterization.
Table 1: Technical comparison between AFM and Rheology for biofilm characterization.
| Feature | Atomic Force Microscopy (AFM) | Rheology |
|---|---|---|
| Principle | Measures force via cantilever deflection from tip-sample interaction [86] [35] | Applies controlled stress/strain to measure bulk material deformation & flow [85] |
| Probed Length Scale | Nanoscale to microscale (local) [86] [1] | Macroscale (bulk average) [3] |
| Spatial Resolution | High (nanometer range) [35] | Low (millimeter range; no spatial resolution) [3] |
| Primary Mechanical Outputs | Young's Modulus (E); adhesion forces; viscoelastic maps [86] [30] | Shear Storage (G') and Loss (G'') Moduli; complex viscosity [85] |
| Key Advantage | Nanomechanical property mapping; subcellular resolution; can be combined with confocal microscopy [87] | Direct measurement of bulk viscoelasticity; standard rheological parameters [85] |
| Main Limitation | Small, localized sample area; complex data analysis for heterogeneous materials [86] | Requires relatively large sample volume; lacks spatial resolution [3] |
Quantitative Data from Comparative Studies
Different measurement techniques can yield varying absolute values for mechanical properties due to their distinct principles, as illustrated by comparative studies on biological systems.
Table 2: Representative mechanical properties measured by different techniques on biological samples.
| Sample Type | Measurement Technique | Probe/Geometry | Measured Modulus | Value | Citation |
|---|---|---|---|---|---|
| MCF-7 Breast Cancer Cells | AFM (Indentation) | Sharp pyramidal tip (~10 nm) | Young's Modulus (E) | ( 5.5 \pm 0.8 ) kPa | [86] |
| MCF-7 Breast Cancer Cells | AFM (Indentation) | 5 µm spherical bead | Young's Modulus (E) | ( 0.53 \pm 0.52 ) kPa | [86] |
| MCF-7 Breast Cancer Cells | Parallel-Plate Rheometer | Whole-cell compression | Shear Modulus (G) at 1 Hz | ~380 Pa | [86] |
| MCF-7 Breast Cancer Cells | Optical Stretcher | Whole-cell laser stretching | Peak Strain | ( 5.16 \pm 0.11 \% ) | [86] |
| P. aeruginosa Biofilm (mutant) | Microbead Force Spectroscopy (AFM) | Microbead | Adhesive Pressure (Early Biofilm) | ( 332 \pm 47 ) Pa | [30] |
| P. aeruginosa Biofilm (wild-type) | Microbead Force Spectroscopy (AFM) | Microbead | Adhesive Pressure (Early Biofilm) | ( 34 \pm 15 ) Pa | [30] |
Experimental Protocols for Integrated Characterization
Protocol for AFM-based Nanomechanical Mapping
AFM force-distance curve-based mapping is a foundational protocol for assessing local mechanical properties [35].
- Probe Selection: Choose an appropriate cantilever with a known spring constant. For biofilms, spherical or sphero-conical probes (diameters from hundreds of nanometers to micrometers) are often preferred over sharp tips to achieve larger, more representative indentation volumes and avoid sample damage [86] [87].
- Calibration: Calibrate the cantilever's spring constant and the AFM's photodetector sensitivity using standard methods (e.g., thermal tune).
- Force Mapping: Acquire an array of force-distance curves over the sample surface. In each pixel, the tip approaches, indents, and retracts from the sample while the cantilever deflection is recorded.
- Data Analysis: Fit the approach portion of the force-distance curve to a contact mechanics model (e.g., Hertz, Sneddon, or a custom sphero-conical model [87]) to extract the local Young's Modulus (E). The adhesion forces can be analyzed from the retraction curve.
Protocol for Particle-Tracking Microrheology (PTM) Integrated with Confocal Microscopy
PTM is a powerful in situ technique that leverages confocal microscopy to quantify local mechanical properties within a biofilm's 3D structure [3].
- Bead Implantation: Incorporate fluorescent tracer particles (e.g., 1 µm carboxylate beads) into the biofilm during or after growth. The beads must be small enough to not perturb the native biofilm structure significantly [3].
- 4D Imaging (xyzt): Use a Confocal Laser Scanning Microscope (CLSM) to acquire time-lapse image stacks (z-stacks over time) of the beads within the biofilm matrix.
- Trajectory Analysis: Track the Brownian motion of the embedded beads using particle-tracking software (e.g., Diatrack) to determine their mean squared displacement (MSD) over time [3].
- Creep Compliance Calculation: Calculate the local creep compliance, ( J(t) ), from the MSD using the Generalized Stokes-Einstein Equation: ( J(t) = \frac{3\pi a}{4kBT} \langle \Delta r^2(t) \rangle ), where ( a ) is the bead diameter, ( kB ) is Boltzmann's constant, ( T ) is temperature, and ( \langle \Delta r^2(t) \rangle ) is the MSD [3]. This compliance can be used to derive viscoelastic moduli.
Protocol for Correlative Confocal Microscopy and AFM Indentation
This protocol directly marries structural visualization with mechanical probing [87].
- Sample Preparation: Grow biofilms or embed cells in a 3D extracellular matrix (e.g., collagen I hydrogel) on a substrate suitable for both confocal microscopy and AFM, such as a glass-bottom dish.
- Structural Identification: Use confocal microscopy to identify specific regions of interest (ROIs) within the sample, such as cell nuclei, cluster regions in biofilms, or void zones [3] [87].
- Targeted Indentation: Use the AFM, with a high-height probe suitable for deep indentation (e.g., a mesoscopic sphero-conical tip [87]), to perform force spectroscopy on the pre-identified ROIs.
- Data Deconvolution: Employ finite element (FE) simulations or analytical modeling to decouple the mechanical response of the embedded cell or biofilm feature from that of the surrounding matrix, using the structural data from confocal microscopy as an input for the model [87].
Visualizing the Integrated Workflow
The following diagram illustrates the synergistic workflow of a multimodal characterization strategy.
Essential Research Reagent Solutions
The following table lists key materials and reagents essential for conducting the experiments described in this guide.
Table 3: Key research reagents and materials for multimodal biofilm characterization.
| Item | Function/Application | Specific Example |
|---|---|---|
| Fluorescent Tracer Beads | Serve as probes for Particle-Tracking Microrheology (PTM) within the biofilm matrix. | 1 µm diameter green fluorescent carboxylate microbeads [3]. |
| AFM Cantilevers | Act as mechanical probes for indentation and adhesion force measurements. | Spherical probes (e.g., ~5 µm glass beads), Sphero-conical probes (~750 nm radius) [86] [87]. |
| Extracellular Matrix Proteins | Form a 3D hydrogel environment for studying cell-biofilm mechanics in a physiologically relevant context. | Bovine collagen I hydrogels [87]. |
| Specific Stains | Enable visualization of biofilm components and structure via confocal microscopy. | Congo red for confirming biofilm formation [88]. |
| Culture Media | Support the growth and maintenance of biofilms under defined conditions. | King B broth for P. fluorescens; Trypticase Soy Broth (TSB) for microtiter plate assays [3] [88]. |
AFM and rheology are not competing but complementary techniques for biofilm viscoelasticity research. AFM excels in providing high-resolution, spatially resolved nanomechanical maps, revealing local heterogeneities that bulk rheology inevitably averages out. Conversely, rheology is unmatched in quantifying the macroscopic viscoelastic response of a biofilm, providing industry- and physiology-relevant parameters like shear moduli. The integration of both with confocal microscopy creates a powerful correlative platform, where mechanical data is directly linked to structural and compositional information. This multimodal approach is critical for developing a fundamental understanding of biofilm mechanics, which can inform the design of more effective biofilm control strategies, antifouling surfaces, and advanced biomaterials.
Developing a Framework for Cross-Validation and Complementary Data Analysis
Bacterial biofilms represent a predominant mode of microbial growth in nature and pose significant challenges across healthcare, industrial, and environmental sectors due to their enhanced resistance to mechanical removal and antimicrobial treatments [16] [85]. The viscoelastic properties of biofilms—their ability to exhibit both solid-like elastic and fluid-like viscous behaviors—are now recognized as fundamental to this recalcitrance, influencing structural integrity, stress resistance, and dispersal mechanisms [85] [83]. Accurately quantifying these mechanical properties has emerged as a crucial research focus for developing effective biofilm control strategies.
Atomic force microscopy (AFM) and rheology have become two cornerstone techniques for characterizing biofilm mechanics, yet each operates at different scales and probes distinct material properties. AFM provides nanoscale to microscale resolution of local mechanical properties, while rheology measures bulk mechanical responses of biofilm samples [3]. This article develops a comprehensive framework for cross-validating and complementing data from these techniques, enabling researchers to obtain a more complete understanding of biofilm viscoelasticity. By objectively comparing their performance and providing standardized experimental protocols, we aim to establish guidelines for reliable mechanical characterization of biofilms across diverse research applications.
Fundamental Principles: Viscoelasticity in Biofilms
Biofilms are complex viscoelastic materials whose mechanical behavior depends on both their composition and structure. The extracellular polymeric substance (EPS) matrix, comprising polysaccharides, proteins, and nucleic acids, forms a hydrated polymer network that determines the mechanical response of the biofilm [85] [89]. This matrix behaves as a crosslinked polymer gel with both elastic and viscous components [89].
Elasticity (storage modulus, G') represents the solid-like, energy-storing capacity of the biofilm, enabling it to recover shape after deformation. Viscosity (loss modulus, G") reflects the fluid-like, energy-dissipating character, allowing irreversible flow under stress [85]. Biofilms typically exhibit time-dependent stress-strain relationships manifesting as creep (increasing strain under constant stress) or stress relaxation (decreasing stress under constant strain) [16]. The precise viscoelastic character of a biofilm varies with genetic makeup, environmental conditions, maturation state, and microbial composition, necessitating characterization techniques that can capture this complexity [16] [89].
Atomic Force Microscopy (AFM) for Biofilm Characterization
Atomic force microscopy provides high-resolution imaging and force measurement capabilities under native conditions, making it particularly valuable for biofilm research [16] [90]. In microbiological applications, AFM can image properly immobilized microbial samples immersed in liquids at nanometer resolution while simultaneously measuring physical properties with piconewton sensitivity [16]. This capacity for examination in physiological conditions with minimal sample preparation reduces potential artifacts and enables direct correlation between structural features and mechanical properties.
For viscoelastic characterization, AFM primarily operates in force spectroscopy mode, where a cantilever with a known tip geometry is brought into contact with the biofilm surface while precisely measuring deflection and displacement [16] [7]. Microbead force spectroscopy (MBFS) represents a specialized approach where a microbead is attached to a tipless cantilever, creating a defined contact geometry with the biofilm surface [16]. This method enables accurate quantification of adhesive and viscoelastic properties over a standardized area, combining the defined contact geometry of spherical probes with the sample flexibility of cell-coated tips [16].
Experimental Protocols for AFM Biofilm Characterization
Sample Preparation:
- Bacterial strains (e.g., Pseudomonas aeruginosa PAO1 and isogenic mutants) are grown overnight in appropriate broth (e.g., Trypticase Soy Broth) at 37°C with shaking at 125 rpm [16].
- Cells are harvested by centrifugation at 2300 × g for 5 minutes, washed twice in deionized water, and adjusted to a standardized optical density (OD600 = 2.0) [16].
- For biofilm formation, cleaned substrates (e.g., glass coverslips) are immersed in bacterial suspension and incubated under static conditions for specified periods (e.g., 24-48 hours) to develop early or mature biofilms [16] [3].
AFM Calibration and Measurement:
- Rectangular tipless silicon cantilevers with nominal spring constants of 0.03 N/m (range: 0.01-0.08 N/m) are calibrated using the thermal method of Hutter and Bechhoefer to determine exact spring constants [16].
- Cantilevers with calibrated spring constants outside the 0.015-0.060 N/m range should be discarded to ensure measurement consistency [16].
- For MBFS, 50-μm diameter glass beads are attached to cantilevers using epoxy resin and calibrated before measurements [16].
- Standardized conditions for force measurements include constant approach/retraction speed (e.g., 2 μm/s), contact time (e.g., 1 second), and loading force (e.g., 1 nN) to enable meaningful cross-experiment comparisons [16].
Data Analysis:
- Adhesive properties are quantified from force-separation curves during cantilever retraction, with adhesive pressure calculated as the maximum adhesive force divided by the contact area [16].
- Viscoelastic properties are determined by fitting creep compliance data (indentation vs. time during constant load) to mechanical models such as the Voigt Standard Linear Solid model [16].
- Instantaneous elastic modulus (E0), delayed elastic modulus (E1), and viscosity (η) are extracted from model fits to quantify viscoelastic parameters [16].
Key Research Reagent Solutions for AFM
Table 1: Essential Research Reagents for AFM Biofilm Studies
| Reagent/Category | Specific Examples | Function/Application |
|---|---|---|
| Bacterial Strains | Pseudomonas aeruginosa PAO1, Escherichia coli, Staphylococcus aureus | Model biofilm-forming organisms for mechanical studies [16] [90] |
| AFM Cantilevers | CSC12/Tipless/No Al Type E (Mikromasch) | Tipless cantilevers for microbead attachment in MBFS [16] |
| Probe Modifications | 50-μm diameter glass beads | Spherical probes for defined contact geometry in force measurements [16] |
| Growth Media | Trypticase Soy Broth (TSB), King B Broth | Standardized nutrient sources for reproducible biofilm growth [16] [3] |
| Immobilization Substrates | Glass coverslips, mica surfaces, coated substrates | Chemically inert surfaces for reproducible biofilm adhesion [16] [3] |
Rheology for Biofilm Characterization
Rheology provides macroscopic characterization of biofilm mechanical properties through controlled application of stress or strain and measurement of the resultant response [85] [89]. Rotational rheometers with parallel-plate geometry are most commonly employed, allowing both dynamic oscillatory measurements and steady-shear experiments [89]. These instruments quantify fundamental viscoelastic parameters including storage modulus (G'), loss modulus (G"), complex viscosity (η*), and yield stress, providing insights into biofilm mechanical integrity, flow behavior, and resistance to deformation [89].
Complementary approaches include interfacial rheology, which specifically probes mechanical properties at liquid-air or liquid-liquid interfaces where biofilms often form [91], and particle-tracking microrheology, which enables in situ quantification of local mechanical properties within different biofilm regions [3]. Quartz crystal microbalance with dissipation monitoring (QCM-D) offers additional capability for real-time, label-free monitoring of biofilm development and viscoelastic properties by measuring changes in resonance frequency and energy dissipation [91].
Experimental Protocols for Rheological Characterization
Sample Preparation for Bulk Rheology:
- Biofilms are grown directly on rheometer measuring plates or transferred using appropriate techniques to maintain structural integrity [89].
- For marine biofilms, surfaces (e.g., foul-release coatings, primed surfaces, PVC) are immersed in natural seawater under static or flow conditions for extended periods (e.g., 8 weeks) to develop mature biofilms [89].
- Biofilm thickness and structure are characterized before rheological testing using Optical Coherence Tomography (OCT) to ensure consistency between samples [89].
Rheological Measurement Protocols:
- Amplitude sweep tests determine the linear viscoelastic region (LVR) by applying oscillatory shear with increasing strain amplitude at constant frequency [89].
- Frequency sweep tests within the LVR characterize time-dependent behavior by measuring G' and G" across a frequency range (e.g., 0.1-10 Hz) at constant strain [89].
- Creep-recovery tests apply constant stress for a defined period then monitor strain recovery after stress removal to quantify viscous flow and elastic recovery [85].
- Flow curves measure viscosity as a function of increasing shear rate to determine shear-thinning behavior and apparent yield stress [89].
Data Analysis:
- Viscoelastic moduli (G', G") are determined from oscillatory measurements as functions of frequency, strain, or time [89].
- Creep compliance J(t) is calculated from creep tests and modeled using power-law or mechanical analog models to extract viscoelastic parameters [7] [85].
- Yield stress is identified as the stress at which G' decreases significantly below its plateau value in amplitude sweeps, indicating structural failure [89].
Key Research Reagent Solutions for Rheology
Table 2: Essential Research Reagents for Rheological Biofilm Studies
| Reagent/Category | Specific Examples | Function/Application |
|---|---|---|
| Rheometer Systems | Parallel-plate rheometers (e.g., Anton Paar MCR series) | Controlled stress/strain instrumentation for bulk viscoelastic characterization [89] |
| Surface Coatings | Foul-release coatings (FRC), anticorrosive primers (ACP) | Surface treatments to study substrate effects on biofilm mechanics [89] |
| QCM-D Sensors | Gold-quartz sensors (10 MHz oscillation) | Real-time monitoring of biofilm formation and viscoelastic properties [91] |
| Particle Probes | Fluorescent carboxylate microbeads (1 μm diameter) | Tracer particles for microrheology and local mechanical property mapping [3] |
| Environmental Chambers | Temperature-controlled fluid cells | Maintenance of physiological conditions during measurements [89] |
Comparative Analysis: AFM versus Rheology for Biofilm Research
Technical Capabilities and Limitations
Table 3: Direct Comparison of AFM and Rheology for Biofilm Viscoelasticity Studies
| Parameter | Atomic Force Microscopy (AFM) | Rheology |
|---|---|---|
| Measurement Scale | Nanoscale to microscale (nm-μm) [16] | Macroscale (mm) [3] |
| Spatial Resolution | High (local properties, surface heterogeneity) [3] | Low (bulk average properties) [3] |
| Sample Volume | Minimal (single cells to small aggregates) [16] | Larger samples required (mm-scale) [89] |
| Measurement Environment | Native conditions in liquid possible [16] | Controlled environment, but may require sample transfer [89] |
| Principal Outputs | Adhesive forces, local elastic modulus, viscosity [16] | Bulk viscoelastic moduli (G', G"), complex viscosity [89] |
| Depth Profiling | Limited to surface and near-surface regions [16] | Entire biofilm thickness averaged [3] |
| Throughput | Lower (point-by-point measurement) [90] | Higher (bulk measurement) [89] |
| Key Strengths | Nanoscale resolution, correlation of structure and mechanics, minimal sample preparation [16] [90] | Standardized rheological characterization, established data interpretation, time-dependent behavior [85] [89] |
| Principal Limitations | Limited depth penetration, small sampling area, complex data interpretation [3] | Bulk averaging masks heterogeneity, potential sample damage during loading [3] |
Complementary Data from Dual-Technique Approaches
Integrating AFM and rheology provides a comprehensive understanding of biofilm mechanics across scales. AFM reveals local variations in mechanical properties correlated with structural features, while rheology characterizes the overall mechanical response. For example, particle-tracking microrheology combined with confocal microscopy bridges these scales by quantifying local creep compliance within specific biofilm regions (voids vs. clusters) while resolving 3D structure [3].
Studies employing multiple techniques have demonstrated that biofilm void zones primarily contribute to overall viscoelastic character, with compliance analysis showing significant differences between regional properties [3]. Simultaneous QCM-D and interfacial rheology have identified distinct growth phases (attachment, maturation, dispersion) through correlated changes in resonance frequency, energy dissipation, and viscoelastic moduli [91]. These multi-technique approaches reveal how genetic modifications, environmental conditions, and biofilm architecture collectively determine mechanical behavior.
Integrated Experimental Design: A Framework for Cross-Validation
Standardized Workflow for Comprehensive Biofilm Characterization
The following workflow diagram outlines an integrated approach for cross-validated biofilm viscoelasticity assessment:
Diagram 1: Integrated workflow for cross-validated biofilm viscoelasticity assessment
Cross-Validation Protocols and Data Correlation Methods
Effective cross-validation requires standardized sample preparation across measurement techniques and systematic correlation of parameters. The following protocols ensure data compatibility:
Standardized Biofilm Growth:
- Identical bacterial strains, growth media, and environmental conditions (temperature, flow, time) for all characterization methods [16] [89].
- Common substrate materials where possible, or systematic variation to account for substrate effects [89].
Parameter Cross-Correlation:
- Direct comparison of elastic moduli from AFM indentation and rheological oscillatory tests, accounting for differences in measurement frequency and strain [7].
- Correlation of local creep compliance from particle-tracking microrheology with bulk creep compliance from rheological measurements [3].
- Validation of AFM-adhesive strength measurements against rheological yield stress determinations [16] [89].
Model-Based Integration:
- Mechanical models (e.g., power-law structural damping, Voigt models) applied consistently across techniques for parameter extraction [16] [7].
- Multi-scale modeling approaches that incorporate local AFM measurements into bulk rheological response predictions [3].
Comparative Experimental Data and Case Studies
Quantitative Comparison of Technique Outputs
Table 4: Experimental Values from AFM and Rheology Studies of Biofilm Viscoelasticity
| Biofilm Type | Technique | Elastic/Storage Modulus | Viscosity/Loss Modulus | Adhesive Strength | Reference |
|---|---|---|---|---|---|
| P. aeruginosa PAO1 (early) | AFM (MBFS) | Instantaneous modulus: ~500 Pa [16] | Viscosity: ~50 Pa·s [16] | 34 ± 15 Pa [16] | [16] |
| P. aeruginosa PAO1 (mature) | AFM (MBFS) | Instantaneous modulus: ~200 Pa [16] | Viscosity: ~20 Pa·s [16] | 19 ± 7 Pa [16] | [16] |
| P. aeruginosa wapR (early) | AFM (MBFS) | Instantaneous modulus: ~3000 Pa [16] | Viscosity: ~100 Pa·s [16] | 332 ± 47 Pa [16] | [16] |
| Marine Biofilm (FRC surface) | Parallel-plate Rheology | G': 100-1000 Pa [89] | G": 50-500 Pa [89] | Yield stress: ~10 Pa [89] | [89] |
| Marine Biofilm (ACP surface) | Parallel-plate Rheology | G': 500-2000 Pa [89] | G": 200-1000 Pa [89] | Yield stress: ~5 Pa [89] | [89] |
| P. fluorescens (void regions) | Particle-tracking Microrheology | Creep compliance: 10^-4 - 10^-3 Pa^-1 [3] | - | - | [3] |
| E. coli (maturation phase) | QCM-D + Interfacial Rheology | G': 0.057 Pa·m [91] | G": 0.016 Pa·m [91] | - | [91] |
Case Studies in Cross-Technique Validation
Case Study 1: Genetic Determinants of Biofilm Mechanics
- AFM studies of P. aeruginosa wild-type (PAO1) and LPS mutant (wapR) revealed significant differences in adhesive and viscoelastic properties, with mutant biofilms showing higher adhesive pressure (332 ± 47 Pa vs. 34 ± 15 Pa for early biofilms) and altered viscoelasticity [16].
- Complementary rheological studies of polysaccharide-deficient mutants (P. aeruginosa Psl/Pel mutants) showed how specific matrix components influence bulk viscoelastic properties, with Psl increasing elasticity and effective cross-linking [3].
- Cross-technique analysis demonstrates how local matrix composition changes (detected by AFM) manifest in altered bulk mechanical response (measured by rheology).
Case Study 2: Surface Property Effects on Marine Biofilms
- Rheological characterization of marine biofilms grown on different surfaces (foul-release coatings vs. primed surfaces) revealed significant differences in mechanical properties, with FRC biofilms exhibiting lower shear modulus but higher yield stress than ACP biofilms [89].
- AFM studies of biofilm adhesion to engineered surfaces provide nanoscale insights into adhesion mechanisms that correlate with macroscale yield stress measurements [89].
- Combined results inform the design of anti-fouling surfaces that minimize biofilm adhesion and facilitate mechanical removal.
This comparative analysis demonstrates that AFM and rheology provide complementary rather than competing approaches to biofilm viscoelasticity characterization. AFM offers unparalleled resolution of local mechanical properties and surface interactions, while rheology delivers standardized quantification of bulk viscoelastic behavior. The integrated framework presented enables researchers to select appropriate techniques based on specific research questions and validates cross-technique data interpretation.
Future developments in biofilm mechanobiology will benefit from continued technical advancements in both approaches, including high-speed AFM for dynamic measurements, improved environmental control for rheological testing, and standardized protocols for cross-laboratory comparisons. By adopting the cross-validation framework outlined here, researchers can advance our understanding of how biofilm mechanical properties contribute to persistence and inform the development of targeted disruption strategies across medical, industrial, and environmental applications.
Conclusion
The characterization of biofilm viscoelasticity is not a one-technique-fits-all endeavor. AFM and rheology offer distinct yet powerfully complementary perspectives: AFM provides unparalleled nanoscale resolution to map local heterogeneity and cell-matrix interactions, while rheology delivers robust measurements of the biofilm's bulk mechanical response. The choice between them must be guided by the specific research question, whether it involves understanding fundamental matrix biology at the single-fiber level or predicting large-scale biofilm behavior under fluid shear. Future directions point toward the increased use of standardized protocols to enable cross-study comparisons, the development of more advanced in-situ and in-vivo measurement techniques, and the application of this mechanical understanding to engineer novel therapeutic strategies that specifically target the biofilm's physical integrity. By strategically selecting and integrating these tools, researchers can unlock a deeper understanding of biofilm mechanics, ultimately leading to more effective interventions in clinical and industrial settings.
References
- 1. Advances in biofilm characterization: utilizing rheology and ... [https://link.springer.com/article/10.1007/s42114-024-00950-2]
- 2. Mechanical Comparison of Biofilms with Altered Matrix ... [https://pmc.ncbi.nlm.nih.gov/articles/PMC12264770/]
- 3. Revealing region-specific biofilm viscoelastic properties by ... [https://www.nature.com/articles/s41522-016-0005-y]
- 4. Revealing the interfacial dynamics of Escherichia coli ... [https://www.degruyterbrill.com/document/doi/10.1515/arh-2025-0031/html?srsltid=AfmBOoq3DEqcq_l9Hcs21G6NCex9pTPSXgg2vlz7j0hc_V8KIDW0AhsI]
- 5. Creep Compliance of Carbon Black-Filled Rubber ... [https://www.mdpi.com/2073-4360/17/13/1809]
- 6. Analysis of biofilm assembly by large area automated AFM [https://www.nature.com/articles/s41522-025-00704-y]
- 7. Oscillatory Microrheology, Creep Compliance and Stress ... [https://www.frontiersin.org/journals/physics/articles/10.3389/fphy.2021.711860/full]
- 8. New Methodologies as Opportunities in the Study of ... [https://www.mdpi.com/2076-2607/13/5/1062]
- 9. pyRheo: an open-source Python package for complex rheology [https://pubs.rsc.org/en/content/articlehtml/2025/dd/d5dd00021a]
- 10. The EPS Matrix: The “House of Biofilm Cells” - PMC [https://pmc.ncbi.nlm.nih.gov/articles/PMC2168682/]
- 11. Biofilm Matrixome: Extracellular Components in Structured ... [https://www.sciencedirect.com/science/article/pii/S0966842X20300871]
- 12. Biofilm Cohesiveness Measurement Using a Novel Atomic ... [https://pmc.ncbi.nlm.nih.gov/articles/PMC1892862/]
- 13. Rheological and tribological characterisation of ... [https://www.sciencedirect.com/science/article/pii/S2772502224002622]
- 14. Biofilm mechanics: Implications in infection and survival [https://pmc.ncbi.nlm.nih.gov/articles/PMC7798440/]
- 15. Phages against Pathogenic Bacterial Biofilms and Biofilm ... [https://pmc.ncbi.nlm.nih.gov/articles/PMC8875263/]
- 16. Absolute Quantitation of Bacterial Biofilm Adhesion and ... [https://pmc.ncbi.nlm.nih.gov/articles/PMC2711294/]
- 17. Atomic force microscopy: A nanobiotechnology for cellular ... [https://www.sciencedirect.com/science/article/pii/S2790676023000420]
- 18. Material properties of biofilms – key methods for ... [https://pmc.ncbi.nlm.nih.gov/articles/PMC4504244/]
- 19. Genetically engineered phages and ... [https://www.sciencedirect.com/science/article/pii/S2405844024116970]
- 20. Bacterial amyloid formation: structural insights into curli ... [https://pmc.ncbi.nlm.nih.gov/articles/PMC4636965/]
- 21. Morphology and rheology of cellulose nanofibrils derived ... [https://link.springer.com/article/10.1007/s10570-016-0987-x]
- 22. Physicochemical, morphological, and rheological ... [https://www.sciencedirect.com/science/article/pii/S2666893924002159]
- 23. Structural analysis and architectural principles of the ... [https://www.nature.com/articles/s41467-023-38204-2]
- 24. Nucleation and growth of a bacterial functional amyloid at ... [https://pmc.ncbi.nlm.nih.gov/articles/PMC5580806/]
- 25. Revealing region-specific biofilm viscoelastic properties by means of... [https://www.nature.com/articles/s41522-016-0005-y?error=cookies_not_supported&code=10a54c82-7fb6-4189-a2f5-8677e3423664]
- 26. Electrostatic lipid–protein interactions sequester the curli ... [https://www.sciencedirect.com/science/article/pii/S0021925820328805]
- 27. Amyloid fibril-nanocellulose interactions and self-assembly [https://www.sciencedirect.com/science/article/pii/S0021979723003612]
- 28. Influence of calcium ions on the mechanical properties of a ... [https://pubmed.ncbi.nlm.nih.gov/11381972/]
- 29. Effect of divalent ions and a polyphosphate on composition ... [https://www.nature.com/articles/s41522-018-0058-1]
- 30. Article Absolute Quantitation of Bacterial Biofilm Adhesion ... [https://www.sciencedirect.com/science/article/pii/S0006349509004226]
- 31. Revealing the interfacial dynamics of Escherichia coli ... [https://www.degruyterbrill.com/document/doi/10.1515/arh-2025-0031/html?srsltid=AfmBOoqOjFgITQQ8cQ2CrYZKnxrf4--Wu-AkaAhGPtlNIlZ_mMG3ypgf]
- 32. Reproducible 3D bioprinting of Streptococcus mutans to ... [https://pmc.ncbi.nlm.nih.gov/articles/PMC12584641/]
- 33. Atomic Force Microscopy Vs Nanoindentation [https://eureka.patsnap.com/report-atomic-force-microscopy-vs-nanoindentation-detail-vs-force-measurement]
- 34. analysis and critical review | npj Biofilms and Microbiomes [https://www.nature.com/articles/s41522-018-0062-5]
- 35. Advances in nanomechanical property mapping by atomic ... [https://pubs.rsc.org/en/content/articlehtml/2025/na/d5na00702j]
- 36. The use of atomic force microscopy for studying ... [https://www.sciencedirect.com/science/article/abs/pii/S0927776501002338]
- 37. The viscoelastic behavior of dental adhesives [https://pubmed.ncbi.nlm.nih.gov/18579198/]
- 38. What does 2025 have in store for AFM? - NuNano [https://www.nunano.com/blog/2025/1/26/what-does-2025-have-in-store-for-afm]
- 39. Revealing the interfacial dynamics of Escherichia coli ... [https://www.degruyterbrill.com/document/doi/10.1515/arh-2025-0031/html?srsltid=AfmBOor94dNIvt2KyEsJTT6xjl4EdO4Xtr5YBkr5A5vmTXadbfybJcWC]
- 40. Alginate exopolymer significantly modulates the ... [https://www.nature.com/articles/s41522-025-00718-6]
- 41. New Methodologies as Opportunities in the Study of Bacterial ... [https://pmc.ncbi.nlm.nih.gov/articles/PMC12114119/]
- 42. Microfluidics unveils role of gravity and shear stress on ... [https://www.nature.com/articles/s41522-025-00744-4]
- 43. Biofilms Exposed: Innovative Imaging and Therapeutic ... [https://pmc.ncbi.nlm.nih.gov/articles/PMC12466655/]
- 44. Rheometer Market Outlook 2025-2032 [https://www.intelmarketresearch.com/rheometer-market-market-15108]
- 45. Sampling and Homogenization Strategies Significantly ... [https://pmc.ncbi.nlm.nih.gov/articles/PMC4619754/]
- 46. Stirring Up Success in Sample Preparation Using ... [https://www.labmanager.com/stirring-up-success-in-sample-preparation-using-advanced-homogenization-techniques-32325]
- 47. applications of atomic force microscopy in disease [https://link.springer.com/article/10.1007/s12551-025-01306-w]
- 48. unveiling foodborne viruses with biophysical tools [https://www.nature.com/articles/s44298-025-00107-y]
- 49. An end-to-end approach for single-cell infrared absorption ... [https://jnanobiotechnology.biomedcentral.com/articles/10.1186/s12951-024-02674-3]
- 50. AFM BioMed Conference 2025 - IBEC Events [https://events.ibecbarcelona.eu/afm-biomed-2025/]
- 51. Mechanical properties of the superficial biofilm layer ... [https://pubs.rsc.org/en/content/articlehtml/2016/sm/c6sm00687f]
- 52. Mapping of Bacterial Biofilm Local Mechanics by Magnetic ... [https://pmc.ncbi.nlm.nih.gov/articles/PMC3446665/]
- 53. A multiplexed magnetic tweezer with precision particle ... [https://jbioleng.biomedcentral.com/articles/10.1186/s13036-017-0091-2]
- 54. Construction and operation of high-resolution magnetic ... [https://www.sciencedirect.com/science/article/abs/pii/S0076687923004068]
- 55. Single-molecule magnetic tweezers to unravel protein folding ... [https://pmc.ncbi.nlm.nih.gov/articles/PMC11885773/]
- 56. Mechanical Comparison of Escherichia coli Biofilms with ... [https://pubmed.ncbi.nlm.nih.gov/40503701/]
- 57. Microscopy Methods for Biofilm Imaging: Focus on SEM ... [https://pmc.ncbi.nlm.nih.gov/articles/PMC7828176/]
- 58. Atomic Force Microscopy of Biofilms—Imaging, Interactions ... [https://www.intechopen.com/chapters/50739]
- 59. Small-Scale Heterogeneity in Drinking Water Biofilms - PMC [https://pmc.ncbi.nlm.nih.gov/articles/PMC6828615/]
- 60. Small-Scale Heterogeneity in Drinking Water Biofilms [https://pubmed.ncbi.nlm.nih.gov/31736893/]
- 61. Representative sampling of natural biofilms - SpringerPlus [https://springerplus.springeropen.com/articles/10.1186/s40064-016-2448-2]
- 62. Comparative Study of Different Sampling Methods ... [https://www.frontiersin.org/journals/microbiology/articles/10.3389/fmicb.2022.892181/full]
- 63. Revealing the interfacial dynamics of Escherichia coli ... [https://www.degruyterbrill.com/document/doi/10.1515/arh-2025-0031/html?srsltid=AfmBOooPnYM_NHcWgRdmcmwJkAxvd2x1CrdRtAoVfBYsmZeW66ShAik8]
- 64. The mechanical properties of microbial surfaces and biofilms [https://www.sciencedirect.com/science/article/pii/S2468233019300064]
- 65. Avoiding inaccurate interpretations of rheological ... [https://www.sciencedirect.com/science/article/abs/pii/S000888461500126X]
- 66. Viscoelastic time responses of polymeric cell substrates ... [https://pubs.rsc.org/en/content/articlelanding/2025/nr/d5nr01790d]
- 67. Protocol for measuring the Young's modulus of organoids ... [https://www.sciencedirect.com/science/article/pii/S266616672500231X]
- 68. A review of bacterial biofilm formation and growth [https://link.springer.com/article/10.1007/s13367-023-00078-7]
- 69. Scanning Probe Microscopy Calibrations and Standards [https://www.nist.gov/programs-projects/scanning-probe-microscopy-calibrations-and-standards]
- 70. Standardizing Force Reconstruction in Dynamic Atomic ... [https://arxiv.org/abs/2506.06467]
- 71. Evaluating large language model agents for automation of ... [https://www.nature.com/articles/s41467-025-64105-7]
- 72. Biofilm viscoelasticity and nutrient source location control ... [https://www.nature.com/articles/s41598-021-95542-1]
- 73. Analysis of the Hertz Contact Model for Evaluating ... [https://www.mdpi.com/2073-4360/17/22/3018]
- 74. Simulation of the adhesion force of particles based on JKR ... [https://www.sciencedirect.com/science/article/abs/pii/S2468023025015524]
- 75. Tech Note: Microrheological Measurements on Soft ... [https://www.bruker.com/en/products-and-solutions/microscopes/bioafm/resource-library/microrheological-measurements-on-soft-materials-with-atomic-force-microscopy.html]
- 76. Comparison of Two Models of Biofilm Formation on ... [https://pubmed.ncbi.nlm.nih.gov/41265798/]
- 77. Morphogenesis of confined biofilms: how mechanical ... [https://pubs.rsc.org/en/content/articlehtml/2025/sm/d4sm01180e?page=search]
- 78. and nanoscale techniques for studying biofilm-mineral ... [https://www.sciencedirect.com/science/article/abs/pii/S0580951723000107]
- 79. Revealing the interfacial dynamics of Escherichia coli gr... [https://www.degruyterbrill.com/document/doi/10.1515/arh-2025-0031/html?srsltid=AfmBOorOYj2cybwKLeDnPewYJMlKYlUvFEbHAl6tGSm5bLFHXOUm4zM6]
- 80. Impact of rheological properties on bacterial streamer formation [https://pmc.ncbi.nlm.nih.gov/articles/PMC8526168/]
- 81. Measuring the mechanics of biofilms at multiple lengthscales [https://spie.org/news/5754-measuring-the-mechanics-of-biofilms-at-multiple-lengthscales]
- 82. Determination of mechanical properties of biofilms by ... [https://www.sciencedirect.com/science/article/pii/S0043135418307000]
- 83. Biofilm mechanics: Implications in infection and survival [https://www.sciencedirect.com/science/article/pii/S2590207519300176]
- 84. Measuring viscoelasticity of soft biological samples using atomic ... [https://pubs.rsc.org/en/content/articlehtml/2020/sm/c9sm01020c]
- 85. Viscoelasticity of biofilms and their recalcitrance to ... [https://pmc.ncbi.nlm.nih.gov/articles/PMC4398279/]
- 86. Comparative study of cell mechanics methods - PMC [https://pmc.ncbi.nlm.nih.gov/articles/PMC6582221/]
- 87. Correlating confocal microscopy and atomic force ... [https://www.nature.com/articles/srep19686]
- 88. Characterization of biofilm formed by multidrug resistant ... [https://pmc.ncbi.nlm.nih.gov/articles/PMC7569125/]
- 89. Surface properties influence marine biofilm rheology, with ... [https://pubs.rsc.org/en/content/articlehtml/2023/sm/d2sm01647h]
- 90. Atomic force microscopy in biofilm study [https://pubmed.ncbi.nlm.nih.gov/24793174/]
- 91. Revealing the interfacial dynamics of Escherichia coli ... [https://www.degruyterbrill.com/document/doi/10.1515/arh-2025-0031/html?srsltid=AfmBOopSrX6xh_or-RCjxQVd92aI80MUyi6P-XrOoaEEQCEmhwwWhsxh]