Agent-Based Modeling of Biofilm Persister Dynamics: From Mechanisms to Therapeutic Optimization
This article provides a comprehensive overview of agent-based modeling (ABM) for investigating biofilm persister cell dynamics, a major contributor to chronic infections and antimicrobial treatment failure.
Agent-Based Modeling of Biofilm Persister Dynamics: From Mechanisms to Therapeutic Optimization
Abstract
This article provides a comprehensive overview of agent-based modeling (ABM) for investigating biofilm persister cell dynamics, a major contributor to chronic infections and antimicrobial treatment failure. Aimed at researchers, scientists, and drug development professionals, it explores the foundational principles of bacterial persistence and the unique capacity of ABMs to simulate biofilm heterogeneity. The content delves into methodological approaches for constructing and implementing ABMs, including the integration of environmental switching rules. It further examines the application of these models for troubleshooting treatment failures and optimizing therapeutic strategies, such as periodic antibiotic dosing. Finally, the article addresses model validation and compares ABM with other computational approaches, synthesizing key insights to guide future anti-biofilm drug development and combat the global health threat of antimicrobial resistance.
Understanding the Persister Problem: Why Biofilms Resist Eradication
Persister cells are a subpopulation of bacterial cells within an isogenic culture that exhibit transient, non-heritable tolerance to high concentrations of antimicrobial agents, distinct from genetically resistant mutants [1] [2]. First identified by Bigger in 1944 when he observed that penicillin could not completely eradicate a small fraction of Staphylococcus cells, these surviving "persisters" remained fully susceptible to the antibiotic upon re-culturing [1] [3]. This phenomenon represents a key survival strategy for bacterial populations facing environmental stress, such as antibiotic exposure [4].
The study of persister cells is critically important in the context of chronic and biofilm-associated infections, where they are a major contributor to treatment failure and disease relapse [1] [5]. It is estimated that over 65% of all microbial infections involve biofilms, which provide an ideal environment for persister formation and protection [2]. Understanding the distinction between phenotypic tolerance, as exhibited by persisters, and genuine genetic resistance is fundamental for developing more effective therapeutic strategies against persistent infections [4].
Table 1: Key Characteristics Differentiating Persister Cells from Other Bacterial Survival States
| Characteristic | Persister Cells | Genetically Resistant Cells | Viable but Non-Culturable (VBNC) Cells |
|---|---|---|---|
| MIC Change | No change in MIC [4] | Elevated MIC [4] | No change in MIC [4] |
| Genetic Basis | Non-heritable, phenotypic variation [2] [4] | Heritable genetic mutations or acquired genes [4] | Non-heritable, physiological state [4] |
| Population Proportion | Small subpopulation (typically <1%) [4] | Entire population [4] | Can be majority of population under stress [4] |
| Metabolic State | Dormant or slow-growing [1] [4] | Normal growth [4] | Deeply dormant, very low metabolism [4] |
| Reversibility | Resumes growth after stress removal [1] | Stable phenotype [4] | Requires specific stimuli to resuscitate [4] |
| Role in Infections | Chronic infections, relapse [1] [2] | Treatment failure across infection types [6] | Chronic, unresolved infections [4] |
Molecular Mechanisms of Persister Formation
Persister formation is governed by sophisticated molecular mechanisms that enable bacterial populations to bet-hedge against sudden environmental stresses. These interconnected networks regulate bacterial physiology to induce a transient, dormant state that protects against antimicrobial agents.
Toxin-Antitoxin (TA) Systems
TA systems are genetic modules consisting of a stable toxin and its cognate unstable antitoxin. Under normal conditions, the antitoxin neutralizes the toxin. During stress conditions, proteolytic degradation of the antitoxin allows the toxin to act on its target, leading to growth arrest and persistence induction [4].
- Type I TA Systems: Toxins such as TisB and HokB insert into the bacterial inner membrane, dissipating the proton motive force and reducing ATP levels, which promotes a dormant, persistent state [4].
- Type II TA Systems: The HipA toxin phosphorylates glutamyl-tRNA synthetase (GltX), leading to accumulation of uncharged tRNA. This triggers the stringent response via RelA and increased (p)ppGpp alarmone synthesis, inducing persistence [4].
Stringent Response and (p)ppGpp Signaling
Nutrient starvation in biofilm environments activates the stringent response, a key pathway in persister formation [7]. This response is mediated by the alarmone (p)ppGpp, synthesized by RelA and SpoT enzymes in Pseudomonas aeruginosa [7]. Elevated (p)ppGpp levels lead to:
- Transcriptional reprogramming that redirects resources from growth to maintenance
- Downregulation of ribosomal RNA synthesis
- Induction of stress resistance pathways
- Metabolic dormancy that characterizes the persister state [4]
SOS Response and Bacterial Stress Signaling
DNA damage from antibiotic exposure, particularly by fluoroquinolones, activates the SOS response [2] [7]. This global stress response induces expression of DNA repair genes and can promote persistence through mechanisms that include:
- Induction of TisB toxin expression in E. coli, which decreases ATP levels and cellular activity [7]
- Cell cycle arrest to allow DNA repair before replication
- In biofilm conditions, SOS-induced persistence may occur independently of TA systems [7]
Diagram 1: Molecular Pathways to Persister Formation. Multiple stress signals converge to induce the dormant, antibiotic-tolerant persister state through coordinated regulation of cellular physiology.
Quantitative Analysis of Persistence
The level of bacterial persistence varies significantly across species, growth conditions, and antibiotic classes. Systematic analysis of these variations provides crucial insights for both experimental design and therapeutic planning.
Table 2: Persistence Levels Across Bacterial Species and Conditions
| Bacterial Species | Growth Phase | Antibiotic Class | Persistence Level | Key Observations |
|---|---|---|---|---|
| Escherichia coli | Exponential phase | Multiple classes | ~0.01% | Lower persistence in exponential vs stationary phase [3] |
| Staphylococcus aureus | Stationary phase | β-lactams | 1-5% | Higher persistence in stationary phase [3] |
| Pseudomonas aeruginosa | Biofilm | Fluoroquinolones | 0.1-1% | Mature biofilms show increased persister fractions [7] |
| Acinetobacter baumannii | Not specified | Multiple classes | ~0.01% | Among lowest persistence levels observed [3] |
| Enterococcus faecium | Not specified | Multiple classes | Up to 100% | Extremely high persistence observed in some studies [3] |
| Multiple species | Biofilm vs Planktonic | Aminoglycosides | 10-1000x higher in biofilms | Biofilm environment strongly promotes persistence [5] |
Analysis of persistence data reveals several important trends:
- Gram-positive bacteria generally demonstrate higher persistence levels compared to Gram-negative species [3]
- Membrane-active antibiotics typically admit the fewest persisters across bacterial species [3]
- Rich media and exponential growth conditions generally result in lower persistence compared to nutrient-limited conditions [3]
- Biofilm growth dramatically increases persister fractions by 10- to 1000-fold compared to planktonic cultures [5]
Experimental Protocols for Persister Research
Protocol: Time-Kill Assay for Persister Quantification
The time-kill assay is the gold standard method for quantifying persister cells based on their characteristic biphasic killing kinetics in response to bactericidal antibiotics [3] [4].
Materials:
- Bacterial culture in mid-exponential or stationary phase
- Appropriate bactericidal antibiotic at 5-10× MIC concentration
- Sterile phosphate-buffered saline (PBS)
- Fresh culture medium
- Serial dilution tubes and agar plates for colony counting
Procedure:
- Prepare bacterial culture to desired growth phase (OD₆₀₀ ≈ 0.5 for exponential, overnight for stationary)
- Add antibiotic at high concentration (typically 5-10× MIC) to kill regular cells
- Incubate culture under appropriate conditions while taking samples at predetermined time points (e.g., 0, 2, 4, 8, 24 hours)
- At each time point, remove aliquots, wash with PBS to remove antibiotic, and perform serial dilutions
- Plate appropriate dilutions on antibiotic-free agar plates
- Count colonies after 24-48 hours incubation to determine viable cell counts
- Plot surviving fraction versus time to observe characteristic biphasic killing curve
Expected Results:
- Initial rapid killing phase (several log reduction in first 2-8 hours)
- Subsequent plateau phase where killing rate dramatically decreases
- Persister fraction calculated as percentage of initial population surviving at plateau phase
Troubleshooting:
- Verify antibiotic stability throughout experiment
- Ensure complete antibiotic removal before plating through adequate washing
- Include antibiotic-free control to monitor natural growth/death
- Use fresh culture medium for dilution to support recovery of persisters
Protocol: Biofilm Persister Isolation and Analysis
This protocol specifically addresses the isolation and characterization of persister cells from mature biofilms, where they occur at highest frequency [5].
Materials:
- Biofilm growth system (flow cell, Calgary device, or microtiter plate)
- Sterile scraping devices or sonication equipment
- Enzyme cocktails for matrix disruption (e.g., DNase I, dispersin B)
- Antibiotic solution at high concentration (10-100× MIC)
- Cell strainers or filters for size selection
Procedure:
- Grow mature biofilms for 48-72 hours under appropriate conditions
- Gently wash biofilm with sterile saline to remove non-adherent cells
- Disrupt biofilm using physical (scraping, sonication) or enzymatic methods
- Resuspend biofilm cells in fresh medium containing high antibiotic concentration
- Incubate for 24 hours to kill non-persister cells
- Wash cells to remove antibiotic and plate on fresh medium
- Isolate surviving colonies for further characterization
Characterization Methods:
- MIC testing to confirm unchanged susceptibility
- Metabolic activity assays (e.g., resazurin reduction)
- Gene expression analysis of persistence-related pathways
- Microscopic examination of cell morphology
Diagram 2: Biofilm Persister Isolation Workflow. This protocol enables isolation of persister cells from mature biofilms through selective antibiotic killing of non-persister populations.
The Scientist's Toolkit: Essential Reagents and Materials
Table 3: Key Research Reagent Solutions for Persister Studies
| Reagent/Category | Specific Examples | Function/Application | Experimental Notes |
|---|---|---|---|
| Bactericidal Antibiotics | Ciprofloxacin, Ofloxacin, Amikacin, Tobramycin | Induction and quantification of persister populations | Use at 5-10× MIC concentrations; verify stability during long incubations [3] [7] |
| Biofilm Disruption Agents | DNase I, dispersin B, proteinase K | Breakdown of extracellular matrix for cell recovery | Enzymatic treatment preserves cell viability better than harsh physical methods [8] [5] |
| Viability Stains | Propidium iodide, SYTO9, resazurin | Differentiation of live/dead cells and metabolic activity | Combine with culturing methods as stains may not detect dormant persisters [4] |
| Metabolic Inhibitors | Carbonyl cyanide m-chlorophenyl hydrazone (CCCP) | Artificial induction of low-energy state for persistence studies | Positive control for energy depletion-mediated persistence [3] |
| Molecular Biology Tools | qPCR reagents, RNA sequencing kits | Analysis of gene expression in persister cells | Requires specialized persister enrichment protocols due to low abundance [4] |
| Model Organisms | E. coli (with hipA7 mutation), P. aeruginosa (cystic fibrosis isolates) | High-persister mutants for mechanistic studies | Clinical isolates often show higher persistence than lab strains [2] [7] |
Implications for Agent-Based Modeling of Biofilm Dynamics
The integration of persister cell dynamics into agent-based models (ABMs) of biofilms requires careful parameterization of the phenotypic switching behaviors and metabolic states characterized in this document. ABMs represent each cell as an autonomous agent with defined rules, making them uniquely suited to capture the heterogeneity and spatiotemporal dynamics of persister formation within biofilms [9].
Critical Parameters for Model Integration:
- Phenotypic Switching Rates: The stochastic transition between normal and persister states occurs at baseline rates of ~0.01-1% under non-stress conditions, increasing significantly under nutrient limitation or antibiotic exposure [10]
- Spatial Gradients: Nutrient and oxygen gradients within biofilms create microenvironments that preferentially support persister accumulation in deeper layers where metabolic activity is lowest [7] [10]
- Metabolic State Transitions: ABMs should incorporate (p)ppGpp-mediated stringent response activation under nutrient limitation and ATP depletion as key triggers for phenotypic switching [4]
- Matrix-Mediated Protection: The extracellular polymeric substance matrix not retards antibiotic penetration but creates heterogeneous microenvironments that promote dormancy [5]
Model Validation Approaches:
- Quantitative comparison with time-kill curve data showing characteristic biphasic patterns
- Spatial analysis of persister distribution matching experimental observations of accumulation in biofilm depths
- Assessment of resuscitation dynamics following antibiotic cessation
- Evaluation of multidrug tolerance patterns consistent with phenotypic rather than genetic mechanisms
The molecular mechanisms detailed in this document provide the biological foundation for developing more predictive computational models of biofilm treatment failure and for designing novel anti-persister therapeutic strategies.
Bacterial biofilms represent a protected mode of growth that shelters persistent subpopulations, contributing significantly to chronic infections and antimicrobial treatment failures. Within the structured environment of a biofilm, microbial communities develop heterogeneous niches that support phenotypic variants with remarkable tolerance to antimicrobial agents. The spatial organization and metabolic interactions within these communities create unique microenvironments that are critical to understanding persistence mechanisms. Agent-based modeling (ABM) has emerged as a powerful computational approach to elucidate the complex dynamics of biofilm-associated persister cells, integrating individual bacterial behaviors to reveal emergent population-level patterns that are difficult to capture with traditional experimental methods [9] [11]. This Application Note explores the biofilm niche through the lens of agent-based modeling, providing detailed protocols and analytical frameworks for investigating persister dynamics.
The Biofilm Niche and Persister Cell Dynamics
Architectural and Metabolic Features of Protective Biofilm Niches
The biofilm niche represents a complex, three-dimensional environment where bacterial cells are encased in an extracellular polymeric substance (EPS). This structured community exhibits functional heterogeneity, with metabolic gradients and varying microenvironments supporting different physiological states [12]. The spatial arrangement of cells within this matrix is not random but is shaped by metabolic interactions between community members [11].
Agent-based models have demonstrated that different types of metabolic interactions yield characteristically different biofilm structures. Competitive interactions tend to produce sparse, segregated patches, while cooperative interactions (commensalism and mutualism) foster highly intermixed communities with small, interconnected sectors [11]. These structural differences directly impact the distribution and survival of persister cells within the biofilm. The emergent structures from ABM simulations provide insight into how localized interactions at the cellular level give rise to population-level patterns of persistence.
Nutrient Gradients and Phenotypic Switching
A key mechanism driving persister formation in biofilms is nutrient limitation, particularly in the deeper layers of the biofilm structure where diffusion is constrained. Mathematical models coupling nutrient transport with bacterial dynamics have revealed how local nutrient concentration controls the phenotypic switching between proliferative and persister states [12]. These models incorporate switching rates between proliferative and persister phenotypes that depend on local nutrient concentration through specific thresholds, enabling adaptation across nutrient-poor, intermediate, and nutrient-rich regimes [12].
Simulations from these models demonstrate that nutrient limitation produces a high and sustained proportion of persister cells even when overall biomass is reduced. In contrast, nutrient-rich conditions support reversion to proliferative growth and lead to greater biomass accumulation. The models predict that persister populations peak at times that vary with nutrient availability, and these peaks coincide with critical turning points in biofilm growth, identifying potential intervention windows for therapeutic strategies [12].
Table 1: Key Characteristics of Biofilm Persister Subpopulations
| Characteristic | Description | Impact on Persistence |
|---|---|---|
| Metabolic State | Dormant or slow-growing | Antibiotic tolerance |
| Spatial Distribution | Non-uniform, often in deeper layers | Protection from antimicrobial penetration |
| Phenotypic Switching | Stochastic or responsive to stress | Reseeding capability after treatment |
| Environmental Triggers | Nutrient limitation, oxidative stress | Induction of persistence programs |
Quantitative Frameworks for Temporal and Structural Analysis
Temporal Mapping of Biofilm Lifecycle (TMBL)
The Temporal Modelling of the Biofilm Lifecycle (TMBL) assay provides a statistical framework for quantitatively comparing biofilm communities across time, species, and media conditions [13]. This approach employs well-characterized crystal violet biomass accrual and planktonic cell density assays across clinically relevant time courses, expanding statistical analysis to include kinetic information. Measurements from TMBL can be condensed into response features that inform the time-dependent behavior of both adherent biomass and planktonic cell populations [13].
The TMBL protocol has demonstrated that metal availability significantly impacts biofilm formation, consistent with the concept of nutritional immunity where metal availability drives transcriptomic and metabolomic changes in pathogens like Staphylococcus aureus and Pseudomonas aeruginosa [13]. This kinetic analysis represents a statistically and biologically rigorous approach to studying the biofilm lifecycle as a time-dependent process, essential for understanding persister dynamics.
Agent-Based Modeling of Spatial Dynamics
Agent-based modeling provides a powerful computational framework for simulating the spatiotemporal development of biofilms and the emergence of persister subpopulations. Unlike traditional population-level approaches, ABM represents individual bacterial cells as autonomous agents with specific properties and behavioral rules [9] [14]. These models can incorporate metabolic networks, diffusion processes, and cell-cell interactions to simulate emergent biofilm structures [11].
ABM simulations have revealed how different metabolic interaction types shape biofilm architecture and population dynamics. In models of gut mucosal bacterial communities, competitive interactions resulted in segregated patches while cross-feeding mutualism fostered highly intermixed structures [11]. These architectural differences directly influence the distribution and survival of persister cells within the biofilm matrix. The spatial organization emerging from these interactions affects how nutrients and antimicrobials penetrate the biofilm, creating heterogeneous microenvironments that support persistent subpopulations.
Table 2: Agent-Based Model Parameters for Biofilm Persister Dynamics
| Parameter Category | Specific Parameters | Impact on Persister Formation |
|---|---|---|
| Bacterial Properties | Growth rate, metabolic state, mutation rate | Determines switching to persistent state |
| Environmental Factors | Nutrient concentration, pH, antimicrobial presence | Induces stress responses and persistence |
| Spatial Considerations | Diffusion coefficients, local cell density, EPS production | Affects microenvironment heterogeneity |
| Interaction Rules | Metabolic cross-feeding, quorum sensing, toxin production | Modulates community behavior and structure |
Experimental Protocols
Protocol: Bead Model for Experimental Evolution of Biofilm Adaptations
Principle
This protocol utilizes a bead-based model to study evolution throughout the entire biofilm lifecycle, including surface attachment, biofilm assembly, dispersal, and re-colonization [15]. The method selects for biofilm-adapted mutants that can disperse from colonized beads and reassemble biofilms on new surfaces.
Materials
- Bacterial strains: Pseudomonas fluorescens SBW25 or other target species
- Growth media: Appropriate liquid medium (e.g., Lysogeny Broth)
- Polystyrene beads: Sterile, suitable for biofilm formation
- Culture vessels: Test tubes or multi-well plates
- Transfer instruments: Sterile forceps or pipettes
Procedure
- Inoculate bacterial cultures in test tubes containing growth media and a single polystyrene bead.
- Incubate for 24 hours under appropriate conditions to allow biofilm formation on the bead surface.
- Aseptically transfer the biofilm-colonized bead to a new test tube with fresh media and a sterile bead.
- Repeat this serial transfer daily to select for biofilm-adapted mutants.
- Monitor population dynamics and isolate variants for genomic and phenotypic characterization.
- Sequence genomic DNA of evolved clones to identify mutations in biofilm-related genes [15].
Applications
This method enables investigation of biofilm evolution under various environmental stressors (nutrients, antibiotics) and identification of genetic pathways involved in biofilm adaptation and potential persister formation [15].
Protocol: Temporal Mapping of Biofilm Lifecycle (TMBL) Assay
Principle
The TMBL assay incorporates time-dependence and statistical analysis into the assessment of biofilm dynamics, using established crystal violet staining methods across an extended time course to capture kinetic information [13].
Materials
- Bacterial strains: Staphylococcus aureus Newman and Pseudomonas aeruginosa PAO1
- Growth media: Tryptic soy broth or other appropriate media
- 96-well plates: Tissue-culture treated, clear polystyrene flat-bottom plates
- Staining solution: 0.1% crystal violet solution
- Destaining solution: 30% acetic acid
- Plate reader: For measuring optical density
Procedure
- Grow bacterial cultures overnight under standard conditions.
- Dilute cultures to standardized inoculum density in fresh media.
- Dispense 200μL aliquots into 96-well plates, including appropriate negative controls.
- Incubate plates under appropriate conditions for varying time periods (e.g., 4, 8, 12, 16, 20, 24 hours).
- At each time point, carefully remove planktonic cells by washing.
- Fix adherent cells with heat or alcohol and stain with crystal violet solution.
- Destain with acetic acid and measure optical density at 595nm.
- Analyze kinetic data using statistical methods to derive time-dependent response features [13].
Applications
The TMBL assay enables quantitative comparison of biofilm communities across time, species, and environmental conditions, particularly useful for studying the effects of nutritional immunity and metal availability on biofilm formation [13].
Visualization of Key Mechanisms
Cyclic di-GMP Signaling in Biofilm Formation
Diagram 1: Cyclic di-GMP Signaling Pathway in Biofilm Regulation
The bis-(3'-5')-cyclic dimeric guanosine monophosphate (cyclic di-GMP) signaling network is a key regulator of the transition between planktonic and biofilm lifestyles in bacteria [15]. High cellular levels of cyclic di-GMP promote surface attachment and biofilm production through the activation of matrix component production, while low levels are associated with increased motility and bacterial dispersal [15]. Mutations in regulatory pathways such as wsp, yfiBNR, and morA can lead to constitutive activation of diguanylate cyclases (DGCs), resulting in overproduction of cyclic di-GMP and enhanced biofilm formation [15].
Nutrient-Dependent Phenotypic Switching to Persistence
Diagram 2: Nutrient-Dependent Phenotypic Switching to Persistence
Continuum models coupling nutrient transport with bacterial dynamics have revealed how local nutrient concentration controls phenotypic switching between proliferative and persister states [12]. These models incorporate switching rates that depend on local nutrient concentration through specific thresholds, enabling adaptation across nutrient-poor, intermediate, and nutrient-rich regimes [12]. Simulations show that nutrient limitation produces a high and sustained proportion of persister cells even when biomass is reduced, creating a protected reservoir within the biofilm that can survive antimicrobial treatment and subsequently reseed growth [12].
The Scientist's Toolkit: Research Reagent Solutions
Table 3: Essential Research Reagents for Biofilm Persistence Studies
| Reagent/Category | Function/Application | Examples/Specifications |
|---|---|---|
| Crystal Violet Assay | Quantification of adherent biofilm biomass | 0.1% solution in water; OD595 measurement post-destaining [13] |
| Metal Chelators | Studying nutritional immunity and metal limitation | TPEN, Chelex; S100 proteins (calprotectin, S100A7) [13] |
| Polystyrene Beads | Surface for biofilm growth in evolution models | Sterile, suitable for bacterial attachment and serial transfer [15] |
| Synthetic Growth Media | Mimicking in vivo conditions for biofilm studies | Synthetic cystic fibrosis sputum medium (SCFM2) [16] |
| Agent-Based Modeling Platforms | Computational simulation of biofilm dynamics | iDynoMiCS, NetLogo, BacArena [9] [14] |
| Metabolic Modeling Tools | Constraint-based analysis of microbial communities | MICOM, genome-scale metabolic models (GEMs) [14] |
The integration of experimental approaches with agent-based modeling provides a powerful framework for investigating the biofilm niche as a protected environment for persistent subpopulations. The structured methodologies outlined in this Application Note—including the bead model for experimental evolution, the TMBL assay for kinetic analysis, and ABM for computational simulation—enable researchers to dissect the complex dynamics of biofilm-associated persister cells. Understanding how spatial organization, metabolic interactions, and phenotypic switching contribute to persistence mechanisms will inform the development of novel therapeutic strategies targeting these recalcitrant subpopulations. The continued refinement of these protocols and models promises to enhance our ability to combat chronic biofilm-associated infections.
Application Notes
This document provides a synthesis of the key mechanisms underlying bacterial persistence, with a specific focus on supporting the parameterization and validation of agent-based models (ABMs) for studying biofilm persister dynamics. Persisters are defined as a subpopulation of genetically susceptible, non-growing, or slow-growing bacteria that survive exposure to lethal stresses, such as antibiotics, and can regrow once the stress is removed [1] [17]. Their formation is a major cause of chronic and relapsing infections and presents a significant challenge for effective antimicrobial therapy [1] [18]. Understanding the mechanistic basis of persistence is crucial for developing more effective treatments and for creating accurate computational models of bacterial population dynamics.
For ABM development, the phenotypic heterogeneity of persisters is a critical consideration. Persisters exist in a continuum of metabolic states, from shallow to deep persistence, and can be broadly categorized as Type I (induced by external environmental factors, non-growing) or Type II (spontaneously generated, slow-growing) [1]. This heterogeneity must be reflected in the state variables and transition rules governing individual bacterial agents within a model.
The following sections detail the core mechanisms, which often function in an interconnected manner, providing a framework for implementing agent behaviors and interactions in an ABM simulating a polymicrobial biofilm environment [9].
Dormancy and Metabolic Control
Dormancy, a state of metabolic quiescence, is a fundamental mechanism enabling persistence. By halting or drastically reducing metabolic activity, dormant cells avoid the corrupting actions of most antibiotics, which typically target active cellular processes [17] [19].
- Metabolic Profile: Persister cells exhibit a distinct metabolic signature. Key metabolic pathways, including glycolysis, the tricarboxylic acid (TCA) cycle, and protein synthesis, are often downregulated [20]. This global reduction in metabolic activity conserves energy and minimizes targets for antibiotics. However, certain alternative pathways, such as the glyoxylate cycle, may be upregulated, suggesting a delicate metabolic reprogramming that supports survival under stress [20].
- Connection to ABM: In an ABM, an agent's metabolic state can be a key internal variable. Transition to a dormant state can be triggered by local environmental conditions within the biofilm, such as nutrient or oxygen gradients [18] [21]. The depth of dormancy (and thus the level of persistence) can be linked to the severity and duration of these local stresses.
Toxin-Antitoxin (TA) Modules
TA systems are genetic modules composed of a stable toxin and a labile antitoxin. They are widely regarded as crucial regulators of bacterial persistence by actively inducing a dormant state [17] [22] [23].
- Mechanism of Action: Under normal growth, the antitoxin neutralizes the toxin. Under stress, labile antitoxins are degraded by proteases (e.g., Lon protease), freeing the toxin to disrupt essential cellular processes such as translation, DNA replication, or ATP synthesis, leading to growth arrest [17] [18] [23].
- Classification and Examples: TA systems are classified into multiple types (I-VIII) based on the nature and mode of action of the antitoxin [23]. The table below summarizes prominent TA systems linked to persistence.
Table 1: Key Toxin-Antitoxin Systems Associated with Bacterial Persistence
| TA System | Type | Toxin Mechanism | Impact on Persistence |
|---|---|---|---|
| HipBA [17] [19] | II | Phosphorylates glutamyl-tRNA synthetase, inhibiting translation. | hipA7 mutant increases persistence frequency up to 10,000-fold [19]. Deletion can reduce persistence in biofilms [19]. |
| MqsR/MqsA [17] [22] | II | MqsR is an mRNA interferase that cleaves mRNA at GCU sites, halting translation. | Deletion of mqsR reduces persistence levels. Overexpression increases persistence [17]. |
| RelE/RelB [17] | II | RelE cleaves mRNA, inhibiting translation. | Overproduction of RelE can lead to a 10,000-fold increase in persistence [17]. |
| TisB/IstR-1 [17] | I | TisB toxin decreases proton motive force and ATP levels. | Deletion of the tisAB-istR locus reduces persistence [17]. |
| HokB/SokB [19] | I | HokB provokes a collapse in membrane potential. | Positively correlated with high persistence via (p)ppGpp signaling [19]. |
- Connection to ABM: TA systems can be implemented as stochastic switches within individual agents. The probability of toxin activation can be a function of the agent's perception of external stress (e.g., antibiotic concentration, nutrient level). This provides a mechanistic basis for the transition from an active to a dormant state in the model [9].
Stress Responses
Environmental stresses trigger conserved signaling pathways that can lead to persister formation. These responses often interface directly with TA systems and dormancy pathways.
- The Stringent Response and (p)ppGpp: The alarmone guanosine tetraphosphate (ppGpp) is a central mediator of the stringent response, which is activated by nutrient starvation [17] [19]. Accumulation of (p)ppGpp leads to a dramatic reprogramming of cellular metabolism, inhibiting anabolic processes and promoting a state of dormancy. It can also directly activate certain TA modules [17] [19].
- SOS Response: This is a global response to DNA damage, often induced by antibiotics like fluoroquinolones. The SOS response can induce cell cycle arrest and DNA repair, contributing to a transient non-growing state that facilitates persistence [18] [19].
- Connection to ABM: Stress response pathways can be modeled as signal transduction modules that integrate inputs from the agent's local environment. The intracellular level of a molecule like (p)ppGpp can be a quantitative variable that influences the activation thresholds of other persistence mechanisms, such as TA systems [9].
Experimental Protocols
The following protocols are standard methods for investigating persister cells and the mechanisms described above. The data generated from these experiments are essential for quantifying parameters and validating outcomes in ABMs.
Protocol 1: Isolation and Quantification of Bacterial Persisters from Biofilms
This protocol details the procedure for generating and isolating persister cells from in vitro biofilms, a major reservoir for persisters [17] [20].
Workflow Diagram: Biofilm Persister Isolation
Materials:
- Strains: Relevant bacterial strains (e.g., E. coli, P. aeruginosa, C. albicans).
- Growth Medium: Appropriate broth and solid media (e.g., YNB with glucose for Candida [20]).
- Antibiotic Stock Solution: High-concentration stock of the antibiotic of interest (e.g., Amphotericin B, Ampicillin) in solvent (e.g., DMSO).
- Equipment: Sterile 24-well or 96-well polystyrene plates [20], centrifuge, vortex, incubator.
- Buffers: Phosphate-Buffered Saline (PBS), pH 7.2.
Procedure:
- Biofilm Formation: Prepare a standardized cell suspension (e.g., 1 × 10^7 cells/mL) in growth medium. Inoculate 1 mL of the suspension into each well of a 24-well plate. Incubate for 1.5 hours at 37°C with shaking (e.g., 80 rpm) to allow for cell adhesion. Aspirate the medium and gently wash each well with 1 mL of PBS to remove non-adherent cells. Add 1 mL of fresh growth medium to each well and incubate for 48 hours at 37°C with shaking to form mature biofilms [20].
- Antibiotic Treatment: Aspirate the medium from the mature biofilms. Add 1 mL of growth medium containing a lethal concentration of the antibiotic (e.g., 256 µg/mL Amphotericin B or 10x MIC of a bacterial antibiotic). Incubate the plates for a set period (e.g., 24 hours) at 37°C [20].
- Persister Cell Harvesting: After incubation, aspirate the antibiotic-containing medium. Wash the biofilms twice with 1 mL of PBS to remove the antibiotic. Add 1 mL of PBS to each well and harvest the biofilm cells by vigorously scraping the well bottom and vortexing the suspension [20].
- Viable Count and Persister Quantification: Serially dilute the harvested cell suspension in PBS. Plate appropriate dilutions onto solid media (e.g., SDA). Incubate the plates until colonies appear. Count the colony-forming units (CFU). The number of surviving CFU represents the persister population in the original biofilm [20].
Protocol 2: Assessing the Role of TA Systems via Toxin Overexpression
This protocol tests the functional role of a specific TA system by inducing toxin overexpression and measuring the resultant persistence level.
Workflow Diagram: TA System Functional Analysis
Materials:
- Strains: Bacterial strain (e.g., E. coli K-12) with a plasmid containing a toxin gene (e.g., hipA, mqsR, relE) under an inducible promoter (e.g., Ptac or Pbad) [17].
- Inducer: Isopropyl β-d-1-thiogalactopyranoside (IPTG) or L-arabinose.
- Antibiotics: For selection of the plasmid and for the killing assay (e.g., Ampicillin).
- Equipment: Shaking incubator, spectrophotometer, microcentrifuge tubes.
Procedure:
- Culture Growth: Inoculate the engineered strain into broth containing the appropriate antibiotic for plasmid selection. Grow the culture at 37°C with shaking to mid-exponential phase (OD600 ~0.5).
- Toxin Induction: Split the culture into two aliquots. To the experimental aliquot, add the inducer (e.g., 1 mM IPTG). The second aliquot serves as an uninduced control. Continue incubating for a set period (e.g., 2-4 hours) to allow toxin expression and subsequent growth arrest [17].
- Antibiotic Killing Assay: Take samples from both induced and uninduced cultures. Treat these samples with a high concentration of a lethal antibiotic (e.g., ampicillin or ciprofloxacin) for several hours.
- Viability Assessment: At timed intervals, remove aliquots from the killing assay, wash to remove the antibiotic, serially dilute, and plate on solid medium without inducer to determine CFU. The plates are incubated to allow surviving cells (persisters) to form colonies.
- Analysis: The persistence frequency is calculated as (CFU/mL after antibiotic treatment) / (CFU/mL before antibiotic treatment). A significant increase in persistence frequency in the toxin-induced culture compared to the uninduced control indicates the TA system's role in persister formation [17].
The Scientist's Toolkit: Research Reagent Solutions
Table 2: Essential Reagents for Persistence Mechanism Research
| Reagent / Material | Function / Application | Example Usage |
|---|---|---|
| Lethal-dose Antibiotics (e.g., Ampicillin, Ciprofloxacin, Amphotericin B) | To kill non-persister cells and selectively isolate the persister subpopulation. | Used in time-kill curve assays to demonstrate the characteristic biphasic killing pattern [1] [20]. |
| Inducible Expression Plasmids | For controlled overexpression of toxins from TA systems to study their specific effects. | Functional analysis of TA systems like HipBA or MqsRA by inducing toxin expression with IPTG [17]. |
| ATP Assay Kits | To quantify intracellular ATP levels as a direct measure of cellular metabolic activity and dormancy. | Differentiating metabolically active cells from dormant persisters; dormant cells show significantly lower ATP levels [19]. |
| Microtiter Plates (Polystyrene) | Providing a standardized surface for high-throughput in vitro biofilm formation. | Growing reproducible biofilms for antibiotic challenge and persister isolation assays [20]. |
| Lon Protease Inhibitor | To inhibit the degradation of antitoxins, thereby preventing toxin activation and persister formation via type II TA systems. | Tool for validating the role of specific type II TA systems in persistence [17]. |
| Conditioned Media / Signaling Molecules | To investigate the role of quorum sensing and intercellular signaling in persister formation. | Studying the effect of archaeal-conditioned media on persister formation in Haloferax volcanii [24]. |
Pathway and Relationship Visualizations
The following diagrams summarize the core mechanistic relationships and experimental workflows detailed in this document.
Mechanisms of Bacterial Persister Formation
Bacterial persisters are a subpopulation of genetically drug-susceptible, quiescent cells that can survive high-dose antibiotic exposure and other environmental stresses. These non-growing or slow-growing cells are not resistant mutants but exhibit phenotypic tolerance, enabling them to survive antibiotic therapy that kills their genetically identical counterparts. Following the removal of antibiotic pressure, persisters can resume growth and reconstitute the infection, leading to chronic, relapsing infections that are notoriously difficult to eradicate [1].
The clinical significance of persister cells is profound, particularly in the context of medical device-associated infections and other chronic conditions. Approximately 60-80% of clinical infections in humans are estimated to have biofilm origin, with persister cells being a key component of their recalcitrance [25] [26]. These cells underlie treatment failures in conditions including tuberculosis, typhoid fever, Lyme disease, recurrent urinary tract infections, and infections associated with implanted medical devices [1]. In biofilm-associated infections, which account for approximately 80% of all microbial infections, persisters accumulate in regions of substrate limitation and contribute significantly to the recalcitrance of these infections to conventional antibiotic therapy [10] [27].
Table 1: Clinical Infections and Associated Biofilm-Forming Pathogens
| Infection Type | Common Pathogens | Persistence Mechanism |
|---|---|---|
| Catheter-Associated Urinary Tract Infections (CA-UTI) | Escherichia coli, Klebsiella pneumoniae, Proteus mirabilis, Pseudomonas aeruginosa | Biofilm formation along catheter surface; persister cells within biofilm [25] |
| Central Line-Associated Bloodstream Infections (CLA-BSI) | Staphylococcus aureus, Staphylococcus epidermidis, Enterococcus faecalis | Biofilm on catheter surface shelters persisters; shedding leads to bloodstream infection [25] |
| Prosthetic Joint Infections | Staphylococcus aureus, Staphylococcus epidermidis | Biofilm on implant surface contains persistent cells resistant to antibiotic therapy [26] |
| Chronic Wound Infections | Pseudomonas aeruginosa, Acinetobacter baumannii, Klebsiella spp. | Biofilm-protected persisters contribute to chronicity and treatment failure [26] |
Quantitative Data: The Clinical and Economic Impact
The burden of persistent infections linked to medical devices is substantial both clinically and economically. Central venous catheters (CVCs) are associated with approximately 80,000 central line-associated bloodstream infections (CLA-BSIs) annually in intensive care units alone, with an alarming mortality rate of 12-25% [25]. Similarly, catheter-associated urinary tract infections (CA-UTIs) represent up to 40% of all nosocomial infections, with approximately 70% of UTIs being associated with urinary catheters [25]. The daily risk of bacteriuria increases by 3-8% for each day a urinary catheter remains in place, significantly increasing the likelihood of developing a symptomatic infection that may progress to severe sequelae including bacteremia and death [25].
The economic impact of biofilm-associated infections is staggering, with recent estimates suggesting the total annual cost of biofilms to be approximately $5 trillion globally [28]. In the healthcare sector alone, biofilm-associated infections lead to escalated treatment expenses and prolonged hospitalization [28]. In the United States, prosthetic joint infections alone are projected to incur revision surgery costs exceeding $500 million per year, with projections suggesting this figure will rise to $1.62 billion by 2030 [27].
Table 2: Economic and Clinical Impact of Medical Device-Associated Biofilm Infections
| Parameter | Statistical Data | Source/Reference |
|---|---|---|
| Percentage of nosocomial infections linked to medical devices | 60-70% | [25] |
| Percentage of clinical infections with biofilm origin | Approximately 80% | [26] |
| Mortality rate for central line-associated bloodstream infections | 12-25% | [25] |
| Incidence of bacteriuria per day of catheterization | 3-8% daily increase | [25] |
| Projected annual cost of prosthetic joint infections in US by 2030 | $1.62 billion | [27] |
Experimental Protocols: Studying Persisters in Biofilms
Murine Catheter-Associated Biofilm Model
Purpose: To investigate the survival and antibiotic tolerance of persister cells in an in vivo biofilm environment, particularly using Staphylococcus aureus as a model pathogen [29].
Materials and Reagents:
- C57Bl/6 mice (6-8 weeks old, both sexes)
- Polyethylene catheter tubing (Durect #0007750, I.D. 0.030", O.D. 0.048%)
- Bacterial strains: S. aureus wild type (e.g., HG003) and mutant strains (e.g., fumC knockout)
- Anesthetic: Ketamine-xylazine mixture
- Culture media: Tryptic Soy Broth (TSB), Tryptic Soy Agar (TSA)
- Sterile saline (1% NaCl)
Procedure:
- Anesthetize mice using 0.090 mL of ketamine-xylazine per 10 grams of body weight.
- Shave flanks and make two small incisions (~0.25 inches) on each mouse.
- Insert sterile catheter segments (~0.5 inches long) into each incision.
- Inoculate each catheter with 1 × 10^6 CFU of test bacteria in a 10 μL volume.
- Include control mice with catheters inoculated with sterile 1% NaCl.
- After 9 days post-infection, euthanize mice and aseptically excise catheters and surrounding tissues.
- Process samples by sonication (for catheters) or homogenization (for tissues) to dislodge and disperse bacteria.
- Perform serial dilutions and plate on TSA for determination of bacterial burden.
- Compare bacterial recovery between wild type and persister-enriched mutant strains [29].
Applications: This model allows for the investigation of bacterial persistence in a clinically relevant biofilm context and can be used to evaluate the efficacy of anti-persister compounds against biofilm-associated infections in vivo.
In Vitro Static Biofilm Tolerance Assay
Purpose: To assess antibiotic tolerance of mature biofilms and identify persister cells within biofilm populations [29].
Materials and Reagents:
- 96-well flat-bottom plates (Costar #3628)
- Test antibiotics: ciprofloxacin, rifampicin, gentamycin, oxacillin, vancomycin
- Culture media: Tryptic Soy Broth (TSB)
- Sterile saline (1% NaCl)
- Proteinase K (for matrix disruption studies)
Procedure:
- Prepare overnight cultures of test bacteria in TSB.
- Dilute cultures 1:1000 in 200 μL TSB in 96-well plates.
- Incubate plates statically at 37°C for 8 hours (immature biofilm) or 24 hours (mature biofilm).
- Carefully wash non-adherent cells with 1% NaCl.
- Challenge biofilms with appropriate concentrations of test antibiotics (typically 10× MIC for most antibiotics, 100× MIC for vancomycin).
- For matrix disruption studies, treat biofilms with Proteinase K prior to antibiotic challenge.
- Incubate plates for predetermined time periods.
- Assess viability by resuspending biofilms and performing serial dilution and plating.
- Compare survival rates between different conditions and time points [29].
Applications: This protocol enables high-throughput screening of antibiotic tolerance in biofilms and can be used to identify conditions that selectively target persister cells or to characterize persister dynamics during biofilm development.
Figure 1: Workflow for Murine Catheter-Associated Biofilm Model. This diagram illustrates the key steps in establishing and analyzing biofilm-associated infections in an in vivo model for studying persister cells [29].
Therapeutic Strategies: Targeting Persisters in Biofilms
Current Anti-Persister Compounds
Conventional antibiotic discovery has primarily focused on inhibiting bacterial growth, making most clinically available antibiotics ineffective against dormant persister cells. However, recent research has identified several promising anti-persister compounds and strategies [30].
Rational Approach to Anti-Persister Drug Discovery: A new paradigm in antibiotic development focuses on identifying compounds that can effectively penetrate and kill dormant persister cells. This approach is based on specific principles for developing persister-killing agents, including [30]:
- Positive charge under physiological conditions to interact with negatively charged bacterial membrane components
- Ability to penetrate via energy-independent diffusion
- Amphiphilic properties for membrane activity and penetration
- Strong binding to intracellular targets to cause killing during bacterial "wake-up"
Using this rational approach with chemoinformatic clustering, researchers have identified several promising compounds effective against E. coli persisters, with the top leads showing activity against Pseudomonas aeruginosa and uropathogenic E. coli (UPEC) persisters, as well as UPEC biofilms and biofilm-associated persister cells [30].
Known Anti-Persister Agents:
- Pyrazinamide (PZA): A unique anti-persister drug that plays a crucial role in shortening tuberculosis therapy and reducing relapse rates [1].
- Minocycline, Rifamycin SV, and Eravacycline: Demonstrate increased accumulation in persister cells and effective killing during wake-up phases [30].
- Synthetic retinoids: Identified through screening approaches using infection models, showing potent activity against MRSA persister cells [30].
Novel Therapeutic Approaches
Beyond conventional antibiotics, several innovative strategies are being explored to target persisters in biofilm-associated infections:
Surface Modification of Medical Devices: Chemical surface functionalization using non-antibiotic agents, including enzymes, chelating agents, quorum sensing quenching factors, biosurfactants, oxidizing compounds, and nanoparticles, can prevent bacterial adhesion and biofilm formation on medical devices [27].
Anti-Virulence Strategies: Targeting quorum sensing systems, biofilm matrix components, and specific virulence factors rather than bacterial viability can reduce selective pressure for resistance while effectively mitigating infections [28] [26].
Combination Therapies: Strategic combinations of conventional antibiotics with anti-persister compounds or adjuvants that disrupt dormancy pathways can improve eradication of persistent infections [1] [30].
Figure 2: Therapeutic Strategies Against Biofilm Persisters. This diagram outlines the multi-faceted approaches being developed to target persister cells in biofilm-associated infections [30] [27].
The Scientist's Toolkit: Essential Research Reagents
Table 3: Key Research Reagents for Studying Biofilm Persisters
| Reagent/Resource | Function/Application | Example Specifications |
|---|---|---|
| Polyethylene Catheter Tubing | Substrate for biofilm formation in murine models | Durect #0007750, I.D. 0.030", O.D. 0.048% [29] |
| 96-well Flat-bottom Plates | In vitro biofilm formation and antibiotic tolerance assays | Costar #3628 [29] |
| Tricarboxylic Acid (TCA) Cycle Mutants | Studying metabolic mechanisms of persistence | fumC, sucA, sucC knockout strains [29] |
| Proteinase K | Enzymatic disruption of biofilm matrix to study underlying persisters | Used to disperse matrix without killing cells [29] |
| Persistence Marker Reporters | Identification and tracking of persister cells | Pcap5A::dsRED for S. aureus persisters [29] |
| Iminosugar-based Compound Library | Screening for novel anti-persister compounds | Asinex SL#013 Gram Negative Antibacterial Library [30] |
The clinical challenge of persister cells in chronic and medical device-associated infections necessitates innovative research approaches and therapeutic strategies. Agent-based modeling of biofilm persister dynamics represents a promising frontier for understanding the complex heterogeneity and behavior of these recalcitrant cell populations. By integrating experimental data from the protocols described herein with computational models, researchers can generate testable hypotheses about persister formation, maintenance, and eradication [9].
Future research directions should focus on elucidating the precise molecular mechanisms of persister formation, developing standardized detection methods for clinical diagnostics, and advancing targeted therapeutic strategies that effectively eliminate persister cells without promoting resistance. The rational design of anti-persister compounds, combined with surface modification technologies for medical devices and strategic combination therapies, offers promising avenues for overcoming the clinical burden of persistent infections.
The Role of ABMs in Capturing Biofilm Heterogeneity and Emergent Behaviors
Agent-based models (ABMs) provide a powerful bottom-up computational approach for investigating complex biofilm systems, enabling researchers to dissect how individual cell behaviors and interactions give rise to population-level heterogeneity and emergent community dynamics. This application note details how ABMs can be implemented to study persister cell dynamics within biofilms, offering protocols for model construction, simulation, and analysis. By capturing spatial and temporal heterogeneity often inaccessible through conventional experimental methods, ABMs serve as indispensable in silico tools for validating hypotheses about persister formation and treatment strategies, ultimately accelerating therapeutic development for persistent biofilm-related infections.
Biofilm-associated infections present formidable clinical challenges due to their inherent antibiotic tolerance and phenotypic heterogeneity. Within these structured microbial communities, subpopulations of bacterial persisters—dormant, non-growing or slow-growing cells that survive antibiotic exposure—contribute significantly to treatment failure and chronic infections [1]. Understanding the mechanisms governing persister formation and survival requires methodologies capable of resolving individual cell behaviors within complex community contexts.
Agent-based modeling has emerged as a particularly suitable framework for this challenge. ABMs simulate a system as a collection of autonomous decision-making agents (individual bacteria) within a shared environment, following simple rules governing their interactions and behaviors [31] [9]. From these local interactions, emergent population-level properties arise, including spatial organization, metabolic cooperation, and heterogeneity in antibiotic tolerance [11]. This application note provides detailed protocols for employing ABMs to investigate persister dynamics in biofilm environments, with specific emphasis on model design, implementation, and analytical approaches relevant to pharmaceutical research and development.
Application Notes: ABM Insights into Biofilm Persister Dynamics
Decoding Metabolic Interactions and Spatial Organization
ABM simulations have demonstrated that the nature of metabolic interactions between bacterial species fundamentally influences biofilm architecture and population heterogeneity, which in turn affects persister formation and survival.
Table 1: Emergent Biofilm Properties Across Metabolic Interaction Types
| Interaction Type | Biofilm Morphology | Spatial Organization | Implications for Persistence |
|---|---|---|---|
| Competition | Sparse, segregated patches | Limited species mixing | Niche-specific stress responses may enhance persister formation in protected regions |
| Neutralism | Separated, larger patches | Species coexistence without significant interaction | Heterogeneous microenvironments create varied selective pressures |
| Commensalism | Intermediate intermixing | Moderate species integration | Metabolic dependencies can increase community vulnerability to perturbations |
| Mutualism | Highly interconnected, dense structures | Extensive species intermixing | Cross-feeding and cooperation may stabilize community and promote tolerance |
As illustrated in Table 1, cooperative interactions (commensalism and mutualism) foster highly intermixed communities where metabolic cross-feeding enhances overall community stability [11]. These intimate associations create protected niches where persister cells may potentially survive antibiotic challenges through mechanisms mediated by metabolic interactions with neighboring cells.
Quantifying Model Parameters and Outputs
ABM simulations generate rich, high-resolution data on both individual agent behaviors and population-level dynamics. The following parameters are typically quantified in studies investigating biofilm heterogeneity.
Table 2: Key Quantitative Parameters in Biofilm ABMs
| Parameter Category | Specific Metrics | Measurement Approach |
|---|---|---|
| Population Dynamics | Total biomass, Species abundance ratios, Population flux | Cell counting, Relative proportion tracking over time |
| Spatial Metrics | Biofilm thickness, Surface coverage, Spatial segregation indices | Image analysis of simulation snapshots, Nearest-neighbor calculations |
| Heterogeneity Indicators | Local cell density variation, Metabolic state distribution, Division hierarchy | Coefficient of variation analysis, State categorization, Lineage tracking |
| Persistence Markers | Type I (non-growing) and Type II (slow-growing) persister ratios | Metabolic activity profiling, Time-to-regrowth assays post-treatment |
Simulations tracking these parameters have revealed that metabolic heterogeneity often precedes and predicts the emergence of persister subpopulations [1]. For instance, models can identify nutrient-gradient zones within developing biofilms where starvation conditions trigger dormancy programs, leading to localized enrichment of persister cells [11] [9].
Experimental Protocols
Protocol: ABM Development for Gut Mucosal Biofilm Persistence
This protocol outlines the construction of an ABM to conceptually simulate persister dynamics in gut mucosal bacterial communities, adapting methodologies from published models [11].
Model Initialization and Agent Definition
- Environment Setup: Create a two-dimensional grid representing the mucosal surface with protruding topographies to simulate intestinal crypts. Set environment dimensions to 100 × 100 grid units, with each unit representing 1 μm².
- Nutrient Gradient Establishment: Initialize three diffusing compound fields: glucose (primary nutrient), oxygen, and host-produced metabolites (e.g., mucins). Set initial concentrations at the lumen boundary to 1.0 mM, 0.21 mM, and 0.05 mM, respectively, with diffusion coefficients of 5.0 × 10⁻⁶ cm²/s.
- Agent Population Seeding: Introduce 1000 bacterial agents of two species with complementary metabolic capabilities at random positions adjacent to the mucosal surface. Set initial persister frequency at 0.1% of each population.
Agent Behavioral Rules Implementation
- Metabolic Programming:
- Code metabolic rules for each species: Species A consumes glucose and produces acetate; Species B consumes both oxygen and acetate.
- Implement Monod kinetics for nutrient uptake: μ = μₘₐₓ × [S]/(Kₛ + [S]), where μₘₐₓ = 0.5 h⁻¹ and Kₛ = 0.01 mM for all substrates.
- Persistence Transition Rules:
- Program starvation-induced persistence: IF (internalglucose < 0.001 mM AND internalacetate < 0.001 mM) THEN transitiontopersister(state = "deep")
- Program toxin-induced persistence: IF (externalantibiotic > MIC) THEN transitionto_persister(state = "shallow")
- Program stochastic persistence: IF (random(0,1) < 0.0001) THEN transitiontopersister(state = "stochastic")
- Growth and Division Parameters:
- Set division threshold at biomass = 2.0 × initial mass.
- Implement shoving mechanics to simulate mechanical interactions between neighboring agents during division.
Simulation Execution and Data Collection
- Parameter Configuration: Set simulation duration to 240 hours (10 days) with time steps (ticks) representing 1 minute of real time.
- Data Sampling Protocol: Record agent positions, internal states, and metabolic concentrations every 24 simulation hours.
- Perturbation Introduction: At 120 hours, introduce antibiotic concentration equivalent to 10× MIC for both species to simulate therapeutic intervention.
Protocol: Analysis of Emergent Persister Dynamics
Spatial Pattern Quantification
- Spatial Segregation Analysis:
- Calculate spatial segregation index (SSI) using nearest-neighbor analysis: SSI = (O-E)/E, where O is observed frequency of same-species neighbors and E is expected frequency.
- Correlate SSI with persister abundance across multiple simulation runs.
- Gradient Analysis:
- Map nutrient gradients (glucose, oxygen) at time of antibiotic introduction.
- Quantify persister density as a function of local nutrient concentrations.
Persister Hierarchy Assessment
- Metabolic State Classification:
- Categorize persisters based on pre-treatment metabolic activity: "deep" (quiescent) vs. "shallow" (slow-growing).
- Track resuscitation time post-antibiotic removal for each category.
- Lineage Tracing:
- Implement agent pedigree tracking to determine if persister propensity is heritable.
- Calculate persistence enrichment ratio in daughter cells compared to population average.
The Scientist's Toolkit
Essential Research Reagent Solutions
Table 3: Key Computational Tools and Frameworks for Biofilm ABM
| Tool/Resource | Function | Implementation Notes |
|---|---|---|
| MASON Library | Multi-agent simulation framework | Java-based library providing core scheduling and visualization infrastructure [31] |
| iDynoMiCS | Open-source ABM platform specifically for biofilm simulation | Includes built-in functions for nutrient diffusion and detachment mechanisms [9] |
| NetLogo | Accessible programming environment for ABM development | Lower entry barrier, suitable for rapid prototyping [9] |
| COBRA Methods | Constraint-based reconstruction and analysis of metabolic networks | Integrates genome-scale metabolic models into ABM frameworks [9] |
| Custom JSON Output | Standardized data capture format | Enables interoperability with statistical analysis packages [31] |
Visualization Framework
Biofilm ABM Decision Pathway
Metabolic Interaction Network
Building the Digital Biofilm: Agent-Based Model Design and Implementation
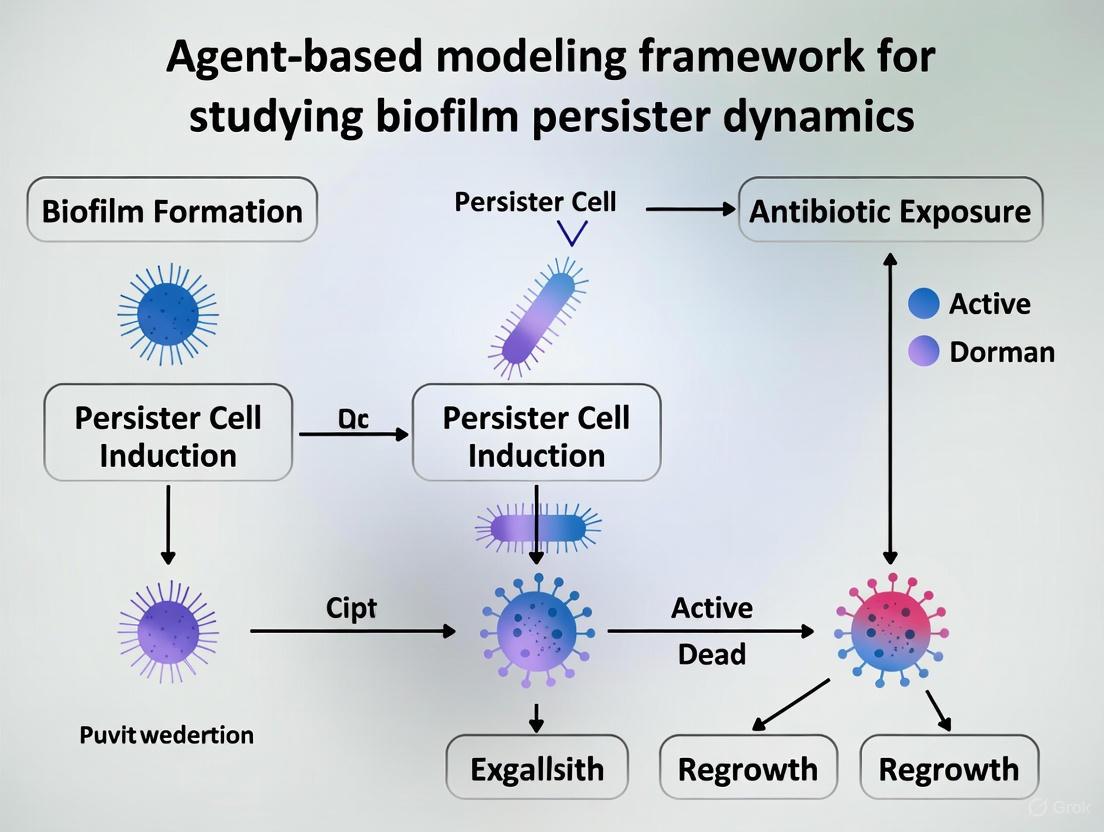
Agent-based modeling (ABM) is a powerful computational technique for simulating complex systems by modeling the interactions of autonomous agents within a shared environment. The core principle of ABM is to simulate complex systems as a collection of autonomous, interacting agents, where each agent follows its own set of rules [32]. Through these localized interactions, emergent patterns and behaviors arise at the system level that are not predictable from individual agent behaviors alone [33] [32]. In microbiology, ABMs have become an invaluable tool for exploring the human microbiome and polymicrobial biofilms, which are complex communities of microorganisms that form on mucosal surfaces and medical devices [9]. These models are uniquely able to represent each microbe as an individual entity, allowing researchers to model interactions between individual microbes and between microbes and their environment [9]. This capability is particularly valuable for studying biofilm-associated infections, where microbes in biofilms often become tolerant to antimicrobials, allowing them to persist on medical devices and in living tissues [9].
Core Components of an ABM for Biofilm Persister Dynamics
Agents: Representing Bacterial Cells and Persister States
In ABMs of biofilm persister dynamics, agents are the central entities that define the system's behavior. These software-based agents represent individual bacterial cells or phenotypic variants with their own properties and decision-making capabilities [34]. For persister dynamics modeling, agents typically have internal states that can include:
- Microbial Identification: Species/strain designation
- Spatial Position: X, Y, Z coordinates within the biofilm
- Metabolic State: Active, dormant, or persister status
- Nutrient Levels: Internal storage of essential nutrients
- Gene Expression Profiles: Rules governing phenotype switching
Agents in these models employ decision-making processes based on pre-defined rules, allowing large populations of heterogeneous agents to be created and observed [34]. This heterogeneity is crucial for modeling persister formation, as individual cells within a genetically identical population can exhibit different phenotypic states, with a small fraction adopting the highly protected persister state [10]. The following table summarizes key agent types and their attributes in a typical biofilm persister model:
Table 1: Agent Types and Attributes in Biofilm Persister Models
| Agent Type | Key Attributes | Behavioral Rules | State Transitions |
|---|---|---|---|
| Planktonic Cell | Motile, nutrient-seeking | Chemotaxis, division upon sufficient resources | Adhesion to surface → Sessile Cell |
| Sessile Cell (Active) | Fixed position, rapid metabolism | Nutrient consumption, division, EPS production | Nutrient limitation → Starved Cell; Stress → Persister |
| Starved Cell | Reduced metabolism, stationary | Resource conservation, reduced division | Nutrient availability → Sessile Cell; Stress → Persister |
| Persister Cell | Dormant, high tolerance | No division, metabolite maintenance | Substrate exposure → Sessile Cell (upon stress removal) |
Environment: Defining the Biofilm Habitat
The environment in ABMs of biofilm persister dynamics represents the physical and chemical context in which bacterial agents exist and interact. Environmental factors can generally be thought of as shocks that occur to the model, affecting agent behavior and interaction rules [33]. In biofilm models, the environment typically includes:
- Spatial Framework: A 2D or 3D grid representing the physical surface where biofilms form
- Nutrient Gradients: Diffusion and concentration fields of essential substrates (e.g., oxygen, glucose)
- Antimicrobial Agents: Concentration distributions of antibiotics or other biocides
- Metabolic Byproducts: Waste accumulation and pH variations
- Extracellular Polymeric Substance (EPS): Matrix material affecting diffusion and providing structural support
The environment is not static; it changes over time as biofilms form, as digestive processes occur, and as disruptions such as antibiotics or dietary changes are introduced [9]. These environmental dynamics are difficult to predict or replicate in the lab, making computational modeling particularly valuable. For example, in models of Pseudomonas aeruginosa biofilms, nutrient diffusion limitations can create hollow areas in biofilm clusters and lead to sloughing, demonstrating how environmental constraints shape biofilm architecture [9].
Table 2: Environmental Parameters in Biofilm Persister Models
| Parameter Category | Specific Variables | Measurement Units | Impact on Persister Dynamics |
|---|---|---|---|
| Nutrient Availability | Dissolved oxygen, Carbon source (e.g., glucose) | mM or mg/L | Governs bacterial growth and metabolic activity; limitation can trigger persister formation [10]. |
| Antimicrobial Exposure | Antibiotic type, Concentration, Duration | µg/mL, hours | Selective pressure killing non-persisters; persisters survive and regrow after treatment [10]. |
| Physical Stressors | Fluid shear force, pH, Temperature | dyne/cm², -log[H⁺], °C | Influences biofilm structure and detachment; sub-lethal stress can induce persistence. |
| Diffusion Parameters | Substrate diffusion coefficient, EPS density | cm²/s, g/mL | Affects nutrient/antibiotic penetration, creating heterogeneous microenvironments within the biofilm [9]. |
Rules: Governing Agent Behaviors and Interactions
Rules play a critical role in the behavior of agents, influencing the decisions they make, how information is obtained and disseminated, and the degree of rationality behind their actions [34]. In biofilm persister models, rules define how agents respond to environmental conditions and interact with other agents. These rules can be categorized as:
- Metabolic Rules: Govern nutrient uptake, energy utilization, and growth rates
- Phenotypic Switching Rules: Control transitions between normal and persister states
- Interaction Rules: Define cell-to-cell communication and competitive/synergistic relationships
- Movement Rules: Regulate chemotaxis and spatial repositioning
A key rule in persister models is the assumption that persisters are "generated at a fixed rate, independent of the presence of substrate or antimicrobial agent" [10]. This stochastic switching mechanism, combined with rules that make persister cells "incapable of growth" but able to "revert from the persister state when exposed to the growth substrate," creates the characteristic biphasic killing pattern observed in antibiotic treatments [10]. The model predicts that "persister cells increased in numbers in the biofilm, even though they were unable to grow, accumulating in regions of substrate limitation" [10].
The following diagram illustrates the core rule-based logic governing agent state transitions in a biofilm persister model:
Application Notes: ABM Implementation for Persister Research
Protocol 1: Establishing Baseline Biofilm Growth Parameters
Objective: To initialize and calibrate an ABM for simulating baseline biofilm development without antimicrobial challenge, establishing reference metrics for architecture and population dynamics.
Experimental Workflow:
Model Initialization:
- Define a 3D spatial grid (e.g., 200 × 200 × 100 voxels) representing the colonization surface.
- Seed planktonic cell agents at random positions near the surface at a defined initial density (e.g., 10-100 cells).
- Set homogeneous environmental conditions: dissolved oxygen = 0.28 mM, primary carbon source = 25 mM.
Parameterization of Agent Rules:
- Program sessile cell agents with rules for nutrient consumption, growth, and division based on Monod kinetics.
- Implement rules for EPS production as a function of metabolic activity and nutrient availability.
- Configure stochastic rules for the transition from active to starved state when local nutrient concentration falls below a critical threshold (e.g., < 0.1 mM).
Simulation Execution:
- Run the simulation for a defined time period (e.g., 1440 minutes equivalent to 24 hours) using a discrete time-step (e.g., Δt = 0.1 min).
- Track key output metrics: total biomass, biofilm thickness, cell count by type, and nutrient gradient profiles.
Model Calibration:
- Compare simulation outputs (biomass accumulation rate, final structure) against experimental data from in vitro biofilm assays (e.g., confocal microscopy, colony forming units).
- Iteratively adjust parameters (growth rate, nutrient consumption) until the virtual biofilm growth falls within one standard deviation of experimental means.
Protocol 2: Simulating Antimicrobial Treatment and Persister Dynamics
Objective: To utilize the calibrated ABM to simulate the effect of antimicrobial treatment on a mature biofilm, quantifying persister cell formation, survival, and post-treatment biofilm regrowth.
Experimental Workflow:
Pre-treatment Phase:
- Initialize the model with a mature biofilm structure obtained from Protocol 1 or by simulating 48-72 hours of growth.
- Confirm the presence of ecological heterogeneity, including nutrient-limited zones in the biofilm depths.
Treatment Intervention:
- Introduce an antimicrobial agent (e.g., ciprofloxacin) into the environment at a defined concentration (e.g., 10x MIC) for a specified duration (e.g., 4 hours).
- Model the diffusion of the antibiotic through the biofilm matrix, accounting for binding and degradation.
- Implement agent-level rules: active cells exposed to antibiotic concentrations above a lethal threshold undergo death; persister cells survive regardless of concentration.
Post-treatment Monitoring:
- After removing the antimicrobial agent from the environment, continue the simulation for a recovery period (e.g., 24 hours).
- Monitor the reversion of surviving persister agents to the metabolically active state upon exposure to fresh growth substrates.
- Quantify the rate and extent of biofilm regrowth from the surviving persister population.
Data Collection and Analysis:
- Record the spatial distribution of killing and persister survival.
- Calculate the percentage of the initial population that survives as persisters.
- Plot the regrowth kinetics and compare the final biomass to pre-treatment levels.
The following workflow diagram summarizes the key stages in this protocol:
Successful implementation of ABM for biofilm persister dynamics research requires both computational tools and connection to experimental microbiology. The following table details essential resources:
Table 3: Research Reagent Solutions for ABM of Biofilm Persisters
| Tool/Category | Specific Examples | Function/Role in Research | Implementation Notes |
|---|---|---|---|
| ABM Platforms | NetLogo, iDynoMiCS [9] | Provides high-level primitives for programming and visualizing ABM, facilitating rapid prototyping without low-level graphics programming [35]. | iDynoMiCS is particularly adapted for microbial systems; NetLogo offers a gentle learning curve. |
| Computational Resources | Tencent Cloud CVM, Object Storage (COS) [32] | Offers scalable computational resources to run simulations and store extensive input/output data [32]. | Essential for large-scale, parameter-intensive models (e.g., 3D biofilms with millions of agents). |
| Visualization & Analysis | Custom Python/R scripts, ParaView | Analyzes model output, performs statistical validation, and creates publication-quality visualizations of biofilm structure and dynamics. | Critical for identifying emergent properties and communicating findings. |
| Experimental Validation | Chemostats, Confocal Microscopy, Cell Viability Stains | Generates empirical data for model parameterization (growth rates) and validation (spatial structure, persister counts). | CFU counts post-antibiotic treatment are the gold standard for quantifying persister fractions [10]. |
Data Presentation and Model Output Analysis
ABMs of biofilm persister dynamics generate complex, multi-dimensional data. Effective summarization and presentation are crucial for interpreting results. The following tables represent examples of quantitative outputs from a typical simulation experiment:
Table 4: Simulated Biofilm Characteristics Pre- and Post-Antibiotic Treatment
| Biofilm Metric | Pre-Treatment (Mean ± SD) | Post-Treatment (Mean ± SD) | % Change | Recovery Phase (24h Post-Treatment) |
|---|---|---|---|---|
| Total Biomass (µm³) | 1.52 × 10⁶ ± 1.2 × 10⁵ | 3.01 × 10⁵ ± 4.5 × 10⁴ | -80.2% | 9.88 × 10⁵ ± 8.8 × 10⁴ |
| Average Thickness (µm) | 45.3 ± 3.1 | 12.7 ± 2.4 | -72.0% | 32.5 ± 2.9 |
| Total Cell Count | 5.85 × 10⁷ ± 3.2 × 10⁶ | 1.14 × 10⁷ ± 1.1 × 10⁶ | -80.5% | 4.12 × 10⁷ ± 2.9 × 10⁶ |
| Persister Cell Count | 2.91 × 10⁵ ± 4.5 × 10⁴ | 2.88 × 10⁵ ± 4.3 × 10⁴ | -1.0% | 2.95 × 10⁵ ± 4.6 × 10⁴ |
| Persister Fraction (%) | 0.50 ± 0.08% | 2.53 ± 0.31% | +406.0% | 0.72 ± 0.09% |
Table 5: Key Rules and Parameters for Persister State Transitions
| Rule Description | Mathematical Formulation/Logic | Parameter Value (Range) | Sensitivity Analysis Impact |
|---|---|---|---|
| Stochastic Active→Persister Switch | Probability per time step: P = k_switch × Δt | k_switch = 1×10⁻⁵ min⁻¹ (1×10⁻⁶ - 1×10⁻⁴) | High: ±50% in k_switch alters final persister count by ~40% |
| Stress-Induced Switching | Pstress = kstress × [Antibiotic] × f(nutrient) | k_stress = 0.01 µM⁻¹min⁻¹ | Medium: Major driver only under high stress conditions |
| Persister→Active Reversion | Triggered by [Substrate] > threshold after antibiotic removal | Threshold = 0.5 mM (0.1 - 1.0) | Low: Alters regrowth lag time but not final population |
| Nutrient-Limited Detachment | Detachment rate increases when local [Nutrient] < critical_level | Critical_level = 0.01 mM | Medium: Impacts biofilm porosity and antibiotic penetration [9] |
Persister cells are a transient, dormant subpopulation within bacterial biofilms that exhibit extreme tolerance to antibiotic treatments. Unlike resistant cells, persisters do not possess genetic resistance mutations but instead survive antibiotic exposure through phenotypic dormancy, only to resuscitate and cause biofilm recurrence once the treatment ceases [36] [37]. The dynamics of switching between susceptible and persister states are crucial determinants of biofilm treatment outcomes and are influenced by diverse environmental factors. Implementing accurate switching dynamics in computational models is therefore essential for predicting treatment efficacy and designing optimized antibiotic regimens.
Three primary switching strategies have been identified in bacterial biofilms: constant switching, which occurs at a fixed stochastic rate; substrate-dependent switching, triggered by local nutrient availability; and antibiotic-dependent switching, induced directly by antimicrobial presence [36]. The switching mechanism significantly influences both the spatial distribution of persister cells within the biofilm architecture and the population's overall survival following antibiotic exposure. Understanding and implementing these distinct strategies enables researchers to create more realistic computational models that can capture the heterogeneous responses of biofilms to different treatment approaches.
Quantitative Parameters for Switching Dynamics
Switching Rates and Conditions
Table 1: Persister Switching Dynamics Parameters for Agent-Based Modeling
| Switching Strategy | Switching Direction | Mathematical Formulation | Key Parameters | Reported Values/Effects |
|---|---|---|---|---|
| Constant | Susceptible → Persister | ( k_{sp} = \text{constant} ) | ( k_{sp} ) | Stochastic, low probability [36] |
| Persister → Susceptible | ( k_{ps} = \text{constant} ) | ( k_{ps} ) | Stochastic, triggered upon antibiotic removal [36] | |
| Substrate-Dependent | Susceptible → Persister | ( k{sp} \propto \frac{1}{CS} ) | ( CS ): Local substrate concentration( KS ): Half-saturation constant | Increased persistence under low nutrient conditions [36] |
| Persister → Susceptible | ( k{ps} \propto CS ) | ( C_S ): Local substrate concentration | Resuscitation favored in nutrient-rich environments [36] | |
| Antibiotic-Dependent | Susceptible → Persister | ( k{sp} \propto CA ) | ( C_A ): Antibiotic concentration | Increased switching rate upon antibiotic detection [36] [37] |
| Persister → Susceptible | ( k_{ps} = \text{constant} ) (after antibiotic removal) | - | Occurs after antibiotic concentration drops below threshold [36] |
Experimental Killing Kinetics and Redox Activity
Table 2: Experimental Observations of Persister Dynamics Under Antibiotic Treatment
| Antibiotic | Class | Effect on Planktonic Cells | Effect on Biofilm Cells | Redox Activity (RSG Fluorescence) | Gene Expression Changes |
|---|---|---|---|---|---|
| Ceftazidime | Cephalosporin | High survival fraction (9-10 log₁₀ CFU/mL)Cell elongation/filamentation [37] | Induces persister formation [37] | Significant increase in redox-active cells [37] | Upregulation of relA, spoT (stringent response) [37] |
| Gentamicin | Aminoglycoside | Moderate survival fraction (5-9 log₁₀ CFU/mL) [37] | Biphasic killing patternInduces persister formation [37] | Decreased or varied redox activity [37] | Strong upregulation of spoT, lon (stringent response/protease) [37] |
| Ciprofloxacin | Fluoroquinolone | Lower survival fraction (5-6 log₁₀ CFU/mL) [37] | Biphasic killing patternInduces persister formation [37] | Decreased redox activityMore killed cells [37] | Upregulation of relA, higB, higA (TA system) [38] [37] |
Protocol: Implementing Switching Dynamics in Agent-Based Models
Agent-Based Model Setup Protocol
Objective: To establish a computational agent-based model of biofilm growth that incorporates different persister switching dynamics for testing antibiotic treatment regimens.
Materials and Software:
- NetLogo platform (version 6.3.0 or higher) or custom implementation in Python/Java
- High-performance computing workstation (≥16 GB RAM, multi-core processor)
- Parameter configuration files for bacterial growth and antibiotic kinetics
Procedure:
Model Initialization:
- Set a 2D simulation grid with dimensions appropriate for biofilm growth (e.g., 500 × 500 pixels)
- Randomly position 27 susceptible bacterial cells on the substrate surface to initialize biofilm formation [36]
- Define diffusion parameters for substrate and antibiotic from the bulk liquid above the biofilm
Biofilm Growth Implementation:
- Implement bacterial growth using Monod kinetics: ( \frac{dmi}{dt} = mi \mu{max} \frac{CS}{CS + KS} ) where ( mi ) is cell mass, ( \mu{max} ) is maximal specific growth rate, ( CS ) is local substrate concentration, and ( KS ) is half-saturation constant [36]
- Model cells as cylinders with length ( l ) and diameter ( di ) related to mass by: ( di = \sqrt{\frac{4m_i}{ρ l π}} ) where ( ρ ) is cell density [36]
- Implement cell division when mother cell mass reaches threshold (default: 500 fg), with random 40-60% mass distribution to daughter cells [36]
- Apply "shoving algorithm" to resolve overlapping cells and maintain biofilm structural integrity
Switching Dynamics Implementation:
- Constant Switching: Apply fixed probabilities for both susceptible→persister (( k{sp} )) and persister→susceptible (( k{ps} )) transitions at each time step
- Substrate-Dependent Switching: Implement switching rates as functions of local substrate concentration:
- Susceptible→persister: ( k{sp} \propto \frac{1}{CS} ) (increased under low nutrients)
- Persister→susceptible: ( k{ps} \propto CS ) (increased under high nutrients) [36]
- Antibiotic-Dependent Switching: Implement switching triggered by antibiotic presence:
- Susceptible→persister: ( k{sp} \propto CA ) (increased with antibiotic concentration)
- Persister→susceptible: ( k_{ps} ) occurs after antibiotic concentration drops below threshold [36]
Antibiotic Treatment Implementation:
- Define antibiotic diffusion parameters from bulk liquid
- Implement killing kinetics with different death rates for susceptible (( δS )) and persister (( δP )) cells, where ( δP \ll δS )
- For periodic dosing regimens, implement time-varying antibiotic concentrations according to treatment schedule
Data Collection and Analysis:
- Record spatial distribution of susceptible and persister cells at each time step
- Track total biomass and persister fraction over time
- Monitor antibiotic concentration gradients within biofilm
- Export quantitative data for statistical analysis and visualization
Experimental Validation Protocol for Switching Dynamics
Objective: To experimentally validate persister switching dynamics using Pseudomonas aeruginosa biofilms with real-time monitoring and molecular analysis.
Materials:
- Bacterial strains: P. aeruginosa PAO1 (reference strain) and clinical isolates [38] [37]
- Antibiotics: ceftazidime, gentamicin, ciprofloxacin at 5× MIC concentrations [37]
- Growth media: LB, BHI, or TSB with/without glucose supplementation [38]
- Staining: Redox Sensor Green (RSG), Propidium Iodide (PI) [37]
- Equipment: xCELLigence RTCA SP real-time cell analyzer, flow cytometer, confocal laser scanning microscope [38]
Procedure:
Biofilm Cultivation and Treatment:
- Prepare bacterial suspensions in LB medium to OD₆₀₀ = 0.15-0.3 [38]
- Transfer 100 μL to xCELLigence E-plate wells for background measurement
- Add 75 μL LB medium and incubate for 24-48 hours for biofilm maturation
- Treat mature biofilms with 25 μL antibiotic solutions to achieve final concentrations from 128 to 0.0625 mg/L [38]
- Monitor biofilm growth and treatment response in real-time via Cell Index (CI) measurements every 10 minutes for up to 120 hours [38]
Persister Cell Quantification:
- Perform time-kill assays by treating biofilms with 5× MIC antibiotics for 24 hours [37]
- Sample at 0, 2, 4, 6, 8, and 24 hours, serially dilute and plate on agar
- Incubate plates 24-48 hours at 37°C and count colonies to determine survival fraction
- Identify biphasic killing patterns characteristic of persister populations [37]
Metabolic Activity Assessment:
- Stain antibiotic-treated cells with Redox Sensor Green (RSG) and Propidium Iodide (PI) after 4 hours of treatment [37]
- Analyze using flow cytometry to quantify cellular redox activity
- Classify cells as: high redox activity (alive), low redox activity (dormant persisters), or dead (PI-positive) [37]
- Validate via fluorescence microscopy to observe cellular morphology changes and redox activity
Gene Expression Analysis:
- Extract RNA from antibiotic-treated and untreated control biofilms
- Perform RT-qPCR for stringent response genes (relA, spoT, lon) and toxin-antitoxin genes (higA, higB) [37]
- Calculate fold-change in gene expression using 2^(-ΔΔCt) method relative to housekeeping genes
- Correlate gene expression patterns with observed persister fractions
Visualization of Switching Dynamics
Conceptual Framework for Persister Switching Dynamics
Computational Implementation Workflow
The Scientist's Toolkit: Research Reagent Solutions
Table 3: Essential Research Reagents and Materials for Persister Studies
| Category | Item | Specification/Example | Primary Function | Key Considerations |
|---|---|---|---|---|
| Bacterial Strains | P. aeruginosa PAO1 | Reference strain | Model organism for persistence studies | Well-characterized, genetic tools available [38] [37] |
| Clinical isolates | Multi-drug resistant variants | Study clinically relevant persistence | Diverse genetic backgrounds enhance generalizability [38] | |
| Antibiotics | Ceftazidime | 5× MIC (varies by strain) | Induce filamentation and persistence | High survival fractions in planktonic cells [37] |
| Ciprofloxacin | 5× MIC (varies by strain) | Trigger TA system activation | Strong higB/higA upregulation [38] [37] | |
| Gentamicin | 5× MIC (varies by strain) | Activate stringent response | Strong spoT and lon upregulation [37] | |
| Detection Reagents | Redox Sensor Green | Fluorescent dye | Metabolic activity assessment | Correlates with cellular reductases [37] |
| Propidium Iodide | Fluorescent dye | Cell viability staining | Membrane integrity indicator [37] | |
| Crystal Violet | 0.1% solution | Biofilm biomass staining | Endpoint quantification only [38] | |
| Growth Media | LB, BHI, TSB | With/without 0.5-1% glucose | Biofilm cultivation media | Glucose supplementation enhances growth [38] |
| Molecular Biology | Primers for relA, spoT, lon | qPCR optimized | Stringent response quantification | Normalize to housekeeping genes [37] |
| Primers for higA, higB | qPCR optimized | TA system expression | Key persistence mechanism [37] | |
| Specialized Equipment | xCELLigence RTCA SP | Real-time cell analyzer | Label-free biofilm monitoring | Continuous impedance measurement [38] |
| Flow Cytometer | 488nm laser capability | Single-cell redox activity | RSG and PI detection [37] | |
| Confocal Microscope | CLSM with 40× objective | 3D biofilm architecture | Spatial organization of persisters [39] |
Agent-based modeling (ABM) represents a powerful computational framework for investigating biofilm persister dynamics, a critical factor in chronic and recalcitrant infections. Unlike traditional population-level models, ABMs simulate a biofilm as a collection of discrete agents (individual cells or groups of cells), each with predefined attributes and rules governing their behavior and interactions [40]. This bottom-up approach naturally incorporates heterogeneity and enables the emergence of macroscopic community properties from microscopic, individualistic interactions [40]. Understanding the interplay between microbial growth, substrate diffusion, and antibiotic penetration is paramount, as their spatial and temporal dynamics underpin the enhanced tolerance of biofilm-associated persister cells. This document provides detailed application notes and protocols for simulating these critical processes within an agent-based modeling framework, directly supporting research aimed at elucidating and targeting biofilm persister dynamics.
Quantitative Foundations of Biofilm Processes
Quantitative data is essential for parameterizing and validating agent-based models. The tables below consolidate key parameters for simulating diffusion and antimicrobial action.
Table 1: Aqueous and Effective Diffusion Coefficients for Selected Solutes in Biofilms [41]
| Solute | Aqueous Diffusion Coefficient, Daq (10⁻⁶ cm²/s) | Relative Effective Diffusivity in Biofilm (De/Daq) | Effective Diffusion Coefficient, De (10⁻⁶ cm²/s) |
|---|---|---|---|
| Oxygen | 20.0 | 0.6 (light gases) | 12.0 |
| Glucose | 6.7 | 0.25 (organic solutes) | 1.7 |
| Chloride ion | 20.3 | 0.70 (ions) | 14.2 |
| Lactose | 4.9 | 0.25 (organic solutes) | 1.2 |
| Acetic acid | 12.1 | 0.25 (organic solutes) | 3.0 |
| Chlorhexidine* | 4.2 (at 30°C) | 0.2 | 0.84 |
*Value estimated using the Wilke-Chang correlation [41].
Table 2: Key Parameters for Modeling Growth-Dependent Antibiotic Killing [42]
| Parameter | Symbol | Units | Typical Value / Range |
|---|---|---|---|
| Maximum specific growth rate | μₘₐₓ | h⁻¹ | 0.417 |
| Monod half-saturation coefficient | Kₛ | mg/L | 0.1 |
| Yield coefficient | Yₓₛ | mg biomass / mg substrate | 0.8 |
| Cell intrinsic density | ρₓ | mg/L | 3.0 × 10⁵ |
| Live cell death rate coefficient | k₁ | L/(mg·h) | 5 |
| Influent substrate concentration | Cₛ | mg/L | 0.5 - 80 |
Protocol: Simulating Diffusion-Limited Growth and Antibiotic Penetration in Biofilms
This protocol outlines the steps to implement and run an agent-based model to study how substrate diffusion limits growth and modulates antibiotic efficacy in a biofilm, contributing to persister cell enrichment.
Stage 1: Model Setup and Initialization
Define the Simulation Environment:
- Create a 2D or 3D grid representing the physical space. A common setup is a one-dimensional domain representing biofilm depth from the substratum to the bulk fluid [42] [43].
- Set the bulk fluid boundary conditions, including the concentration of the primary growth-limiting substrate (e.g., glucose, oxygen) and the antibiotic [42].
- Specify the initial biofilm configuration. This can range from a single layer of cells on the substratum to a pre-grown biofilm of specified thickness (e.g., 10-500 μm) [42].
Initialize Agent Properties:
- For each bacterial agent, define the following properties:
- Position and Size: Specify initial coordinates and radius (for spherical agents) or length and width (for rod-shaped agents) [40].
- Metabolic State: Assign a metabolic type (e.g., primary degrader, secondary degrader) and associated kinetic parameters (μₘₐₓ, Kₛ, Yₓₛ) from Table 2 [43].
- Physiological State: Initialize all agents as "live" and "active." The "persister" state will emerge from the simulation dynamics [42].
- For each bacterial agent, define the following properties:
Stage 2: Simulation Execution and Iteration
The core simulation involves iterating through a series of calculations at each time step (Δt). The workflow below outlines this process.
Workflow Title: Core Agent-Based Model Iteration Loop
The computational steps executed within the workflow are:
Solve Reaction-Diffusion Equations:
- At each time step, calculate the concentration profiles of all dissolved substances (substrates, metabolites, antibiotics) through the biofilm. This is typically done by solving a diffusion-reaction equation [42] [43]:
∂S/∂t = Dₑ * (∂²S/∂x²) + rₛwhereSis the substrate concentration,Dₑis the effective diffusion coefficient (from Table 1),xis the spatial coordinate, andrₛis the local net consumption/production rate [42].
- At each time step, calculate the concentration profiles of all dissolved substances (substrates, metabolites, antibiotics) through the biofilm. This is typically done by solving a diffusion-reaction equation [42] [43]:
Update Agent States:
- Growth and Division: For each agent, calculate the local specific growth rate (μ) using the Monod equation:
μ = μₘₐₓ * [S/(Kₛ + S)], where[S]is the local substrate concentration [42]. Increase agent mass accordingly. When an agent's mass exceeds a division threshold, replace it with two daughter agents [40]. - Antibiotic Killing: Model the rate of antibiotic killing as proportional to the local growth rate, reflecting the higher susceptibility of active cells [42]. For example:
Killing Rate = k₁ * [Antibiotic] * μ. Agents with a growth rate below a critical threshold are more likely to transition to a "persister" (non-growing, tolerant) state or be killed much more slowly. - Mechanical Interactions: Simulate the physical displacement of agents due to growth and reproduction using shoving algorithms or by solving force-balance equations to prevent overlap [40].
- Growth and Division: For each agent, calculate the local specific growth rate (μ) using the Monod equation:
Stage 3: Data Collection and Analysis
Monitor System Dynamics:
- Track the spatial distribution of live, dead, and persister cells over time [42].
- Record concentration profiles of the substrate and antibiotic through the biofilm depth.
- Quantify the movement of the "killing front" (the interface where live and dead cell concentrations are equal) from the biofilm-bulk fluid interface inward toward the substratum [42].
Key Output Metrics:
- Biofilm Killing Curve: Plot the log number of viable cells over time during antibiotic exposure. Biofilms will show a characteristic slow, multi-phase killing compared to planktonic cultures [42].
- Killing Front Velocity: Calculate the rate at which the killing front advances (μm/h), which is controlled by the rate of substrate penetration and growth [42].
- Persister Cell Enrichment: Report the final proportion and spatial location of persister cells, which are typically enriched in deep, slow-growing regions of the biofilm.
The Scientist's Toolkit: Research Reagent Solutions
Table 3: Essential Components for an Agent-Based Biofilm Model
| Item | Function in the Model | Example / Key Parameter |
|---|---|---|
| Growth-Limiting Substrate | Primary nutrient source that drives agent growth and reproduction, creating metabolic heterogeneity. | Glucose, Oxygen; defined by influent concentration (Cₛ) and Monod kinetic parameters (μₘₐₓ, Kₛ) [42]. |
| Antibiotic Agent | Compound that kills growing cells; its penetration and action are spatially constrained. | A growth-dependent antibiotic; defined by bulk concentration, diffusion coefficient (Dₑ), and killing rate coefficient (k₁) [42]. |
| Diffusion Solutes | Molecules used to simulate metabolite cross-feeding or chemical signaling between agents. | Short-chain fatty acids (e.g., Acetic acid), Signaling molecules (AHLs); require accurate Dₑ values [43] [11] [41]. |
| Cell State Markers | Computational labels to track the physiological fate of each agent during the simulation. | "Live," "Dead," "Damaged" (consumes substrate but doesn't grow), "Persister" [42]. |
| Mechanical Interaction Algorithm | Rule-set or physical law that prevents agent overlap and simulates biofilm expansion. | Shoving algorithm [40] or Newtonian force-balance equations [40]. |
Diagram: Integrated ABM Architecture for Persister Dynamics
The following diagram illustrates the multi-scale architecture of an agent-based model integrating the critical processes of growth, diffusion, and antibiotic action that govern persister formation.
Diagram Title: Multi-Scale ABM Architecture for Biofilm Persister Dynamics
Biofilms are surface-attached, three-dimensional microbial communities encased within a self-produced extracellular matrix. They represent the dominant form of bacterial life in natural, industrial, and clinical environments [44] [45]. The architectural complexity of biofilms confers remarkable resilience to environmental stressors, antibiotics, and host immune responses, making biofilm-related infections particularly challenging to treat [44] [46]. Understanding how biofilm architecture emerges from local cellular interactions is crucial for developing strategies to manipulate these structures in beneficial contexts or eradicate them in harmful settings.
Agent-based modeling (ABM) has emerged as a powerful computational framework for dissecting the relationship between individual cell behaviors and collective biofilm organization [47]. Unlike continuum models that treat biofilms as homogeneous masses, ABM represents each bacterial cell as an independent agent with defined properties and rules governing its behavior [48]. This approach enables researchers to simulate how micro-scale interactions between cells and their environment give rise to macro-scale structural features observed in experimental biofilms [44] [45]. Within the broader context of agent-based modeling of biofilm persister dynamics, understanding architectural emergence is particularly relevant as physical cell positioning and local microenvironmental conditions significantly influence phenotypic transitions to dormant, antibiotic-tolerant states [48] [12].
This application note provides a comprehensive guide to modeling biofilm architecture using agent-based approaches, with detailed protocols for implementing key biological mechanisms, quantitative analysis of architectural features, and integrating these models with experimental data.
Theoretical Foundations of Architectural Emergence
The transition from planktonic cells to structured communities represents a fundamental shift in bacterial lifestyle. Biofilm architecture is not random but exhibits reproducible spatial organization with distinctive local nematic order analogous to molecular ordering in abiotic liquid crystals [45]. However, unlike conventional materials, biofilms are active systems driven by cell growth and metabolism, operating far from thermodynamic equilibrium [45].
Two competing paradigms have been proposed to explain biofilm assembly: as a developmental program controlled by stage-specific gene expression, similar to multicellular development, or as the outcome of local adaptations of individual cells responding to their immediate environment [44]. Agent-based modeling supports the latter view, demonstrating that local cellular interactions at small spatial and temporal scales are sufficient to give rise to larger-scale emergent properties of biofilms [44].
The extracellular matrix plays a dual role in architectural emergence, providing both structural integrity and mediating mechanical interactions between cells. In Vibrio cholerae biofilms, the protein RbmA primarily mediates cell-cell attraction, while the Vibrio polysaccharide (VPS) contributes weakly to binding and influences osmotic pressure and steric interactions [45]. The balance between attractive and repulsive forces generated by matrix components largely determines the resulting biofilm architecture [45].
Table 1: Key Components Influencing Biofilm Architecture
| Component | Role in Architecture | Representative Molecules |
|---|---|---|
| Attractive Forces | Mediate cell-cell adhesion, reduce intercellular spacing | RbmA protein in V. cholerae [45] |
| Repulsive Forces | Maintain cellular spacing, create heterogeneous organization | AI-2 chemorepulsion in H. pylori [44] |
| Matrix Scaffold | Provides structural integrity, influences mechanical properties | VPS, extracellular DNA, proteins [45] |
| Nutrient Gradients | Drive spatial heterogeneity in growth and physiology | Oxygen, carbon sources [48] [12] |
Computational Framework for Agent-Based Modeling
Modeling Platforms and Implementation
The Individual-based Dynamics of Microbial Communities Simulator (iDynoMiCS) provides an established open-source platform for agent-based modeling of biofilms [44]. This platform can be extended with custom modifications to incorporate specific mechanisms relevant to architectural studies, such as three-dimensional chemotaxis, planktonic cell dynamics, and production of signaling molecules [44].
For simulating mechanical interactions in biofilms, an effective cell-cell interaction potential can be implemented based on the following equation from V. cholerae studies:
[ U=ϵ0ϵ1(e^{-\frac{ρ^2}{λr^2}}+\frac{v}{1+e^{\frac{ρa-ρ}{λ_a}}}) ]
Where ρ = rαβ/σ is the shape-normalized cell-cell distance, ϵ₀ sets the repulsion strength, λr controls the repulsion range, v determines the relative depth of attraction, λa controls the attraction width, and ρa sets the attraction position [45]. This potential captures both steric/osmotic repulsion and matrix-mediated attraction.
Implementing Biological Mechanisms
Chemotaxis and Quorum Sensing: In Helicobacter pylori, AI-2 acts as a chemorepellent rather than a traditional quorum-sensing molecule. Implementing this behavior requires modifying existing platforms to include three-dimensional chemotaxis away from high AI-2 concentrations [44]. Strains competent in AI-2 chemotaxis produce smaller, more heterogeneously spaced biofilms, while chemotaxis-defective mutants form larger, more homogeneous structures [44].
Nutrient Gradients and Phenotypic Heterogeneity: Nutrient availability significantly influences biofilm structure through its effect on growth rates and phenotypic transitions [48] [12]. Nutrient-dependent models can be implemented by coupling nutrient transport equations with cellular dynamics, where local nutrient concentrations determine switching rates between proliferative and persister phenotypes [12].
Mechanical Interactions: At the microscopic scale, bacterial cells and extracellular polymeric substances (EPS) form a colloidal system where depletion forces and steric interactions influence packing density and structural organization [49]. Implementing these interactions requires representing cells and EPS as discrete particles with defined interaction potentials.
Diagram 1: ABM Development Workflow. This workflow illustrates the iterative process of developing and validating agent-based models of biofilm architecture, integrating experimental data with computational simulations.
Quantitative Analysis of Biofilm Architecture
Structural Metrics and Parameters
Quantifying biofilm architecture requires robust metrics that capture both global morphology and local organizational patterns. Lacunarity analysis provides a quantitative measure of structural heterogeneity, capturing morphological features such as roughness of biofilm edges and patchiness of surface coverage [44]. This approach can distinguish between homogeneously spaced biofilms formed by AI-2 sensing mutants and more heterogeneous wild-type structures [44].
Nematic order parameters quantify the degree of alignment between bacterial cells, analogous to measures used in liquid crystal physics [45]. For rod-shaped bacteria like V. cholerae, this parameter reveals how cellular orientation varies between the biofilm interior and exterior regions, and how these patterns change with genetic modifications affecting matrix production [45].
Radial distribution functions extracted from experimental biofilms provide quantitative data on cell-cell spacing distributions under different conditions, serving as essential validation metrics for agent-based models [45].
Table 2: Quantitative Metrics for Biofilm Architecture Analysis
| Metric | Description | Application |
|---|---|---|
| Lacunarity | Measures structural heterogeneity and pattern texture | Distinguishes biofilm types with different AI-2 sensing capabilities [44] |
| Nematic Order Parameter | Quantifies cellular alignment and orientation | Reveals local liquid crystalline order in V. cholerae biofilms [45] |
| Radial Distribution Function | Describes probability of cell-cell spacing | Validates interaction potentials in ABM [45] |
| Biomass Distribution | Spatial distribution of cellular material | Correlates nutrient gradients with growth patterns [12] |
| Surface Area-to-Volume Ratio | Measures structural complexity | Indicates efficiency of nutrient exchange [49] |
Experimental- Computational Validation
Effective modeling requires rigorous validation against experimental data. Large-area automated atomic force microscopy (AFM) enables high-resolution imaging over millimeter-scale areas, bridging the gap between cellular and community scales [50]. Machine learning-assisted image analysis facilitates automated cell detection, classification, and morphological parameter extraction from these large datasets [50].
Confocal microscopy with advanced segmentation techniques allows tracking of all individual cells in growing three-dimensional biofilms, enabling direct comparison between simulated and experimental cell positions, lineages, and local growth rates [45]. This approach has been used to validate interaction potentials in V. cholerae biofilms by comparing 14 different architectural properties and their temporal evolution between simulations and experiments [45].
Protocol: Modeling AI-2 Mediated Architectural Patterning in H. pylori
Model Setup and Implementation
Objective: Implement an agent-based model to simulate how AI-2 chemorepulsion influences H. pylori biofilm architecture, recapitulating experimental observations that AI-2 sensing mutants form larger, more homogeneously spaced biofilms.
Materials and Software:
- iDynoMiCS platform or custom ABM framework
- Programming environment: Java (for iDynoMiCS) or Python/MATLAB for custom implementations
- High-performance computing resources for 3D simulations
Procedure:
Modify Base Platform: Extend an existing ABM framework to include three-dimensional chemotaxis, planktonic cell dynamics, and cellular production of AI-2 [44].
Implement AI-2 Dynamics:
- Program AI-2 as a diffusible compound produced by individual cells at a rate proportional to metabolic activity
- Implement a repulsive chemotaxis response where cell movement is biased away from increasing AI-2 gradients
- Set diffusion coefficients based on molecular weight and environmental conditions
Configure Strain Parameters:
- Wild-type: Competent for AI-2 production and chemotaxis
- AI-2 production mutant (ΔluxS): Deficient in AI-2 production
- AI-2 sensing mutant (ΔcheA, ΔtlpB): Deficient in AI-2 chemoreception
- AI-2 overproducer: Enhanced AI-2 production
Simulation Conditions:
- Initialize with surface-attached founder cells
- Include continuous introduction of planktonic cells from bulk medium
- Allow bidirectional transition between planktonic and biofilm states
- Run simulations for sufficient temporal duration to reach mature architecture
Architectural Analysis:
- Quantify biofilm biomass over time
- Calculate lacunarity metric to assess spatial heterogeneity
- Measure cell-cell spacing distributions
- Analyze cellular demographics and distribution patterns
Diagram 2: AI-2 Chemorepulsion Pathway. This diagram illustrates the molecular pathway through which AI-2 influences biofilm architecture in H. pylori, with dashed lines indicating points of disruption in mutant strains.
Expected Results and Interpretation
Simulations should recapitulate key experimental findings [44]:
- Wild-type strains produce smaller, more heterogeneously structured biofilms
- AI-2 sensing and production mutants form larger biofilms with more homogeneous organization
- AI-2 overproducers form the smallest, most heterogeneous biofilms
Model analysis should reveal that reduced biofilm mass in AI-2 responsive strains primarily results from cell dispersal due to chemorepulsion, rather than differences in growth rates [44]. The model provides insight into how local repulsive behavior generates global architectural patterns, supporting the view that biofilm organization emerges from individual cell behaviors rather than a predefined developmental program.
Protocol: Modeling Mechanical Interactions in V. cholerae Biofilms
Implementing Effective Interaction Potentials
Objective: Develop a particle-based model of V. cholerae biofilm growth where cellular arrangements emerge from mechanical cell-cell interactions mediated by matrix components.
Procedure:
Cell Representation: Model individual cells as growing and dividing ellipsoids with aspect ratios and division time distributions determined from experimental single-cell measurements [45].
Implement Interaction Potential: Incorporate the effective mechanical interaction potential U (described in Section 3.1) with parameters estimated from experimental data:
- Repulsion parameters (ε₀, λr): Fit using ΔrbmA mutant biofilms lacking attractive interactions
- Attraction parameters (v, λa, ρa): Determine using strains with tunable RbmA expression
Strain Variations:
- Wild-type: Full attraction and repulsion components
- ΔrbmA mutant: Primarily repulsive interactions (v ≈ 0)
- RbmA overexpression: Enhanced attraction parameters
Simulation Setup:
- Initialize with single founder cell on surface
- Implement nutrient consumption and growth using experimentally determined rates
- Solve dynamics with parallel computation for efficient evaluation of pairwise interactions
Validation Metrics: Compare simulations with experiments using a feature vector containing 14 different architectural properties and their temporal variation, including:
- Cell-cell spacing distributions
- Nematic order parameters
- Cellular orientations relative to vertical and radial directions
- Biofilm height and radial expansion profiles
Analysis and Interpretation
Successful implementation should capture key architectural differences between strains [45]:
- Wild-type biofilms exhibit closer cell-cell spacing and higher nematic order
- ΔrbmA mutants show increased cell-cell spacing and reduced structural coherence
- Biofilm architectures progress through distinct developmental phases with characteristic structural properties
The model should demonstrate that homogeneous cellular growth rates can produce heterogeneous architectures through mechanical interactions alone, without requiring nutrient gradients [45]. Parameter sensitivity analysis reveals which interaction components most strongly influence specific architectural features, guiding experimental interventions targeting matrix components.
Table 3: Research Reagent Solutions for Biofilm Architecture Studies
| Reagent/Resource | Function | Application Examples |
|---|---|---|
| iDynoMiCS Platform | Open-source agent-based modeling framework | Simulating H. pylori biofilm formation with AI-2 chemotaxis [44] |
| Crystal Violet Staining | Semi-quantitative biofilm biomass assessment | Initial characterization of biofilm formation capacity [51] |
| XTT Reduction Assay | Metabolic activity measurement in biofilms | Quantifying viable cells within biofilm matrix [51] |
| Large-Area Automated AFM | High-resolution structural imaging | Analyzing cellular orientation and flagellar interactions in Pantoea sp. [50] |
| Confocal Microscopy with Segmentation | 3D cellular resolution imaging | Tracking individual cells in V. cholerae biofilms [45] |
| Tunable Expression Systems | Controlled gene expression (e.g., arabinose-inducible) | Modulating RbmA production in V. cholerae to test attraction mechanisms [45] |
Applications in Persister Dynamics Research
Integrating architectural models with persister dynamics represents a crucial frontier in biofilm research. Nutrient gradients within structured biofilms create microenvironments that promote phenotypic transitions to dormant states [48] [12]. Agent-based models can incorporate multiple hypothetical mechanisms of dormant cell formation:
- Stochastic Process: Random transitions to dormancy independent of environmental conditions
- Nutrient-Dependent: Dormancy triggered by low nutrient concentrations
- Oxygen-Dependent: Anaerobic conditions inducing dormant states
- Time-Dependent: Growth arrest following extended periods without division
Simulations implementing these mechanisms yield qualitatively different spatiotemporal distributions of dormant cells, suggesting experimental approaches to discriminate between hypotheses [48]. For instance, nutrient perturbation experiments combined with spatial mapping of persister cells can determine which mechanism dominates in specific biofilms.
Continuum models that couple nutrient transport with dynamics of proliferative bacteria, persisters, dead cells, and extracellular polymeric substances provide a complementary approach [12]. These models reveal that nutrient limitation produces a high proportion of persister cells even when biomass is reduced, while nutrient-rich conditions support reversion to proliferative growth [12]. Such models predict critical intervention windows when persister populations peak, identifying optimal timing for antibiotic treatments.
Agent-based modeling provides a powerful framework for understanding how biofilm architecture emerges from single-cell interactions. The protocols outlined in this application note enable researchers to implement models capturing key mechanisms such as chemotactic responses to signaling molecules, mechanical interactions mediated by matrix components, and nutrient-dependent phenotypic heterogeneity. By integrating these computational approaches with advanced experimental techniques like large-area AFM and single-cell microscopy, researchers can dissect the fundamental principles governing biofilm organization and leverage this understanding to develop novel strategies for controlling biofilm-related infections, particularly through manipulation of persister dynamics. The iterative cycle of model development, experimental validation, and refinement continues to enhance our understanding of these complex microbial communities, bridging the gap between individual cellular behaviors and collective architectural patterns.
Agent-based modeling (ABM) has emerged as a powerful computational approach for investigating the complex dynamics of bacterial biofilms. Unlike traditional population-level models, ABM represents each bacterium as an individual agent with unique characteristics and behaviors, allowing researchers to simulate how cell-to-cell interactions and environmental factors give rise to emergent community structures [9] [52]. This bottom-up approach is particularly valuable for studying Pseudomonas aeruginosa and polymicrobial biofilms, where heterogeneity, spatial organization, and interspecies interactions critically influence biofilm development, antibiotic resistance, and persistence [53]. ABMs enable researchers to bridge the gap between individual cellular behaviors and population-level outcomes, providing insights that would be challenging to obtain through experimental methods alone [52]. This application note details specific case studies and protocols for implementing ABM to investigate P. aeruginosa and polymicrobial biofilm dynamics, with particular emphasis on persister cell formation and therapeutic interventions.
Case Study 1: ABM ofP. aeruginosaBiofilm Detachment Mechanisms
Li et al. utilized an ABM built upon the iDynoMiCS platform to investigate how different detachment mechanisms influence the structural development of P. aeruginosa biofilms [9] [52]. The study aimed to understand how shear forces, nutrient limitations, and erosion processes shape biofilm architecture over time, which is crucial for understanding biofilm resilience and dissemination [9].
Key Parameters and Implementation
The model incorporated individual bacterial agents with parameters for growth, metabolism, and response to mechanical and chemical cues. The simulation space was divided into a grid where nutrients diffused and agents interacted.
Table 1: Key Parameters for P. aeruginosa Biofilm Detachment ABM
| Parameter Category | Specific Parameters | Implementation in ABM |
|---|---|---|
| Detachment Mechanisms | Shear detachment, nutrient-limited detachment, erosion | Applied as rules governing agent removal from biofilm |
| Bacterial Properties | Growth rate, metabolic requirements, division threshold | Individual agent attributes updated each time step |
| Environmental Factors | Nutrient concentration, diffusion coefficients, fluid shear stress | Grid-based variables influencing agent behavior |
| Spatial Considerations | Biofilm thickness, local cell density, proximity to substrate | Calculated from agent positions affecting detachment probability |
Experimental Protocol
Protocol 1.1: Implementing Biofilm Detachment ABM Using iDynoMiCS
Model Initialization:
- Configure a two-dimensional simulation grid representing the substrate and fluid environment.
- Initialize bacterial agents at random positions on the substrate surface with identical starting biomass.
- Set initial nutrient concentrations throughout the grid, with higher concentrations in the fluid phase.
Parameter Configuration:
- Set bacterial parameters: maximum growth rate (0.5-1.0 h⁻¹), division biomass threshold, maintenance energy requirements.
- Configure nutrient diffusion coefficients (e.g., 8.64×10⁻⁶ cm²/s for oxygen) [54].
- Define detachment parameters: shear detachment coefficient (function of biofilm height), critical nutrient level for nutrient-limited detachment, erosion rate constant.
Simulation Execution:
- Run simulation in discrete time steps (e.g., 5-minute intervals).
- At each time step:
- Calculate nutrient diffusion using finite difference methods.
- Update individual agent states based on local nutrient availability.
- Implement bacterial division when biomass threshold reached, placing daughter cells in adjacent locations.
- Apply detachment rules based on current biofilm structure and environmental conditions.
- Record biofilm thickness, roughness, and porosity metrics.
Data Collection and Analysis:
- Export spatial configuration of biofilm at regular intervals.
- Quantify structural parameters: average thickness, surface area-to-volume ratio, cluster size distribution.
- Compare temporal evolution of biofilm structure under different detachment mechanisms.
Key Findings and Significance
The ABM revealed that detachment mechanisms operate on different temporal scales and produce distinct biofilm architectures [9] [52]. Shear detachment predominantly affected mature biofilms, resulting in flattened structures with streamlined contours. Nutrient-limited detachment created hollow biofilm cores and eventual sloughing of large clusters. Erosion produced isolated cell clusters throughout development. These findings demonstrate how ABM can predict structural adaptations in biofilms under varying environmental conditions, informing anti-biofilm strategies that target specific detachment mechanisms.
Case Study 2: Multiscale Modeling ofP. aeruginosaBiofilm Metabolism
Biggs and Papin developed a novel multiscale modeling approach combining ABM with constraint-based metabolic modeling to simulate P. aeruginosa biofilm formation [54]. Their MatNet tool integrated NetLogo for agent-based simulation with MATLAB for flux balance analysis, creating a framework that connected spatial organization with metabolic activity.
Key Parameters and Implementation
The model simulated individual bacterial agents with genome-scale metabolic networks, creating a direct link between spatial position, nutrient access, and metabolic capability.
Table 2: Parameters for Multiscale ABM of P. aeruginosa Biofilm Metabolism
| Model Component | Parameters | Implementation |
|---|---|---|
| Agent-Based Model (NetLogo) | Agent position, division threshold, shoving rules | Managed spatial arrangement and mechanical interactions |
| Metabolic Model (MATLAB) | 105 extracellular metabolites, exchange fluxes, growth yields | Computed metabolic fluxes and growth rates using FBA |
| Cross-Scale Integration | Local nutrient concentrations, metabolite diffusion rates | Scaled exchange fluxes in FBA based on local ABM environment |
Diagram 1: Multiscale ABM Workflow Integrating NetLogo and MATLAB
Experimental Protocol
Protocol 2.1: Implementing Multiscale ABM with MatNet
Software Setup:
- Install NetLogo (version 6.0 or higher) and MATLAB with COBRA Toolbox.
- Download and configure MatNet extension for NetLogo.
- Load genome-scale metabolic reconstruction of P. aeruginosa (iMO1086 or subsequent versions).
Model Configuration:
- Initialize 2D simulation grid in NetLogo (e.g., 100×100 grid units).
- Configure diffusion parameters for key metabolites (oxygen, glucose, nitrate) with reduced diffusion through biofilm regions (25-60% of aqueous rates) [54].
- Set initial conditions for glucose minimal media with defined metabolite concentrations.
Simulation Workflow:
- For each time step (simulating 5 minutes of real time):
- In NetLogo: Calculate nutrient diffusion, update agent positions based on growth and division.
- Pass local nutrient concentrations for each occupied grid cell to MATLAB via MatNet.
- In MATLAB: Scale exchange flux constraints in the metabolic model based on local nutrient availability.
- Perform flux balance analysis to compute growth rate and metabolic fluxes for each agent.
- Return growth rates to NetLogo to determine biomass accumulation and division.
- For each time step (simulating 5 minutes of real time):
Validation and Analysis:
- Validate model by comparing simulated biofilm structures to experimental microscopy data.
- Test metabolic predictions by simulating anaerobic conditions with nitrate supplementation.
- Perform gene knockout studies to identify metabolic essential genes for biofilm growth.
Key Findings and Significance
The multiscale model successfully recapitulated oxygen-limited biofilm metabolic activity and predicted enhanced growth via anaerobic respiration with nitrate supplementation [54]. The integration of ABM with constraint-based metabolism enabled hypothesis generation about how gene-level perturbations influence biofilm structure, demonstrating the power of multiscale approaches for connecting molecular mechanisms to community-level phenotypes.
Case Study 3: ABM of Polymicrobial Interactions in Gut Mucosal Biofilms
A 2024 study developed an ABM to investigate how metabolic interactions shape emergent structures in conceptual gut mucosal bacterial communities [11]. The model explored competition, neutralism, commensalism, and mutualism to determine how these fundamental ecological relationships influence biofilm architecture and community stability.
Key Parameters and Implementation
The model simulated dual-species biofilms with varying metabolic relationships, incorporating nutrient consumption, metabolic byproduct exchange, and spatial constraints.
Table 3: Parameters for Polymicrobial Gut Biofilm ABM
| Interaction Type | Metabolic Basis | Expected Structural Outcome |
|---|---|---|
| Competition | Both species consume identical nutrient source | Segregated patches with distinct domains |
| Neutralism | Each species consumes different nutrients with no interaction | Larger segregated patches with limited mixing |
| Commensalism | Species A produces metabolic byproduct consumed by Species B | Moderate intermixing with directional dependence |
| Mutualism | Cross-feeding where both species exchange beneficial metabolites | Highly intermixed, interconnected domains |
Experimental Protocol
Protocol 3.1: Modeling Metabolic Interactions in Polymicrobial Biofilms
Model Initialization:
- Create simulation domain representing gut mucosal surface with crypt-like topographies.
- Initialize two bacterial species with random distribution on the surface.
- Set initial nutrient concentrations in bulk fluid and host secretion regions.
Metabolic Interaction Configuration:
- For competition: Both species assigned identical nutrient uptake capabilities.
- For neutralism: Each species assigned unique, non-interacting nutrient sources.
- For commensalism: Species A produces metabolite consumed by Species B.
- For mutualism: Both species produce metabolites consumed by the other.
Simulation Parameters:
- Set growth constants (Monod kinetics) for nutrient uptake and byproduct utilization.
- Configure diffusion coefficients for all metabolites through biofilm matrix.
- Define agent behaviors: attachment, growth, division, shoving, detachment.
Simulation and Analysis:
- Run multiple simulations (n≥5) for each interaction type to account for stochasticity.
- Quantify biofilm morphology parameters: thickness, surface area-to-volume ratio, mixing index.
- Analyze population dynamics: relative species abundance over time, colonization resistance against invaders.
- Perform sensitivity analysis on key parameters (growth rates, diffusion coefficients).
Key Findings and Significance
The ABM revealed that metabolic interactions fundamentally govern biofilm structure and function [11]. Competition produced sparse, segregated patches, while mutualism and commensalism fostered highly intermixed communities with small, interconnected sectors. Cross-feeding interactions promoted species coexistence and increased community stability against perturbations. These structural patterns emerged early in biofilm development and persisted throughout maturation, suggesting that metabolic interdependencies create recognizable architectural signatures in polymicrobial communities.
Case Study 4: ABM for Optimizing Antibiotic Treatment Against Biofilms
A 2024 study employed ABM to design and optimize periodic antibiotic treatment strategies against bacterial biofilms, with particular focus on persister cell dynamics [55]. The model aimed to identify dosing regimens that could eliminate biofilms while minimizing total antibiotic usage.
Key Parameters and Implementation
The model incorporated persister cell formation, antibiotic killing kinetics, and regrowth dynamics during treatment intervals.
Diagram 2: Periodic Antibiotic Treatment Optimization Workflow
Experimental Protocol
Protocol 4.1: ABM for Optimizing Periodic Antibiotic Treatments
Model Setup:
- Initialize biofilm with mixed population of normal and persister cells.
- Define persister switching dynamics (spontaneous and stress-induced transitions).
- Set antibiotic pharmacodynamics: killing rate for susceptible cells, minimal effect on persisters.
Treatment Protocol Simulation:
- Simulate continuous antibiotic treatment as baseline.
- Test periodic regimens with varying ON/OFF cycles (e.g., 4h ON/8h OFF, 8h ON/16h OFF).
- During ON cycles: Apply antibiotic killing to susceptible population.
- During OFF cycles: Allow persister resuscitation and regrowth of susceptible population.
Optimization Procedure:
- Run parameter sweep across treatment frequencies and durations.
- Calculate total antibiotic exposure required for biofilm eradication for each regimen.
- Identify optimal treatment window that targets resuscitated persisters before significant regrowth.
Validation Metrics:
- Monitor total biofilm biomass over time.
- Track persister fraction dynamics throughout treatment.
- Calculate treatment efficacy: time to eradication and total antibiotic usage.
Key Findings and Significance
The ABM demonstrated that properly tuned periodic antibiotic dosing could reduce total antibiotic requirement by nearly 77% compared to continuous treatment [55]. The optimal treatment timing was highly dependent on persister switching dynamics and resuscitation rates. Despite variations in persister behavior across different bacterial strains, the model identified generally effective periodic strategies that significantly improved treatment efficiency while reducing antibiotic exposure.
The Scientist's Toolkit: Essential Research Reagents and Platforms
Table 4: Key Research Reagent Solutions for ABM of Biofilms
| Category | Specific Tool/Platform | Function in ABM Research |
|---|---|---|
| ABM Software Platforms | NetLogo, iDynoMiCS, NUFEB, BacSim | Provide environments for implementing agent-based models of biofilms |
| Multiscale Integration Tools | MatNet (MATLAB-NetLogo extension) | Enables data passing between ABM and metabolic modeling platforms |
| Metabolic Modeling Resources | COBRA Toolbox, genome-scale metabolic reconstructions (e.g., iMO1086 for P. aeruginosa) | Constrain bacterial growth and metabolism in multiscale models |
| Experimental Validation Systems | Flow cells, confocal microscopy, microfluidics | Provide quantitative data for model parameterization and validation |
| Biofilm Matrix Components | Psl, Pel, alginate, extracellular DNA | Key structural elements represented in ABMs of P. aeruginosa biofilms [56] [57] |
| Therapeutic Modulators | Phage Clew-1, silver nanoparticles, antibiotic regimens | Intervention strategies tested in silico using ABM platforms [58] [57] [55] |
These case studies demonstrate the versatility and power of agent-based modeling for investigating P. aeruginosa and polymicrobial biofilm dynamics. ABM enables researchers to bridge scales from individual cellular behaviors to emergent community properties, providing insights that inform therapeutic development. The protocols outlined here offer practical guidance for implementing ABM approaches to study biofilm persistence, metabolic interactions, and treatment optimization. As ABM methodologies continue to advance, integrating more sophisticated representations of microbial physiology and host-environment interactions, they will play an increasingly important role in combating biofilm-associated infections.
Leveraging ABMs to Overcome Treatment Failure and Optimize Therapies
Simulating Antibiotic Treatment Failure and Biofilm Regrowth
Biofilm-associated infections represent a significant challenge in clinical settings due to their high tolerance to antibiotic treatments and propensity for regrowth following therapy. These structured microbial communities, encased in a self-produced extracellular matrix, are implicated in a majority of chronic bacterial infections [59]. Within biofilms, subpopulations of phenotypic persister cells exhibit transient tolerance to antimicrobials without acquiring genetic resistance, contributing significantly to treatment failure and infection recurrence [36]. This Application Note establishes a framework for investigating antibiotic treatment failure and biofilm regrowth dynamics through the integration of agent-based modeling and experimental validation. The protocol is designed specifically for researchers investigating persister dynamics and their role in therapeutic outcomes, providing both computational and wet-lab methodologies to quantify and predict biofilm behavior under various treatment regimens.
Background
Biofilm Persister Dynamics and Treatment Challenges
Biofilm architecture facilitates the development of heterogeneous microenvironments characterized by gradients of nutrients, oxygen, and metabolic activity [59]. This heterogeneity promotes the formation of dormant persister cells that can survive antibiotic exposure and subsequently resuscitate to repopulate the biofilm [36]. The extracellular polymeric substance matrix further compromises antibiotic efficacy by limiting penetration and providing binding sites for antimicrobial agents, particularly those with cationic structures [59].
Traditional antibiotic protocols developed against planktonic bacteria often fail against biofilms due to fundamental differences in bacterial physiology and protection mechanisms. As noted in recent research, "Biofilm-residing bacteria embedded in an extracellular matrix are protected from diverse physicochemical insults" [60]. This protection, combined with the inoculum effect from high bacterial density, diminishes antibiotic concentration per cell and contributes to treatment failure [60].
Agent-Based Modeling of Biofilm Systems
Agent-based modeling represents a bottom-up computational approach where each bacterium is simulated as an autonomous agent with defined behavioral rules [9]. This methodology effectively captures the emergent properties of biofilm systems, including structural heterogeneity, persister dynamics, and population-level responses to environmental perturbations [36] [9]. ABMs simulate individual cell behaviors such as growth, division, nutrient uptake, persister switching, and response to antibiotics within spatially explicit environments [36].
The strength of ABM lies in its ability to model stochastic events and local interactions that drive biofilm development and treatment outcomes. As highlighted in recent literature, "Agent-based models can better capture these characteristics and have become increasingly popular for studying cellular populations and biofilms" [36]. This approach is particularly valuable for investigating persister dynamics, as it can simulate how switching rates between susceptible and persister states influence treatment efficacy and regrowth patterns.
Computational Framework: Agent-Based Modeling of Biofilm Treatment
Model Design and Implementation
The agent-based model framework for simulating antibiotic treatment and biofilm regrowth incorporates individual bacterial agents, diffusible components, and environmental factors within a spatially explicit grid. This design enables researchers to simulate the dynamics of biofilm development, antibiotic treatment, and post-treatment regrowth under controlled parameters.
Table 1: Core Components of the Biofilm Agent-Based Model
| Component Category | Specific Elements | Description |
|---|---|---|
| Bacterial Agents | Susceptible cells | Vegetative cells with normal growth and antibiotic sensitivity |
| Persister cells | Dormant, antibiotic-tolerant cells with reduced metabolism | |
| Diffusible Components | Nutrients (e.g., carbon sources) | Growth substrates with defined diffusion coefficients |
| Antibiotic molecules | Antimicrobial agents with specific diffusion and decay rates | |
| Environmental Factors | Substratum surface | Attachment surface for initial biofilm formation |
| Bulk fluid flow | Medium flow providing nutrients and antibiotics |
The model employs a shoving algorithm to resolve mechanical interactions between cells as they grow and divide within the confined biofilm space [36]. Each bacterial agent follows Monod kinetics for growth, with specific growth rate determined by local nutrient concentration:
Where mi represents cell mass, μmax is maximal specific growth rate, CS is local substrate concentration, and KS is the half-saturation constant [36].
Persister Dynamics Implementation
A critical aspect of the model is the implementation of persister cell dynamics, including switching between susceptible and persister states. The model incorporates dual switching mechanisms based on both substrate limitation and antibiotic exposure to reflect realistic biofilm environments [36]. Switching rates can be defined as:
- Susceptible-to-Persister: Triggered by nutrient starvation or antibiotic presence
- Persister-to-Susceptible: Occurs when conditions improve, following antibiotic removal
Table 2: Key Parameters for Persister Dynamics in ABM
| Parameter | Symbol | Default Range | Biological Significance |
|---|---|---|---|
| Growth rate susceptibility | μmax_s | 0.1-0.5 h⁻¹ | Determines biofilm expansion speed |
| Persister formation rate | k_sp | 10⁻⁵-10⁻³ h⁻¹ | Frequency of switching to dormant state |
| Persister resuscitation rate | k_ps | 10⁻²-10⁻¹ h⁻¹ | Recovery rate to susceptible state |
| Antibiotic killing rate susceptible | δ_s | 0.1-10 h⁻¹ | Efficacy against vegetative cells |
| Antibiotic killing rate persister | δ_p | 0.001-0.1 h⁻¹ | Reduced efficacy against persisters |
| Nutrient diffusion coefficient | D_n | 100-500 μm²/s | Affects nutrient penetration depth |
Simulation of Antibiotic Treatment and Regrowth
The ABM protocol simulates antibiotic treatment by introducing antimicrobial agents into the bulk fluid flow, with diffusion through the biofilm matrix following Fick's laws. The model quantifies treatment efficacy by tracking viable cell counts over time and monitors regrowth dynamics during the post-antibiotic recovery phase.
Protocol: Computational Simulation of Antibiotic Treatment
Initialize biofilm growth simulation
- Set initial surface colonization with 27 susceptible bacteria randomly positioned on substratum
- Define nutrient composition and flow conditions in bulk fluid
- Run simulation until biofilm reaches mature state (typically 24-48 simulated hours)
Implement antibiotic treatment regimen
- Introduce antibiotic at defined concentration (e.g., 5xMIC, 80xMIC) into bulk fluid
- Set treatment duration (e.g., 4-24 hours) based on experimental design
- Monitor spatial distribution of killing efficacy through live/dead staining algorithm
Simulate post-antibiotic recovery
- Switch bulk fluid to antibiotic-free medium
- Track regrowth from surviving persister cells
- Quantify time to biofilm biomass recovery
Analyze simulation outputs
- Calculate percentage killing compared to pre-treatment biomass
- Determine repopulation kinetics and time to full recovery
- Map spatial patterns of persister cell distributions
Experimental Validation: Monitoring Biofilm Killing and Regrowth
Biofilm Cultivation and Antibiotic Exposure
This protocol provides methodology for experimental validation of computational predictions using Pseudomonas aeruginosa as a model biofilm-forming organism, with adaptability to other clinically relevant species.
Protocol: Experimental Assessment of Biofilm Regrowth
Materials and Reagents
- Microbial strain: P. aeruginosa GFP-tagged laboratory strain
- Growth medium: Tryptic soy broth (TSB) or LB broth
- Antibiotics: Tobramycin (1 µg/mL MIC), Colistin (0.5 µg/mL MIC)
- Staining reagents: Propidium iodide (PI) for dead cell staining
- Substrata: Medical-grade silicone coupons or flow cell chambers
Procedure
Biofilm cultivation
- Grow overnight planktonic culture of P. aeruginosa in appropriate medium
- Dilute to 10⁶ CFU/mL in fresh medium
- Inoculate flow chambers or silicone coupons and incubate under continuous flow conditions (0.2 mm/s) for 48-72 hours at 37°C to establish mature biofilms
Antibiotic treatment application
- Prepare antibiotic solutions in growth medium at target concentrations (e.g., 10xMIC, 20xMIC)
- Switch continuous flow to antibiotic-containing medium for defined treatment period (4-24 hours)
- For intermittent treatment designs, cycle between antibiotic and antibiotic-free medium
Real-time monitoring of killing efficacy
- Include propidium iodide (5 µM) in medium to monitor cell death in real-time
- Use automated confocal laser scanning microscopy with time-lapse capability
- Acquire images at predetermined intervals (every 30-60 minutes) throughout treatment phase
- Quantify killing kinetics by measuring increasing PI fluorescence (dead cells) and decreasing GFP fluorescence (total cells)
Post-antibiotic recovery assessment
- Switch flow to antibiotic-free medium to initiate recovery phase
- Continue time-lapse imaging for 24-72 hours to monitor regrowth
- Quantify repopulation kinetics by measuring increasing GFP fluorescence
Endpoint analysis
- Disrupt biofilms by sonication and quantify viable counts by plating
- Compare with pre-treatment viable counts to determine overall killing efficacy
- Calculate time to 50% and 90% biomass recovery from regrowth curves
Data Analysis and Model Validation
Quantitative analysis of killing and regrowth kinetics enables direct comparison between experimental results and computational predictions. Key parameters include:
- Time to effective killing (teff5): Time required to kill 5% of biofilm population
- Maximum killing rate: Slope of killing curve during most effective phase
- Time to 50% biomass recovery: Duration from antibiotic cessation to half-maximal biomass
- Repopulation rate: Growth rate during recovery phase
Table 3: Experimental Killing Kinetics of Antibiotics Against P. aeruginosa Biofilms
| Antibiotic | Concentration | Time to 5% Killing (teff5) | Maximum Killing Achieved | Time to 50% Regrowth |
|---|---|---|---|---|
| Colistin | 10 µg/mL | ~2.3 hours | ~90% | 18-24 hours |
| Colistin | 25 µg/mL | ~1.8 hours | ~95% | 24-36 hours |
| Tobramycin | 20 µg/mL | >6 hours | ~85% | 12-18 hours |
| Tobramycin | 50 µg/mL | ~6 hours | ~90% | 18-24 hours |
| Ethanol (70%) | Control | ~1.3 hours | ~99% | N/A |
Validation of the ABM requires comparing these experimental metrics with simulation outputs, with iterative refinement of model parameters to improve predictive accuracy. Discrepancies between simulated and experimental results often inform new biological insights regarding persister switching dynamics or antibiotic penetration limitations.
Integrated Application: Optimizing Treatment Strategies
Utilizing the Framework for Treatment Optimization
The combined computational-experimental framework enables systematic evaluation of antibiotic treatment strategies against biofilm infections. By simulating various dosing regimens, researchers can identify optimized approaches that maximize killing while minimizing regrowth potential.
Case Study: Periodic Dosing Optimization
Using the ABM platform, researchers can test periodic dosing regimens that align with persister resuscitation dynamics. Simulations have demonstrated that "if periodic antibiotic dosing was tuned to biofilm dynamics, the dose required for effective treatment could be reduced by nearly 77%" [36]. The framework enables identification of critical treatment parameters:
- Optimal treatment intervals: Timing between doses that targets resuscitated persisters
- Minimum effective concentration: Lowest antibiotic concentration achieving target killing
- Treatment duration: Balance between efficacy and resistance selection risk
Table 4: ABM-Guided Treatment Optimization Parameters
| Treatment Strategy | Total Antibiotic Dose | Treatment Efficacy | Regrowth Potential | Resistance Risk |
|---|---|---|---|---|
| Continuous high-dose | 100% (reference) | High | Low | High |
| Periodic optimized dosing | 23% of reference | High | Low | Medium |
| Continuous low-dose | 30% of reference | Low | High | Medium-High |
| Single bolus dose | 50% of reference | Medium | High | Low |
Analyzing Resistance Evolution
The framework also facilitates investigation of resistance development under different treatment regimens. Recent experimental evolution studies demonstrate that "intermittent antibiotic treatment of bacterial biofilms favors the rapid evolution of resistance" [61]. The ABM can be extended to include mutation rates and selection pressures to predict resistance emergence.
The Scientist's Toolkit
Table 5: Essential Research Reagents and Resources
| Category | Item | Specification/Function |
|---|---|---|
| Computational Tools | NetLogo platform | Open-source ABM environment with biofilm modeling capabilities |
| iDynoMiCS | Specialized ABM software for microbial systems | |
| Custom MATLAB/Python scripts | For specialized analysis and model extensions | |
| Experimental Materials | GFP-tagged P. aeruginosa | Enables real-time monitoring of biofilm dynamics |
| Medical-grade silicone coupons | Represents implanted medical device surfaces | |
| Flow cell systems | Enables continuous nutrient/antibiotic delivery | |
| Analytical Reagents | Propidium iodide (PI) | Cell impermeant dye indicating cell death |
| Tobramycin | Aminoglycoside antibiotic for Gram-negative infections | |
| Colistin | Polymyxin antibiotic for multidrug-resistant pathogens | |
| Equipment | Confocal Laser Scanning Microscope | Enables time-lapse imaging of biofilm structures |
| Automated image analysis software | Quantifies biomass, viability, and structural parameters |
This Application Note presents an integrated framework combining agent-based modeling and experimental validation to investigate antibiotic treatment failure and biofilm regrowth. The protocol enables researchers to simulate and empirically test treatment strategies against biofilm infections, with particular emphasis on persister cell dynamics. The quantitative parameters and methodologies provided facilitate direct comparison between computational predictions and experimental outcomes, supporting therapeutic optimization. As antimicrobial resistance continues to threaten global health, this multidisciplinary approach offers a powerful strategy for developing more effective interventions against recalcitrant biofilm infections.
Optimizing Periodic Dosing Regimens to Target Reawakening Persisters
Bacterial persisters are a subpopulation of genetically drug-susceptible, non-growing, or slow-growing cells that exhibit remarkable tolerance to high doses of conventional antibiotics. Unlike resistant bacteria, persisters do not possess genetic mutations enabling survival but instead enter a transient, dormant phenotypic state that protects them from the lethal actions of most antimicrobials, which typically target active cellular processes. When antibiotic pressure is removed, these persister cells can "reawaken" or resume normal growth, leading to relapse of infections and contributing to chronic and recurrent disease states. Persisters have been strongly implicated in biofilm-associated infections, which are responsible for the majority of chronic bacterial diseases and exhibit tolerance levels 100–10,000 times greater than their planktonic counterparts [36] [1].
The phenomenon of persistence poses a significant challenge for effective antimicrobial therapy, particularly in the context of biofilms, which are structured communities of bacteria encased in a self-produced extracellular matrix. The inherent heterogeneity of biofilms, combined with diverse and dynamic persister switching mechanisms influenced by environmental conditions such as nutrient availability, oxygen tension, and antibiotic presence, creates a complex therapeutic target. Traditional continuous dosing regimens often fail to eradicate these dormant cells, necessitating the development of optimized treatment strategies that specifically target the persister subpopulation during vulnerable phases of their life cycle [36] [62].
Within the broader context of agent-based modeling of biofilm persister dynamics research, this protocol outlines methodologies for designing and testing periodic dosing regimens. These regimens are strategically timed to align with the reawakening of persister cells, thereby sensitizing them to antibiotic treatment and potentially reducing the overall antibiotic burden required for effective infection control.
Key Principles and Theoretical Framework
The Rationale for Periodic Dosing
The fundamental principle underlying periodic dosing strategies is the dynamic nature of the persister state. Bacterial cells can stochastically switch between a susceptible, growth-prone state and a tolerant, dormant persister state. This switching is influenced by both intrinsic factors (e.g., toxin-antitoxin systems, stochastic gene expression) and extrinsic factors (e.g., nutrient limitation, antibiotic exposure) [36] [1]. During continuous antibiotic exposure, susceptible cells are killed, while persister cells survive. However, upon removal of the antibiotic, these persister cells can revert to a susceptible state.
Periodic dosing capitalizes on this dynamic by introducing antibiotic pulses timed to coincide with the window when a maximal number of persister cells have reverted to a susceptible state but before the population has expanded significantly. This approach has been demonstrated to "reawaken" persistent subpopulations and reduce the overall dosage required for effective treatment by up to 77% compared to continuous dosing strategies [36] [63].
Agent-Based Modeling as a Predictive Tool
The design of effective periodic dosing regimens is complicated by the significant heterogeneity in persister dynamics between different bacterial strains, environmental conditions, and biofilm architectures. Agent-based models (ABMs) are computational frameworks that simulate the behavior and interactions of individual entities (agents), such as bacterial cells, within a virtual environment. In the context of biofilm persister dynamics, ABMs can incorporate rules for:
- Bacterial Growth and Division: Governed by local substrate availability using Monod kinetics [36].
- Phenotypic Switching: Stochastic or triggered transitions between susceptible and persister states based on antibiotic presence and substrate levels [36].
- Antibiotic Diffusion and Action: Simulating the diffusion of antibiotics from the bulk fluid into the biofilm and their differential killing effects on susceptible and persister cells [36].
By simulating a wide range of dosing schedules and persister switching dynamics in silico, ABMs can identify key parameters and promising treatment regimens, which can then be validated experimentally. This streamlines the optimization process, reducing the need for costly and time-consuming in vitro and in vivo experimentation [36].
The following diagram illustrates the core logic of how periodic dosing targets persisters and how ABMs simulate this process.
Quantitative Data and Experimental Evidence
The following tables summarize key quantitative findings from recent research on persister dynamics and the efficacy of optimized treatment strategies.
Table 1: Efficacy of Optimized Periodic Dosing Compared to Conventional Dosing
| Dosing Strategy | Model System | Key Outcome | Quantitative Result | Reference |
|---|---|---|---|---|
| Optimized Periodic Dosing | Agent-based model (NetLogo) simulating diverse persister switching dynamics | Reduction in total antibiotic dose required for effective treatment | Up to 77% reduction | [36] [63] |
| Conventional Continuous Dosing | In vitro biofilms and various computational models | Survival of persister subpopulation leading to treatment failure & relapse | Persister survival typically 0.01% - 1% of population | [36] [64] |
Table 2: Key Parameters Influencing Persister Dynamics and Dosing Optimization
| Parameter | Description | Impact on Persistence & Treatment |
|---|---|---|
| Switching Rate to Persister (α) | Rate at which susceptible cells enter dormancy (often stress-induced). | Higher rates increase persister reservoir, complicating eradication. |
| Switching Rate from Persister (β) | Rate at which persister cells reawaken to susceptible state. | Critical for timing antibiotic pulses; higher rates may allow shorter off-periods. |
| Persister Death Rate (μ_p) | Death rate of persister cells under antibiotic exposure. | Typically very low; mandates strategies other than continuous dosing. |
| Susceptible Death Rate (μ_s) | Death rate of normal cells under antibiotic exposure. | High rates create rapid initial killing, revealing persister fraction. |
| Biofilm Architecture | 3D physical structure of the bacterial community (e.g., mushroom-like). | Affects penetration of antibiotics and location of persister niches. |
Application Notes: Protocol for Developing Optimized Periodic Dosing Regimens
This protocol describes a combined computational and experimental workflow for developing and validating periodic dosing regimens targeted at reawakening persister cells in bacterial biofilms.
Part A: Computational Optimization via Agent-Based Modeling
Objective: To identify candidate periodic dosing regimens in silico using an agent-based model of biofilm growth and treatment.
Materials and Reagents:
- Computational Environment: NetLogo software (v6.3.0 or higher) or equivalent programming environment (Python, MATLAB) for running ABMs.
- Agent-Based Model: A customized ABM that incorporates bacterial growth, division, spatial constraints, and phenotypic switching between susceptible and persister states. The model should include diffusion dynamics for both growth substrates and antibiotics [36].
Procedure:
- Model Parameterization:
- Define initial conditions, including surface dimensions, initial number of bacterial cells, and nutrient source concentration.
- Set bacterial growth parameters (maximal specific growth rate
μ_max, half-saturation constantK_S) based on experimental data or literature values for the target organism. - Define the rules for phenotypic switching. This can be stochastic, antibiotic-triggered, or nutrient-dependent. Initialize the switching rates (α, β) to a baseline value.
- Set antibiotic parameters, including diffusion coefficient, concentration in the bulk fluid, and specific killing rates for susceptible (
μ_s) and persister (μ_p) cells.
Sensitivity Analysis and Model Calibration:
- Vary key parameters (e.g., α, β) over a physiologically relevant range to understand their impact on biofilm composition and architecture.
- Calibrate the model by comparing simulation outputs (e.g., final biofilm biomass, persister fraction in untreated controls) to experimental data from your lab's bacterial strains.
In Silico Dosing Screen:
- Simulate a range of periodic dosing regimens by varying the pulse duration (
T_on) and the interval between pulses (T_off). - Run multiple replicates for each regimen to account for stochasticity.
- The primary outcome measure is the total antibiotic dose required to achieve eradication (e.g., >99.99% reduction in viable cells) over a fixed total treatment time.
- Simulate a range of periodic dosing regimens by varying the pulse duration (
Regimen Selection:
- Identify the 2-3 dosing regimens that achieve eradication with the lowest total antibiotic exposure and are robust to variations in persister switching dynamics.
The workflow for this integrated approach is summarized below.
Part B: Experimental Validation of Optimized Regimens
Objective: To validate the efficacy of the computationally optimized dosing regimens against in vitro biofilm models.
Materials and Reagents:
- Bacterial Strains: Relevant clinical isolates or laboratory strains known to form robust biofilms and generate persisters (e.g., Escherichia coli HM22 (high persistence), Pseudomonas aeruginosa, Staphylococcus aureus) [36] [30] [64].
- Growth Media: Appropriate broth and agar media (e.g., LB, TSB).
- Antibiotics: Stock solutions of the target antibiotic (e.g., ampicillin, ciprofloxacin, tobramycin).
- Equipment: Laminar flow hood, incubator, spectrophotometer for measuring optical density (OD), microtiter plates (96-well or 24-well) for biofilm cultivation, sonication water bath (for biofilm dispersal), colony counter or automated cell counter.
Procedure:
- Biofilm Cultivation:
- Grow biofilms in 96-well or 24-well plates under conditions optimized for the specific bacterial strain (e.g., static incubation for 24-48 hours).
- Gently remove planktonic cells and non-adherent material by washing with sterile saline or buffer.
Time-Kill Assay with Periodic Dosing:
- Expose the pre-formed biofilms to the candidate dosing regimens identified in Part A. This involves adding fresh medium containing the antibiotic for the pulse period (
T_on), then replacing it with antibiotic-free medium for the off period (T_off). - Include controls: biofilms treated with continuous antibiotic and untreated biofilms.
- At predetermined time points (e.g., before each pulse and after each off-period), disrupt biofilms by sonication and vortexing.
- Serially dilute the homogenates and plate on agar plates to enumerate viable cells (CFU/mL).
- Expose the pre-formed biofilms to the candidate dosing regimens identified in Part A. This involves adding fresh medium containing the antibiotic for the pulse period (
Data Analysis:
- Plot the log CFU/mL versus time to generate time-kill curves for each regimen.
- Compare the total reduction in viable cells and the rate of killing for the optimized periodic regimens against continuous dosing and untreated controls.
- Pay particular attention to the presence of a "regrowth" phase during the off-periods, which indicates persister reawakening.
The Scientist's Toolkit: Research Reagent Solutions
Table 3: Essential Reagents and Materials for Persister and Biofilm Studies
| Item | Function/Application | Examples / Notes |
|---|---|---|
| High-Persistence Bacterial Strains | Model organisms for studying persister formation and dynamics. | E. coli HM22 (hipA7 allele); Clinical isolates from chronic infections [30] [64]. |
| Agent-Based Modeling Software | Computational platform for simulating biofilm growth and treatment optimization. | NetLogo; Custom models in Python/MATLAB [36]. |
| Microtiter Plate Biofilm System | High-throughput cultivation and treatment of biofilms in vitro. | 96-well or 24-well polystyrene plates; Crystal violet staining or CFU enumeration [36]. |
| Membrane-Active Compounds | Positive control agents for direct persister killing; used in combination therapy. | Synthetic retinoids (CD437); XF-70/XF-73; Cationic peptides [30] [62]. |
| Anti-Persister Antibiotics | Compounds with demonstrated activity against dormant cells. | Pyrazinamide (Mtb); Eravacycline; Minocycline; Rifamycin SV [30] [1] [62]. |
Analyzing the Impact of Switching Rates on Treatment Survival and Recovery
This application note provides a detailed framework for investigating how environment-dependent switching rates between susceptible and persister cells influence biofilm dynamics under antibiotic stress. We present quantitative data and experimental protocols developed within an agent-based modeling paradigm, enabling researchers to simulate and analyze biofilm resilience mechanisms. The persistent state is transient and reversible, unlike genetic resistance, making the dynamics of phenotypic switching a critical determinant of treatment outcomes [65] [66].
The core of this analysis compares three fundamental switching strategies:
- Constant Switching: Phenotypic changes occur at a fixed probability, independent of the cellular environment.
- Substrate-Dependent Switching: Transition to persistence is triggered by nutrient limitation, while reversion to susceptibility is induced by substrate availability.
- Antibiotic-Dependent Switching: Persister formation is activated by antibiotic detection, with reversion occurring upon antibiotic removal [65].
Understanding these strategies and their parameters is essential for designing effective anti-biofilm treatments and modeling polymicrobial community dynamics.
Comparative Analysis of Switching Strategies
Table 1: Impact of switching strategies on biofilm fitness, survival, and recovery. Adapted from Carvalho et al. (2018) [65].
| Switching Strategy | Impact on Biofilm Fitness | Optimal Survival Parameters | Recovery Efficiency | Key Compromise Required |
|---|---|---|---|---|
| Constant Switching | High amax significantly impairs growth; small biofilms with high persister proportions form. |
Intermediate amax (0.1) with small bmax. |
Dependent on bmax; intermediate bmax (0.1) best. |
Growth vs. persister production; survival vs. recovery. |
| Substrate-Dependent Switching | High amax does not affect growth; persisters form mainly in substrate-deprived zones. |
High amax with small bmax. |
Dependent on bmax; intermediate bmax (0.1) best. |
Survival during treatment vs. recovery after treatment. |
| Antibiotic-Dependent Switching | No fitness cost; switching only induced during antibiotic exposure. | High amax; bmax has little effect on survival. |
High bmax enables fastest recovery; low bmax maintains persister pool. |
Not applicable; strategy inherently decouples survival from growth. |
Key Parameter Definitions and Survival Metrics
Table 2: Key parameters and quantitative outcomes from agent-based simulations. Data sourced from Carvalho et al. (2018) and Popp et al. (2024) [65] [36].
| Parameter / Metric | Description | Typical Range / Value | Impact on Biofilm Survival |
|---|---|---|---|
amax |
Maximum switching rate from susceptible to persister. | 0.001 - 1 (high) | Higher amax increases persister formation, enhancing survival but can impair growth in constant switching. |
bmax |
Maximum switching rate from persister to susceptible. | 0.001 - 1 (high) | High bmax aids recovery but can reduce survival by "waking" persisters during treatment. |
Persister Death Rate (kp) |
Rate at which persisters are directly killed by antibiotic. | Model-dependent | Primary cause of persister death during treatment for antibiotic-dependent strategy [65]. |
| Treatment Duration | Duration of antibiotic exposure. | 2 - 8 hours (in simulated shocks) | Longer treatments (8h) eradicate biofilms if bmax is high in constant/substrate-dependent strategies [65]. |
| Periodic Dosing Efficacy | Reduction in total antibiotic dose with optimized periodic treatment. | Up to 77% reduction | Effective across different switching dynamics, highlighting universality of tuned treatment schedules [36]. |
Experimental Protocols & Methodologies
Agent-Based Model Implementation Protocol
This protocol outlines the setup for an individual-based biofilm model to simulate switching dynamics and antibiotic treatment, based on established computational frameworks [65] [36].
3.1.1 Initialization
- Platform: Implement model in a programmable environment like NetLogo [36].
- Surface Setup: Define a two-dimensional grid representing a solid surface.
- Seeding: Randomly place a small number (e.g., 27) of susceptible bacterial cells on the surface [36].
- Nutrient Source: Define a substrate source (e.g., from the bulk liquid above the biofilm) with a defined concentration (e.g., glucose at 22 mM) [67].
3.1.2 Core Simulation Loop For each time step in the simulation, execute the following sequence for every cell:
3.1.3 Model Calibration and Output
- Growth Kinetics: Model susceptible cell growth using Monod kinetics:
dmi/dt = mi * μmax * (CS / (CS + KS)), wheremiis cell mass,μmaxis maximal growth rate,CSis local substrate concentration, andKSis the half-saturation constant [36]. - Data Collection: Track total biomass, number of susceptible/persister cells, and their spatial distribution over time.
- Validation: Calibrate model parameters using experimental data from killing curves or microscopic analyses [68].
Protocol for Simulating Antibiotic Treatment and Recovery
This protocol details how to use the initialized model to simulate treatment and recovery phases, critical for assessing switching strategy efficacy.
3.2.1 Biofilm Formation Phase
- Run the simulation for a set period (e.g., 5 hours) without antibiotics to allow a mature biofilm to develop [65].
- Record the pre-treatment state, including persister locations and micro-environmental gradients.
3.2.2 Antibiotic Treatment Phase
- Introduction: Introduce antibiotic into the bulk liquid at a defined concentration (e.g., 12.5x MIC) [65] [69].
- Diffusion and Killing: Model antibiotic diffusion and its bactericidal effect. Apply different killing rates for susceptible (
ks) and persister (kp) cells. - Duration: Run the treatment phase for a defined period (e.g., 2h for short shock, 8h for prolonged treatment) [65].
- Dynamic Switching: During this phase, continue to execute the switching rules. Note that for the antibiotic-dependent strategy, the presence of antibiotic should induce
amaxand inhibitbmax.
3.2.3 Post-Treatment Recovery Phase
- Antibiotic Removal: Stop the antibiotic inflow, simulating washout or degradation.
- Monitoring: Continue the simulation for a recovery period (e.g., 5 hours). Monitor the regrowth of the biofilm from surviving persister cells as they switch back to the susceptible state [65].
- Analysis: Quantify recovery by measuring the final biomass or the time to regain pre-treatment biomass.
The Scientist's Toolkit
Table 3: Essential research reagents and computational tools for studying persister dynamics.
| Item / Resource | Function / Description | Application in Research |
|---|---|---|
| NetLogo Platform | A programmable modeling environment for simulating natural phenomena. | Implementation of agent-based biofilm models with customizable rules for growth and switching [36]. |
| COMSTAT Software | A program for quantitative analysis of biofilm structures from confocal image stacks. | Validation of computational models by comparing simulated biofilm architecture with experimental data [68]. |
| Fluorescent Reporters (e.g., GFP, RFP) | Genetically encoded fluorescent proteins. | Tagging specific promoters to monitor gene expression and cell state in experimental persister studies [70] [69]. |
| Microfluidic Devices (MCMA) | Membrane-covered microchamber arrays for single-cell time-lapse microscopy. | Observing single-cell histories and heterogeneous responses of persisters to antibiotic treatment [69]. |
| 2-NBDG | A fluorescent glucose analog. | Visualizing nutrient gradients and identifying nutrient-starved zones within biofilms [67]. |
| Membrane Potential Sensors (e.g., ViBac2) | Genetically encoded sensors that change fluorescence with membrane voltage. | Probing metabolic activity and tetracycline accumulation in different biofilm regions [67]. |
| Persister-FACSeq | Method combining FACS, antibiotic tolerance assays, and next-generation sequencing. | High-throughput analysis of gene expression distributions in persister subpopulations [70]. |
Conceptual Framework and Decision Pathways
The following diagram synthesizes the logical relationships and decision pathways that define the three core phenotypic switching strategies in a simulated biofilm environment.
Bacterial biofilms are surface-associated communities responsible for many chronic and recurrent infections, exhibiting remarkable tolerance to antimicrobial treatments [71]. A key factor underlying this resilience is the presence of persister cells—dormant, phenotypic variants that survive antibiotic exposure without genetic resistance and can repopulate biofilms once treatment ceases [65] [62]. The dynamics of persister formation and resuscitation are complex, heterogeneous, and influenced by local environmental conditions within biofilms, making therapeutic design exceptionally challenging [65].
Agent-based modeling (ABM) has emerged as a powerful computational approach for investigating these dynamics. ABMs represent each bacterial cell as an individual agent with predefined attributes and rules, enabling the study of how macroscopic biofilm properties and treatment outcomes emerge from microscopic individual interactions [40] [52]. This protocol details the application of ABM and sensitivity analysis to identify the most critical parameters governing therapy success against biofilm-associated persister cells, providing a framework to optimize treatment strategies in silico before costly laboratory or clinical testing.
Background
Biofilm Persister Dynamics and Therapeutic Challenges
In biofilms, persister cells can constitute a small subpopulation that exhibits multidrug tolerance without genetic mutation. Their dormancy means they are unaffected by antibiotics that target active cellular processes, allowing them to survive treatment and lead to infection recurrence [62] [72]. Persister formation is not random; it can be influenced by various environmental stressors, including nutrient deprivation, oxidative stress, and the presence of antibiotics themselves [65] [62]. Furthermore, the extracellular polymeric substance (EPS) matrix of biofilms acts as a mechanical shelter, limiting antibiotic penetration and protecting resident cells from immune clearance [71].
The Role of Agent-Based Modeling
ABM is uniquely suited to modeling biofilm systems due to its ability to:
- Capture individual cell heterogeneity and stochasticity.
- Simulate spatiotemporal dynamics of complex community formation.
- Model multi-scale interactions, from intracellular molecular events to population-level emergent structures [40] [52]. An ABM framework allows researchers to simulate virtual biofilms under different treatment regimens and observe how manipulating specific parameters—such as persister switching rates or antibiotic dosing schedules—affects long-term treatment efficacy [63] [65].
Key Parameters for Sensitivity Analysis in Biofilm-Persister ABMs
Sensitivity analysis systematically perturbs model parameters to determine their influence on simulation outcomes. The tables below categorize key parameters for sensitivity analysis in biofilm-persister ABMs, based on critical processes identified in the literature.
Table 1: Parameters related to persister cell physiology and switching dynamics
| Parameter | Description | Impact on System | Suggested Range for SA |
|---|---|---|---|
a_max |
Maximum switching rate from susceptible to persister state [65]. | Higher rates increase persister formation, potentially impairing overall biofilm growth if constant [65]. | 0.001 - 1.0 h⁻¹ |
b_max |
Maximum switching rate from persister to susceptible state ("wake-up") [65]. | Critical for post-antibiotic recovery; high rates can cause persister death during treatment if unregulated [65]. | 0.001 - 1.0 h⁻¹ |
K_p |
Rate of direct killing of persister cells by an antibiotic [65]. | Directly reduces the reservoir of surviving cells. Typically low for conventional antibiotics. | 0 - 0.1 h⁻¹ |
Trigger_S |
Substrate concentration threshold for environment-dependent switching [65]. | Determines spatial localization of persisters in nutrient-gradient niches. | 0.1 - 10.0 mg/L |
Trigger_A |
Antibiotic concentration threshold for induction of persistence [65]. | Models inducible persistence mechanisms affecting treatment efficacy. | 0.1 - 10.0 x MIC |
Table 2: Parameters related to antibiotic treatment and biofilm environment
| Parameter | Description | Impact on System | Suggested Range for SA |
|---|---|---|---|
Dose |
Concentration of antibiotic at the source (e.g., bulk fluid) [63]. | Directly affects penetration and killing power within the biofilm. | 1 - 100 x MIC |
T_on / T_off |
Duration of antibiotic pulse and off-period in periodic dosing [63]. | Tuned periods can exploit persister wake-up dynamics to improve killing [63]. | 1 - 24 h |
Diffusion_A |
Diffusion coefficient of the antibiotic in the biofilm matrix [71]. | Lower values reduce antibiotic penetration, creating spatial heterogeneity in killing. | 10⁻¹² - 10⁻¹⁰ m²/s |
Nutrient_Conc |
Concentration of the primary growth substrate in the bulk fluid [65]. | Affects overall biofilm growth rate and can trigger substrate-dependent persistence. | 0.1 - 100 mg/L |
Yield_Stress |
Mechanical strength of the biofilm matrix (resistance to fluid shear) [71]. | Influences biofilm physical removal and access of immune cells/antimicrobials. | 10 - 1000 Pa |
Experimental Protocol: ABM Setup and Sensitivity Analysis
This protocol provides a step-by-step methodology for implementing an ABM of biofilm persister dynamics and performing a global sensitivity analysis.
Agent-Based Model Initialization and Simulation
Objective: To simulate the growth of a single-species biofilm under a defined antibiotic treatment regimen and track the dynamics of susceptible and persister populations. Reagents & Computational Tools:
- iDynoMiCS [52] or NetLogo [40] ABM platforms.
- High-Performance Computing (HPC) cluster for parallel simulations.
- Post-processing software (e.g., Python with Pandas, NumPy, Matplotlib).
Procedure:
- Define Agent Properties:
- Initialize a population of bacterial agents on a 2D or 3D grid.
- Assign each agent a state:
SusceptibleorPersister. - Define core properties: position, division time, metabolic state, and
a_max/b_maxswitching rates.
Define Environment and Rules:
- Substrate Diffusion: Solve the diffusion-reaction equation for nutrients and antibiotics using a finite difference or finite volume method [40] [11].
- Agent Growth: Model susceptible cell growth using Monod kinetics, where growth rate
µ = µ_max * (S / (K_s + S)). Persister cells are non-growing [65]. - Cell Division: When a susceptible agent reaches a critical size, it divides. Daughter cells inherit properties with possible small stochastic variations.
- Phenotypic Switching: Implement one of the following rules for state switching:
- Constant Switching: A cell switches with a fixed probability per timestep [65].
- Substrate-Dependent Switching: The switch to persistence is triggered when local substrate falls below
Trigger_S; reversion is triggered when substrate is abundant [65]. - Antibiotic-Dependent Switching: The switch to persistence is induced when local antibiotic concentration exceeds
Trigger_A; reversion occurs upon antibiotic removal [65].
- Antibiotic Killing: At each timestep, the probability of a susceptible agent being killed is
K_s * f(A), whereK_sis high andf(A)is a function of local antibiotic concentrationA. For persisters, use a much lowerK_p.
Implement Treatment Regimen:
Run Simulation and Collect Data:
- Run the simulation for the desired total time (e.g., pre-treatment + treatment + recovery).
- At regular intervals, record the total counts of susceptible and persister cells, biofilm biovolume, and spatial distribution of cell states.
The following workflow diagrams the core simulation and analysis process.
Protocol for Global Sensitivity Analysis
Objective: To identify which parameters have the greatest influence on key model outcomes, such as the number of surviving cells post-treatment.
Procedure:
- Define Input Parameters and Output Responses:
- Select parameters for analysis (e.g., all parameters listed in Tables 1 and 2).
- Define the model outcomes of interest, termed "responses". Key responses for therapy development include:
Y_survival: Total number of surviving cells (susceptible + persister) at the end of treatment.Y_recovery: Total number of cells after a post-antibiotic recovery period.Y_eradication_time: Time until total cell count falls below a detection threshold.
Generate Parameter Sets using Latin Hypercube Sampling (LHS):
- For each of the
kparameters being studied, define a plausible range (see Tables 1 and 2). - Use LHS to generate
Nparameter sets, whereNis significantly larger thank(e.g.,N = 500fork = 10). LHS ensures efficient, non-random exploration of the entire parameter space.
- For each of the
Run Ensemble Simulations:
- Run the ABM for each of the
Nparameter sets generated by the LHS. - For each run, record the resulting output responses (
Y_survival,Y_recovery, etc.). - This step is computationally intensive and requires an HPC cluster for parallel processing.
- Run the ABM for each of the
Calculate Sensitivity Indices:
- Use variance-based sensitivity analysis (e.g., Sobol' method) on the resulting data (
Nparameter sets vs.Yresponses). - Calculate the first-order (Si) and total-order (STi) sensitivity indices for each parameter.
S_i: Measures the fractional contribution of parameterialone to the variance of the output.S_Ti: Measures the total contribution of parameteri, including its individual effect and all its interactions with other parameters.
- Use variance-based sensitivity analysis (e.g., Sobol' method) on the resulting data (
The following diagram illustrates the workflow for the sensitivity analysis.
Application Notes and Expected Results
Interpretation of Sensitivity Analysis
- High Total-Order Effect (
S_Ti > 0.1): Parameters with highS_Tivalues are primary drivers of outcome uncertainty and are prime targets for therapeutic intervention or further experimental measurement. For example, Blee et al. (2024) found that parameters related to the timing of periodic antibiotic doses were highly influential [63]. - Interaction Effects: A large difference between
S_TiandS_ifor a parameter indicates its effect is strongly tied to interactions with other parameters. For instance, the optimalT_off(wake-up period) may depend on the intrinsicb_maxrate [63] [65].
Optimizing Therapeutic Strategies
The results of the sensitivity analysis can directly inform therapy design:
- Targeting Critical Parameters: If the analysis reveals that the
b_max(wake-up rate) is a highly sensitive parameter, a promising strategy is to combine conventional antibiotics with compounds that force persister resuscitation (e.g., sugars, metabolites, or cis-2-decenoic acid), making them vulnerable to killing [62] [72]. - Optimizing Dosing Schedules: Sensitivity analysis can identify the most critical aspects of a dosing regimen (e.g.,
T_onandT_off). Simulations have shown that periodic dosing tuned to biofilm dynamics can reduce the total antibiotic dose required for effective treatment by nearly 77% [63]. - Personalized Medicine: By measuring patient- or pathogen-specific parameters (e.g., persister switching rates) and using them to parameterize the model, one could simulate treatment outcomes to select the most robust therapy on an individual basis.
The Scientist's Toolkit: Research Reagent Solutions
Table 3: Essential computational and experimental resources for ABM and validation
| Item/Category | Function in Research | Example/Specification |
|---|---|---|
| ABM Software Platform | Core environment for building and simulating biofilm models. | iDynoMiCS [52], NetLogo [40], custom code (C++, Python). |
| High-Performance Computing (HPC) | Provides computational power for running large ensemble simulations for sensitivity analysis. | Cluster with 100+ cores, >1TB RAM. |
| Global Sensitivity Analysis Library | Statistical software to calculate sensitivity indices from model input/output data. | SALib (Python), R sensitivity package. |
| Microfluidic Biofilm Reactor | Laboratory device for growing biofilms under controlled, spatially-resolved conditions for model validation. | Flow cell with continuous nutrient feed and antibiotic dosing capability [39] [73]. |
| Light Sheet Fluorescence Microscopy (LSFM) | Advanced imaging technique for non-invasively capturing 3D biofilm structure and dynamics over time [39]. | System with ~1µm resolution, compatible with live-cell imaging. |
| Membrane-Active Compounds | Experimental reagents to disrupt persister cell membranes, a strategy identified as promising by modeling. | XF-73, SA-558, synthetic retinoids (CD437) [62]. |
| Persistence-Inducing Agents | Laboratory chemicals used to experimentally generate high-persister populations for model calibration. | Carbonyl cyanide m-chlorophenyl hydrazone (CCCP), Rifampin [72]. |
Bacterial persistence represents a significant challenge in the clinical management of chronic and recurrent infections. Persisters are a subpopulation of genetically susceptible, dormant bacterial cells that exhibit remarkable tolerance to antibiotic treatment, facilitating relapse and chronic infection states [1]. These cells are particularly problematic within biofilms, structured microbial communities encased in an extracellular polymeric substance (EPS), where they contribute to treatment failures and are implicated in up to 80% of human microbial infections [8] [74]. The inherent heterogeneity and spatial organization of biofilms create microenvironments that are difficult to model with traditional, deterministic approaches.
Agent-based modeling has emerged as a powerful computational framework to address this complexity. ABMs simulate a biofilm as a collection of discrete, autonomous agents, each representing an individual bacterial cell with its own set of rules and properties [9] [40]. This methodology is uniquely capable of capturing the emergent system properties of biofilms—such as the development of nutrient gradients, spatial patterning of persister cells, and collective recovery after antibiotic treatment—that arise from stochastic, individual-level interactions [9] [36]. By incorporating mechanistic details of persister switching dynamics, drug diffusion, and cellular death, ABMs provide an in silico testbed for rapidly and cheaply screening potential anti-persister therapies and optimizing treatment schedules before costly and time-consuming laboratory validation [36].
Computational Protocols for Agent-Based Modeling of Biofilm Persisters
This section details the core methodologies for developing and utilizing an ABM to investigate persister dynamics and screen therapeutic interventions.
Agent-Based Model Development Workflow
The following protocol outlines the key stages for constructing an ABM of a bacterial biofilm with persister cell subpopulations, drawing from established modeling practices [9] [36] [40].
Step 1: Platform Selection and Initialization Choose a suitable modeling environment, such as NetLogo or a custom implementation of frameworks like iDynoMiCS [36]. Initialize the simulation by placing a small number of susceptible bacterial agents (e.g., 27 cells) randomly on a surface representing a biotic or abiotic substrate [36].
Step 2: Definition of Agent States and Rules Define at least two phenotypic states for bacterial agents: a susceptible state and a persister state. The rules governing the transitions between these states are critical and should be informed by experimental data. A robust model incorporates switching dynamics dependent on both local substrate availability and the presence of antibiotics [36].
Step 3: Implementation of Biofilm Growth Dynamics Simulate agent growth using a Monod kinetic model, where an agent's growth rate depends on the local concentration of a growth-limiting substrate [36]. Upon reaching a threshold mass, an agent divides into two daughter cells. Mechanical interactions between cells during growth and division are typically resolved using a "shoving" algorithm to prevent overlap and simulate the physical expansion of the biofilm [9] [36].
Step 4: Incorporation of Environmental Dynamics Model the diffusion of substances (nutrients, antibiotics) from the bulk liquid above the biofilm into its depth. This creates the chemical gradients that drive heterogeneous agent behavior. The concentration of these substances at each agent's location is updated at every time step [36].
Step 5: Simulation of Antibiotic Treatment Introduce antibiotic agents into the system according to a defined treatment regimen (e.g., continuous dosing, periodic pulses). Susceptible and persister agents must have different death rates upon exposure. The model should account for the diffusion of the antibiotic through a boundary layer to reach the agents [36] [74].
Step 6: Data Collection and Analysis Run multiple simulations to account for stochasticity. Collect quantitative data on key output metrics, including total and persister biovolume over time, biofilm spatial structure, and the minimum antibiotic dose required for eradication.
Figure 1: A generalized workflow for developing and executing an agent-based model to screen for anti-persister therapies.
Protocol for In Silico Screening of Combination Therapies
This specific protocol describes how to use an established ABM to screen for effective combination therapies targeting persister cells.
Objective: To identify synergistic pairs of antibiotics and/or anti-biofilm peptides that minimize total biovolume and prevent biofilm regrowth.
Materials (In Silico):
- A calibrated ABM of a target pathogen biofilm with integrated persister dynamics.
- Parameter sets for candidate antibiotics (e.g., killing rates for susceptible and persister cells, diffusion coefficients).
- Parameter sets for anti-biofilm peptides or other adjuvants (e.g., efficacy in disrupting EPS, inhibiting quorum sensing, or directly killing persisters).
Method:
- Baseline Calibration: Run the simulation with no treatment to establish baseline biofilm growth and natural persister formation rates over a defined period (e.g., 96 hours).
- Monotherapy Screening: Introduce each candidate antibiotic and anti-biofilm agent as a monotherapy. Test various concentrations and dosing schedules (e.g., continuous vs. periodic). Record the minimum inhibitory concentration and the time to biofilm regrowth post-treatment.
- Combination Therapy Screening: Simulate the simultaneous or sequential administration of a front-line antibiotic with an anti-biofilm peptide or a second antibiotic with a complementary mechanism of action.
- Optimization of Dosing Schedule: For the most promising combinations, systematically vary the timing, duration, and sequence of drug administration to identify the regimen that maximizes killing and minimizes regrowth. For instance, a "triggering" dose of an anti-persister compound might be administered first to awaken dormant cells, followed by a conventional antibiotic [1].
- Validation and Sensitivity Analysis: Perform robustness checks by running multiple stochastic simulations and varying key parameters within biologically plausible ranges to ensure the identified strategy is effective across a range of conditions.
Key Findings and Data from In Silico Models
In silico models have yielded quantitative insights with direct implications for therapeutic development. The tables below summarize key findings on treatment optimization and agent-based model parameters.
Table 1: Key Parameters for an Agent-Based Model of Biofilm Persisters
| Parameter Category | Specific Parameter | Description | Example Value/Function |
|---|---|---|---|
| Agent Properties | Phenotypic State | Defines if an agent is Susceptible or a Persister | Binary or continuum state [36] |
| Growth Rate | Maximum specific growth rate of a susceptible agent | From Monod kinetics [36] | |
| Division Mass | Threshold mass at which an agent divides | e.g., 500 fg [36] | |
| Persister Dynamics | Switching to Persister | Rate of transition from susceptible to persister state | Function of [substrate] & [antibiotic] [36] |
| Switching to Susceptible | Rate of "reawakening" from persister state | Function of [substrate] [36] | |
| Persister Death Rate | Death rate of persisters under antibiotic exposure | Significantly lower than susceptible rate [36] [74] | |
| Environmental Factors | Substrate Concentration | Concentration of growth-limiting nutrient | Diffuses from bulk liquid [36] |
| Antibiotic Concentration | Concentration of antimicrobial agent | Diffuses from bulk liquid; can be transient [74] | |
| Killing Rate (Susceptible) | Death rate of susceptible agents under antibiotic | Function of [antibiotic] [74] |
Table 2: In Silico Optimization of Anti-Persister Treatment Strategies
| Therapeutic Strategy | Key Model Findings | Quantitative Outcome | Reference |
|---|---|---|---|
| Periodic Dosing | Tuning the on/off cycle of antibiotics to the persister switching dynamics can resensitize the population. | Reduced total antibiotic dose required for eradication by up to 77% compared to continuous dosing. | [36] |
| Combination Therapy (Tobramycin + Colistin) | A pharmacodynamic model integrated with ABM can predict synergistic killing. The number of "transit states" to death differs by drug mechanism (5 for Tobramycin, 1 for Colistin). | A single set of model parameters predicted response across a 10-fold range of concentrations and for both continuous/transient dosing. | [74] |
| Anti-Biofilm Peptides (ABPs) | Machine learning models (dPABBs) can predict peptides that disrupt biofilms based on amino acid composition (e.g., cationic residues Arginine (R) and Lysine (K) at the N-terminus). | Prediction models achieved maximum accuracy of 95.24% and specificity of 97.73%, indicating potential for repurposing FDA-approved peptide drugs. | [75] |
| AI-Driven Discovery | AI and ML can analyze omics data to uncover persistence signatures and accelerate molecular screening. | AI-driven docking simulations rapidly identify compounds targeting persister-specific pathways. | [76] |
The Scientist's Toolkit: Research Reagent Solutions
The following table catalogues essential computational and biological reagents that underpin the development and validation of ABMs for anti-persister drug screening.
Table 3: Essential Research Reagents and Tools for ABM and Anti-Persister Research
| Reagent / Tool | Category | Function in Research | Example / Source |
|---|---|---|---|
| NetLogo | Software Platform | A programmable modeling environment for simulating natural phenomena; widely used for developing ABMs due to accessibility. | NetLogo Desktop [36] |
| iDynoMiCS | Software Platform | An open-source, individual-based simulation framework specifically designed for microbial communities, offering high performance. | iDynoMiCS Repository [9] |
| dPABBs Web Server | Bioinformatics Tool | A machine learning-based server for predicting and designing anti-biofilm peptides (ABPs) for experimental testing. | http://ab-openlab.csir.res.in/abp/antibiofilm/ [75] |
| Tobramycin | Antibiotic | An aminoglycoside antibiotic used as a front-line therapy against P. aeruginosa biofilms; serves as a key parameter set in PD models. | Laboratory Supplier [74] |
| Colistin | Antibiotic | A polymyxin antibiotic of last resort for multidrug-resistant Gram-negative infections; used in combination therapy models. | Laboratory Supplier [74] |
| Propidium Iodide (PI) | Fluorescent Dye | A membrane-impermeant dye that stains dead/damaged cells; used experimentally to validate model predictions of non-viable biovolume. | Laboratory Supplier [74] |
| Synthetic Anti-Biofilm Peptides | Bioactive Reagent | Cationic, amphipathic peptides designed to disrupt EPS or membrane of persisters; candidates are identified via in silico screens (e.g., dPABBs). | Custom Synthesis [75] |
Visualization of Core Persister Dynamics
A critical insight from ABMs is the dynamic and heterogeneous nature of persistence. The following diagram illustrates the core mechanistic relationships and agent states that drive treatment outcomes in these models.
Figure 2: Core state transitions and influences for bacterial agents in an ABM. The susceptibility of an agent is dynamically regulated by environmental conditions, which determines its fate under antibiotic treatment.
Validating Model Predictions and Comparing Computational Approaches
Benchmarking ABM Outputs Against Experimental and Clinical Data
Agent-based models (ABMs) are computational approaches where each microbial cell is represented as an autonomous agent with its own set of rules, making them uniquely suited to model the complex interactions between individual microbes and their environment within biofilms [9]. This document provides a standardized framework for benchmarking the outputs of ABMs against experimental and clinical data, a critical process for validating model predictions and generating biologically relevant insights into biofilm persister dynamics.
Benchmarking Framework: Quantitative Metrics for ABM Validation
To ensure ABMs accurately reflect biological reality, model outputs must be systematically compared against quantitative experimental and clinical observations. The following table outlines key metrics for benchmarking.
Table 1: Core Metrics for Benchmarking Biofilm ABMs
| Metric Category | Specific Measurable Output | Experimental Validation Method | Clinical/ In Vivo Correlation |
|---|---|---|---|
| Biofilm Architecture | Biofilm thickness, biovolume, surface coverage, microcolony formation. | Confocal Laser Scanning Microscopy (CLSM), Scanning Electron Microscopy (SEM) [77] [78]. | Analysis of explanted medical devices or tissue biopsies. |
| Cell Viability & Metabolic Activity | Spatial distribution of live/dead cells, metabolic activity levels. | Fluorescence staining (e.g., SYTO 9/propidium iodide), resazurin assay [78]. | Viable bacterial counts (CFU) from chronic infection sites. |
| Molecular Regulation | Expression levels of key genes/sRNAs (e.g., sRNA PA213). | qRT-PCR, RNA-seq, transcriptomic analysis [77]. | RNA extraction and analysis from clinical isolates (e.g., CRPA) [77]. |
| Antimicrobial Response | Reduction in biofilm viability after simulated treatment. | Ex vivo biofilm models treated with AMPs/antibiotics [78] [79]. | MIC/MBC values from clinical isolates; treatment failure rates. |
| Population Dynamics | Relative abundance of species in polymicrobial biofilms. | Shotgun metagenomics, 16S rRNA sequencing [79]. | Microbiome analysis of clinical samples (e.g., sputum, wound swabs). |
Detailed Experimental Protocols for Benchmarking
This section provides detailed methodologies for key experiments used to generate data for ABM benchmarking.
Protocol: Assessing Biofilm Viability and Metabolic Activity
This protocol is used to quantify the effect of antimicrobial agents on pre-formed biofilms, providing critical data for validating ABM predictions of treatment efficacy [78].
I. Materials
- Brain Heart Infusion (BHI) Broth: Standard nutrient medium for growing K. pneumoniae and other bacterial species.
- 96-Well Polystyrene Microtiter Plates: For standardized, high-throughput biofilm cultivation.
- Antimicrobial Peptides (AMPs): e.g., DJK-5, LL-37; aliquoted and stored at -20°C.
- Resazurin Sodium Salt Powder: A blue, non-fluorescent dye reduced to pink, fluorescent resorufin by metabolically active cells.
- SYTO 9 and Propidium Iodide (PI) Stains: Component of the LIVE/DEAD BacLight kit. SYTO 9 stains all bacteria (green), while PI stains only bacteria with compromised membranes (red).
- Phosphate Buffered Saline (PBS), pH 7.4: For washing steps to remove non-adherent cells and reagents.
- Microplate Fluorometer: For quantifying resorufin fluorescence and, optionally, SYTO 9/PI fluorescence.
II. Procedure
- Biofilm Formation:
- Prepare a 1:100 dilution of an overnight bacterial culture in fresh BHI broth.
- Dispense 200 µL per well into a 96-well microtiter plate. Include negative control wells (broth only).
- Incubate statically for 48 hours at 37°C to allow for mature biofilm formation.
Treatment and Viability Staining (LIVE/DEAD):
- Carefully aspirate the planktonic culture and wash the biofilm gently twice with 200 µL PBS.
- Prepare working solutions of SYTO 9 and PI in PBS according to manufacturer's instructions.
- Add 200 µL of the staining solution to designated wells.
- Incubate in the dark for 20 minutes at room temperature.
- Image the biofilms using CLSM to visualize the spatial distribution of live (green) and dead (red) cells [78].
Metabolic Activity Assay (Resazurin):
- In a separate set of wells, after biofilm formation and washing, add 200 µL of a fresh resazurin solution (0.001% w/v in PBS or nutrient-limited medium) to each well.
- Incubate the plate protected from light for 60 minutes at 37°C.
- Measure the fluorescence at an excitation of 560 nm and an emission of 590 nm using a microplate fluorometer.
- Calculate the percentage reduction in metabolic activity compared to an untreated biofilm control.
III. Data Analysis
- For CLSM images: Use image analysis software (e.g., ImageJ, COMSTAT) to calculate biovolume and the ratio of green to red fluorescence.
- For resazurin assay: Plot fluorescence values as a measure of metabolic activity. Use statistical tests (e.g., Student's t-test) to compare treated and untreated groups.
Protocol: Ex Vivo Biofilm Model for Antimicrobial Impact
This protocol describes an ex vivo model using human-derived inocula to study the ecological impact of antimicrobials on complex, native biofilms, providing high-quality data for ABMs of polymicrobial communities [79].
I. Materials
- Saliva Donors: Healthy, consenting human donors.
- Sterile Saliva Collection Cups.
- Ampicillin Stock Solution: Prepared in sterile water or DMSO, concentration calibrated.
- Biofilm Growth Medium: Typically a chemically defined medium supplemented with mucin.
- Shotgun Metagenomic Sequencing Services: For comprehensive analysis of microbiome and resistome.
II. Procedure
- Inoculum Preparation:
- Collect saliva from donors in sterile cups.
- Centrifuge saliva at low speed to remove large debris.
- Use the supernatant as the inoculum within 2 hours of collection.
Biofilm Cultivation and Treatment:
- Inoculate the growth medium with 1-5% (v/v) saliva supernatant.
- Dispense into multi-well plates or onto relevant surfaces (e.g., hydroxyapatite discs).
- Add ampicillin or other antimicrobials across a range of concentrations (e.g., 0.025 µg/mL to 200 µg/mL).
- Incubate anaerobically for 5-7 days to allow for stable biofilm community formation, refreshing the medium and antimicrobial as needed.
Post-Treatment Analysis:
- Viability Counts: Scrape biofilms, homogenize, and perform serial dilutions for plating and CFU enumeration.
- DNA Extraction and Metagenomic Sequencing: Extract total genomic DNA from biofilm samples. Prepare libraries and perform shotgun sequencing on an Illumina platform.
- Bioinformatics Analysis:
- Process raw reads for quality control (e.g., using Trimmomatic).
- Perform taxonomic profiling against a reference database (e.g., GRGenome) using a k-mer based classifier.
- Identify and quantify Antibiotic Resistance Genes (ARGs) using a specialized database (e.g., CARD).
III. Data Analysis
- Plot biofilm viability (log10 CFU) against antimicrobial concentration.
- Calculate alpha diversity (Shannon Index, Chao1) and beta diversity (PERMANOVA) from taxonomic profiles.
- Correlate changes in ARG abundance with shifts in taxonomic composition.
The Scientist's Toolkit: Essential Research Reagents
Table 2: Key Reagents for Biofilm ABM Validation Experiments
| Reagent / Material | Function / Application | Example in Context |
|---|---|---|
| SYTO 9 / Propidium Iodide | Fluorescent viability staining. Differentiates live (green) from dead (red) cells in a biofilm for CLSM analysis [78]. | Quantifying the bactericidal effect of an antimicrobial peptide in a mature K. pneumoniae biofilm. |
| Resazurin | Indicator of metabolic activity. Reduced by metabolically active cells to fluorescent resorufin [78]. | Measuring the sub-lethal, anti-metabolic effect of a novel biofilm-disrupting compound. |
| Ampicillin | Broad-spectrum beta-lactam antibiotic. Used in ex vivo models to study sub-MIC effects on biofilm ecology and resistome [79]. | Investigating how low-dose antibiotic exposure enriches for specific ARGs in a polymicrobial oral biofilm. |
| sRNA PA213 Probes | Molecular tool for detecting expression of a specific regulatory sRNA. | Validating ABM predictions of hypoxia-induced sRNA upregulation in clinical CRPA biofilm isolates [77]. |
| Antimicrobial Peptides (AMPs) | Alternative antimicrobials with potential antibiofilm activity (e.g., DJK-5, LL-37) [78]. | Testing efficacy against biofilm phenotypes and providing dose-response data for model parameterization. |
| iDynoMiCS Software | Open-source, individual-based modeling platform for simulating microbial communities [9]. | Building and simulating the initial ABM of biofilm growth and detachment to be benchmarked. |
Integrating Clinical Data for Robust Model Validation
Clinical data provides the ultimate benchmark for assessing the translational relevance of ABM predictions. Key data sources include:
- Transcriptomic Profiles of Clinical Isolates: For example, the identification of sRNA PA213 as a highly expressed, hypoxia-inducible regulator of biofilm maturation in clinical Carbapenem-Resistant Pseudomonas aeruginosa (CRPA) isolates provides a specific, clinically relevant molecular target for ABMs to predict [77].
- Antimicrobial Susceptibility Testing (AST): Data on resistance patterns (e.g., MIC values) from clinical microbiology labs for strains isolated from chronic biofilm-associated infections (e.g., ventilator-associated pneumonia, catheter-associated UTIs) can inform model parameters and expected outcome ranges.
- Microbiome and Resistome Data: Shotgun metagenomic sequencing of clinical samples (e.g., sputum from cystic fibrosis patients, infected wound debridement) reveals the complex species and genetic makeup of clinical biofilms, which ABMs of polymicrobial communities should strive to replicate [79] [9].
Comparing ABM with Differential Equation-Based and Constraint-Based Models
Computational modeling has become an indispensable tool for investigating complex biological systems such as biofilm-associated persister cells. This protocol article provides a comparative analysis of three prominent modeling approaches—agent-based modeling (ABM), differential equation-based models (DEM), and constraint-based models (CBM)—within the context of biofilm persister dynamics research. We present structured comparisons, application notes, and detailed experimental protocols to guide researchers in selecting and implementing appropriate modeling frameworks for studying persistent infections and developing therapeutic interventions. The content is specifically tailored to address the challenges of microbial heterogeneity, metabolic dormancy, and spatiotemporal dynamics that characterize persister cell populations in biofilm environments.
Biofilm persister cells represent a phenotypic variant of bacteria that exhibit transient tolerance to antimicrobial treatments without genetic resistance mechanisms [1]. These dormant bacterial subpopulations are increasingly recognized as a critical factor in chronic and recurrent infections, particularly those associated with medical implants [80]. The inherent heterogeneity of biofilms, coupled with the complex metabolic transitions that trigger persistence, presents significant challenges for traditional experimental approaches alone [81] [52].
Computational modeling provides powerful complementary tools for investigating persister dynamics. Agent-based modeling represents individual cells as autonomous agents following defined rules, enabling the capture of emergent population behaviors and spatial structures [81] [11]. In contrast, differential equation-based models employ continuous mathematical functions to describe population-level dynamics, while constraint-based models leverage genome-scale metabolic networks to predict biochemical capabilities under environmental constraints [82] [83]. Each approach offers distinct advantages and limitations for specific research questions in persister cell investigations.
This article presents a structured framework for comparing, selecting, and implementing these modeling approaches in biofilm persister research, with particular emphasis on integration with experimental validation methodologies.
Comparative Framework: Core Modeling Approaches
Core Characteristics and Applications
Table 1: Comparative Analysis of Modeling Approaches for Biofilm Persister Research
| Characteristic | Agent-Based Models (ABM) | Differential Equation Models (DEM) | Constraint-Based Models (CBM) |
|---|---|---|---|
| Fundamental Principle | Individual autonomous agents with defined rules | Continuous mathematical functions describing population dynamics | Stoichiometric analysis of metabolic networks within physicochemical constraints |
| Spatial Representation | Explicit 3D representation of individual cells and metabolites [11] [82] | Typically well-mixed systems or diffusion-reaction frameworks in 1D/2D/3D [80] | Generally non-spatial; can be integrated with spatial frameworks |
| Persister Dynamics Implementation | Phenotypic switching rules based on local environmental cues [11] | Coupled ODE/PDE systems with switching terms [80] | Metabolic network reconstruction with constraints mimicking dormant state |
| Metabolic Interactions | Emergent from individual agent behaviors and local exchanges [11] | Defined interaction terms in equations | Genome-scale metabolic networks with stoichiometric constraints [82] |
| Heterogeneity Representation | Intrinsic through individual agent variation | Requires explicit equations for subpopulations | Strain-specific models; limited single-cell heterogeneity |
| Computational Demand | High (individual cell tracking) | Moderate to Low (population-level tracking) | Low to Moderate (linear optimization) |
| Key Advantage for Persister Studies | Captures emergence of heterogeneity from simple rules | Analytical tractability and parameter estimation | Genome-scale prediction of metabolic capabilities in dormant states |
Selection Guidelines for Specific Research Questions
Table 2: Model Selection Criteria Based on Research Objectives
| Research Objective | Recommended Approach | Rationale | Protocol Reference |
|---|---|---|---|
| Spatial organization of persister niches | ABM | Explicit 3D representation captures emergent spatial patterning of persisters [11] | Section 5.1 |
| Metabolic network analysis of dormant cells | CBM | Genome-scale modeling predicts metabolic capabilities under nutrient limitation [82] | Section 5.2 |
| Population dynamics of phenotypic switching | DEM | Efficient modeling of transitions between normal and persister states [80] | Section 5.3 |
| Metabolite exchange in structured communities | Hybrid ABM-CBM (e.g., ACBM) | Individual interactions with metabolic network constraints [82] | Section 5.4 |
| Therapeutic perturbation response | DEM or ABM depending on spatial considerations | Rapid screening (DEM) or mechanistic insight (ABM) of treatment effects [30] [80] | Section 5.5 |
Figure 1: Decision Framework for Model Selection Based on Research Objectives
Table 3: Key Research Reagent Solutions for Biofilm Persister Modeling
| Category | Item | Specifications/Function | Example Applications |
|---|---|---|---|
| Computational Frameworks | iDynoMiCS | Open-source ABM platform for microbial systems [81] | P. aeruginosa biofilm structure analysis [81] |
| COPASI | Biochemical simulation software for ODE systems [83] | Metabolic oscillation analysis in B. subtilis [83] | |
| ACBM Framework | Integrated agent and constraint-based modeling [82] | Simulation of cross-feeding in gut microbiota [82] | |
| Biological Models | Pseudomonas aeruginosa | Common model for medical implant biofilms [81] [80] | Nosocomial infection biofilm studies [81] |
| Escherichia coli HM22 | High-persistence strain with hipA7 allele [30] | Persister mechanism and drug screening [30] | |
| Gut mucosal communities | Multi-species biofilm models [11] | Metabolic interaction studies [11] | |
| Experimental Validation Tools | Microfluidics chambers | Controlled nutrient gradient creation [83] | Biofilm oscillation studies [83] |
| Time-course 16S rRNA sequencing | Microbial community composition tracking [84] | Model prediction validation [84] | |
| Metabolite quantification | HPLC, MS for extracellular metabolites [82] | Cross-feeding validation in models [82] |
Diagram: Integrated Modeling-Experimental Workflow for Persister Studies
Figure 2: Integrated Modeling-Experimental Workflow for Persister Studies
Detailed Experimental Protocols
Protocol: ABM for Spatial Persister Niche Formation
Purpose: To implement an ABM for investigating spatial organization of persister cells in biofilms under nutrient gradients.
Materials:
- iDynoMiCS software platform [81]
- Computational resources for 3D simulation
- Parameter sets for bacterial growth and phenotypic switching
Procedure:
- Model Initialization:
- Define a 3D grid representing the biofilm environment (e.g., 100×100×50 μm)
- Initialize bacterial agents with parameters for growth rate, nutrient consumption, and movement
- Set nutrient concentration gradients (e.g., high at top, low at bottom) [11]
Rule Implementation:
- Program agent behaviors: division (above nutrient threshold), movement (shoving algorithm), and death (nutrient depletion)
- Implement phenotypic switching rules based on local nutrient concentrations [80]:
- Normal → Persister: when local nutrient < threshold N_low
- Persister → Normal: when local nutrient > threshold Nhigh for duration Trevert
Simulation Execution:
- Run simulation for defined timesteps (typically 100-500 h of biological time)
- Track spatial positions, phenotypic states, and local nutrient concentrations
Data Collection:
- Export spatial coordinates of all cells with phenotypic states at regular intervals
- Calculate persister volume fraction at different biofilm depths
- Analyze clustering patterns using spatial statistics (e.g., Ripley's K-function)
Validation Notes: Compare simulated spatial patterns with experimental data from fluorescent reporter strains (e.g., GFP-labeled persisters in biofilms) [11].
Protocol: Constraint-Based Modeling of Persister Cell Metabolism
Purpose: To analyze metabolic capabilities of persister cells using genome-scale constraint-based modeling.
Materials:
- Genome-scale metabolic reconstruction (e.g., for E. coli or P. aeruginosa)
- COBRA Toolbox or similar constraint-based modeling environment
- Transcriptomic or proteomic data from persister cells (if available)
Procedure:
- Model Construction:
- Import appropriate genome-scale metabolic reconstruction
- Define constraints to mimic persister cell state:
- Reduce upper bounds of ATP maintenance requirements by 70-90%
- Limit nutrient uptake rates to 5-10% of normal cells
- Constrain growth-associated maintenance to near zero [82]
Metabolic Analysis:
- Perform flux balance analysis with biomass maximization objective
- Conduct flux variability analysis to identify alternative metabolic routes
- Compare predicted flux distributions between normal and persister states
Gene Essentiality Prediction:
- Perform single-gene deletion analysis in persister metabolic state
- Identify essential metabolic genes unique to persister state
- Compare with normal cell state to identify persister-specific vulnerabilities
Integration with ABM (Optional):
- Incorporate flux predictions as metabolic rules in ABM framework
- Use ACBM framework to simulate metabolic interactions in spatial context [82]
Validation Notes: Validate predictions by comparing with experimental results on metabolite uptake/secretion in persister cells and essentiality screens under antibiotic treatment [30].
Protocol: Differential Equation Model for Phenotypic Switching Dynamics
Purpose: To develop and parameterize a DEM for population dynamics of normal-persister switching.
Materials:
- MATLAB, R, or Python with ODE solver capabilities
- Experimental data on persister fractions over time under treatment
Procedure:
- Model Formulation:
- Define ODE system based on nutrient-dependent switching [80]: where N=normal cells, P=persisters, C=nutrient concentration
Parameter Estimation:
- Set growth rate g(N,C) as Monod function: gmax·C/(Ks + C)
- Define switching rates as function of nutrient concentration:
- kp(C) = kpmax·exp(-γ·C) [increasing at low nutrient]
- kr(C) = krmax·C/(K_r + C) [increasing at high nutrient]
- Estimate parameters from experimental time-course data using nonlinear regression
Simulation and Analysis:
- Solve ODE system numerically for relevant initial conditions
- Analyze sensitivity to parameter variations
- Identify critical nutrient thresholds for persister formation
Treatment Simulation:
- Introduce antibiotic killing term: -k_ab·N for normal cells only
- Simulate treatment cycles and regrowth from persister reservoir
- Calculate treatment efficacy metrics
Validation Notes: Compare model predictions with time-kill curves and persister counts during antibiotic exposure [10] [1].
Protocol: Hybrid ABM-CBM for Metabolic Cross-Feeding in Biofilms
Purpose: To implement the ACBM framework for investigating metabolic interactions in polymicrobial biofilms.
Materials:
- ACBM modeling framework [82]
- Genome-scale metabolic models for target species
- Experimental data on metabolite exchange
Procedure:
- Framework Setup:
- Initialize ABM component with spatial grid and multiple bacterial species
- Integrate CBM components for each species with appropriate metabolic networks
- Define exchange metabolites and uptake kinetics
Cross-Feeding Implementation:
- Program metabolic rules for byproduct secretion (e.g., acetate from B. adolescentis)
- Implement uptake capabilities for cross-fed metabolites (e.g., butyrate production by F. prausnitzii) [82]
- Set localization rules for metabolite diffusion
Simulation Execution:
- Run integrated simulation with metabolic constraints
- Track biomass accumulation, metabolite concentrations, and spatial organization
- Compare mono-culture vs. co-culture simulations
Analysis:
- Calculate cross-feeding efficiency metrics
- Analyze emergent spatial patterns resulting from metabolic interdependencies
- Identify critical metabolic bottlenecks in community function
Validation Notes: Validate against experimental measurements of community composition, metabolic output, and spatial structure in defined co-cultures [11] [82].
Protocol: Therapeutic Intervention Screening Using Combined Modeling Approaches
Purpose: To utilize modeling approaches for screening potential anti-persister therapeutic strategies.
Materials:
- Validated DEM or ABM of target biofilm-persister system
- Compound library screening data (if available)
- Pharmacokinetic parameters for candidate compounds
Procedure:
- Compound Representation:
- For DEM: Add terms for drug penetration, target binding, and killing efficacy
- For ABM: Implement compound diffusion rules and cell-specific responses
- Incorporate parameters for candidate persister-control agents [30]:
- Positive charge under physiological conditions
- Amphiphilic character for membrane penetration
- Strong binding to intracellular targets
Treatment Simulation:
- Simulate single and combination therapy regimens
- Test different dosing schedules and durations
- Evaluate penetration efficacy in nutrient-limited biofilm regions
Efficacy Assessment:
- Calculate persister eradication metrics
- Assess regrowth potential after treatment cessation
- Identify treatment windows based on persister population dynamics [80]
Optimization:
- Use model to optimize treatment parameters (dose, timing, combinations)
- Identify potential resistance development risks
- Predict in vivo efficacy based on simulated tissue concentrations
Validation Notes: Validate predictions using in vitro biofilm models and persister killing assays with candidate compounds identified through screening [30] [1].
The strategic integration of ABM, DEM, and CBM approaches provides powerful complementary tools for advancing biofilm persister research. ABM excels in capturing emergent spatial heterogeneity, DEM offers analytical efficiency for population dynamics, and CBM enables genome-scale metabolic predictions of dormant cells. The hybrid ACBM framework represents a particularly promising direction, combining individual-cell resolution with metabolic network constraints. As these modeling approaches continue to evolve and integrate with experimental validation, they will play an increasingly critical role in unraveling the complex dynamics of biofilm-associated persister cells and developing novel therapeutic strategies against persistent infections.
Assessing Predictive Power for Treatment Outcomes and Resistance Evolution
The recalcitrance of biofilm-associated infections to antimicrobial treatment represents a significant challenge in clinical management. This resistance is a multi-factorial phenomenon driven by the complex interplay of genetic, physical, and physiological adaptations within structured microbial communities [5] [85]. Traditional antimicrobial susceptibility testing, focused on planktonic bacteria, fails to accurately predict treatment outcomes for biofilm-based infections, leading to therapeutic failures and chronic infections [85]. The biofilm lifestyle demonstrates major physiological changes compared to planktonic counterparts, contributing to intrinsic tolerance where biofilms can survive antibiotic concentrations thousands of times higher than those killing planktonic cells [5] [86].
Understanding interactions between phenotypic and genotypic factors influencing biofilm recalcitrance is crucial for maximizing successful treatment probability while minimizing antibiotic resistance evolution risk [86]. This application note explores advanced modeling frameworks and experimental protocols that enhance our predictive capability for treatment outcomes and resistance evolution in biofilm-associated infections, with particular emphasis on persister cell dynamics.
Quantitative Foundations of Biofilm Resistance
Key Mechanisms Contributing to Biofilm Recalcitrance
Table 1: Fundamental mechanisms of antimicrobial resistance in biofilms
| Mechanism Category | Specific Components | Impact on Antimicrobial Efficacy |
|---|---|---|
| Physical Barrier | Extracellular polymeric substances (EPS) | Hinders antibiotic penetration through binding and sequestration [5] |
| Matrix Interactions | Extracellular DNA (eDNA), polysaccharides | Cationic antibiotics (e.g., aminoglycosides) bind to negatively charged eDNA [5] [87] |
| Physiological Heterogeneity | Metabolic dormancy, persister cells | Reduced cellular activity decreases antibiotic target availability [5] [85] |
| Community Protection | Outer membrane vesicles (OMVs), dead cells | Act as decoys that sequester antimicrobial peptides [87] |
| Genetic Adaptation | Increased mutation rates, HGT | Enhanced evolution of resistance mutations in biofilm environments [85] |
Pharmacodynamic Modeling Parameters
Table 2: Key parameters for modeling antibiotic efficacy against biofilms
| Parameter | Symbol | Definition | Biofilm-Specific Considerations |
|---|---|---|---|
| Minimal Inhibitory Concentration | MIC | Lowest antibiotic concentration preventing growth | Does not correlate with biofilm eradication; can be 3 orders of magnitude higher than for planktonic cells [85] [86] |
| Minimal Duration for Killing | MDK99, MDK99.99 | Time required to kill 99% and 99.99% of population | Better predictor for biofilm treatment; accounts for tolerant persister subpopulations [85] |
| Maximal Bacterial Growth Rate | Ψmax | Maximum growth rate without antibiotics | Varies spatially within biofilm due to nutrient gradients [80] [86] |
| Minimal Net Growth Rate | Ψmin | Lowest growth rate at high antibiotic concentrations | Negative value indicating death rate; influenced by persister fraction [86] |
| Hill Coefficient | κ | Steepness of pharmacodynamic curve | Affected by biofilm penetration barriers and heterogeneity [86] |
Experimental Protocols for Assessing Biofilm Treatment Efficacy
Protocol: Experimental Evolution of Biofilm Antimicrobial Resistance
Purpose: To simulate and monitor the evolutionary trajectories of biofilm populations under antimicrobial pressure [85].
Materials:
- Bacterial strains of interest
- Antimicrobial agents at clinical relevant concentrations
- Biofilm growth chambers (flow cells, microtiter plates, or CDC biofilm reactors)
- Synthetic media mimicking infection environments (e.g., Synthetic Cystic Fibrosis Medium for CF models)
Procedure:
- Initial biofilm establishment: Inoculate bacteria in appropriate biofilm growth systems and incubate for 48-72 hours to establish mature biofilms [85].
- Antimicrobial exposure: Apply sub-inhibitory to inhibitory concentrations of antimicrobial agents in cycles (e.g., 24-48 hour treatment followed by recovery period).
- Serial passaging: Regularly sample and transfer biofilm populations to fresh systems while maintaining antimicrobial pressure over multiple generations (typically 20-50 cycles) [85].
- Phenotypic monitoring: At each passage, assess:
- Population density and viability
- Minimum Inhibitory Concentration (MIC) changes
- Minimal Duration for Killing (MDK) profiles
- Persister cell frequencies [85]
- Genotypic analysis: Perform whole-genome sequencing on sampled populations at predetermined intervals to identify resistance mutations and track evolutionary trajectories [85].
Applications: This protocol generates quantitative data on resistance evolution kinetics and identifies genetic adaptations specific to biofilm environments, providing critical parameters for modeling approaches.
Protocol: Quantifying Community-Mediated Resistance to Antimicrobial Peptides
Purpose: To evaluate how bacterial communities withstand antimicrobial peptides (AMPs) through collective, non-genetic mechanisms [87].
Materials:
- Cationic antimicrobial peptides (e.g., LL-37, polymyxin B)
- Fluorescently-labeled AMP derivatives
- Microfluidic growth chambers for single-cell imaging
- Outer membrane vesicle (OMV) isolation kits
- DNA quantification assays
Procedure:
- Biofilm cultivation: Grow biofilms under conditions that promote matrix production in relevant flow systems [87].
- AMP exposure and quantification:
- Treat biofilms with sublethal to lethal AMP concentrations
- Use fluorescent AMP analogs to visualize spatial distribution and binding patterns within biofilms
- Measure AMP sequestration by matrix components via centrifugation and supernatant quantification [87]
- OMV isolation and characterization:
- Collect culture supernatants and isolate OMVs via ultracentrifugation
- Quantify OMV production under AMP stress
- Assess AMP binding capacity of purified OMVs [87]
- Sacrificial cell quantification:
- Use membrane integrity stains to distinguish permeabilized vs. intact cells
- Measure AMP binding to dead cells and cellular debris
- Quantify protective effect on surviving population [87]
- Mathematical modeling integration:
- Parameterize sequestration models using experimental data
- Corregate protection levels with community composition and density [87]
Applications: This protocol provides quantitative parameters for models of community-mediated resistance, particularly for designing anti-biofilm peptides that evade sequestration mechanisms.
Computational Modeling Approaches
Agent-Based Modeling Framework for Persister Dynamics
Conceptual Foundation: Agent-based models (ABMs) simulate individual bacterial cells and their interactions, making them particularly suited for capturing biofilm heterogeneity and persister dynamics [80]. These models incorporate nutrient-dependent phenotypic switching between proliferative and persister states, a critical mechanism underlying biofilm resilience that earlier models often omitted [80].
Key State Variables:
- Local nutrient concentrations (governing phenotypic switching)
- Individual cell states (proliferative, persister, dead)
- Spatial position and movement constraints
- Antimicrobial exposure history
Implementation Workflow:
Diagram Title: Agent-Based Model Workflow for Biofilm Persisters
Polygenic Resistance Evolution Model
Conceptual Foundation: This modeling approach captures how multiple genes of various effects determine antibiotic resistance in biofilm populations, incorporating both genetic and phenotypic resistance mechanisms [86].
Model Components:
- Genotype representation: Bacterial genomes as bit-strings of length k with biallelic loci (0 = sensitive, 1 = resistant)
- Pharmacodynamic function: Net growth rate (Ψ) as a function of antibiotic concentration (A):
Ψ = Ψmax - (Ψmax - Ψmin)(A/MIC)κ / ((A/MIC)κ - Ψmax/Ψmin) [86]
- Biofilm-specific parameters: Modified replication rates and antimicrobial efficacy compared to planktonic populations
Implementation Workflow:
Diagram Title: Polygenic Resistance Model Components
The Scientist's Toolkit: Essential Research Reagents
Table 3: Key research reagents and materials for biofilm persistence studies
| Reagent Category | Specific Examples | Research Application |
|---|---|---|
| Specialized Growth Media | Synthetic Cystic Fibrosis Medium (SCFM) | Mimics in vivo conditions for Pseudomonas aeruginosa biofilm studies [85] |
| Matrix-Degrading Enzymes | Glycoside hydrolases, DNase I | Disrupt EPS components to study matrix contribution to resistance [5] |
| Bacterial Strain Collections | Pseudomonas aeruginosa PAO1, Staphylococcus aureus clinical isolates | Reference strains and clinical isolates for comparative studies [5] [85] |
| Microfluidic Chambers | Flow cells with microscopy compatibility | Real-time monitoring of spatial biofilm development and treatment response [87] |
| Antimicrobial Agents | Tobramycin, ciprofloxacin, colistin, antimicrobial peptides (LL-37) | Representative antibiotics from different classes with varying penetration capabilities [5] [87] |
| Whole-Genome Sequencing Kits | Next-generation sequencing platforms | Tracking mutation accumulation during experimental evolution [85] |
| Fluorescent Labels | SYTO dyes, propidium iodide, fluorescent antibiotic conjugates | Distinguishing live/dead cells and antibiotic localization [87] |
Integrated Workflow for Predictive Assessment
Comprehensive Framework: Integrating the described experimental and computational approaches provides a robust predictive framework for treatment outcomes and resistance evolution.
Implementation Workflow:
Diagram Title: Integrated Predictive Assessment Workflow
This integrated framework enables researchers to:
- Quantify key parameters of biofilm resistance mechanisms through standardized experimental protocols
- Parameterize computational models with empirical data for enhanced predictive accuracy
- Simulate treatment scenarios across diverse antimicrobial regimens and biofilm types
- Identify optimal therapeutic strategies that minimize resistance evolution while maximizing eradication
The combined application of these approaches provides a powerful toolkit for predicting treatment outcomes and resistance evolution in biofilm-associated infections, ultimately supporting the development of more effective anti-biofilm therapies.
Strengths and Limitations of ABM for Studying Biofilm Persister Dynamics
This application note provides a critical analysis of Agent-Based Modeling (ABM) for investigating persister cell dynamics within bacterial biofilms. Persister cells—dormant, phenotypic variants responsible for biofilm tolerance to antibiotics—represent a significant challenge in treating chronic infections. ABM emerges as a powerful computational approach that complements traditional experimental methods by simulating individual cell behaviors and interactions within the complex biofilm microenvironment. This document outlines key methodological protocols, summarizes quantitative data in structured tables, and evaluates the strengths and limitations of ABM in this research context, providing a structured resource for researchers and drug development professionals.
The Clinical Challenge of Biofilm Persisters
Biofilms are structured microbial communities encased in a self-produced extracellular polymeric substance (EPS) matrix, playing a central role in up to 80% of chronic and recurrent bacterial infections [88] [89]. A key factor in biofilm resilience is the presence of persister cells—a small subpopulation of metabolically dormant bacteria that exhibit high tolerance to conventional antibiotic treatments without undergoing genetic resistance [90]. These persister cells can survive antibiotic exposure and, upon treatment cessation, regenerate the biofilm, leading to recurrent infections. This persistence is a major contributor to the challenge of eradicating device-related infections, chronic wounds, and respiratory infections in conditions like cystic fibrosis [90].
Agent-Based Modeling as a Research Tool
Agent-Based Modeling is a computational simulation technique where individual entities ("agents") interact with each other and their environment based on a set of defined rules. In microbiology, each bacterial cell can be represented as an autonomous agent with its own characteristics and behavioral rules [52]. This approach is uniquely suited to study biofilm persister dynamics because it can explicitly model:
- Individual cell heterogeneity (e.g., active vs. dormant states)
- Spatiotemporal organization within the biofilm structure
- Emergent population-level behaviors from simple individual rules
- Local environmental gradients (nutrients, oxygen, signaling molecules) that influence persister formation [52] [10]
Experimental and Computational Protocols
Protocol: In Vitro Biofilm Persister Assay for Model Validation
Objective: To generate experimental data on persister cell dynamics for ABM validation. Background: This protocol quantifies persister formation across biofilm development stages and their survival under antibiotic treatment, providing crucial validation data for computational models [88].
Materials:
- Bacterial isolates (e.g., Staphylococcus aureus, Pseudomonas aeruginosa)
- 96-well polystyrene tissue culture plates
- Tryptic Soy Broth (TSB) supplemented with 1.25% dextrose
- Cation-Adjusted Mueller Hinton Broth (CA-MHB)
- Antibiotics: daptomycin, vancomycin, levofloxacin
- Microplate reader (OD570)
- Phosphate Buffered Saline (PBS)
Procedure:
- Inoculum Preparation: Prepare a CLSI-standard inoculum of 5-6 log10 CFU/mL in supplemented TSB [88].
- Biofilm Growth: Dispense 200 µL inoculum per well in 96-well plates. Incubate at 37°C for designated durations (e.g., 2, 4, 6, 8, 16, 24 h) to capture different developmental stages [88].
- Biofilm Quantification: At each time point:
- Carefully remove planktonic cells by washing wells with PBS
- Fix biofilms with 100% methanol for 15 minutes
- Stain with 0.1% crystal violet for 5 minutes
- Wash to remove unbound dye
- Elute bound dye with 33% acetic acid
- Measure OD570 to quantify total biofilm biomass
- Persister Enumeration:
- Treat 24-h mature biofilms with progressively higher concentrations of selected antibiotics (e.g., 1-1024 µg/mL) for 24h [88]
- Disaggregate biofilm cells via sonication/vortexing
- Perform viable cell counts on antibiotic-free media to enumerate surviving persisters
- Data Analysis:
- Classify biofilm stages based on statistically significant growth patterns (e.g., Stage I: 0-6h, Stage II: 6-16h, Stage III: 16-24h, Stage IV: >24h) [88]
- Calculate minimum biofilm eradication concentrations (MBEC) for each antibiotic
Protocol: ABM Implementation for Persister Dynamics
Objective: To create an ABM simulating persister cell formation and dynamics within a developing biofilm. Background: This protocol outlines the key components for building an ABM to study how persister cells emerge, distribute, and survive antibiotic treatment within biofilm microenvironments [52] [10].
Model Components:
- Agent Definitions:
- Active bacterial cells: Grow, divide, consume nutrients, produce EPS
- Persister cells: Dormant, non-growing, antibiotic-tolerant
- Switching rules: Probabilistic transitions between active and persister states
Environmental Grid:
- Spatial lattice representing physical surface
- Nutrient concentration field (e.g., glucose, oxygen)
- Antibiotic diffusion field
Rule Set Implementation:
- Nutrient uptake: Agents consume local nutrients based on Michaelis-Menten kinetics
- Growth and division: Active cells grow when nutrient threshold exceeded
- Persistence switching:
- Stochastic switching at low probability (baseline)
- Stress-induced switching under nutrient limitation or antibiotic exposure
- Antibiotic killing: Concentration-dependent killing of active cells; persisters survive
Computational Implementation:
- Platform Selection: Choose ABM platform (e.g., IDynoMiCS, NetLogo, custom Python/Java)
- Parameter Initialization: Set initial values based on experimental data (see Table 1)
- Simulation Execution: Run Monte Carlo simulations with varying parameter sets
- Output Analysis: Quantify persister numbers, spatial distribution, and survival rates
Model Calibration and Validation:
- Calibrate switching rates using experimental persister counts
- Validate spatial patterns against microscopy data
- Compare predicted antibiotic survival with experimental MBEC values
Data Presentation and Analysis
Table 1: Quantitative Parameters for ABM of Biofilm Persisters
| Parameter | Typical Value Range | Source/Measurement Method | Significance in ABM |
|---|---|---|---|
| Persister Fraction in Mature Biofilms | 0.1% - 1% of total population | Viable counts after high-dose antibiotic treatment [90] | Determines baseline switching probability in models |
| Biofilm Development Staging | Stage I: 0-6h; Stage II: 6-16h; Stage III: 16-24h; Stage IV: >24h | Statistical analysis of hourly growth curves (P < 0.001) [88] | Defines temporal context for persistence switching rules |
| Antibiotic Tolerance Increase (vs. planktonic) | 10 - 1000× MIC | Minimum Biofilm Eradication Concentration (MBEC) assays [88] [89] | Sets killing thresholds in treatment simulations |
| Spatial Gradients in Mature Biofilms | Oxygen: 90% → <10% from surface to base; Nutrients: Similar steep declines | Microelectrode measurements; fluorescence imaging [90] | Creates heterogeneous microenvironment driving persistence |
| Daptomycin Efficacy vs. S. aureus Biofilms | 64-512× MIC (32-256 μg/mL) for ≥75% reduction | Progressive antibiotic treatment of stage-IV biofilms [88] | Provides benchmark for simulated treatment outcomes |
Table 2: Research Reagent Solutions for Biofilm Persister Studies
| Reagent/Category | Specific Examples | Function/Application | Experimental Considerations |
|---|---|---|---|
| Antibiotics for Persister Selection | Daptomycin, Vancomycin, Levofloxacin | Selective killing of active cells to isolate and enumerate persisters [88] | Daptomycin shows superior efficacy against S. aureus biofilms; requires calcium supplementation for activity |
| Biofilm Growth Media | Tryptic Soy Broth + 1.25% dextrose; Brain Heart Infusion | Promotes robust biofilm formation in microtiter assays | Dextrose supplementation enhances EPS production; cation adjustment needed for certain antibiotics |
| Matrix-Degrading Enzymes | Dispersin B (glycosidase), DNase I | Targeted degradation of EPS components to probe matrix protection mechanisms [89] | DNase I targets eDNA matrix component; useful for testing penetration hypotheses in ABM |
| Staining & Viability Probes | Crystal Violet, Propidium Iodide, SYTO 9 | Quantification of total biomass and live/dead cell differentiation in biofilms | Combination stains (e.g., LIVE/DEAD) enable spatial visualization of persister niches |
| Quorum Sensing Inhibitors | Cinnamaldehyde, Eugenol, AHL analogs | Disrupt bacterial communication to probe QS role in persistence [89] | Natural and synthetic QS inhibitors test cell-cell communication rules in ABM |
Visualizing Persister Dynamics and ABM Framework
Persister Formation Pathways
ABM Simulation Workflow
Strengths of ABM for Persister Dynamics Research
Captures Emergent Heterogeneity: ABM excels at modeling how uniform initial rules applied to individual cells can generate the heterogeneous population structures observed in biofilms, including the spontaneous emergence of persister subpopulations from stochastic switching rules [52]. This allows researchers to test different hypotheses about persister formation mechanisms and their spatial distribution.
Integrates Multiscale Dynamics: ABM uniquely bridges intracellular processes (metabolic states, stress responses), population-level behaviors (quorum sensing, competition), and community-scale structures (gradient formation, spatial organization) [52] [10]. This is particularly valuable for studying how local nutrient and oxygen gradients create microenvironments that induce persister states in specific biofilm regions.
Enables Non-Destructive Hypothesis Testing: Computational models allow researchers to test intervention strategies that would be prohibitively expensive or technically challenging in the laboratory. For instance, ABMs can simulate the effects of hypothetical drugs that target persister cell awakening mechanisms or specifically disrupt protective biofilm microenvironments before committing to synthetic chemistry efforts [52] [89].
Reveals Counterintuitive System Behaviors: ABMs have uncovered non-linear dynamics in biofilm-persister systems, such as how lower antibiotic concentrations can sometimes increase biofilm biomass—a phenomenon observed experimentally that can be explored mechanistically through simulation [88]. These emergent behaviors highlight the value of ABM in complementing traditional experimental approaches.
Limitations and Challenges of ABM Implementation
Parameterization Uncertainty: A significant challenge in ABM is obtaining accurate, experimentally-derived parameters for model initialization and validation (see Table 1). Many biological processes, such as the stochastic switching rates between active and persister states, are difficult to measure empirically, leading to potential uncertainties in model predictions [52] [10].
Computational Intensity: As biofilm models increase in spatial resolution and incorporate more complex mechanistic rules (e.g., multi-scale metabolic networks, detailed signaling pathways), the computational resources required grow substantially. This can limit model exploration and the number of Monte Carlo runs needed for robust statistical analysis [52].
Validation Complexity: While ABMs can generate visually compelling simulations that resemble real biofilms, rigorous validation requires quantitative comparison with experimental data across multiple scales—from single-cell behaviors to population dynamics. Current limitations in live, real-time monitoring of persister dynamics within intact biofilms create gaps in validation datasets [52] [88].
Model Transferability: ABMs parameterized for specific bacterial species or environmental conditions may not generalize well to other systems. For instance, persistence mechanisms in Pseudomonas aeruginosa biofilms may differ significantly from those in Staphylococcus aureus, requiring model recalibration and limiting broader insights [88] [90].
Future Perspectives and Implementation Recommendations
The integration of ABM with emerging experimental technologies presents promising avenues for advancing biofilm persister research. Machine learning approaches can help optimize ABM parameters and identify key rule sets from complex data [89]. Additionally, the increasing availability of high-resolution spatial -omics data (transcriptomics, proteomics) enables more biologically realistic model parameterization [52] [28].
For researchers implementing ABM for biofilm persister studies, we recommend:
- Begin with simplified models focused on specific persister formation mechanisms before incorporating full complexity
- Establish iterative cycles of simulation and experimental validation to progressively refine model parameters
- Utilize high-performance computing resources to enable adequate parameter exploration and sensitivity analysis
- Develop standardized reporting frameworks for ABM details to enhance reproducibility and model comparison
As ABM methodologies continue to mature alongside experimental techniques, they offer increasingly powerful approaches to unravel the persistent challenge of biofilm-mediated treatment failures in clinical settings.
Application Note: Multi-Omics Data Generation for Biofilm Persister Cells
Background and Significance
The study of biofilm persister dynamics has been revolutionized by multi-omics technologies, which enable comprehensive analysis of microbial communities at multiple molecular levels. Persisters represent non-growing or slow-growing bacterial cells that survive antibiotic exposure and can regrow after stress removal, contributing significantly to chronic and recurrent infections [1]. These dormant cells exhibit remarkable tolerance to conventional antibiotics through complex mechanisms including reduced metabolic activity, decreased membrane potential, and changes in membrane fluidity [30]. The integration of multi-omics approaches provides unprecedented insights into the molecular basis of persistence, offering new avenues for therapeutic interventions against persistent biofilm infections.
Multi-omics technologies allow researchers to investigate persister cells through genomics, transcriptomics, proteomics, and metabolomics, providing a holistic view of the physiological and functional attributes of multispecies biofilms [91]. This integrated approach is particularly valuable for understanding the intricate communication, spatial distribution, and antibiotic resistance mechanisms that characterize persistent biofilm communities. Recent advances in computational biology and data integration methods have further enhanced our ability to extract meaningful biological insights from these complex datasets, enabling the identification of key molecular interactions and potential therapeutic targets [92].
Key Multi-Omics Technologies for Persister Research
Table 1: Multi-Omics Approaches for Biofilm Persister Analysis
| Omics Technology | Key Applications in Persister Research | Technical Considerations |
|---|---|---|
| Transcriptomics | Detection of biofilm components and antibiotic resistance genes; identification of dormancy-associated transcriptional programs | Requires rapid sampling to preserve RNA integrity; single-cell RNA-seq reveals heterogeneity |
| Proteomics | Detailed examination of biofilm matrix composition; identification of persistence-associated protein expression | LC-MS/MS enables quantification of protein abundance; post-translational modifications relevant to persistence |
| Metabolomics | Analysis of physiological and functional attributes; identification of metabolic signatures of persistence | GC-MS and LC-MS platforms capture extracellular and intracellular metabolites; spatial metabolomics emerging |
| Metatranscriptomics | Investigation of active microbial populations and functional roles in mixed-species biofilms | rRNA depletion crucial for host-derived samples; identifies community-wide responses to stress |
Integrated Workflow for Multi-Omics Analysis
The following diagram illustrates the comprehensive workflow for generating and integrating multi-omics data from biofilm persister cells:
Protocol: Multi-Omics Integration for Host-Pathogen Interaction Mapping
Experimental Protocol: Host-Microbiome Multi-Omics in Colitis Model
This protocol adapts methodologies from Siburian et al. (2025) for investigating host-microbiome interactions in inflammatory conditions relevant to biofilm persistence [93].
Materials and Reagents
Table 2: Essential Research Reagents and Solutions
| Reagent/Category | Specific Examples | Function/Application |
|---|---|---|
| DNA Extraction Kit | DNeasy PowerSoil Pro Kit | High-quality microbial DNA extraction from complex biofilm samples |
| RNA Stabilization | RNAlater Stabilization Solution | Preserves RNA integrity during sample processing and storage |
| RNA Extraction | TRIzol + QIAzol Lysis Reagent | Comprehensive RNA isolation from host and microbial sources |
| Library Prep (16S) | Illumina 16S Metagenomic Sequencing Library | Targets V3-V4 region for bacterial community analysis |
| Library Prep (RNA) | TruSeq Stranded Total RNA Library Prep Gold Kit | Whole transcriptome analysis of host and microbial RNA |
| rRNA Depletion | Ribo-Zero Plus rRNA Depletion Kit | Removes ribosomal RNA to enrich mRNA for metatranscriptomics |
| Bioinformatics Tools | HUMAnN3, Kraken2, Bracken | Taxonomic profiling and functional analysis of microbial communities |
Step-by-Step Procedure
Phase 1: Sample Preparation and Induction
- Biofilm Growth and Persister Induction: Grow biofilms of target pathogens (e.g., Pseudomonas aeruginosa, Escherichia coli) using appropriate media and conditions. Induce persister formation through antibiotic exposure (e.g., 100 µg/mL of bactericidal antibiotics for 4-6 hours) [30].
- Host Pathogen Interaction Setup: For in vivo models, follow established protocols such as DSS-induced colitis in mouse models. Administer 2% DSS in drinking water for 3-6 days to induce inflammatory conditions while control groups receive regular water [93].
- Sample Collection: Harvest biofilm samples and host tissues (e.g., colon tissue). Preserve samples in RNAlater for transcriptomics and metatranscriptomics, and flash-freeze for metabolomics and proteomics.
Phase 2: Multi-Omics Data Generation
- Nucleic Acid Extraction:
- Extract DNA using DNeasy PowerSoil Pro Kit following manufacturer's protocol for 16S rRNA amplicon sequencing.
- Extract total RNA using TRIzol followed by QIAzol Lysis Reagent with DNase I treatment to remove genomic DNA contamination.
- Library Preparation and Sequencing:
- For 16S rRNA sequencing: Amplify V3-V4 region using primers 341F and 805R. Prepare libraries following Illumina 16S Metagenomic Sequencing Library protocol. Sequence on MiSeq platform (300bp paired-end) [93].
- For metatranscriptomics: Prepare RNA libraries using TruSeq Stranded Total RNA Library Prep Kit with Ribo-Zero Plus rRNA depletion. Sequence on NovaSeq platform (150bp paired-end).
- For host transcriptomics: Use TruSeq Stranded Total RNA Library Prep Gold Kit without rRNA depletion. Sequence on NovaSeq X platform (100bp paired-end).
Phase 3: Data Processing and Integration
- Bioinformatic Processing:
- Process 16S data using DADA2 for amplicon sequence variant (ASV) analysis with truncLen parameters (f:250, r:200) and maxEE:2 [93].
- Process metatranscriptomic data using KneadData with Trimmomatic and Bowtie2 to remove adapter and host-derived sequences.
- Perform taxonomic classification using Kraken2 with standard database and abundance estimation with Bracken.
- Functional Analysis:
- Use HUMAnN3 with ChocoPhlAn and UniRef90 databases for gene abundance estimation and pathway analysis.
- Perform sparse canonical correlation analysis (sCCA) to identify associations between microbial genes and host immune pathways.
Protocol: Computational Integration of Multi-Omics Data
Data Integration Workflow
The following diagram outlines the computational framework for integrating multi-omics data to inform agent-based models of biofilm persistence:
Integration Methodology
Data Preprocessing and Quality Control:
- For genomic data: Filter ASVs with less than 350bp length to improve taxonomic accuracy. Remove samples with low sequencing depth.
- For transcriptomic data: Perform adapter trimming, quality filtering, and remove host sequences using alignment to host genome.
- For proteomic and metabolomic data: Perform peak detection, alignment, and normalization using platform-specific tools.
Multi-Omics Integration using Network Approaches:
- Construct association networks between microbial taxa, their gene expressions, and host immune markers using sparse Canonical Correlation Analysis (sCCA) [93].
- Identify key hub microbes and microbial genes (e.g., aminoacyl-tRNA synthetases) associated with host immunological pathways.
- Implement statistical fine-mapping approaches (e.g., SuSiE, FINEMAP) to identify putative causal variants in host-pathogen interactions [94].
Extraction of Parameters for Agent-Based Modeling:
- Quantify spatial organization patterns from imaging data to inform cell-cell interaction rules.
- Derive metabolic rates and nutrient consumption parameters from transcriptomic and metabolomic data.
- Estimate persister formation rates under different stress conditions from time-series transcriptomics.
- Parameterize inter-species interaction rules from correlation networks and known microbial ecology principles.
Application Note: From Multi-Omics Data to Agent-Based Models
Bridging Multi-Omics and Computational Modeling
The integration of multi-omics data with agent-based models (ABMs) represents a powerful approach for understanding and predicting biofilm persister dynamics. ABMs simulate the behavior of individual cells (agents) within a biofilm community, each following rules derived from experimental data [52]. Multi-omics data provides the empirical foundation for these rules, enabling models that accurately capture the heterogeneity and emergent behaviors of biofilm systems.
Recent advances have demonstrated the value of ABMs for studying polymicrobial biofilms and host-microbiome interactions [52]. These models can incorporate data from genomic, transcriptomic, proteomic, and metabolomic analyses to simulate how individual microbial cells interact with each other and their environment. This is particularly valuable for studying persister cells, which often represent a small subpopulation with distinct metabolic characteristics that contribute to antibiotic tolerance [1].
Key Parameters Derived from Multi-Omics for ABM
Table 3: Multi-Omics Derived Parameters for Agent-Based Models of Biofilm Persisters
| Parameter Category | Specific Parameters | Omics Source | ABM Implementation |
|---|---|---|---|
| Metabolic State | Nutrient uptake rates, metabolic pathway activities | Metabolomics, Transcriptomics | Determines growth rate and resource competition |
| Spatial Organization | Cell-cell distances, community architecture | Imaging, Spatial Transcriptomics | Defines interaction neighborhoods and diffusion barriers |
| Phenotypic Heterogeneity | Persister formation rates, stress response activation | Single-cell Transcriptomics | Stochastic switching rules between normal and persister states |
| Inter-species Interactions | Metabolic cross-feeding, quorum sensing molecules | Metabolomics, Proteomics | Rules for synergistic or antagonistic interactions |
| Host-Pathogen Interface | Immune marker correlations, barrier function | Host Transcriptomics, Cytokine Data | Modifies local environment and selective pressures |
Implementation Framework
The transformation of multi-omics data into ABM rules follows a systematic process:
Data Reduction and Feature Selection: Identify key molecular features that significantly correlate with persister phenotypes using statistical methods and machine learning approaches.
Rule Formulation: Translate molecular signatures into behavioral rules for individual agents. For example:
- High (p)ppGpp levels → implement stringent response program → transition to dormant state
- Reduced ATP levels and metabolic activity → decrease division probability → maintain persistence
- Specific metabolite gradients → direct chemotactic movement or matrix production
Model Calibration and Validation: Iteratively refine model parameters to ensure outputs match experimental observations of biofilm structure, persister proportions, and response to perturbations.
This integrated approach enables in silico testing of potential anti-persister strategies, including combination therapies that target multiple mechanisms simultaneously, thereby accelerating the development of more effective treatments for persistent biofilm infections [30] [89].
Conclusion
Agent-based modeling has emerged as a powerful tool for deciphering the complex spatiotemporal dynamics of persister cells within biofilms. By simulating individual cell behaviors and their interactions, ABMs provide unparalleled insights into the mechanisms underlying antibiotic treatment failure and biofilm resilience. The key takeaways are that persister switching strategies—constant, substrate-dependent, and antibiotic-dependent—profoundly influence biofilm architecture and survival, and that optimized periodic antibiotic dosing, informed by ABMs, can significantly reduce the required drug dose while improving efficacy. Future research must focus on integrating high-resolution experimental data to refine model parameters, expanding models to encompass polymicrobial and host environments, and leveraging ABM predictions to accelerate the development of novel anti-persister therapeutics and rational treatment protocols for persistent clinical infections.
References
- 1. Bacterial persisters: molecular mechanisms and ... [https://www.nature.com/articles/s41392-024-01866-5]
- 2. Bacterial Persister Cells and Development of Antibiotic ... [https://pmc.ncbi.nlm.nih.gov/articles/PMC11335562/]
- 3. A Quantitative Survey of Bacterial Persistence in the Presence ... [https://pmc.ncbi.nlm.nih.gov/articles/PMC7460088/]
- 4. Molecular mechanism and application of emerging ... [https://bmcmicrobiol.biomedcentral.com/articles/10.1186/s12866-024-03628-3]
- 5. Mechanisms of antimicrobial resistance in biofilms [https://www.nature.com/articles/s44259-024-00046-3]
- 6. Antibiotic Resistance: A Genetic and Physiological Perspective [https://pmc.ncbi.nlm.nih.gov/articles/PMC12579171/]
- 7. Tolerance and Persistence of Pseudomonas aeruginosa in ... [https://www.frontiersin.org/journals/microbiology/articles/10.3389/fmicb.2020.02057/full]
- 8. Biofilms: structure, resistance mechanism, emerging ... [https://pubs.rsc.org/en/content/articlehtml/2025/pm/d5pm00094g]
- 9. Agent Based Models of Polymicrobial Biofilms and the ... [https://pmc.ncbi.nlm.nih.gov/articles/PMC7922883/]
- 10. Modelling protection from antimicrobial agents in biofilms ... [https://pubmed.ncbi.nlm.nih.gov/15632427/]
- 11. Metabolic interactions shape emergent biofilm structures in ... [https://www.nature.com/articles/s41522-024-00572-y]
- 12. Mathematical modelling of nutrient-dependent biofilm ... [https://arxiv.org/abs/2509.18065]
- 13. Temporal modelling of the biofilm lifecycle (TMBL) establishes ... [https://pmc.ncbi.nlm.nih.gov/articles/PMC10528067/]
- 14. MicroLabVR: Interactive 3D Visualization of Simulated ... [https://arxiv.org/html/2508.21736v1]
- 15. Student-led experimental evolution reveals novel biofilm ... [https://pmc.ncbi.nlm.nih.gov/articles/PMC12157681/]
- 16. Directed evolution of phages in biofilms enhances ... [https://www.nature.com/articles/s41467-025-65014-5]
- 17. Bacterial Persister Cell Formation and Dormancy - PMC [https://pmc.ncbi.nlm.nih.gov/articles/PMC3837759/]
- 18. Recent Advances in Bacterial Persistence Mechanisms - PMC [https://pmc.ncbi.nlm.nih.gov/articles/PMC10531727/]
- 19. Are Bacterial Persisters Dormant Cells Only? [https://www.frontiersin.org/journals/microbiology/articles/10.3389/fmicb.2021.708580/full]
- 20. Delicate Metabolic Control and Coordinated Stress ... [https://pmc.ncbi.nlm.nih.gov/articles/PMC4576078/]
- 21. Biofilms: Understanding the structure and contribution ... [https://www.sciencedirect.com/science/article/pii/S2590097823000095]
- 22. Toxin-Antitoxin Systems Influence Biofilm and Persister Cell ... [https://pmc.ncbi.nlm.nih.gov/articles/PMC3165247/]
- 23. Bacterial toxin-antitoxin modules: classification, functions, ... [https://www.sciencedirect.com/science/article/pii/S2666517421000286]
- 24. Archaeal Persisters: Persister Cell Formation as a Stress ... [https://www.frontiersin.org/journals/microbiology/articles/10.3389/fmicb.2017.01589/full]
- 25. Medical Device-Associated Biofilm Infections and ... - MDPI [https://www.mdpi.com/2076-0817/13/5/393]
- 26. Biofilm Matrix Formation in Human: Clinical Significance, ... [https://brieflands.com/journals/archcid/articles/107919]
- 27. Targeting Bacterial Biofilms on Medical Implants [https://pmc.ncbi.nlm.nih.gov/articles/PMC12382947/]
- 28. Investigating Biofilms: Advanced Methods for ... [https://www.imrpress.com/journal/FBL/29/4/10.31083/j.fbl2904133/htm]
- 29. Staphylococcus aureus persisters are associated with ... [https://pmc.ncbi.nlm.nih.gov/articles/PMC10203555/]
- 30. A rational approach to discovering new persister control ... [https://pmc.ncbi.nlm.nih.gov/articles/PMC12406675/]
- 31. Agent-Based Models Predict Emergent Behavior of ... [https://pmc.ncbi.nlm.nih.gov/articles/PMC7301008/]
- 32. What is the core principle of agent-based modeling? [https://www.tencentcloud.com/techpedia/119833]
- 33. How do Agent-Based Models work? [https://www.simudyne.com/resources/how-do-agent-based-models-work/]
- 34. Agent-based modelling (ABM) - 4strat [https://www.4strat.com/strategy/agent-based-modelling-abm/]
- 35. Design Guidelines for Agent Based Model Visualization [https://www.jasss.org/12/2/1.html]
- 36. Optimization of periodic treatment strategies for bacterial biofilms ... [https://pmc.ncbi.nlm.nih.gov/articles/PMC11003776/]
- 37. Pseudomonas aeruginosa persister cell formation upon ... [https://www.nature.com/articles/s41598-022-20323-3]
- 38. Real-time monitoring of Pseudomonas aeruginosa biofilm ... [https://pmc.ncbi.nlm.nih.gov/articles/PMC8583918/]
- 39. Dynamics of bacterial biofilm development imaged using ... [https://www.sciencedirect.com/science/article/pii/S2405580825002146]
- 40. Agent-based Modeling of Microbial Communities - PMC [https://pmc.ncbi.nlm.nih.gov/articles/PMC10129392/]
- 41. Diffusion in Biofilms - PMC [https://pmc.ncbi.nlm.nih.gov/articles/PMC148055/]
- 42. Modeling Antibiotic Tolerance in Biofilms by Accounting for ... [https://pmc.ncbi.nlm.nih.gov/articles/PMC310152/]
- 43. Diffusion-based mechanism explains spatial organization ... [https://www.nature.com/articles/s41522-025-00719-5]
- 44. Agent-Based Modeling Demonstrates How Local ... [https://pmc.ncbi.nlm.nih.gov/articles/PMC6541737/]
- 45. Emergence of three-dimensional order and structure in ... [https://pmc.ncbi.nlm.nih.gov/articles/PMC6544526/]
- 46. Review Mathematical modeling for the prediction of biofilm ... [https://www.sciencedirect.com/science/article/abs/pii/S0963996924013188]
- 47. Dissecting the physics of bacterial biofilms with agent-based ... [https://pubmed.ncbi.nlm.nih.gov/40538632/]
- 48. Mathematical modeling of dormant cell formation in ... [https://pmc.ncbi.nlm.nih.gov/articles/PMC4446547/]
- 49. Mechanical modeling of biofilm morphology variation ... [https://www.sciencedirect.com/science/article/abs/pii/S0964830524002609]
- 50. Analysis of biofilm assembly by large area automated AFM [https://www.nature.com/articles/s41522-025-00704-y]
- 51. Comparative analysis of quantitative methodologies for ... [https://pmc.ncbi.nlm.nih.gov/articles/PMC5035616/]
- 52. Agent Based Models of Polymicrobial Biofilms and the ... [https://www.mdpi.com/2076-2607/9/2/417]
- 53. Dissecting the physics of bacterial biofilms with agent- ... [https://www.sciencedirect.com/science/article/abs/pii/S1359028625000154]
- 54. Novel Multiscale Modeling Tool Applied to Pseudomonas ... [https://journals.plos.org/plosone/article?id=10.1371/journal.pone.0078011]
- 55. Optimization of periodic treatment strategies for bacterial ... [https://research-information.bris.ac.uk/en/publications/optimization-of-periodic-treatment-strategies-for-bacterial-biofi/]
- 56. Pseudomonas aeruginosa Biofilms - PMC [https://pmc.ncbi.nlm.nih.gov/articles/PMC7698413/]
- 57. A biofilm-tropic Pseudomonas aeruginosa bacteriophage ... [https://elifesciences.org/articles/102352]
- 58. From adhesion to biofilms formation and resilience [https://www.sciencedirect.com/science/article/pii/S2590207525000152]
- 59. Biofilm tolerance, resistance and infections increasing ... [http://microbialcell.com/researcharticles/2023a-yang-microbial-cell/]
- 60. Breaking the Vicious Cycle of Antibiotic Killing and Regrowth ... [https://pmc.ncbi.nlm.nih.gov/articles/PMC6256772/]
- 61. Intermittent antibiotic treatment of bacterial biofilms favors ... [https://www.nature.com/articles/s42003-023-04601-y]
- 62. Mini review: Persister cell control strategies [https://www.frontiersin.org/journals/pharmacology/articles/10.3389/fphar.2025.1706115/full]
- 63. Optimization of periodic treatment strategies for bacterial ... [https://pubmed.ncbi.nlm.nih.gov/38593842/]
- 64. Quantitative analysis of persister fractions suggests different ... [https://bmcmicrobiol.biomedcentral.com/articles/10.1186/1471-2180-13-25]
- 65. How do environment-dependent switching rates between ... [https://www.nature.com/articles/s41522-018-0049-2]
- 66. Bacterial persisters: molecular mechanisms and therapeutic ... [https://pmc.ncbi.nlm.nih.gov/articles/PMC11252167/]
- 67. Spatially structured exchange of metabolites enhances ... [https://www.nature.com/articles/s41467-024-51940-3]
- 68. Mathematical Modeling of Biofilm Structures Using ... [https://pmc.ncbi.nlm.nih.gov/articles/PMC5751404/]
- 69. Observation of persister cell histories reveals diverse ... [https://elifesciences.org/articles/79517]
- 70. Development of Persister-FACSeq: a method to massively ... [https://www.nature.com/articles/srep25100]
- 71. antibiotic tolerance and persistence in bacterial biofilms [https://pmc.ncbi.nlm.nih.gov/articles/PMC6629468/]
- 72. Strategies for combating persister cell and biofilm infections [https://pmc.ncbi.nlm.nih.gov/articles/PMC5609227/]
- 73. Dynamics of bacterial population growth in biofilms ... [https://www.nature.com/articles/s41467-020-15165-4]
- 74. Pharmacodynamic Model of the Dynamic Response ... [https://www.mdpi.com/2227-9059/11/8/2316]
- 75. dPABBs: A Novel in silico Approach for Predicting and ... [https://www.nature.com/articles/srep21839]
- 76. AI-driven modelling, antimicrobial discovery, and precision ... [https://www.sciencedirect.com/science/article/pii/S3050787125000617]
- 77. Biofilm Maturation in Carbapenem-resistant Pseudomonas ... [https://www.sciencedirect.com/science/article/pii/S0924857925001803]
- 78. Comparative evaluation of antimicrobial peptides: effect on ... [https://www.frontiersin.org/journals/microbiology/articles/10.3389/fmicb.2025.1548362/full]
- 79. Exploring ex vivo biofilm dynamics: consequences of low ... [https://pmc.ncbi.nlm.nih.gov/articles/PMC10987642/]
- 80. Mathematical modelling of nutrient-dependent biofilm ... [https://arxiv.org/html/2509.18065v1]
- 81. Agent Based Models of Polymicrobial Biofilms and the Microbiome—A Review - PMC [https://www.ncbi.nlm.nih.gov/pmc/articles/PMC7922883/]
- 82. ACBM: An Integrated Agent and Constraint Based Modeling Framework for Simulation of Microbial Communities | Scientific Reports [https://www.nature.com/articles/s41598-020-65659-w]
- 83. Differential equation-based minimal model describing metabolic oscillations in Bacillus subtilis biofilms - PMC [https://pmc.ncbi.nlm.nih.gov/articles/PMC7062081/]
- 84. Toward the Next Generation of In Silico Modeling ... [https://pmc.ncbi.nlm.nih.gov/articles/PMC12221595/]
- 85. Biofilm antimicrobial susceptibility through an experimental ... [https://pmc.ncbi.nlm.nih.gov/articles/PMC9579162/]
- 86. Modeling Polygenic Antibiotic Resistance Evolution in ... [https://www.frontiersin.org/journals/microbiology/articles/10.3389/fmicb.2022.916035/full]
- 87. Population-Level Dynamics and Community-Mediated ... [https://pmc.ncbi.nlm.nih.gov/articles/PMC12467774/]
- 88. Staphylococcus biofilm dynamics and antibiotic resistance [https://pmc.ncbi.nlm.nih.gov/articles/PMC12054104/]
- 89. Biofilms and multidrug resistance: an emerging crisis ... [https://www.frontiersin.org/journals/bioengineering-and-biotechnology/articles/10.3389/fbioe.2025.1625356/full]
- 90. Bacterial Persister Cells and Development of Antibiotic ... [https://www.frontierspartnerships.org/journals/british-journal-of-biomedical-science/articles/10.3389/bjbs.2024.12958/full]
- 91. Multi-omics technology in detection of multispecies biofilm [https://www.sciencedirect.com/science/article/pii/S2950194624000955]
- 92. Integrating Multi-Omics Data: Methods and Applications in ... [https://www.sciencedirect.com/science/article/pii/S2215017X25000657]
- 93. Multiomics Integration Reveals Microbial Gene Interactions ... [https://pmc.ncbi.nlm.nih.gov/articles/PMC12549230/]
- 94. JOB: Japan Omics Browser provides integrative visualization ... [https://bmcgenomics.biomedcentral.com/articles/10.1186/s12864-025-11639-1]