Beyond Culture: Advanced Culture-Independent Methods for Rapid Pathogen Detection in Clinical and Food Safety Applications
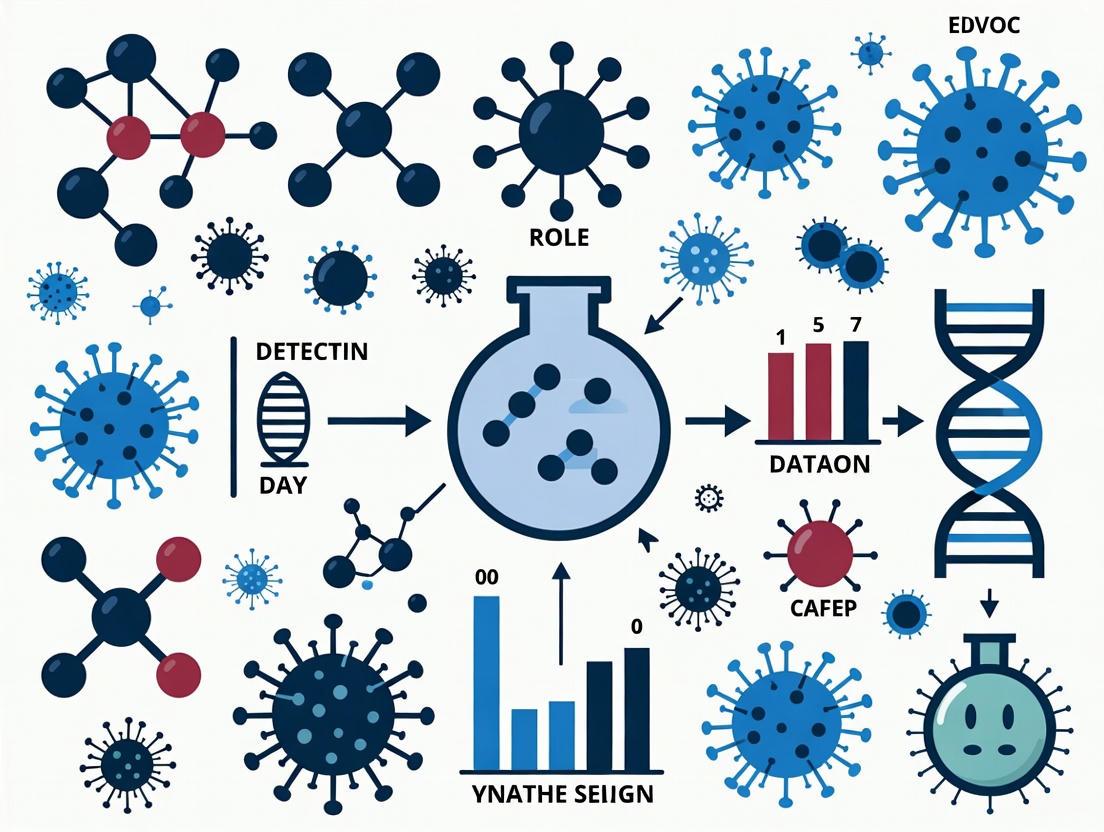
This article provides a comprehensive overview of culture-independent methods for pathogen detection, critically evaluating their capacity to overcome the limitations of traditional culture-based techniques.
Beyond Culture: Advanced Culture-Independent Methods for Rapid Pathogen Detection in Clinical and Food Safety Applications
Abstract
This article provides a comprehensive overview of culture-independent methods for pathogen detection, critically evaluating their capacity to overcome the limitations of traditional culture-based techniques. Tailored for researchers, scientists, and drug development professionals, it explores the foundational principles of microbial viability and the technological advances in nucleic acid-based, phage-based, and metagenomic approaches. The scope extends to methodological applications across diverse samples, troubleshooting for complex matrices, and a rigorous comparative analysis of validation data and clinical performance. The synthesis aims to inform strategic decisions in diagnostic development and implementation for public health and food safety.
The Paradigm Shift from Culture: Defining Viability and Uncovering the Unculturable
Traditional culture-based methods represent the long-standing cornerstone of clinical microbiology for pathogen detection. Despite their established role as the "gold standard," these methods possess significant limitations that can impede patient care and obscure the true diversity of microbial communities [1] [2]. This application note delineates two principal shortcomings—protracted turnaround times and inherent incompleteness (the inability to cultivate all microorganisms)—within the context of advancing culture-independent diagnostic technologies. A comparative overview of these pathways is presented in the workflow below, highlighting critical bottlenecks and alternative solutions.
Quantitative Limitations of Culture-Based Methods
The limitations of culture-based methods can be quantitatively assessed across key performance metrics, as summarized in the table below.
Table 1: Quantitative Comparison of Diagnostic Method Limitations
| Parameter | Traditional Culture-Based Methods | Culture-Independent Methods | Impact & Consequences |
|---|---|---|---|
| Turnaround Time | 16 hours to 7 days for results [1] [3]; 30.4 hours median time to identification plus AST [3]. | ~4 hours (e.g., RaPID/BSI assay) [1]; 12 hours median time for NGS-based identification and AST prediction [3]. | Delays targeted therapy; mortality in septic shock increases by ~8% per hour of delayed treatment [4]. |
| Sensitivity (Post-Antibiotic Exposure) | Sensitivity reduced by ~50% if blood is collected after antibiotic administration [1]. | Largely unaffected by prior antibiotic exposure due to direct nucleic acid or antigen detection [1] [2]. | Leads to false-negative results and failure to diagnose infection. |
| Microbial Diversity Detection ("Culturability") | <1% of environmental microbes can be cultured [5]. Fails to detect fastidious, anaerobic, or slow-growing pathogens [1]. | Detects a broader spectrum, including uncultivable, fastidious, and non-viable organisms [6] [7]. | Provides an incomplete picture of microbial communities; misses key pathogens. |
| Public Health Isolate Recovery | Pathogen recovery from culture-derived isolates: 95% [8]. | Pathogen recovery from CIDT-positive specimens: 57% (varies by pathogen) [8]. | Hinders public health surveillance, outbreak detection, and AMR monitoring. |
Detailed Experimental Protocols for Culture-Independent Detection
The following sections provide detailed methodologies for two prominent culture-independent approaches, enabling researchers to implement or adapt these techniques in their investigations of microbial detection.
Protocol: RaPID/BSI Molecular Assay for Bloodstream Infection
This protocol details a culture-independent molecular assay designed to detect viable microorganisms directly from whole blood samples, overcoming key limitations of culture such as long turnaround time and interference from antimicrobials [1].
I. Research Reagent Solutions
Table 2: Key Reagents for RaPID/BSI Molecular Assay
| Reagent/Material | Function | Specific Example / Note |
|---|---|---|
| Proprietary Selective Lysis Solution (SLS) | Selectively lyses host white/red blood cells and non-viable microbial cells, preserving viable pathogens. | Core differentiator; removes interfering cell-free DNA and host genomic material [1]. |
| Density Medium (e.g., Lymphoprep-BCM Mixture) | Enables smart centrifugation for initial separation of bacteria from blood cells based on density [4]. | Critical for pre-analytical enrichment and reducing sample complexity. |
| Lysing Solution (Sodium Cholate/Saponin) | Chemically lyses remaining blood cells after initial centrifugation [4]. | Further purifies the sample, enhancing downstream detection sensitivity. |
| Lysis Buffer for Viable Microbes | Breaks open the enriched, viable microbial cells to release genomic material. | Differs from SLS; targets the viable cell fraction isolated in the previous steps. |
| γ-Modified Peptide Nucleic Acid (γPNA) Probes | Unique probes that hybridize to intact duplex DNA for specific pathogen identification. | Allows for highly specific detection without requiring single-stranded DNA [1]. |
| Enzymatic Amplification Master Mix | Amplifies target microbial genomic material (e.g., via PCR) for sensitive detection. | Essential for detecting low pathogen concentrations (e.g., <100 CFU/mL) [1]. |
II. Step-by-Step Workflow
Sample Pretreatment & Selective Lysis:
- Mix a defined volume of whole blood (e.g., 3 mL) with the Proprietary Selective Lysis Solution (SLS).
- Incubate the mixture to lyse human host cells (erythrocytes and leukocytes) and any non-viable microbial cells. This step also degrades the released host and non-viable microbial cell-free DNA.
- Centrifuge the sample to pellet the remaining intact, viable microorganisms.
Nucleic Acid Extraction:
- Discard the supernatant containing lysed cell debris and degraded nucleic acids.
- Resuspend the pellet containing the viable microbes and lyse them using a dedicated Lysis Buffer.
- Purify the released microbial genomic DNA using a standard commercial DNA extraction kit.
Pathogen Identification:
- Prepare the enzymatic amplification reaction (Enzymatic Amplification Master Mix) using specific primers.
- Incorporate γ-Modified PNA Probes into the assay. These probes bind specifically to complementary sequences on the amplified microbial DNA.
- Perform amplification and real-time detection. The fluorescence signal generated from γPNA probe hybridization allows for the identification of the specific pathogen present in the sample.
Analysis & Reporting:
- Analyze the detection data using proprietary software to assign pathogen identity.
- The entire process, from sample to result, is completed in approximately 4 hours [1].
Protocol: NGS-Assisted Diagnostic Workflow (PISTE)
This protocol describes a comprehensive Next-Generation Sequencing (NGS) workflow for the culture-independent detection of bloodstream pathogens and prediction of antimicrobial resistance (AMR) profiles, significantly reducing diagnostic timelines [3].
I. Research Reagent Solutions
Table 3: Key Reagents for NGS-Assisted Diagnostic Workflow
| Reagent/Material | Function | Specific Example / Note |
|---|---|---|
| Automated Nucleic Acid Purification System | Standardizes and automates the extraction of total DNA from complex samples like blood. | e.g., KingFisher system (Thermo Fisher Scientific) [3]. |
| Full-Length 16S rRNA PCR Primers | Amplify the nearly complete 16S rRNA gene for high-resolution taxonomic classification. | Targets a ~1500 bp region; allows for accurate species-level identification [3]. |
| Metagenomic Sequencing Kit | Prepares libraries from fragmented genomic DNA for untargeted shotgun sequencing. | e.g., SQK-PRB114.24 (Oxford Nanopore Technologies) [3]. |
| Real-Time Sequencer | Performs long-read sequencing, enabling rapid data generation and analysis. | e.g., Oxford Nanopore GridION Mk1b [3]. |
| Bioinformatics Analysis Pipeline | A dedicated computational workflow for pathogen detection and AMR gene identification from sequence data. | Custom-built or commercial software; critical for data interpretation. |
II. Step-by-Step Workflow
Sample Collection and Short-Term Incubation:
- Collect whole blood (e.g., 20 mL) from patients with suspected sepsis directly into blood culture flasks.
- Incubate the flasks for a brief, standardized period (e.g., 6 hours) at 37°C. Note: This is not for achieving culture positivity but for a short enrichment to increase pathogen load.
DNA Extraction and Library Preparation:
- After incubation, withdraw an aliquot (e.g., 0.5 mL) from the blood culture flask.
- Extract total DNA using an Automated Nucleic Acid Purification System and a compatible kit (e.g., MagMax Microbiome Ultra II kit).
- Prepare two parallel sequencing libraries: a. Full-length 16S rRNA Amplicon Library: Amplify the 16S rRNA gene using specific primers for rapid identification. b. Metagenomic Library: Fragment the total DNA and prepare a library for shotgun metagenomic sequencing to enable AMR gene detection.
Sequencing and Real-Time Analysis:
- Load the prepared libraries onto a Real-Time Sequencer.
- Initiate sequencing. The 16S rRNA sequencing typically runs for ~6 hours, while the metagenomic sequencing may run for 8-24 hours, depending on the desired depth.
Bioinformatic Pathogen ID and AMR Prediction:
- Process the raw sequencing data through a dedicated Bioinformatics Analysis Pipeline.
- For 16S data: Classify sequences by comparing them to curated databases for species-level identification.
- For metagenomic data: Align sequences to comprehensive databases of antimicrobial resistance genes to predict phenotypic resistance profiles.
- The median time to pathogen identification and AST prediction using this combined approach is approximately 12.0 hours from sample collection [3].
The Scientist's Toolkit: Essential Research Reagents
This table consolidates key reagents discussed in the protocols, serving as a quick-reference guide for setting up culture-independent detection experiments.
Table 4: Essential Research Reagent Solutions for Culture-Independent Pathogen Detection
| Category | Reagent / Kit | Primary Function in Workflow |
|---|---|---|
| Sample Preparation | Selective Lysis Solution (SLS) | Selective removal of host cells and non-viable microbes; reduces background interference [1]. |
| Density Gradient Medium (e.g., Lymphoprep) | Physical separation of microbial cells from host blood cells via centrifugation [4]. | |
| Selective Blood Cell Lysis Solution (e.g., Saponin/Sodium Cholate) | Chemical lysis of residual red and white blood cells post-centrifugation [4]. | |
| Nucleic Acid Extraction | MagMax Microbiome Ultra II Kit | Automated, efficient extraction of microbial DNA from complex biological samples [3]. |
| Target Amplification & Detection | γPNA (gamma Peptide Nucleic Acid) Probes | High-affinity, specific hybridization probes for unambiguous pathogen identification [1]. |
| Full-Length 16S rRNA Primers | Amplification of the taxonomic "gold standard" gene for precise species identification [3]. | |
| Sequencing & Analysis | Oxford Nanopore Sequencing Kits (e.g., SQK-PRB114.24) | Enables real-time, long-read metagenomic sequencing for pathogen and AMR detection [3]. |
| Dedicated Bioinformatics Pipeline (e.g., PISTE) | Analyzes complex NGS data to report identified pathogens and predicted resistance markers [3]. |
The conventional definition of microbial viability, rooted in the century-old ability to form colonies on nutrient media, is fundamentally inadequate for modern pathogen detection research. Many bacteria, when exposed to environmental stressors, enter a viable but nonculturable (VBNC) state where they fail to grow on standard media yet maintain metabolic activity and potential pathogenicity [9]. This limitation of culture-based methods poses a significant risk to public health, as VBNC pathogens remain infectious but evade detection by standard plating techniques [10]. The scientific community is now redefining viability through a culture-independent lens, focusing on core physiological attributes such as metabolic activity and membrane integrity to accurately assess infectious risks. This paradigm shift is crucial for fields ranging from food safety and clinical diagnostics to wastewater surveillance and drug development.
The Limitations of Culturability and the Rise of VBNC State
The plate culture method, a cornerstone of microbiology for over a century, defines viable bacteria simply as those capable of reproducing to form a visible colony [9]. However, this method possesses a critical flaw: it cannot detect bacteria in the VBNC state. When faced with unfavorable conditions—such as low temperature, nutrient starvation, or exposure to antibiotics—many pathogenic bacteria enter this dormant state. In the VBNC state, cells undergo a shutdown of culturalbility on general media, but they remain alive, maintain active metabolism, and critically, retain their virulence [10] [9]. For instance, VBNC Vibrio parahaemolyticus and V. cholerae continue to express toxin-encoding genes, presenting a tangible but hidden threat [10].
This state is not a laboratory curiosity; it has significant real-world implications. Studies have detected VBNC cells of V. parahaemolyticus and V. cholerae in up to 50% and 56% of retail seafood samples, respectively, that were otherwise declared safe by culture-based tests [10]. This demonstrates a alarming false-negative rate in safety assessments that rely solely on culturing. Furthermore, VBNC cells can sometimes resuscitate under favorable conditions, regaining their culturalbility and full infectious potential, which complicates long-term monitoring and eradication efforts [9]. The inability of culture-based methods to detect these hidden pathogens underscores the urgent need for diagnostic strategies that move beyond growth-based viability assessment.
Accepted Criteria for Microbial Viability
Modern microbiology recognizes three principal criteria for determining bacterial viability, which form the foundation of culture-independent methods [9].
- Culturability: The traditional gold standard, based on the ability of a bacterial cell to reproduce and form a colony on a solid medium. This criterion fails to detect VBNC cells.
- Metabolic Activity: This criterion assesses whether a cell is physiologically active. It can be measured by evaluating the uptake and hydrolysis of substrates like fluorescein diacetate (FDA) or the consumption of carbon sources like glucose.
- Membrane Integrity: This criterion is based on the fundamental distinction that a live bacterium has an intact cell membrane, while a dead bacterium has a disrupted or broken membrane. This makes it a robust indicator of viability, even for dormant cells.
The following table summarizes these criteria and their key characteristics.
Table 1: Core Criteria for Assessing Bacterial Viability
| Viability Criterion | What It Measures | Key Advantage | Key Limitation |
|---|---|---|---|
| Culturability | Reproductive capacity | Allows for isolation & further characterization | Cannot detect VBNC cells; can take several days |
| Metabolic Activity | Physiological function (e.g., enzyme activity) | Can detect VBNC cells | May miss dormant cells with silenced metabolism |
| Membrane Integrity | Structural completeness of the cell membrane | Can detect dormant cells; highly robust | Does not confirm cellular activity or virulence |
Figure 1: A modern workflow for assessing microbial viability, integrating both traditional and culture-independent criteria to identify VBNC states.
Advanced Culture-Independent Methods for Viability Assessment
Molecular Detection of Viable Cells
Viable quantitative PCR (vqPCR) is a powerful technique that bridges the gap between molecular detection and viability assessment. This method combines a preliminary treatment with DNA intercalating dyes, such as propidium monoazide (PMAxx) or "Reagent D" (as cited in the literature), followed by quantitative PCR targeting long gene fragments [10]. The dye selectively penetrates cells with compromised membranes (dead cells) and intercalates with their DNA, forming a covalent cross-link upon light exposure that inhibits PCR amplification. In contrast, viable cells with intact membranes exclude the dye, allowing their DNA to be amplified and detected [10]. This enables the specific detection of viable cells, including those in the VBNC state.
The sensitivity of vqPCR assays is remarkably high. For example, researchers have developed assays capable of detecting as few as 3.5 cells of V. parahaemolyticus (20 fg DNA) and 6.9 cells of V. cholerae (30 fg DNA) [10]. This level of sensitivity is crucial for detecting low levels of contamination in complex samples. When applied to retail seafood, vqPCR methods uncovered VBNC V. parahaemolyticus and V. cholerae at levels ranging from 2.6 to 5.2 Log10 cells/g in samples that were falsely negative by the culture-based ISO standard method [10]. This demonstrates vqPCR's direct application in enhancing the accuracy of food safety assessments.
Metabolic Activity-Based Assays
Assessing metabolic activity provides a direct window into the physiological state of microbes, allowing for the detection of VBNC cells that are metabolically active but nonculturable.
Redox Assays: Tetrazolium salts are a large family of compounds used to measure redox activity in metabolically active cells [11]. Colorless salts like CTC or XTT readily pass through the bacterial membrane and are reduced by active electron transport systems (ETS) or dehydrogenases to brightly colored or fluorescent formazan derivatives. The amount of formazan produced is proportional to the metabolic activity of the cells. This reduction is associated with a functional ETS and is correlated with respiration rates, making it a reliable proxy for metabolic activity [11].
Substrate Uptake Assays: These assays leverage the active transport systems of viable cells. A prime example is the use of Fluorescein diacetate (FDA), a non-fluorescent, lipophilic compound that passively diffuses into cells. Once inside, nonspecific intracellular esterases hydrolyze FDA into fluorescein, a green-fluorescent polar molecule that accumulates inside cells with intact membranes, signaling viability [9]. Another strategy involves using artificial fluorescent analogs of nutrients, such as 2-NBDG, a fluorescent glucose derivative. Viable cells with active glucose transport systems consume 2-NBDG, which is then metabolized, leading to a loss of fluorescence. Dead cells cannot metabolize the compound and thus retain fluorescence [9]. It is important to note that not all bacteria can uptake 2-NBDG, so its application must be validated for the target organism.
Table 2: Key Metabolic Assays for Viability Assessment
| Assay Type | Mechanism of Action | Readout | Considerations |
|---|---|---|---|
| Tetrazolium Salts (e.g., CTC, XTT) | Reduction by active ETS/dehydrogenases to formazan | Colorimetric/Fluorescent | May require solvent extraction (insoluble formazan); can be affected by abiotic reductants [11] |
| Fluorescein Diacetate (FDA) | Hydrolysis by intracellular esterases to fluorescein | Fluorescence (Microscopy/Plate Reader) | Sensitive to pH; potential for fluorescein efflux & signal quenching at high concentrations [9] |
| 2-NBDG Uptake | Uptake and metabolism via glucose transport system | Fluorescence loss (indicative of metabolism) | Not universal; limited to bacteria with specific glucose transporters [9] |
Application Notes & Experimental Protocols
Protocol: vqPCR for Detection of VBNCVibriospp.
This protocol outlines the steps for detecting viable V. parahaemolyticus and V. cholerae, including VBNC cells, in seafood samples using viable quantitative PCR [10].
I. Principle The method uses a proprietary DNA intercalating dye to selectively bind to DNA from dead cells with compromised membranes, suppressing their PCR amplification. Subsequent qPCR targets long gene fragments (groEL for V. parahaemolyticus, ompW for V. cholerae), specifically amplifying DNA from viable cells with intact membranes.
II. Reagents and Equipment
- Reagent D (or comparable viability dye, e.g., PMAxx)
- Primers for groEL (510 bp) and ompW (588 bp)
- qPCR Master Mix
- DNA Extraction Kit
- Light source for dye photoactivation (e.g., PMA-Lite LED)
- Real-time PCR instrument
III. Procedure
- Sample Preparation: Homogenize seafood sample (e.g., 10 g in 90 mL buffered peptone water).
- Viability Dye Treatment:
- Add the appropriate volume of Reagent D to the sample homogenate.
- Incubate in the dark for 10-20 minutes with occasional mixing.
- Expose the sample to bright light for 15-20 minutes to photo-activate the dye.
- Nucleic Acid Extraction: Extract total genomic DNA from the treated sample using a commercial kit.
- Quantitative PCR:
- Prepare reaction mixes for singleplex vqPCR using the published primer sets.
- Use the following typical cycling conditions:
- Hold: 95°C for 10 min (polymerase activation)
- 40 Cycles: 95°C for 15 sec (denaturation), 60°C for 1 min (annealing/extension)
- Include a standard curve of known genome copies for absolute quantification.
IV. Data Analysis
- Calculate the concentration of target cells (Log10 cells/g) based on the standard curve.
- A sample is considered positive for VBNC cells if it is negative by culture-based methods (ISO 21872-1:2023) but positive by vqPCR.
Protocol: Rapid Induction of VBNC State for Control Generation
This protocol describes a method to rapidly generate VBNC cell controls for V. parahaemolyticus and V. cholerae within one hour, essential for standardizing detection methods [10].
I. Principle Treatment of high-density bacterial cultures with a chemical stressor induces the VBNC state by disrupting cellular processes essential for growth on standard media, while maintaining viability.
II. Reagents and Equipment
- Lutensol A03 solution (10% v/v)
- Ammonium carbonate solution (1.0 M)
- Phosphate Buffered Saline (PBS)
- Spectrophotometer
- Culture shaker/incubator
III. Procedure
- Starter Culture: Grow Vibrio cultures to late exponential phase (approx. 7.3 Log10 CFU/mL) in an appropriate broth.
- Induction Solution: Prepare the VBNC induction solution containing 0.5-1.0% Lutensol A03 and 0.2 M ammonium carbonate in PBS.
- Induction Treatment:
- Harvest bacterial cells by centrifugation and resuspend in the induction solution at a high cell density.
- Incubate the suspension for 1 hour at room temperature with gentle agitation.
- Validation:
- Confirm the induction of the VBNC state by plating on standard media (culturalbility should drop by ≈6.5 Log10, yielding 0 CFU).
- Verify viability and membrane integrity using a metabolic activity assay (e.g., CTC reduction) or vqPCR.
Figure 2: Workflow for the rapid, one-hour induction of VBNC cells for use as control material in validation studies.
The Scientist's Toolkit: Key Research Reagent Solutions
Table 3: Essential Reagents for Culture-Independent Viability Research
| Research Reagent | Function/Application | Key Considerations |
|---|---|---|
| DNA Intercalating Dyes (e.g., PMAxx, Reagent D) | Selective inhibition of DNA amplification from dead cells in vqPCR | Critical for differentiating viable cells; requires optimization of concentration and light exposure [10]. |
| Tetrazolium Salts (e.g., CTC, XTT) | Detection of metabolic activity via reduction to colored formazan | CTC produces insoluble formazan requiring solvent extraction; XTT yields a soluble product for direct measurement [11]. |
| Fluorescein Diacetate (FDA) | Assessment of esterase enzyme activity as a marker of metabolic health | Signal is pH-sensitive and can be quenched at high intracellular concentrations [9]. |
| Lutensol A03 & Ammonium Carbonate | Chemical inducers for the rapid generation of VBNC control cells | Enables standardized production of reference materials for method validation [10]. |
| Target-Specific Primers/Probes (e.g., groEL, ompW) | Specific detection and quantification of target pathogens in molecular assays | Targeting long gene fragments can enhance the method's selectivity for intact DNA from viable cells [10]. |
The transition from defining microbial viability solely by culturability to assessing it through metabolic activity and membrane integrity represents a fundamental evolution in pathogen detection research. Techniques like vqPCR and metabolic probes are no longer niche applications but are becoming essential tools for accurate risk assessment in food safety, clinical diagnostics, and public health surveillance. By adopting these culture-independent methods, researchers and drug development professionals can uncover hidden reservoirs of pathogens, leading to more effective interventions and safer products. The future of microbial viability assessment lies in integrated approaches that leverage multiple viability criteria to paint a complete and accurate picture of the microbial threats in our environment.
The Critical Challenge of Viable-But-Non-Culturable (VBNC) and Persister Cells
Within genetically uniform bacterial populations, subpopulations in different physiological states can coexist. Under suboptimal or stressful conditions, a fraction of cells may enter dormant survival states, primarily the viable but non-culturable (VBNC) state and bacterial persistence [12]. These dormant cells remain viable but evade detection by conventional culture-based methods, leading to significant underestimation of microbial loads and potential health risks in clinical, industrial, and food safety contexts [13] [12]. The VBNC state is defined as a survival strategy where bacterial cells lose culturability on routine media but maintain viability, metabolic activity, and the potential to resuscitate under favorable conditions [14] [15]. First discovered in 1982 for Escherichia coli and Vibrio cholerae [14], this state has since been identified in over 100 bacterial species [15]. Persister cells, first identified in 1944 [16], represent a subpopulation of genetically susceptible, metabolically dormant cells that transiently tolerate high concentrations of bactericidal antibiotics without genetic change [16] [17] [18]. These cells can resume growth after antibiotic removal, contributing to chronic and relapsing infections [16] [17].
Table 1: Fundamental Characteristics of VBNC and Persister Cells
| Characteristic | VBNC State | Persister Cells |
|---|---|---|
| Culturability | Loss of ability to grow on routine media [15] | Retained ability to grow on routine media post-stress [15] |
| Metabolic Activity | Measurably active, but reduced [14] [15] | Greatly reduced or dormant [16] [18] |
| Induction Triggers | Moderate, long-term stresses: starvation, temperature extremes, high salinity, disinfectants [14] [15] | Specific, acute stresses: antibiotic exposure [15] |
| Resuscitation | Requires specific resuscitation stimuli (differs from original growth conditions) [15] | Occurs rapidly upon removal of the stressor [15] [12] |
| Clinical Significance | Risk due to undetected viability and potential virulence [14] [15] | Primary cause of relapsing infections and treatment failure [16] [17] |
Distinguishing VBNC and Persister Cells in Research
Defining Relationships and Controversies
The precise relationship between VBNC and persister cells remains a subject of scientific debate. Some researchers propose they represent different points on a dormancy continuum, where persisters (initial stage) and VBNC cells (deeper dormancy) are distinguished mainly by the time required for resuscitation [12]. Others suggest the distinction is artificial, arguing that both states represent variants of the same phenomenon with similar antibiotic tolerance profiles [14]. However, a consensus view emphasizes key differentiating criteria, particularly culturability and resuscitation requirements [15]. VBNC cells are defined by their failure to grow on routine media that normally support their growth, while persisters remain culturable after stress removal [15]. Furthermore, VBNC cell resuscitation typically requires conditions that differ from their original culturing conditions, whereas persisters readily resuscitate once the antibiotic stress is eliminated [15].
Molecular Mechanisms and Signaling Pathways
The formation of both VBNC and persister cells is regulated by complex molecular networks. Toxin-antitoxin (TAS) systems are crucial genetic controllers of dormancy [13]. Under stress, unstable antitoxins are degraded, allowing stable toxins to induce a sharp decrease in translation, replication, and cell growth, thereby promoting dormancy and dramatically increasing antimicrobial resistance [13]. For persister cells, the HipA system was one of the first mechanisms identified, where hipA mutation leads to higher persistence [16]. Other key processes include the stringent response (mediated by (p)ppGpp), SOS response to DNA damage, trans-translation, and epigenetic modifications [16]. These pathways collectively drive the bacterial population toward a dormant, tolerant state.
Diagram 1: Molecular pathways and cellular outcomes in bacterial dormancy. Multiple stress signals converge on molecular response pathways that drive cells toward dormant states.
Detection and Quantification Methodologies
Challenges of Conventional Culture Methods
Traditional microbiology relies heavily on culture-based techniques that fail to detect VBNC and persister cells, creating significant diagnostic blind spots [13]. This limitation has profound implications for clinical diagnostics, food safety, and environmental monitoring, where the absence of growth on culture media is often misinterpreted as the absence of viable pathogens [13]. The problem is particularly acute in biofilm-associated infections, where standard antibiotic therapies often fail because they target actively growing cells but miss dormant subpopulations [19].
Advanced Detection Protocols
Protocol 1: Viability Quantitative PCR (v-qPCR) with PMAxx and EMA for VBNC Cell Detection
Purpose: To detect and quantify VBNC cells in complex matrices like process wash water by distinguishing them from dead cells with intact membranes [20].
Principle: This method combines photoreactive dyes (EMA and PMAxx) with qPCR. The dyes penetrate dead cells with compromised membranes, bind covalently to DNA upon photoactivation, and inhibit PCR amplification. VBNC cells with intact membranes exclude the dyes and remain PCR-amplifiable [20].
Reagents and Materials:
- Propidium monoazide (PMAxx)
- Ethidium monoazide (EMA)
- Phosphate-buffered saline (PBS)
- Quantitative PCR reagents and specific primers
- Light exposure device (e.g., PHOTOLYSS)
Procedure:
- Sample Preparation: Concentrate bacterial cells from the test matrix (e.g., process wash water) by centrifugation at 2,500 × g for 5 minutes [20].
- Dye Treatment: Resuspend the pellet in PBS containing 10 μM EMA and 75 μM PMAxx [20].
- Incubation: Incubate the mixture in the dark at 40°C for 40 minutes [20].
- Photoactivation: Expose the sample to light for 15 minutes using a dedicated light-exposure device to activate the dyes [20].
- DNA Extraction: Extract genomic DNA from the treated cells using standard methods.
- qPCR Analysis: Perform quantitative PCR with species-specific primers. Compare threshold cycle (Ct) values between dye-treated and untreated samples to determine the proportion of VBNC cells [20].
Validation Notes: This method was successfully validated for Listeria monocytogenes in industrial process wash water containing chlorine, though complete discrimination between dead and VBNC cells may not be absolute, potentially leading to slight overestimation of VBNC populations [20].
Protocol 2: Biphasic Killing Curve Assay for Persister Cell Enumeration
Purpose: To detect and quantify persister cells in a bacterial population after antibiotic exposure [21].
Principle: When a bacterial population containing persisters is treated with bactericidal antibiotics, susceptible cells die rapidly, while persisters die slowly, producing a characteristic biphasic killing curve [18].
Reagents and Materials:
- Late stationary phase bacterial culture
- Appropriate bactericidal antibiotic (e.g., streptomycin)
- Culture media for viability plating
- Phosphate-buffered saline (PBS)
Procedure:
- Culture Preparation: Grow bacterial culture to late stationary phase to maximize persister frequency [17].
- Antibiotic Exposure: Expose the culture to a lethal concentration of antibiotic (e.g., 10-100× MIC) [18] [21].
- Viability Sampling: At predetermined timepoints (e.g., 0, 2, 4, 8, 12, 24 hours), remove aliquots and serially dilute in PBS containing antibiotic neutralizers if needed [21].
- Plating and Enumeration: Plate appropriate dilutions on non-selective culture media and incubate until colony formation. Count colony-forming units (CFUs) at each timepoint [21].
- Curve Analysis: Plot log CFU/mL versus time. A biphasic curve with an initial rapid decline followed by a slower decline indicates persister presence [18].
Application Example: This method was used to demonstrate persister formation in Erwinia amylovora after streptomycin exposure, with persisters maintaining viability for up to 12 hours [21].
Table 2: Comparison of Detection Methods for Dormant Bacterial Cells
| Method | Target State | Principle | Advantages | Limitations |
|---|---|---|---|---|
| v-qPCR with PMAxx/EMA [20] | VBNC | Membrane integrity discrimination with DNA intercalating dyes | Rapid, specific, applicable to complex matrices | May overestimate VBNC cells if dead cells have intact membranes |
| Biphasic Killing Curve [18] [21] | Persisters | Differential killing kinetics during antibiotic exposure | Confirms functional tolerance, relatively simple | Time-consuming, requires culturable cells |
| Live/Dead Staining + Flow Cytometry [20] | VBNC/Persisters | Fluorescent staining of membrane-intact cells | Rapid, single-cell resolution | Complex matrices can cause interference and overestimation of dead cells [20] |
| Single-Cell Approaches [12] | Heterogeneous populations | Analysis of individual cell physiology | Reveals population heterogeneity, detects rare cells | Technically demanding, requires specialized equipment |
The Scientist's Toolkit: Essential Research Reagents
Table 3: Key Research Reagents for Studying Bacterial Dormancy
| Reagent/Category | Specific Examples | Function/Application |
|---|---|---|
| Viability Dyes | PMAxx, EMA, LIVE/DEAD BacLight Kit [20] | Differentiate cells based on membrane integrity for VBNC detection |
| Metabolic Probes | Redox Sensor Green Vitality Stain [21], CFDA | Assess metabolic activity in dormant cells |
| Antibiotics | Streptomycin, Ciprofloxacin, Ofloxacin [18] [21] | Induce and study persister cell formation via biphasic killing assays |
| Culture Media | Brain Heart Infusion (BHI), Mannitol Glutamate Yeast Extract (MGY) [21] | Support growth of culturable cells and resuscitation studies |
| Neutralizing Agents | Sodium thiosulfate pentahydrate [20] | Quench disinfectants (e.g., chlorine) in antimicrobial efficacy tests |
| Molecular Biology Kits | DNA extraction kits, qPCR master mixes [20] | Enable genetic-based detection and quantification methods |
Significance in Clinical and Industrial Contexts
The presence of VBNC and persister cells has profound implications across multiple fields. In clinical medicine, persister cells are now recognized as underlying causes of chronic and relapsing infections such as tuberculosis, Lyme disease, and recurrent urinary tract infections [16]. Biofilms, which contain high concentrations of persister cells, are estimated to be associated with over 65% of all microbial infections [17] [19]. These biofilm-associated persisters exhibit up to 1,000-fold increased antibiotic tolerance compared to their planktonic counterparts [19]. In the food industry, VBNC pathogens pose a significant threat as they escape detection by routine culture-based methods but retain virulence and can resuscitate, potentially leading to foodborne disease outbreaks [20]. Studies have shown that common sanitizers like chlorine can induce the VBNC state in foodborne pathogens such as Listeria monocytogenes and Salmonella enterica, complicating efforts to ensure food safety [20]. Understanding these dormant states is therefore critical for developing more effective therapeutic interventions and safety assurance protocols across healthcare and industry sectors.
Sepsis and Bloodstream Infection (BSI) Diagnostics
Application Notes
The rapid identification of bloodstream pathogens is critical for sepsis management, as mortality rates increase significantly with each hour of delayed appropriate treatment [1] [4]. Culture-independent diagnostic tests (CIDTs) are transforming sepsis diagnostics by enabling pathogen detection within hours rather than the days required by conventional blood cultures [3] [1].
Table 1: Performance Comparison of Culture-Independent Methods for Sepsis Diagnosis
| Method/Platform | Principle | Turnaround Time | Key Performance Metrics | Pathogen Coverage |
|---|---|---|---|---|
| PISTE NGS Workflow [3] | Full-length 16S rRNA sequencing & metagenomics | ~12 hours | Sensitivity: 91.7%; Specificity: 96.5%; Accuracy: 95.7% | Broad-range bacterial detection & AMR prediction |
| RaPID/BSI Assay [1] | Viable cell enrichment & γPNA probe detection | ~4 hours | Removes >99% host DNA; resistant to antimicrobial interference | 20 most common sepsis pathogens |
| Culture-Free Microscopy [4] | Smart centrifugation, microfluidic trapping & AI imaging | ~2 hours | Detection limits: 9 CFU/ml (E. coli); 7 CFU/ml (K. pneumoniae) | E. coli, K. pneumoniae, E. faecalis |
These methods address critical limitations of blood culture, including false negatives due to prior antibiotic therapy and the inability to detect viable-but-non-culturable (VBNC) organisms [1] [22]. The integration of antimicrobial resistance (AMR) gene profiling with pathogen identification is a key advancement, facilitating timely targeted therapy and antimicrobial stewardship [3].
Detailed Protocol: PISTE NGS Workflow for Sepsis
Objective: To rapidly identify bloodstream pathogens and predict antimicrobial resistance profiles from whole blood using a next-generation sequencing (NGS) approach.
Materials and Reagents:
- KingFisher System (Thermo Fisher Scientific): For automated DNA purification.
- MagMax Microbiome Ultra II Kit (Applied Biosystems): For total DNA isolation.
- SQK-PRB114.24 Kit (Oxford Nanopore Technologies): For library preparation.
- Oxford Nanopore GridION Mk1b: For real-time sequencing.
- BACT/ALERT Blood Culture Bottles (bioMérieux).
Procedure:
- Sample Collection and Incubation: Collect 20 ml of whole blood via venipuncture and inoculate into blood culture bottles. Incubate at 37°C for 6 hours [3].
- Aliquot and Storage: After incubation, withdraw a 5.5 ml aliquot under sterile conditions and store at -80°C until nucleic acid extraction.
- DNA Extraction: Extract total DNA from 0.5 ml of the incubated blood sample using the MagMax kit on the KingFisher system, following the manufacturer's instructions.
- Library Preparation and Sequencing:
- Perform full-length 16S rRNA gene amplification and sequencing.
- In parallel, conduct metagenomic sequencing using the Oxford Nanopore kit.
- Load the prepared library onto the GridION sequencer.
- Bioinformatic Analysis: Use a dedicated computational pipeline for:
- Taxonomic classification of sequencing reads.
- Detection of antimicrobial resistance genes from metagenomic data.
- Results Interpretation: Report identified pathogens and predicted resistance profiles, with a typical turnaround time of 12 hours from sample to result.
Pneumonia Diagnostics in Immunocompromised Hosts
Application Notes
Pneumonia presents unique diagnostic challenges in immunocompromised populations, such as people living with HIV (PLWH), who are susceptible to a broad spectrum of typical, atypical, and opportunistic pathogens [23]. Metatranscriptomics has emerged as a powerful culture-independent tool for comprehensive pneumonia surveillance.
Table 2: Pathogen Detection in HIV-Associated Pneumonia using Metatranscriptomics
| Pathogen Category | Key Findings | Detection Rate | Clinical Correlation |
|---|---|---|---|
| Established Respiratory Pathogens | M. tuberculosis, H. influenzae, S. pneumoniae | 52% (113/217) | CD4 count <200 cells/μL associated with P. jirovecii |
| Possible Respiratory Pathogens | S. mitis (most common bacterium) | 45% (98/217) | Requires clinical context for interpretation |
| Polymerase Chain Reaction (PCR) | Targeted detection of specific pathogens | Lower than Metatranscriptomics | Limited to pre-defined targets |
| Mycobacterium tuberculosis Culture | Gold standard for active TB | Lower than Metatranscriptomics | Slow; requires specific culture conditions |
A study of 217 HIV-positive patients with pneumonia in Uganda demonstrated the superior sensitivity of metatranscriptomics, which identified a potential microbial cause in 97% of cases, far exceeding the diagnostic yield of traditional methods [23]. This approach is particularly valuable in resource-limited settings, as it reduces the need for multiple specialized testing platforms.
Detailed Protocol: Metatranscriptomic RNA Sequencing for Pneumonia
Objective: To comprehensively identify bacterial, viral, fungal, and parasitic pathogens from bronchoalveolar lavage (BAL) fluid using RNA sequencing.
Materials and Reagents:
- Bronchoalveolar Lavage (BAL) Fluid: Collected within 72 hours of hospital admission.
- RNA Extraction Kit: Suitable for complex clinical samples.
- Illumina Sequencing Platform: For high-throughput sequencing.
- IDseq Pipeline: Open-source, cloud-based bioinformatics platform for pathogen detection [23].
Procedure:
- Sample Collection: Perform bronchoscopy with BAL following standard clinical procedures. Collect fluid in a sterile container.
- RNA Extraction: Extract total RNA from the BAL sample using a validated protocol. Assess RNA quality and quantity.
- Library Preparation and Sequencing:
- Deplete ribosomal RNA to enrich for microbial transcripts.
- Prepare sequencing libraries using Illumina-compatible kits.
- Sequence on an Illumina platform to achieve sufficient depth for low-abundance pathogens.
- Bioinformatic Analysis with IDseq:
- Upload raw sequencing data to the IDseq portal.
- The pipeline performs host subtraction, followed by alignment to comprehensive microbial reference databases.
- Rules-Based Pathogen Identification:
- Apply the rules-based model to distinguish potential pathogens from commensals.
- Rank microbes by relative abundance and identify the point of greatest difference between sequential taxa.
- Classify organisms as "established pathogens" or "possible pathogens" based on a pre-defined reference index.
Food Safety and Foodborne Pathogen Detection
Application Notes
Culture-independent diagnostic tests (CIDTs) are revolutionizing food safety monitoring by enabling producers to rapidly screen for pathogenic contaminants, thereby reducing inventory storage time and potentially extending product shelf life [24]. Unlike culture-based methods that can take 2-3 days for preliminary results, CIDTs provide results in hours [22] [24].
Key advantages and limitations of CIDTs in food safety [25]:
- Advantages:
- Speed: Results in hours, allowing faster product release.
- Sensitivity: Can detect trace amounts of pathogen nucleic acid.
- Multiplexing: Some tests can detect multiple pathogens in a single reaction.
- Limitations:
- No isolate: Without a bacterial isolate, subtyping (e.g., for outbreak detection) and antimicrobial susceptibility testing are not possible.
- Viability assessment: Standard PCR cannot distinguish DNA from live versus dead cells.
To overcome the viability issue, methods like viability PCR (using propidium monoazide dye) and phage-based assays have been developed. Phage-based methods, which detect only viable host cells, are particularly promising as a rapid alternative to culture [22].
Detailed Protocol: Phage-Based Viable Pathogen Detection
Objective: To detect exclusively viable foodborne bacterial pathogens using bacteriophage amplification.
Materials and Reagents:
- Food Homogenate: Prepared by stomaching food sample in enrichment broth.
- Specific Bacteriophages: Lytic phages targeting the pathogen of interest (e.g., Salmonella, Listeria).
- Detection Reagents: For PCR, immunoassay, or enzymatic assay to detect progeny phages or released cellular components.
Procedure:
- Sample Processing: Homogenize the food sample (e.g., 25g food in 225ml broth). A short, non-selective enrichment (e.g., 6-8 hours) may be included to increase pathogen numbers.
- Phage Infection:
- Incubate the food homogenate with a high titer of specific bacteriophages.
- Phages will infect and replicate only within viable host bacterial cells.
- Cell Lysis and Detection:
- Option A (Plaque Assay): Filter the mixture to remove food debris. Mix the filtrate with a sensitive host bacterial lawn and incubate. Count plaques formed by progeny phages.
- Option B (Molecular Detection): Lyse the host cells to release progeny phages or intracellular markers. Detect these using PCR/qPCR (for host DNA), immunoassay (for phage proteins), or enzymatic assay (for intracellular enzymes) [22].
- Interpretation: A positive signal indicates the presence of viable, phage-sensitive pathogenic bacteria in the original food sample.
Sterile Body Fluid Analysis
Application Notes
Infections of normally sterile body fluids (NSBFs), such as cerebrospinal, synovial, and pleural fluids, are medical emergencies. Rapid identification of the causative agent is essential for directing antimicrobial therapy. While culture remains the gold standard, its sensitivity is variable, and time to result is prolonged [26]. Multiplex PCR panels offer a rapid supplemental method.
A 2024 study evaluating the GenMark ePlex Blood Culture Identification (BCID) Panels on positive body fluids demonstrated excellent performance, with a positive percent agreement of 96.5% and a negative percent agreement of 99.8% compared to culture [26]. This highlights the utility of multiplex PCR for rapidly narrowing the differential diagnosis in critical infections.
Detailed Protocol: Multiplex PCR from Positive Sterile Fluid Cultures
Objective: To rapidly identify pathogens from positive blood culture bottles inoculated with sterile body fluids using a multiplex PCR panel.
Materials and Reagents:
- Positive Blood Culture Bottle: Inoculated with sterile body fluid (e.g., cerebrospinal fluid, synovial fluid).
- GenMark ePlex BCID Panels: Gram-Positive (GP), Gram-Negative (GN), and/or Fungal Pathogen Panels.
- GenMark ePlex Instrumentation.
Procedure:
- Sample Inoculation into Blood Culture Bottle: Aseptically inoculate the sterile body fluid (e.g., 1-10 ml) into an appropriate blood culture bottle (e.g., BACTEC or BacT/ALERT). Incubate in an automated system until positive.
- Gram Stain: Upon positivity, perform a Gram stain on an aliquot of the broth to guide panel selection (GP, GN, or Fungal).
- Sample Loading: Aspirate a 200 μl sample from the positive blood culture bottle and load it into the designated cartridge of the selected ePlex BCID Panel.
- Cartridge Loading and Run: Insert the cartridge into the ePlex instrument. The system automatically performs nucleic acid extraction, amplification, and detection.
- Result Analysis: Results are typically available in approximately 1.5 hours. The panel reports the presence or absence of a predefined set of bacterial and fungal pathogens, along with key resistance markers (e.g., mecA for methicillin resistance, vanA/B for vancomycin resistance).
The Scientist's Toolkit: Key Research Reagent Solutions
Table 3: Essential Reagents and Kits for Culture-Independent Pathogen Detection
| Product/Kits | Primary Function | Key Features | Representative Application |
|---|---|---|---|
| MagMax Microbiome Ultra II Kit [3] | DNA extraction from complex samples | Efficient lysis; removes PCR inhibitors | NGS-based sepsis diagnosis (PISTE workflow) |
| Oxford Nanopore Kits (SQK-PRB114.24) [3] | Library prep for metagenomic sequencing | Real-time, long-read sequencing | Direct AMR gene detection from blood |
| Lymphoprep [4] | Density gradient medium | Separates blood cells from bacteria | "Smart centrifugation" for culture-free sepsis Dx |
| Selective Lysis Solution [1] [4] | Lyses human cells, preserves viable microbes | Proprietary surfactants (saponin, cholate) | Enriches viable bacteria prior to RaPID/BSI assay |
| IDseq Pipeline [23] | Cloud-based bioinformatic analysis | Open-source; integrates multiple databases | Metatranscriptomic pathogen discovery in pneumonia |
| Viability Dyes (PMA/EMA) [22] | Differentiate live/dead cells | Penetrates dead cells; blocks DNA amplification | Viability PCR for foodborne pathogens |
| Specific Bacteriophages [22] | Infect and lyse viable host bacteria | High host specificity | Phage amplification assays for viable L. monocytogenes |
| GenMark ePlex BCID Panels [26] | Multiplex PCR cartridges | Automated sample-to-answer | Rapid pathogen ID from positive sterile fluid cultures |
A Technical Deep Dive into Culture-Independent Detection Platforms
The rapid and accurate identification of pathogens is a cornerstone of effective disease diagnosis, outbreak management, and antimicrobial stewardship. Conventional culture-based methods, while considered the historical gold standard, are hampered by prolonged turnaround times, low sensitivity for fastidious organisms, and the prerequisite for viable microorganisms. Within the context of a broader thesis on culture-independent pathogen detection research, nucleic acid-based technologies have emerged as transformative tools that overcome these limitations. This article details the application notes and protocols for three pivotal techniques: Viability PCR (vPCR) for distinguishing live from dead microorganisms, Reverse-Transcriptase PCR (RT-PCR) for sensitive RNA target detection, and Metagenomic Next-Generation Sequencing (mNGS) for comprehensive, unbiased pathogen identification. These methods provide researchers and drug development professionals with a powerful arsenal for precise microbial characterization, enabling faster and more targeted therapeutic interventions.
Viability PCR (vPCR) for Detecting Live Pathogens
Principle and Applications
Viability PCR (vPCR) is an advanced molecular technique that combines the rapidity and sensitivity of PCR with the ability to discriminate nucleic acids from viable (live) and nonviable (dead) cells and viruses [27]. The core of this system is a cell- and capsid-impermeable intercalating reagent, such as propidium monoazide (PMA), which exclusively enters membrane- or capsid-compromised nonviable cells. Once inside, the molecule irreversibly and covalently modifies the nucleic acid, rendering it non-amplifiable in subsequent PCR reactions. Consequently, the amplification signal is derived almost exclusively from intact, viable cells or viruses [27] [28]. This is particularly valuable in bacteremia and sepsis research, where determining viable load is critical for diagnosing active infection and monitoring treatment efficacy, especially against predominant pathogens like Escherichia coli [28].
An optimized vPCR protocol for detecting live E. coli in whole blood involves a crucial eukaryotic-specific lysis step prior to PMA exposure. This step lyses red blood cells and depletes host DNA, which otherwise can inhibit PMA efficiency and PCR amplification. Following this, PMA is added and photoactivated. The subsequent DNA extraction and qPCR then specifically quantify the DNA from viable bacterial cells [28].
Key Experimental Protocol: vPCR forE. coliin Blood
Sample Preparation: Commercial blood (e.g., sheep blood in citrate) is spiked with a serial dilution of live E. coli culture (e.g., strain KG-15), typically from 10⁸ to 10² CFU/mL. To create a complex sample matrix, heat-killed cells can be added to specific samples to simulate the presence of non-viable bacteria. Effective heat killing is verified by a plate count of 0 CFU/mL [28].
Eukaryotic Lysis and Host DNA Depletion: 1 mL of spiked blood is mixed with 3 mL of commercial red blood cell lysis solution and incubated at room temperature for 15 minutes. The cells are collected by centrifugation, resuspended in PBS, and then treated with 1 mL of Host DNA Depletion Solution for another 15 minutes at room temperature. Bacterial cells are pelleted again via centrifugation [28].
PMA Treatment and DNA Extraction: The pelleted bacterial cells are resuspended in broth, and PMA is added to a final concentration of 25 µM. The sample is incubated in the dark with rotation for 15 minutes, followed by photoactivation for 20 minutes using a dedicated light exposure system. DNA is then extracted using a commercial kit, such as the QIAamp DNA Mini kit [28].
Quantitative PCR (qPCR): The extracted DNA is amplified using primers and probes specific to the target pathogen (e.g., the uidA gene for E. coli). The qPCR conditions are set according to the manufacturer's instructions for the detection chemistry [28].
Performance Data: This optimized protocol has demonstrated a lower limit of detection (LOD) of 10² CFU/mL for E. coli in blood, even in samples containing a mixture of live and heat-killed cells. The linear range of quantification spans from 10² to 10⁸ CFU/mL. Bland-Altman analysis indicates that vPCR quantification tends to overestimate the bacterial count compared to standard plate counts, with an average bias of approximately 1.9 Log₁₀ CFU/mL, but it reliably calculates percent viability in mixed populations [28].
Table 1: Performance Metrics of an Optimized vPCR Protocol for E. coli in Blood
| Parameter | Performance in Live-Cell Only Samples | Performance in Live/Dead Mixed Samples |
|---|---|---|
| Lower Limit of Detection (LOD) | 10² CFU/mL | 10² CFU/mL |
| Linear Range of Quantification | 10² to 10⁸ CFU/mL | 10³ to 10⁸ CFU/mL |
| Linearity (R²) | 0.997 | 0.998 |
| Bias vs. Plate Count | +1.85 Log₁₀ CFU/mL | +1.98 Log₁₀ CFU/mL |
Diagram 1: Viability PCR Workflow. The process involves sample preparation, a key eukaryotic lysis step, PMA treatment that selectively penetrates dead cells, DNA extraction, and final quantitative PCR.
Reverse-Transcriptase PCR (RT-PCR) for mRNA Detection
Principle and Applications
Reverse Transcription-Polymerase Chain Reaction (RT-PCR) is a fundamental technique for detecting and quantifying RNA, most commonly messenger RNA (mRNA). The process involves two main steps: first, the RNA template is transcribed into complementary DNA (cDNA) by the enzyme reverse transcriptase; second, the cDNA is amplified and quantified using a standard quantitative PCR (qPCR) or real-time PCR protocol [29] [30]. This method is relatively simple, inexpensive, and offers high sensitivity and specificity, making it a workhorse for gene expression analysis, RNAi validation, and pathogen detection [29] [30]. Quantitative real-time RT-PCR (qRT-PCR) allows for the detection of PCR amplification during the exponential phase, providing a more quantitative analysis compared to traditional endpoint RT-PCR [29].
RT-PCR can be performed in either a one-step or a two-step format. The one-step assay combines the reverse transcription and PCR amplification in a single tube and buffer, using sequence-specific primers. This format minimizes pipetting steps and experimental variation, making it suitable for high-throughput screening. In contrast, the two-step assay performs reverse transcription and PCR in separate tubes with individually optimized conditions. This allows for the generation of a stable cDNA pool that can be used to analyze multiple targets and offers greater flexibility in priming strategies [30].
Key Experimental Protocol: Two-Step RT-PCR
Total RNA Isolation: The first and most critical step is obtaining high-quality, intact RNA. Using TRI Reagent, the sample (tissue, monolayer cells, or suspension cells) is homogenized or lysed. The homogenate is centrifuged to remove insoluble material. Chloroform is added, and after centrifugation, the upper aqueous phase containing RNA is transferred to a fresh tube. RNA is precipitated with isopropanol, washed with 75% ethanol, and finally dissolved in nuclease-free water. Throughout the process, strict RNase-free conditions must be maintained to prevent degradation [29].
Reverse Transcription (cDNA Synthesis): For the two-step protocol, the RNA is reverse transcribed into cDNA. A typical reaction mixture includes the isolated RNA, reverse transcriptase (e.g., M-MLV), reaction buffer, dNTPs, a recombinant RNase inhibitor, and primers. The choice of primer is crucial [29] [30]:
- Oligo(dT) Primers: Anneal to the poly-A tail of mRNA, generating cDNA primarily from mRNA and good for full-length transcripts.
- Random Primers: Anneal to all RNA types (rRNA, tRNA, mRNA), useful for transcripts with secondary structure or when starting material is limited.
- Gene-Specific Primers: Provide the highest specificity and sensitivity for a single target. A mixture of oligo(dT) and random primers is often used to improve efficiency. The reaction is carried out in a thermal cycler [30].
Quantitative PCR (qPCR): The synthesized cDNA is used as a template for qPCR. The reaction mix includes the cDNA, upstream and downstream primers, a DNA polymerase (e.g., GoTaq), dNTPs, and a fluorescent detection system, such as SYBR Green or a TaqMan probe. Primers should be designed to span an exon-exon junction where possible to prevent amplification from contaminating genomic DNA. Amplification and real-time fluorescence measurement are performed on a real-time PCR detection system [29] [30].
Controls: A critical control for RT-PCR is the "no-RT" control, which contains all reaction components except the reverse transcriptase. Amplification in this control indicates contamination with genomic DNA or previous PCR products [30].
Table 2: Comparison of One-Step vs. Two-Step RT-PCR
| Feature | One-Step RT-PCR | Two-Step RT-PCR |
|---|---|---|
| Workflow | Reverse transcription and PCR in a single tube. | Two separate, sequential reactions. |
| Advantages | Fewer pipetting steps, reduced contamination risk, fast, highly reproducible. | Flexible priming options, stable cDNA pool for multiple targets, optimized conditions for each step. |
| Disadvantages | Reaction conditions are a compromise; less sensitive; fewer targets per sample. | More handling steps, greater risk of contamination, more time-consuming. |
| Ideal Use Case | High-throughput screening of a few targets. | When the same cDNA sample will be used for multiple gene targets. |
Diagram 2: Two-Step RT-PCR Workflow. The process begins with RNA extraction, followed by reverse transcription into cDNA, and culminates in quantitative PCR for detection and measurement.
Metagenomic Next-Generation Sequencing (mNGS)
Principle and Applications
Metagenomic Next-Generation Sequencing (mNGS) represents a paradigm shift in pathogen diagnostics. It is a non-targeted, high-throughput sequencing approach that enables the direct detection and characterization of microbial genomes from clinical samples without the need for prior knowledge of the infectious agent or cultivation [31]. The methodological backbone involves shotgun sequencing of total nucleic acids (DNA and/or RNA) extracted from diverse sample types, allowing for the simultaneous detection of bacteria, viruses, fungi, and parasites [31]. This provides a comprehensive view of the microbial community and is exceptionally powerful for identifying rare, novel, or unculturable pathogens that evade conventional diagnostic methods [31]. In sepsis management, for example, mNGS has been shown to significantly reduce the time to pathogen identification and antimicrobial susceptibility prediction compared to standard blood cultures, enabling more timely and targeted therapeutic interventions [32] [3].
The mNGS process consists of two main parts: the "wet lab" wet lab (laboratory testing) and the "dry lab" dry lab (bioinformatic analysis). The wet lab component includes sample collection from the site of infection (e.g., bronchoalveolar lavage fluid for lung infections, cerebrospinal fluid for CNS infections), nucleic acid extraction, library construction, and high-throughput sequencing on platforms such as Illumina, Oxford Nanopore, or BGISEQ-500 [31]. The dry lab component involves sophisticated bioinformatics analysis: quality control of the sequencing data, removal of human host sequences, alignment of non-host sequences to comprehensive microbial genome databases for species identification, and analysis of drug resistance or virulence genes [31].
Key Experimental Protocol: mNGS for Sepsis Diagnosis
Sample Collection and Pre-incubation: For bloodstream infection detection, whole blood samples are collected from patients with suspected sepsis prior to antibiotic administration. Samples are inoculated into culture flasks and incubated for a short period (e.g., 6 hours) to enrich for microbial pathogens [3].
Nucleic Acid Extraction and Library Preparation: Total DNA is automatically purified from the blood sample using a commercial kit. For comprehensive analysis, libraries are prepared for both full-length 16S rRNA amplicon sequencing and shotgun metagenomic sequencing. The 16S rRNA approach allows for rapid and accurate bacterial identification, while shotgun metagenomics enables the detection of all microbial types and the prediction of antimicrobial resistance (AMR) genes [32] [3].
High-Throughput Sequencing: The prepared libraries are sequenced on a real-time sequencing device, such as the Oxford Nanopore GridION. This platform is capable of generating sequence data in real-time, which contributes to a faster overall turnaround time [32] [3].
Bioinformatic Analysis: A dedicated computational pipeline is used for data analysis. The process includes basecalling, adapter trimming, and quality filtering. For shotgun metagenomic data, human sequence reads are identified and subtracted. The remaining non-host reads are classified taxonomically by alignment to reference databases. Furthermore, the sequences are screened for known AMR genes to predict antibiotic resistance profiles [31] [3].
Performance Data: In a clinical study of sepsis patients, this mNGS workflow (PISTE technology) demonstrated an overall accuracy of 95.7% compared to standard blood cultures, with a sensitivity of 91.7% and specificity of 96.5%. The median time to pathogen identification and AST prediction was 12 hours, which was significantly faster than the 30.4 hours required by standard culture methods. Resistance gene profiling showed strong agreement with culture-based AST results [3].
Table 3: Comparison of Sequencing Platforms for mNGS
| Platform | Core Technology | Key Features | Error Rate |
|---|---|---|---|
| Illumina | Sequencing-by-Synthesis (SBS) | High accuracy, high throughput, well-established. | ~0.1% (HiSeq series) [31] |
| Oxford Nanopore | Nanopore protein electrical signal detection | Real-time sequencing, long reads, portable devices. | Higher than Illumina, but improving [31] |
| Ion Torrent (Thermo Fisher) | Semiconductor sequencing (pH change) | Fast turnaround, no modified bases or optical systems. | Not specified in search results |
| BGISEQ-500 | DNA nanoball technology | Comparable to Illumina HiSeq for transcriptome studies. | Not specified in search results |
Diagram 3: Metagenomic NGS Workflow. The process encompasses sample collection, nucleic acid extraction, library preparation, sequencing, and a comprehensive bioinformatic analysis pipeline.
The Scientist's Toolkit: Essential Research Reagents and Materials
Table 4: Key Research Reagent Solutions for Nucleic Acid-Based Pathogen Detection
| Reagent/Material | Function | Example Products/Citations |
|---|---|---|
| Viability Dye (PMA) | Selectively enters dead cells with compromised membranes; binds to and blocks amplification of their DNA. | PMAxx [28] |
| Nucleic Acid Extraction Kit | Purifies DNA and/or RNA from complex sample matrices (e.g., blood, tissue). | QIAamp DNA Mini Kit [28], MagMax Microbiome Ultra II kit [3], TRI Reagent [29] |
| Reverse Transcriptase | Enzyme that synthesizes complementary DNA (cDNA) from an RNA template. | M-MLV Reverse Transcriptase [29] |
| DNA Polymerase | Enzyme that synthesizes new DNA strands during PCR amplification. | GoTaq DNA Polymerase [29], iTaq DNA Polymerase [33] |
| Real-Time PCR Master Mix | Optimized buffer containing dNTPs, polymerase, and fluorescence chemistry for qPCR. | iQ SYBR Green Supermix [29] |
| Next-Generation Sequencer | Instrument for performing high-throughput, parallel sequencing of nucleic acid libraries. | Oxford Nanopore GridION [3], Illumina platforms [31] |
| Primers & Probes | Sequence-specific oligonucleotides that define the target for amplification and detection. | Designed against target genes (e.g., SWP, SSU for EHP [34]; 18S rRNA for Leishmania [33]) |
| Bioinformatics Software | Computational tools for analyzing sequencing data (quality control, taxonomy, AMR). | Custom pipelines (e.g., for PISTE [3]), DADA2 [32] |
Within the field of culture-independent pathogen detection, bacteriophages (phages) offer a unique tool for identifying viable bacterial cells. Unlike molecular methods that may detect non-viable pathogens, phage-based assays exploit the biological requirement for an active, metabolizing host for viral replication [35] [36]. This application note details three core phage-based viability assays—plaque formation, phage amplification, and direct lysis detection—providing standardized protocols and comparative data to facilitate their implementation in research and diagnostic development.
The Scientist's Toolkit: Key Research Reagents
The following reagents are essential for performing the phage-based assays described in this document.
Table 1: Essential Research Reagents for Phage-Based Viability Assays
| Reagent/Material | Function in Assay | Key Considerations |
|---|---|---|
| Lytic Bacteriophages | Primary lytic agent; specifically infects and lyses viable target bacteria. | High specificity and virulence are critical; host range must be validated [35]. |
| Soft Agar | Semi-solid matrix for plaque assays; facilitates diffusion of phage particles to form discrete plaques [37]. | Typically used at 0.5-0.75% concentration; must be maintained molten during plating. |
| Indicator Bacteria | Lawn-forming strain for plaque and amplification assays; enables visualization of lytic events [36]. | Often the original host or a highly susceptible surrogate; must be in log-phase growth. |
| Chemical Virucide | Inactivates exogenous (input) phage in amplification assays to prevent background signals [36]. | Must completely inactivate seed phages without damaging infected cells (e.g., sodium pyrophosphate). |
| Tetrazolium Dye | Metabolic indicator in liquid assays; color change reflects bacterial respiration [38]. | Used in systems like Biolog Omnilog; signal correlates with cell viability. |
| Nucleic Acid Dyes & Lysis Reagents | Detects intracellular components (e.g., ATP, β-galactosidase) released upon phage-mediated lysis [36]. | Allows for bioluminescence or fluorometric readouts; requires efficient lysis. |
Core Assay Methodologies and Protocols
Plaque Assay for Quantification of Infectious Virions
The plaque assay is the historical gold standard for quantifying infectious phage particles and demonstrating lytic activity [37] [39]. It relies on the formation of clear zones, or plaques, on a bacterial lawn, each representing an initial infection by a single virion.
Detailed Protocol:
- Prepare Host Lawn: Grow the susceptible bacterial host to mid-log phase (OD₆₀₀ ≈ 0.3). Mix 0.5 mL of the bacterial culture with 3 mL of molten, tempered soft agar (0.75% w/v) and pour onto a base layer of standard nutrient agar (1.5% w/v) in a Petri dish [39].
- Apply Phage Dilutions: Serially dilute the phage sample in an appropriate buffer (e.g., SM buffer). Spot small volumes (e.g., 10 µL) of each dilution onto the surface of the solidified lawn, or incorporate diluted phage directly into the soft agar overlay [37] [40].
- Incubate and Enumerate: Incubate plates bottom-up overnight at the host's optimal temperature (e.g., 37°C for E. coli). Count discrete, clear plaques the next day and calculate the titer in Plaque-Forming Units per mL (PFU/mL) [39].
Diagram 1: Plaque assay workflow for phage quantification.
Phage Amplification Assay for Detection of Low-Level Contamination
This assay enhances sensitivity for detecting small numbers of viable pathogens by amplifying phages within the target bacteria before detection [36]. It is particularly useful for food safety and clinical diagnostics.
Detailed Protocol:
- Infect Sample: Incubate the test sample (e.g., food homogenate, clinical specimen) with a known high-titer of specific lytic phage (seed phage).
- Inactivate Residual Phage: After the latent period (just before lysis begins), add a chemical virucide (e.g., 100 mM sodium pyrophosphate) to the mixture to inactivate any remaining exogenous seed phages that have not infected a cell [36].
- Detect Progeny Phages: Plate the mixture with a sensitive indicator bacterium using a standard plaque assay. The presence of any plaques indicates that the original sample contained viable target bacteria, which allowed the seed phage to replicate and produce new, virucide-resistant progeny [36].
Direct Lysis Detection for Rapid Metabolic Signal Readout
These methods forego plaque formation and instead detect the immediate consequences of phage-induced lysis, such as the release of intracellular enzymes or a change in metabolic activity, enabling faster results [38] [36].
Detailed Protocol (Lysis-ATP Release as an example):
- Setup and Infect: Dispense a standardized suspension of the target bacterium (e.g., ~10⁵ CFU/mL) into a multi-well plate. Add the test phage at a high multiplicity of infection (MOI) [38].
- Monitor Lysis in Real-Time: Incubate the plate in a reader that monitors a relevant signal. This could be:
- Calculate Hold Time: The "hold time" is a quantitative metric, defined as the duration for which the phage inhibits bacterial growth compared to a no-phage control. A hold time ≥8 hours is often indicative of a highly active phage [38].
Comparative Analysis of Phage-Based Assays
The choice of assay depends on the required balance between speed, sensitivity, quantitative rigor, and throughput.
Table 2: Comparative Performance of Phage-Based Viability Assays
| Assay Method | Typical Turnaround Time | Key Output Metric | Key Advantage | Primary Limitation |
|---|---|---|---|---|
| Plaque Assay | 16-24 hours [38] | Plaque-Forming Units (PFU) | Gold standard for quantification; high specificity [37] [39]. | Low throughput; subjective counting; requires culturable host. |
| Phage Amplification | 8-24 hours [36] | Presence/Absence of PFU | Highly sensitive; confirms viable pathogen presence [36]. | Complex workflow; virucide step critical to avoid false positives. |
| Liquid Lysis (OD/Metabolic) | 4-48 hours [38] | Hold Time (hours) | Amenable to high-throughput automation; real-time kinetics [38]. | Lower sensitivity; signal can be affected by debris. |
| Lysis-ATP/Bioluminescence | ~1-8 hours [36] | Relative Light Units (RLU) | Very rapid; highly sensitive signal detection [36]. | Requires specialized reagents; can be prone to interference. |
Diagram 2: Direct lysis detection for rapid signal readout.
Plaque formation, phage amplification, and direct lysis detection represent a versatile toolkit for assessing bacterial viability. The plaque assay remains the foundational quantitative method, while amplification and direct lysis assays offer enhanced sensitivity and speed, respectively. The integration of these phage-based methods with modern molecular techniques and high-throughput instrumentation holds significant promise for advancing culture-independent detection of pathogens in research and clinical diagnostics.
Metagenomic Next-Generation Sequencing (mNGS) has emerged as a powerful, hypothesis-free approach for infectious disease diagnosis, capable of detecting a vast spectrum of pathogens without prior knowledge of the causative agent [41]. Two fundamental methodological approaches have been developed for processing clinical samples: whole-cell DNA (wcDNA) mNGS and cell-free DNA (cfDNA) mNGS. The wcDNA approach sequences DNA extracted from intact microbial cells in a sample, while the cfDNA approach targets microbial DNA freely circulating in body fluids, having been released from damaged or dead microorganisms [42] [43]. Understanding the comparative performance, applications, and limitations of these two targets is essential for optimizing their use in clinical and research settings for pathogen detection.
This application note provides a structured comparison of wcDNA and cfDNA mNGS methodologies, summarizing key performance characteristics, detailing standardized protocols, and offering guidance for appropriate implementation in pathogen detection research.
Performance Comparison: wcDNA vs. cfDNA mNGS
Recent comparative studies have revealed distinct performance profiles for wcDNA and cfDNA mNGS across different sample types and pathogen categories.
Table 1: Overall Detection Performance of wcDNA vs. cfDNA mNGS
| Performance Metric | wcDNA mNGS | cfDNA mNGS | Study Context |
|---|---|---|---|
| Sensitivity | 74.07% [44] | 46.67% (vs. culture) [44] | Body fluid samples (n=125) |
| Specificity | 56.34% [44] | Not reported | Body fluid samples (n=125) |
| Total Detection Rate | 83.1% [42] | 91.5% [42] | Pulmonary infections (BALF, n=130) |
| Host DNA Proportion | Mean 84% [44] | Mean 95% [44] | Body fluid samples (n=30) |
| Concordance with Culture | 70.7% (bacterial) [44] | Not reported | Compared to 16S rRNA NGS |
| Diagnostic AUC (ROC) | 0.7545 (alone) [43] | 0.8041 (alone) [43] | Combined AUC: 0.8583 [43] |
Pathogen-Type Detection Performance
The effectiveness of wcDNA and cfDNA mNGS varies significantly depending on the pathogen type, as cfDNA demonstrates particular advantages for certain microbial categories.
Table 2: Pathogen-Type Detection Performance
| Pathogen Type | wcDNA mNGS Performance | cfDNA mNGS Performance | Key Findings |
|---|---|---|---|
| Intracellular Bacteria | 6.7% detected exclusively [42] | 26.7% detected exclusively [42] | cfDNA superior for intracellular microbes |
| Fungi | 19.7% detected exclusively [42] | 31.8% detected exclusively [42] | cfDNA better for fungal detection |
| Viruses | 14.3% detected exclusively [42] | 38.6% detected exclusively [42] | cfDNA significantly better for viruses |
| Bacteria (General) | Consistent detection [44] | Good detection | wcDNA shows good bacterial concordance with culture |
Experimental Protocols
Sample Processing and DNA Extraction
The fundamental difference between wcDNA and cfDNA protocols lies in the initial sample processing steps, which dictate subsequent extraction methodologies.
cfDNA mNGS Protocol
- Sample Collection: Collect body fluids (blood, BALF, pleural fluid, etc.) in appropriate collection tubes. For blood, use cell-free DNA blood collection tubes (e.g., Streck BCT) [45].
- Centrifugation: Centrifuge samples at:
- cfDNA Extraction: Extract DNA from 400-500 μL of supernatant using specialized kits:
- Elution: Elute DNA in 50-60 μL of elution buffer [44] [43].
wcDNA mNGS Protocol
- Sample Processing: Retain the precipitate/pellet from the initial centrifugation step used for cfDNA preparation [44].
- Cell Lysis: Add lysis beads to the precipitate and shake at 3,000 rpm for 5 minutes to facilitate mechanical disruption of microbial cells [44].
- DNA Extraction: Extract DNA using:
- Elution: Elute DNA in 50-100 μL of elution buffer.
Library Preparation and Sequencing
While library preparation shares common steps after DNA extraction, the starting material differences can influence quality control parameters.
- Library Construction: Use commercial kits such as:
- Quality Control: Assess DNA concentration using Qubit 4.0 (Thermo Fisher Scientific) [42].
- Sequencing Platform: Perform sequencing on:
Bioinformatic Analysis
The bioinformatic pipeline remains largely consistent for both approaches after sequencing:
- Quality Filtering: Remove adapter sequences, low-quality reads, and short reads (<35 bp) [44] [45].
- Host DNA Depletion: Map reads to human reference genome (hg38) using Bowtie2 and remove aligned reads [42] [45].
- Microbial Identification: Align remaining reads to microbial genome databases using:
- Pathogen Reporting: Apply criteria for positive identification:
Workflow Visualization
The Scientist's Toolkit: Essential Research Reagents
Table 3: Essential Research Reagents for wcDNA and cfDNA mNGS
| Reagent Category | Specific Product Examples | Application & Function |
|---|---|---|
| Blood Collection Tubes | Streck Cell-Free DNA BCT [45] | Preserves cfDNA in blood samples by stabilizing nucleated blood cells |
| cfDNA Extraction Kits | VAHTS Free-Circulating DNA Maxi Kit [44]QIAamp DNA Micro Kit [45] | Isolation of cell-free DNA from plasma/body fluid supernatant |
| wcDNA Extraction Kits | Qiagen DNA Mini Kit [44] | Extraction of genomic DNA from microbial pellets/cells |
| Library Prep Kits | VAHTS Universal Pro DNA Library Prep Kit [44]QIAseq Ultralow Input Library Kit [42] | Preparation of sequencing libraries from low-input DNA |
| Quantitation Instruments | Qubit 4.0 Fluorometer [42] | Accurate measurement of DNA concentration prior to library prep |
| Sequencing Platforms | Illumina NovaSeq [44]Illumina NextSeq 550 [45] | High-throughput sequencing of prepared libraries |
| Bioinformatic Tools | Bowtie2 [45]BWA [45]SURPI+ [45] | Host sequence removal, microbial alignment, and pathogen identification |
Strategic Implementation Based on Clinical Scenario
The choice between wcDNA and cfDNA mNGS should be guided by the clinical context, suspected pathogen type, and sample characteristics:
- For suspected viral, fungal, or intracellular bacterial infections: Prioritize cfDNA mNGS due to its enhanced sensitivity for these pathogen types [42].
- For bacterial infections in body fluids: wcDNA mNGS demonstrates higher concordance with culture results and may be preferable [44].
- For samples with high host background: Cellular DNA mNGS (through differential lysis) shows better performance in high host background samples [43].
- For maximum diagnostic sensitivity: Combine cfDNA and wcDNA approaches, as this combination provides the highest diagnostic efficacy (AUC 0.8583) [43].
- For blood stream infections: cfDNA mNGS is particularly effective, with detection rates significantly higher than blood culture (74.4% vs. 12.1%) [45].
The comparative analysis of wcDNA and cfDNA mNGS reveals complementary rather than competitive roles in pathogen detection. wcDNA mNGS demonstrates higher sensitivity for general bacterial detection in body fluids, while cfDNA mNGS excels in detecting viruses, fungi, and intracellular pathogens. The characteristically high host DNA proportion in cfDNA mNGS (averaging 95%) presents analytical challenges but does not preclude its superior performance for certain pathogen categories.
For research and clinical applications, the optimal approach depends on the specific diagnostic question, sample type, and suspected pathogen spectrum. When resources allow, combining both methods maximizes diagnostic sensitivity and coverage. Future developments in host DNA depletion, targeted enrichment, and bioinformatic analysis will further enhance the capabilities of both approaches in the evolving landscape of culture-independent pathogen diagnostics.
The accurate and timely detection of pathogens in complex matrices is a cornerstone of effective public health measures, clinical diagnostics, and food safety. Conventional culture-based methods, long considered the gold standard, are often hampered by prolonged turnaround times and low sensitivity, particularly for fastidious or unculturable organisms [32] [7]. This delay is critical in sepsis management, where every hour without appropriate antimicrobial therapy significantly increases mortality [3]. Similarly, in food safety, traditional methods struggle to comprehensively detect diverse bacterial populations in products like bivalves [7].
The field is rapidly transitioning towards culture-independent molecular techniques that offer rapid, sensitive, and comprehensive pathogen detection directly from complex samples. This document details the application of these advanced methodologies, with a specific focus on a next-generation sequencing (NGS) workflow for bloodstream infection detection, providing structured data, detailed protocols, and visual guides to support their implementation in research and development.
Quantitative Performance Data
The following tables summarize key performance metrics for culture-independent diagnostic methods, facilitating easy comparison with standard-of-care (SoC) techniques.
Table 1: Diagnostic Performance of NGS-Based Pathogen Detection in Sepsis (n=71) [32] [3]
| Performance Metric | Value (%) |
|---|---|
| Overall Accuracy | 95.7 |
| Sensitivity | 91.7 |
| Specificity | 96.5 |
| Positive Predictive Value (PPV) | 84.6 |
| Negative Predictive Value (NPV) | 98.2 |
Table 2: Comparison of Turnaround Times for Pathogen Identification and AST [32] [3]
| Diagnostic Method | Median Time to Result | Key Steps and Durations |
|---|---|---|
| PISTE NGS Workflow | 12.0 hours | DNA Extraction (~2h), Library Prep & Sequencing (~6-10h), Data Analysis (~2h) |
| Standard-of-Care (SoC) Culture | 30.4 hours | Blood Culture Incubation (16-48h), Species ID (16-24h), AST (16-24h) |
Detailed Experimental Protocols
PISTE Workflow for Pathogen Detection in Whole Blood
This protocol describes a culture-independent method for detecting bloodstream pathogens and predicting antimicrobial resistance (AMR) profiles directly from whole blood using a combination of full-length 16S rRNA sequencing and metagenomic analysis [32] [3].
I. Sample Collection and Pre-processing
- Sample Type: Whole blood.
- Collection: Collect 20 mL of whole blood via venipuncture directly into blood culture flasks (e.g., BACT/ALERT FA Plus) prior to the initiation of antibiotic therapy.
- Incubation: Incubate the blood culture flask at 37°C in an automated system (e.g., BACT/ALERT VIRTUO) for 6 hours.
- Aliquot: After incubation, withdraw a 5.5 mL aliquot under sterile conditions and centrifuge to pellet microbial cells. Store the pellet at -80°C until DNA extraction.
II. Nucleic Acid Extraction
- Reagents: Use a commercial kit designed for microbiome studies, such as the MagMax Microbiome Ultra II kit.
- Procedure: Extract total genomic DNA from 0.5 mL of the pre-processed whole blood or the resuspended pellet according to the manufacturer's instructions. This typically involves mechanical or enzymatic lysis of cells, binding of DNA to magnetic beads, washing, and elution in a suitable buffer.
- Quality Control: Assess DNA concentration and purity using spectrophotometry (e.g., Nanodrop) or fluorometry (e.g., Qubit).
III. Library Preparation and Sequencing This workflow employs two parallel sequencing strategies for comprehensive analysis.
A. Full-Length 16S rRNA Gene Sequencing (for rapid bacterial identification):
- Amplification: Perform PCR amplification of the full-length 16S rRNA gene using universal bacterial primers.
- Library Construction: Prepare sequencing libraries from the amplified products using a ligation sequencing kit (e.g., SQK-PRB114.24 from Oxford Nanopore Technologies).
- Sequencing: Load the library onto a flow cell and perform real-time sequencing on an Oxford Nanopore GridION Mk1b device.
B. Metagenomic Sequencing (for AMR gene detection):
- Library Construction: Prepare sequencing libraries from the extracted total DNA without a targeted amplification step, using a metagenomics sequencing kit.
- Sequencing: Similarly, perform real-time sequencing on the GridION Mk1b device.
IV. Data Analysis and Bioinformatics
- Basecalling and Demultiplexing: Convert raw electrical signals into nucleotide sequences (basecalling) and assign sequences to respective samples (demultiplexing) using the sequencer's native software.
- Pathogen Identification (16S data): Process the 16S rRNA sequencing data through a dedicated bioinformatics pipeline (e.g., based on the DADA2 algorithm or the Emu tool) for quality filtering, denoising, and amplicon sequence variant (ASV) analysis. Compare ASVs against reference databases (e.g., SILVA, Greengenes) for taxonomic assignment to the species level.
- AMR Profile Prediction (Metagenomic data): Align metagenomic sequencing reads to comprehensive databases of antimicrobial resistance genes (e.g., CARD, ARG-ANNOT) using alignment tools (e.g., BWA, Bowtie2). Generate a report of detected AMR genes and correlate them with predicted phenotypic resistance, particularly for critical drug classes like β-lactams and carbapenems.
- Reporting: Consolidate pathogen identification and AMR prediction results into a final diagnostic report.
Magnetic Solid-Phase Extraction for Sample Clean-Up
For complex matrices like whole blood or food samples, efficient extraction and clean-up are critical. Functionalized magnetic covalent organic frameworks (MCOFs) represent an advanced sample preparation technique [47].
- Principle: MCOFs are designed with pore sizes that selectively match the target analyte (e.g., 1.5 times the drug molecule's diameter for optimal adsorption). They utilize multiple interactions—hydrogen bonding, electrostatic, and π-π interactions—for highly selective capture.
- Procedure: Suspend the MCOF material (e.g., MCOF-2-COOH) in the sample solution. Incubate with agitation for ~10 minutes to allow targets to adsorb onto the framework. Separate the MCOFs from the complex matrix using an external magnet. Wash with an appropriate buffer to remove non-specifically bound interferents. Elute the captured analytes (e.g., pathogens, drug molecules) with a small volume of solvent for downstream analysis.
Workflow Visualization
The following diagram illustrates the integrated NGS-assisted diagnostic workflow for pathogen detection from whole blood.
Diagram 1: NGS-assisted diagnostic workflow for sepsis.
The Scientist's Toolkit: Essential Research Reagents and Materials
Table 3: Key Research Reagent Solutions for NGS-Based Pathogen Detection
| Item | Function/Application | Example Product/Core Component |
|---|---|---|
| Automated DNA Extraction Kit | Purification of high-quality microbial DNA from complex matrices like whole blood. | MagMax Microbiome Ultra II Kit [3] |
| Full-Length 16S rRNA Primers | Amplification of the target gene for precise taxonomic classification of bacteria. | Universal 16S rRNA Primers (e.g., 27F/1492R) |
| Metagenomic Sequencing Kit | Preparation of sequencing libraries from fragmented genomic DNA for comprehensive pathogen and AMR detection. | Oxford Nanopore SQK-PRB114.24 [3] |
| Magnetic Covalent Organic Frameworks (MCOFs) | Selective solid-phase adsorbents for efficient extraction and clean-up of targets from complex samples. | MCOF-2-COOH [47] |
| Real-Time Sequencer | Platform for running sequencing reactions and generating long-read data in real-time. | Oxford Nanopore GridION Mk1b [32] [3] |
| Bioinformatics Pipeline | Software for analyzing sequencing data, including pathogen identification and AMR gene profiling. | Custom pipeline (e.g., based on Emu, DADA2) & SAMtools/BCFtools [32] |
Biosensors are sophisticated analytical devices that convert a biological response into a quantifiable electrical signal. These systems integrate a biological recognition element (such as antibodies, enzymes, or nucleic acids) with a physical transducer (electrochemical, optical, etc.) to detect specific analytes with high specificity and sensitivity [48]. In the context of culture-independent pathogen detection research, biosensors have emerged as transformative tools that overcome the limitations of traditional culture-based methods, which are often slow, labor-intensive, and unable to detect unculturable or fastidious microorganisms [7].
The fundamental architecture of all biosensors comprises three essential components: (1) a bioreceptor that selectively binds to the target analyte, (2) a transducer that converts the biological binding event into a measurable signal, and (3) a readout system that processes and displays the results [49] [48]. Electrochemical biosensors measure electrical signals (current, potential, or impedance changes) resulting from biochemical reactions, while immunological biosensors typically utilize antibody-antigen interactions as their recognition mechanism and can employ various transduction methods [49] [50]. These technologies offer significant advantages for pathogen detection, including rapid analysis, minimal sample preparation, potential for miniaturization, and compatibility with point-of-care testing formats, making them invaluable for clinical diagnostics, food safety monitoring, and environmental surveillance [49] [51].
Core Detection Technologies
Electrochemical Biosensors
Electrochemical biosensors represent one of the most extensively developed categories of biosensing platforms for pathogen detection. These devices function by measuring electrical signals generated from biochemical reactions occurring at the sensor interface [49]. The strategic design of these biosensors begins with electrode modification using various biomaterials including enzymes, antibodies, nucleic acids, or aptamers. When these biological elements interact with their specific targets, they catalyze or inhibit electrochemical reactions that alter the electrical properties at the electrode surface, generating measurable signals [48].
The exceptional capabilities of electrochemical biosensors stem from their integration with advanced nanomaterials. Graphene, carbon nanotubes, polyaniline, and metal nanoparticles have been successfully incorporated to enhance signal amplification due to their large surface areas, excellent conductivity, and rapid electron transfer kinetics [49] [48]. For instance, nanomaterial-enhanced electrodes have demonstrated ultra-low detection limits capable of identifying target molecules at attomolar concentrations, making them particularly suitable for detecting low-abundance pathogens in complex samples [52]. These sensors encompass a broad spectrum of techniques including voltammetry, amperometry, potentiometry, and electrochemical impedance spectroscopy, each offering distinct advantages for specific applications [49].
Recent innovations have focused on developing fully integrated systems that incorporate sample processing, detection, and data analysis into portable, point-of-care devices. These systems are increasingly incorporating machine learning algorithms for data interpretation and multiplexing capabilities for simultaneous detection of multiple pathogens [49]. The performance of these systems is evaluated based on several key parameters including electrode stability, reproducibility, sensitivity, selectivity, and ease of functional layer modification [49].
Immunological Biosensors
Immunological biosensors leverage the exquisite specificity of antibody-antigen interactions as their primary recognition mechanism. These biosensors employ various transduction methods to detect and quantify the binding events between immobilized antibodies and their target antigens, which can include whole pathogens, structural components, or secreted toxins [50] [51].
Immuno-sensors have evolved significantly from simple assay formats to sophisticated platforms capable of single-cell analysis. Among the most advanced formats are immune cell arrays, which create periodic patterns of non-fouling and cell-adhesive domains on surfaces modified with capture antibodies [53]. These arrays function as solid-phase cytometry platforms, allowing individual cells to be monitored over time with permanent addresses on the surface. This approach enables detailed investigation of immune cell functions, including cytokine secretion profiles and cell-to-cell communication [53].
Optical immunological biosensors, particularly those based on surface plasmon resonance (SPR), have gained prominence for their label-free, real-time monitoring capabilities. SPR biosensors detect changes in the refractive index at a metal surface (typically gold) when antibodies immobilized on the surface capture their target antigens [51]. Recent developments in SPR technology have incorporated plastic optical fibers (POFs) and 3D-printed custom holders, creating compact, portable systems suitable for field deployment [51]. These systems have demonstrated remarkable sensitivity in detecting entire bacterial cells, such as Brucella abortus, with limits of detection as low as 2.8 bacteria/mL without requiring amplification or special sample treatments [51].
Other innovative formats for immunological detection include microengraving, which employs microwells fabricated in PDMS to isolate single cells. The PDMS mold is pressed against a glass slide pre-coated with detection antibodies, creating picoliter-volume chambers where secreted molecules (antibodies or cytokines) can be captured and detected [53]. Similarly, micropatterned surfaces with anti-cytokine antibodies enclosed within microfluidic devices have enabled identification of polyfunctional T cells capable of producing multiple cytokines simultaneously [53].
Performance Comparison of Biosensor Platforms
The table below summarizes the performance characteristics of major biosensor platforms used in pathogen detection, highlighting their key applications and performance metrics.
Table 1: Performance Comparison of Biosensor Platforms for Pathogen Detection
| Biosensor Type | Detection Principle | Key Applications | Limit of Detection | Advantages |
|---|---|---|---|---|
| Electrochemical | Measures current, potential, or impedance changes | miRNA detection in colorectal cancer [52], viral detection [48] | Attomolar range for miRNAs [52] | High sensitivity, portability, low cost, compatibility with point-of-care systems [49] |
| SPR Immunosensor | Detects refractive index changes from antibody-antigen binding | Brucella abortus detection [51], cytokine monitoring [50] | 2.8 bacteria/mL for Brucella abortus [51] | Label-free, real-time monitoring, high specificity, reusable with regeneration [51] |
| NGS-Based Platforms | DNA sequencing and metagenomic analysis | Bloodstream pathogen identification in sepsis [3] | Variable based on sequencing depth | Culture-independent, comprehensive pathogen identification, antimicrobial resistance prediction [3] |
| CRISPR-Based Biosensors | CRISPR/Cas enzyme collateral activity | miRNA detection in Alzheimer's disease [54], pathogen detection [48] | 0.1 fM for miRNAs [54] | High specificity, multiplexing capability, minimal sample preparation [54] |
Detailed Experimental Protocols
Protocol 1: Immuno-SPR Biosensor for Bacterial Detection
This protocol details the specific methodology for detecting Brucella abortus using a surface plasmon resonance immunosensor, as demonstrated by Cennamo et al. [51]. The system employs a D-shaped plastic optical fiber (POF) platform with a removable sensor chip built using 3D printing technology.
Table 2: Key Research Reagent Solutions for Immuno-SPR Biosensor
| Reagent/Material | Function | Specifications/Alternatives |
|---|---|---|
| D-shaped POF Probe | SPR transduction platform | PMMA-doped with gold nanofilm [51] |
| Protein G | Oriented antibody immobilization | Enhances antibody binding capacity [51] |
| Specific Primary Antibody | Bacterial recognition | Anti-Brucella abortus antibody [51] |
| Polyethylene Glycol (PEG) | Interface layer | Short-chain PEG for minimal non-specific binding [51] |
| Carbodiimide Chemistry | Covalent immobilization | EDC/NHS coupling chemistry [51] |
| 3D-Printed Holder | Sample housing and alignment | Custom design with integrated measurement cell [51] |
Procedure:
Surface Functionalization:
- Clean the gold surface of the POF-SPR probe with oxygen plasma treatment for 1 minute.
- Immerse the sensor in an aqueous solution of 11-mercaptoundecanoic acid (1 mM) for 12 hours to form a self-assembled monolayer.
- Activate the carboxyl groups using a mixture of 0.4 M EDC and 0.1 M NHS for 30 minutes.
- Incubate with Protein G (50 μg/mL in 10 mM acetate buffer, pH 4.5) for 1 hour to enable oriented antibody immobilization.
- Block non-specific sites with 1 M ethanolamine-HCl (pH 8.5) for 30 minutes.
- Immobilize specific anti-Brucella abortus antibodies (20 μg/mL in PBS, pH 7.4) for 1 hour [51].
Measurement Setup:
- Integrate the functionalized SPR-POF probe into the 3D-printed custom holder.
- Connect the optical fiber to a white light source and spectrometer contained within the holder.
- Establish a baseline measurement using phosphate-buffered saline (PBS) as the running buffer [51].
Sample Analysis:
- Introduce bacterial samples at varying concentrations (1-10^6 bacteria/mL) into the measurement cell.
- Incubate for 5 minutes at room temperature to allow specific antibody-bacteria binding.
- Perform twenty washing steps with PBS buffer to remove non-specifically bound bacteria.
- Measure the resonance wavelength shift after each sample application.
- For sensor regeneration, inject 10 mM glycine-HCl (pH 2.0) for 1 minute to dissociate bound bacteria, then re-equilibrate with PBS [51].
Data Analysis:
- Record resonance wavelength shifts corresponding to bacterial concentrations.
- Generate a calibration curve by fitting data with the Hill equation to determine sensitivity and limit of detection [51].
Figure 1: Immuno-SPR Biosensor Workflow for Bacterial Detection
Protocol 2: Electrochemical Biosensor for miRNA Detection
This protocol describes the methodology for detecting microRNAs associated with colorectal cancer using electrochemical biosensors, achieving detection limits in the attomolar range [52].
Procedure:
Electrode Modification:
- Prepare a clean glassy carbon electrode by polishing with 0.05 μm alumina slurry and rinsing with deionized water.
- Deposit nanomaterials (e.g., MoS2@Ti3C2 nanohybrids, multi-walled carbon nanotubes) onto the electrode surface using drop-casting or electrodeposition to enhance sensitivity.
- Functionalize the nanomaterial-modified surface with DNA probes complementary to the target miRNA (e.g., miR-21, miR-92a) using carbodiimide chemistry or avidin-biotin interactions [52].
Sample Preparation and Hybridization:
- Extract miRNAs from clinical samples (serum, plasma, or tissue) using commercial extraction kits.
- Denature miRNA samples at 95°C for 5 minutes and immediately cool on ice.
- Incubate the miRNA samples with the functionalized electrode at 37°C for 1 hour to allow hybridization.
- Wash the electrode thoroughly with Tris-EDTA buffer to remove unbound miRNAs [52].
Electrochemical Measurement:
- Perform electrochemical measurements using differential pulse voltammetry or electrochemical impedance spectroscopy.
- Use a redox mediator (e.g., [Fe(CN)6]3-/4-) to generate measurable signals.
- Measure the current change or impedance shift resulting from miRNA hybridization.
- Quantify miRNA concentration based on the correlation between signal intensity and target concentration [52].
Data Analysis:
- Generate a standard curve using known concentrations of synthetic miRNA.
- Calculate the unknown sample concentrations based on the standard curve.
- Determine the detection limit using the 3σ/slope method, where σ represents the standard deviation of the blank signal [52].
Advanced Applications in Culture-Independent Pathogen Detection
Next-Generation Sequencing Integration
Next-generation sequencing (NGS) technologies have emerged as powerful culture-independent tools for comprehensive pathogen detection. The PISTE (Pathogen Identification and quantification Sequencing Technology) workflow represents a significant advancement in this field, combining full-length 16S rRNA gene sequencing with metagenomic analysis for diagnosis of bloodstream infections in sepsis [3].
This approach demonstrates remarkable performance with an overall accuracy of 95.7%, sensitivity of 91.7%, and specificity of 96.5% compared to standard blood cultures. Critically, it reduces the median time to pathogen identification from 30.4 hours (conventional culture) to just 12.0 hours, enabling more timely targeted antimicrobial therapy [3]. The protocol involves:
- Automated DNA purification from whole blood using the KingFisher system
- Full-length 16S rRNA gene sequencing for rapid bacterial identification
- Metagenomic analysis using Oxford Nanopore Technologies' SQK-PRB114.24 kit
- Real-time sequencing on the GridION Mk1b device
- Dedicated bioinformatics pipeline for pathogen identification and antimicrobial resistance gene profiling [3]
Figure 2: NGS-Assisted Culture-Independent Pathogen Detection Workflow
CRISPR-Based Biosensing Platforms
CRISPR-based biosensors represent a cutting-edge development in nucleic acid detection technology. These platforms utilize CRISPR-associated proteins (such as Cas13a) that exhibit collateral cleavage activity upon recognition of specific target sequences [54] [48]. A notable application involves the immobilization of CRISPR/Cas13a in chitosan hydrogel-coated 3D-printed 96-well plates, enabling unamplified quantification of multiple miRNAs simultaneously with femtomolar sensitivity (LOD of 0.1 fM) [54].
The key advantages of CRISPR-based biosensors include:
- Minimal sample preparation requirements
- High specificity in distinguishing closely related sequences
- Multiplexing capabilities for simultaneous detection of multiple targets
- Compatibility with point-of-care testing formats
- Cost-effectiveness (approximately USD 3.5 per plate) [54]
These systems function through the following mechanism:
- The CRISPR RNA (crRNA) guides the Cas enzyme to complementary target sequences
- Target binding activates the collateral cleavage activity of the Cas protein
- The activated Cas protein cleaves a fluorescent reporter molecule
- Fluorescence intensity is measured in real-time, correlating with target concentration [54]
Biosensor technology, particularly immunological and electrochemical detection methods, has revolutionized culture-independent pathogen detection research. These advanced platforms offer significant advantages over traditional culture-based methods, including rapid analysis, high sensitivity and specificity, minimal sample processing, and compatibility with point-of-care applications. The continuous innovation in nanomaterials, transduction mechanisms, and system integration is further enhancing the capabilities of these biosensors, enabling earlier and more accurate detection of pathogens across diverse clinical, environmental, and food safety applications. As these technologies mature and overcome challenges related to scalability and regulatory compliance, they hold immense potential to transform diagnostic paradigms and improve global health outcomes.
Overcoming Technical Hurdles: Inhibition, Host DNA, and Data Interpretation
Mitigating Food Matrix and Sample-Derived Inhibition in Detection Assays
Culture-independent diagnostic tests (CIDTs) are rapidly transforming the detection of foodborne pathogens, offering speed and sensitivity superior to traditional culture-based methods [55] [56]. However, a significant challenge complicating their application is the interference caused by complex food samples. Food matrices contain various components, such as fats, proteins, biofilms, and salts, which can inhibit molecular detection assays [57]. This phenomenon, known as the matrix effect, can suppress or enhance an analyte's response, leading to reduced sensitivity, false negatives, or inaccurate quantification [58]. Effective mitigation of these effects is therefore critical for developing robust, reliable, and accurate detection assays to ensure food safety.
This document outlines the principles and practical protocols for identifying, quantifying, and counteracting matrix effects in the detection of foodborne pathogens, framed within the context of advancing culture-independent detection research.
Understanding and Quantifying Matrix Effects
The Nature of Matrix Effects
In analytical chemistry, "matrix" is defined as all components of a sample other than the analyte of interest [58]. In food analysis, matrices can range from acidic tomatoes to fatty edible oils, each with unique interfering components. Matrix effects arise from unwanted interactions between these co-extracted compounds and the analyte during detection. In chromatographic methods coupled with mass spectrometry (LC-MS or GC-MS), these interferences can notably impact ionization efficiency [58]. Similarly, in nucleic acid-based methods like PCR, compounds from food can inhibit enzyme activity, reducing amplification efficiency [57] [59].
Protocol for Determining Matrix Effects
A standard approach for quantifying matrix effects is the post-extraction addition method [58]. This protocol involves comparing the analytical response of a target pathogen or biomarker in a pure solvent to its response when added to a extracted food sample.
Materials:
- Test food matrix
- Pathogen standard or DNA target
- Appropriate extraction solvents and reagents
- Analytical instrument (e.g., LC-MS/MS, qPCR system)
Procedure:
- Prepare a representative sample of the food matrix and perform a standard extraction procedure without the target analyte.
- Spike a known concentration of the analyte standard into the extracted matrix material. This is the matrix-matched standard.
- Prepare a solvent standard with the same concentration of the analyte in a clean solvent.
- Analyze both standards using your chosen detection assay (e.g., LC-MS/MS, qPCR) under identical conditions, with at least five replicates (n=5) per set.
- Compare the peak areas (for MS) or cycle threshold (Ct) values (for qPCR) between the two sets.
Calculation: Calculate the Matrix Effect (ME) factor using the following formula: ME (%) = (Peak Area of Matrix-Matched Standard / Peak Area of Solvent Standard - 1) × 100 [58]
Interpretation:
- ME ≈ 0%: No significant matrix effect.
- ME > 0%: Signal enhancement is occurring.
- ME < 0%: Signal suppression is occurring. As a rule of thumb, matrix effects exceeding ±20% are considered significant and require corrective action to ensure reliable quantification [58].
Strategies for Mitigating Matrix Effects
A multi-faceted approach is essential to overcome the challenges posed by complex food matrices. The following table summarizes the primary strategies.
Table 1: Strategies for Mitigating Matrix Effects in Pathogen Detection
| Strategy | Principle | Key Techniques | Applicability |
|---|---|---|---|
| Sample Clean-up & Physical Separation | Physically separate target pathogens from the inhibitory food matrix before analysis. | Immunomagnetic Separation (IMS), centrifugation, filtration [57] [59]. | Broadly applicable to various pathogens and food types; excellent for isolating viable cells. |
| Matrix-Matched Calibration | Compensate for matrix effects by using calibration standards prepared in a similar, analyte-free matrix. | Preparing standard curves in extracted food material rather than pure solvent [58] [60]. | Common in chromatographic methods; requires a consistent and readily available matrix source. |
| Advanced Nanomaterial-based Capture | Use functionalized nanoparticles to selectively bind and concentrate pathogens, overcoming interference. | Gold nanoparticles (AuNPs), magnetic nanoparticles (MNPs), aptamer-conjugated nanosensors [57]. | Emerging solution for ultra-sensitive detection; effective in complex matrices like dairy and seafood. |
| Automated & Integrated Systems | Integrate pathogen concentration, purification, and detection into a single, automated platform to minimize manual intervention and variability. | Microfluidic devices combining IMS and DNA extraction [61]. | Ideal for clinical and routine testing; improves reproducibility and throughput. |
Detailed Protocol: Immunomagnetic Separation (IMS) Combined with qPCR
This protocol details the use of IMS for the selective concentration of target bacteria from a complex food sample, thereby purifying the analyte and reducing PCR inhibitors.
- Workflow: The following diagram illustrates the integrated process of pathogen concentration and DNA extraction for improved detection sensitivity.
- Research Reagent Solutions:
Table 2: Essential Materials for IMS and qPCR Detection
| Item | Function | Example |
|---|---|---|
| Antibody-coated Magnetic Nanoparticles (Ab-MNPs) | Selective capture and concentration of target pathogen from the sample matrix using antibody-antigen recognition. | Anti-E. coli O157 or anti-Listeria MNP conjugates [61]. |
| Magnetic Rack or Separator | Immobilization and retrieval of bead-pathogen complexes during washing steps. | Commercial magnetic separation stands. |
| Lysis Buffer | Breaking down the captured bacterial cell wall to release genomic DNA for analysis. | Typically contains lysozyme, proteinase K, and detergents. |
| DNA Purification Kit/Beads | Further purification of released DNA from residual lysis reagents and potential inhibitors. | Silica-based magnetic beads or column kits [61]. |
| qPCR Master Mix | Amplification and fluorescence-based detection of target pathogen DNA. | Commercial mixes containing DNA polymerase, dNTPs, and buffer. |
- Procedure:
- Sample Preparation: Homogenize the food sample in an appropriate enrichment or buffer medium.
- Incubation with Ab-MNPs: Add a defined volume of Ab-MNPs to the homogenized sample. Incubate with continuous mixing (e.g., shaking at 200 rpm) for 30 minutes at room temperature to allow pathogen binding [61].
- Magnetic Separation: Place the sample tube on a magnetic rack for 2-5 minutes to immobilize the bead-pathogen complexes. Carefully aspirate and discard the supernatant containing the food matrix and interfering substances.
- Washing: Resuspend the magnetic pellet in a wash buffer (e.g., phosphate-buffered saline), reposition on the magnetic rack, and discard the supernatant. Repeat this step 2-3 times.
- DNA Extraction/Release: Resuspend the final magnetic pellet in a lysis buffer and heat to release genomic DNA. Alternatively, transfer the concentrated pathogens to a commercial DNA extraction kit.
- qPCR Analysis: Use the purified DNA as a template in a qPCR reaction specific to the target pathogen.
Emerging Solutions and Future Outlook
Nanoparticle-based detection systems are transformative tools for mitigating matrix effects. Functionalized nanoparticles can be designed for specific pathogen capture and can also act as signal amplifiers, enabling detection at ultra-low concentrations (e.g., as low as 1-10 CFU/mL) even in challenging matrices like dairy and seafood [57]. For instance, gold nanoparticles (AuNPs) are used in colorimetric assays, while magnetic nanoparticles are central to automated IMS systems [57] [61].
The future of overcoming matrix inhibition lies in the integration of these advanced materials with fully automated systems. An automated sample treatment system that integrates IMS and DNA extraction within a microfluidic device has been shown to process 1 mL of whole blood and detect E. coli O157 at concentrations as low as 1 CFU/mL—a 100-fold sensitivity improvement over standard PCR/qPCR alone [61]. Such systems effectively combine bacterial pre-concentration and DNA purification, two critical steps for removing PCR inhibitors in complex samples.
Strategies to Reduce High Host DNA Background in Metagenomic Sequencing
In the advancing field of culture-independent pathogen detection, metagenomic next-generation sequencing (mNGS) has emerged as a powerful, hypothesis-free tool for diagnosing infections. However, its application to clinical samples such as blood, respiratory fluids, and tissues is severely hampered by the overwhelming abundance of host DNA, which can constitute over 99% of the sequenced genetic material [62] [63]. This high host background dilutes microbial signals, drastically reduces the sensitivity of pathogen detection, and leads to significant wastage of sequencing resources [64]. Effective host DNA removal is therefore not merely an optimization step but a critical prerequisite for obtaining clinically actionable diagnostic data. This Application Note details the latest and most effective strategies to deplete host nucleic acids, thereby enhancing the sensitivity and diagnostic yield of mNGS workflows for infectious disease research.
Host DNA Depletion Methodologies: A Comparative Analysis
Strategies for host DNA depletion can be broadly categorized into wet-lab experimental techniques applied prior to sequencing and bioinformatic filtering performed post-sequencing. The optimal choice depends on sample type, available resources, and the specific research objectives [64]. The following table summarizes the primary methods.
Table 1: Comparison of Major Host DNA Depletion Strategies
| Method Category | Specific Method/Kit | Key Principle | Advantages | Limitations | Reported Efficacy (Host Read Reduction / Microbial Read Increase) |
|---|---|---|---|---|---|
| Physical Separation | ZISC-based Filtration (e.g., Devin filter) [62] [65] | Filter binds host leukocytes; microbes pass through. | >99% WBC removal; preserves microbial integrity; low labor intensity. | Not applicable to cell-free DNA (e.g., plasma cfDNA). | Microbial reads increased from 925 to 9,351 RPM (>10-fold) in sepsis blood [62]. |
| Physical Separation | Centrifugation & Filtration [64] | Exploits differences in cell size/density between host and microbial cells. | Low cost; rapid operation. | Cannot remove free host DNA (e.g., from lysed cells). | Varies by sample and protocol. |
| Enzymatic/Chemical Digestion | MolYsis Kit [63] | Selective lysis of host cells followed by DNase degradation of released DNA. | Effective on frozen samples without cryoprotectants. | May impact Gram-negative bacteria viability upon freezing [63]. | Sputum: ~70% host decrease; 100-fold microbial read increase [63]. |
| Enzymatic/Chemical Digestion | QIAamp DNA Microbiome Kit [63] [66] | Differential lysis of host cells. | Effective host depletion; minimal impact on Gram-negative viability post-freeze; high microbial diversity recovery. | Standardized commercial kit. | Sputum: ~46% host decrease; 50-fold microbial read increase. Nasal: ~75% host decrease; 13-fold microbial read increase [63]. |
| Enzymatic/Chemical Digestion | HostZERO [63] | Proprietary method for host DNA removal. | Good performance across sample types. | Library prep failure rate observed in some nasal/BAL samples [63]. | Nasal: ~74% host decrease; 8-fold microbial read increase [63]. |
| Enzymatic/Chemical Digestion | DNase Treatment (Host-removed mNGS) [67] | DNase digestion of DNA to enrich for RNA pathogens. | Enhances sensitivity for RNA virus detection (e.g., SARS-CoV-2). | Only applicable for RNA-based pathogen detection. | Significantly improved SARS-CoV-2 detection rate in swab samples [67]. |
| Bioinformatic Filtering | Bowtie2, BWA, KneadData [64] | Computational alignment and removal of reads mapping to host genome. | No experimental manipulation; highly compatible. | Requires complete host reference genome; cannot remove host-homologous sequences (e.g., E.R.V.s). | Dependent on initial sequencing depth and host fraction. |
Detailed Experimental Protocols
Protocol 1: ZISC-Based Filtration for Whole Blood
This protocol, optimized for sepsis detection, uses a novel zwitterionic interface filter to physically remove host white blood cells [62] [65].
Materials:
- Reagent: ZISC-based fractionation filter (e.g., Devin filter, Micronbrane).
- Equipment: Syringe, low-speed centrifuge, high-speed centrifuge.
- Kits: ZISC-based Microbial DNA Enrichment Kit, microbial DNA extraction kit.
Procedure:
- Sample Preparation: Collect 3-13 mL of whole blood (anticoagulated).
- Host Cell Depletion: Transfer the blood sample into a syringe attached to the ZISC filter. Gently depress the plunger to pass the blood through the filter into a clean collection tube.
- Plasma Separation: Centrifuge the filtered blood at 400 × g for 15 minutes at room temperature to isolate plasma.
- Microbial Pellet Formation: Transfer the plasma to a new tube and perform high-speed centrifugation at 16,000 × g for 30 minutes to pellet microbial cells.
- DNA Extraction: Discard the supernatant and proceed with DNA extraction from the pellet using the ZISC-based Microbial DNA Enrichment Kit or a standard microbial DNA kit, including a bead-beating step for comprehensive lysis.
- Downstream Application: Proceed with mNGS library preparation and sequencing. A minimum of 10 million reads per sample is recommended.
Protocol 2: Enzymatic Host Depletion for Respiratory Samples
This protocol is adapted for high-host-content respiratory samples like sputum and BAL that have been frozen without cryoprotectants [63].
Materials:
- Reagent: QIAamp DNA Microbiome Kit (Qiagen) or MolYsis Complete5 Kit (Molzym).
- Equipment: Centrifuge, bead-beater, thermomixer.
- Consumables: Lysing matrix tubes.
Procedure (QIAamp DNA Microbiome Kit):
- Sample Lysis: Resample the sample (e.g., sputum pellet) in the kit's lysis buffer. Incubate at high temperature to lyse both host and microbial cells.
- Host DNA Degradation: Cool the lysate and add the provided DNase. Incubate to degrade free host DNA. Microbial DNA remains protected within intact cell walls.
- Microbial Lysis: Add a second lysis buffer and proteinase K to lyse the microbial cells and release their DNA.
- DNA Binding and Purification: Bind the microbial DNA to a silica membrane column, wash away impurities, and elute the purified DNA.
- Quality Control: Quantify DNA yield and assess host depletion efficiency via qPCR targeting a host single-copy gene (e.g., RP2 or GAPDH) and a bacterial gene (e.g., 16S rRNA) [63].
Figure 1: An integrated mNGS workflow for pathogen detection, combining pre-sequencing host depletion methods with post-sequencing bioinformatic cleaning.
The Scientist's Toolkit: Essential Reagents and Kits
Table 2: Key Research Reagent Solutions for Host DNA Depletion
| Product Name | Manufacturer | Primary Function | Best Applicable Sample Types |
|---|---|---|---|
| Devin Filter (ZISC-based) | Micronbrane | Physical depletion of host white blood cells via filtration. | Whole Blood, Septicemia Samples |
| QIAamp DNA Microbiome Kit | Qiagen | Differential lysis and enzymatic degradation of host DNA. | Respiratory Samples (Sputum, BAL), Urine, Tissues |
| MolYsis Complete5 Kit | Molzym | Selective host cell lysis and DNase degradation. | Respiratory Samples, Oral Swabs |
| HostZERO Microbial DNA Prep Kit | Zymo Research | Proprietary method for comprehensive host DNA removal. | Stool, Respiratory Samples, Urine |
| NEBNext Microbiome DNA Enrichment Kit | New England Biolabs | Enrichment of microbial DNA using methylation-dependent binding. | Cultured Cells, Tissues |
| MagAttract PowerSoil DNA Kit | Qiagen | High-throughput DNA extraction with bead-beating for soil/microbiome. | Stool, Environmental Samples |
| DNase I (RNase-free) | Various | Enzymatic digestion of DNA in RNA-focused mNGS. | Swabs, Liquid Biopsies (for RNA pathogen detection) |
Figure 2: A decision tree to guide researchers in selecting the most appropriate host depletion strategy based on their sample type and research question.
The effective reduction of host DNA background is a cornerstone of successful mNGS application in clinical microbiology. No single method is universally superior; the choice hinges on the sample matrix and diagnostic goal. For whole blood, ZISC-based filtration offers a robust, efficient solution [62]. For respiratory samples and other challenging matrices, enzymatic methods like the QIAamp DNA Microbiome Kit provide a strong balance of efficacy and practicality [63]. For RNA pathogen detection, simple DNase treatment is a powerful and often overlooked option [67]. As the field moves forward, combining optimized wet-lab depletion with sophisticated bioinformatic filtering will maximize sensitivity, enabling mNGS to fully realize its potential as a transformative tool in the diagnosis of infectious diseases.
Pre-processing and Concentration Techniques for Low-Biomass Pathogen Detection
Low-biomass environments, such as certain human tissues, the atmosphere, and treated drinking water, present significant challenges for pathogen detection due to their minimal microbial content, which approaches the limits of detection of standard DNA-based sequencing methods [68]. In these environments, the inevitable introduction of contaminating DNA from reagents, sampling equipment, and laboratory personnel can disproportionately impact results, potentially leading to spurious conclusions [68] [69]. The research community has recognized these issues, which have fueled controversies in fields like placental microbiome research and tumor microbiome studies [69]. This protocol outlines robust pre-processing and concentration techniques designed to maximize the target pathogen signal while minimizing contamination and host DNA interference, thereby ensuring the reliability of subsequent culture-independent diagnostic applications.
Critical Challenges & Contamination Control
Key Challenges in Low-Biomass Studies
Working with low-biomass samples introduces several analytical challenges that must be addressed to generate valid data:
- External Contamination: Microbial DNA from sources other than the sample (e.g., reagents, kits, personnel) can constitute a large proportion of the final sequence data, obscuring the true signal [68] [69].
- Host DNA Misclassification: In host-associated samples (e.g., tissues, blood), the vast majority of sequenced DNA is often from the host. This host DNA can be misclassified as microbial, generating noise or even artifactual signals if confounded with experimental groups [69].
- Well-to-Well Leakage: Also termed "cross-contamination" or the "splashome," this refers to the transfer of DNA between samples processed concurrently, such as in adjacent wells on a plate, which can compromise the inferred composition of every sample [68] [69].
- Batch Effects and Processing Bias: Differences arising from variations in protocols, reagent batches, or personnel can distort inferred signals, particularly when batches are confounded with the phenotype of interest [69].
Comprehensive Contamination Mitigation Strategy
A proactive, multi-layered approach is essential to manage contamination.
Table 1: Strategies for Contamination Mitigation at Different Workflow Stages
| Workflow Stage | Primary Strategy | Specific Actions |
|---|---|---|
| Study Design | Avoid Batch Confounding | Actively balance case/control samples across processing batches; use randomization tools [69]. |
| Sample Collection | Source Decontamination & Barriers | Decontaminate tools/surfaces with ethanol and DNA-degrading solutions (e.g., bleach); use single-use, DNA-free consumables; employ PPE (gloves, masks, coveralls) [68]. |
| Laboratory Processing | Process Controls | Include multiple types of controls: blank extraction controls, no-template PCR controls, and sampling controls (e.g., empty collection vessels, swabs of air/surfaces) [68] [69]. |
| Data Analysis | Computational Decontamination | Use bioinformatic tools to identify and subtract contaminants identified from process controls; be aware that well-to-well leakage can violate some decontamination tools' assumptions [69]. |
Sample Collection & Biomass Concentration
Optimized Sampling Methodologies
The chosen sampling method must maximize microbial recovery while minimizing co-isolation of host material or inhibitors.
- Swab-Based Collection: For surfaces like gills or the upper respiratory tract, swabbing is a non-invasive and effective method. One study on fish gills demonstrated that swabbing yielded significantly more 16S rRNA gene copies and less host DNA compared to sampling whole tissue [70].
- Surfactant Washes: For mucous-rich surfaces, gentle washing with low-concentration surfactants (e.g., 0.01% Tween 20) can effectively recover bacteria from the mucus layer with minimal host cell lysis. Higher surfactant concentrations cause increased host DNA contamination through tissue damage and hemolysis [70].
- Filtration: Passing liquid samples (e.g., water, surfactant washes) through a sterile, DNA-free filter with a pore size of 0.22 µm captures microbial cells, allowing for subsequent concentration and DNA extraction from the filter [70].
Sample Concentration & Preservation
- Centrifugation: Concentrate microbial cells from liquid samples or washes by centrifugation. Specific g-forces and times should be optimized for the sample type to avoid pelleting excessive particulate matter.
- Immediate Preservation: After collection, immediately preserve samples to stabilize microbial community structure. This can involve freezing at -80°C or using commercial preservation solutions that stabilize nucleic acids.
- Avoiding Inhibitors: The sampling approach should be optimized to minimize the collection of substances that inhibit downstream molecular reactions, which are common in complex samples like gills or sputum [70].
DNA Extraction & Pathogen Enrichment
Enhanced Lysis and DNA Extraction
Effective lysis is critical for low-biomass samples, but must be balanced against the release of host DNA.
- Mechanical Lysis: Protocols for upper respiratory tract samples recommend incorporating bead beating with chemical lysis to ensure robust disruption of diverse microbial cell walls, including tough Gram-positive bacteria [71].
- Host DNA Depletion (Preextraction): Techniques can be applied before DNA extraction to reduce host nucleic acids. These include selective lysis of host cells (exploiting their weaker cell membranes), enzymatic degradation of exposed DNA, or using propidium monoazide to intercalate into DNA of compromised host cells [70]. Note that these methods can introduce bias, such as a potential loss of Gram-negative bacterial DNA [70].
- Host DNA Depletion (Postextraction): After DNA extraction, methods like methylated DNA depletion (using MBD-Fc beads) or CRISPR/Cas9-based targeting can enrich for microbial DNA. These methods can be costly and may bias against microbes with AT-rich genomes [70].
Target Amplification and Quantification
- 16S rRNA Gene Quantitative PCR (qPCR): Prior to library preparation, quantify the bacterial load in extracted DNA using qPCR targeting the 16S rRNA gene. This serves two purposes: it screens samples for sufficient bacterial signal before costly sequencing, and it enables the creation of "equicopy" libraries [70].
- Equicopy Library Construction: Normalize the input DNA for each sample based on 16S rRNA gene copy number rather than total DNA concentration. This approach has been shown to significantly increase the captured bacterial diversity and improve the fidelity of the final community data [70].
The Scientist's Toolkit
Table 2: Essential Research Reagent Solutions for Low-Biomass pathogen detection
| Item | Function/Application | Key Considerations |
|---|---|---|
| DNA-Decontaminated Swabs | Non-invasive sample collection from surfaces (e.g., gills, URT). | Ensure single-use and pre-sterilized. Validating lot-specific contamination is recommended [69]. |
| Low-Concentration Surfactant (e.g., 0.01% Tween 20) | Gentle recovery of microbes from mucous membranes. | Higher concentrations can lyse host cells, increasing host DNA contamination [70]. |
| Personal Protective Equipment (PPE) | Barrier to prevent operator-derived contamination. | Should include gloves, masks, goggles, and coveralls to reduce contamination from skin, hair, and aerosols [68]. |
| Nucleic Acid Degrading Solution (e.g., Bleach) | Surface decontamination to remove external DNA. | Essential for decontaminating reusable equipment. Note that sterility (e.g., autoclaving) does not guarantee a DNA-free surface [68]. |
| Blank Extraction Kits & Negative Controls | Process controls to identify reagent-derived contamination. | Must be included in every processing batch to profile contaminating taxa [68] [69]. |
| Bead Beating Tubes | Mechanical lysis for robust disruption of diverse microbial cells. | Critical for breaking Gram-positive bacterial and fungal cell walls in complex samples [71]. |
| 16S rRNA qPCR Assay | Quantification of bacterial load and normalization for sequencing. | Enables screening of sample quality and construction of equicopy libraries to improve diversity assessment [70]. |
Experimental Workflow & Data Analysis
Integrated Experimental Protocol
The following workflow synthesizes the key steps from collection to analysis, highlighting critical control points.
AI-Assisted Data Analysis Framework
For metagenomic data, advanced computational frameworks are increasingly valuable.
- Structured Probabilistic Modeling: Formulates pathogen detection as a hierarchical inference task under taxonomic and ecological constraints, integrating phylogenetic priors to reduce noise and ambiguity, which is crucial for low-abundance pathogens [72].
- Taxon-aware Compositional Inference Network (TCINet): A deep learning model that processes sequencing reads to produce taxonomic embeddings while enforcing sparsity and interpretability, and propagating uncertainty [72].
- Hierarchical Taxonomic Reasoning Strategy (HTRS): A post-inference module that refines predictions by enforcing compositional constraints and propagating evidence across taxonomic hierarchies, improving confidence calibration [72].
The reliable detection of pathogens in low-biomass environments demands a rigorous, multi-faceted approach from sample collection through data analysis. Key to success is the meticulous prevention and tracking of contamination via appropriate controls, the use of sampling and processing methods that maximize microbial signal while minimizing host background, and the application of sophisticated analytical frameworks that can distinguish true signal from noise. By adhering to these detailed protocols, researchers can generate robust, reproducible data that advances our understanding of pathogens in these challenging but critical environments.
Culture-independent detection methods, particularly metagenomic next-generation sequencing (mNGS), represent a paradigm shift in clinical microbiology by enabling unbiased pathogen identification [73]. However, the transition from sequencing data to clinically actionable results presents a significant challenge: distinguishing true pathogenic signals from background noise, which includes non-pathogenic microbiota, environmental contaminants, and host nucleic acids [73] [74]. This application note details the bioinformatic criteria and experimental protocols essential for accurate pathogen reporting in clinical and research settings, providing a structured framework for data interpretation that underpins the broader thesis of advancing culture-independent diagnostic research.
Core Bioinformatic Parameters for Pathogen Identification
The interpretation of mNGS data relies on a combination of traditional and novel bioinformatic parameters. A critical understanding of these metrics is required to evaluate their diagnostic efficacy accurately.
Table 1: Traditional and Novel Parameters for Pathogen Identification in mNGS
| Parameter Category | Specific Metric | Calculation/Definition | Diagnostic Utility |
|---|---|---|---|
| Read Count Indicators | Raw Reads | Count of sequencing reads mapped to a pathogen | Basic measure of abundance; highly dependent on sequencing depth [74] |
| Reads per Million (RPM) | (Mapped reads / Total sequenced reads) × 10^6 | Normalizes for sequencing depth; commonly used but can be influenced by background [74] | |
| 10M Normalized Reads | (Mapped reads / Total sequenced reads) × 10^7 | Further refinement of read normalization for cross-sample comparison [74] | |
| Double-Discard Reads | A novel method that discards certain reads to improve specificity [74] | Shows better diagnostic efficacy (AUC >0.9) compared to raw reads and RPM [74] | |
| Rank-Based Indicators | Genus Rank | The relative abundance rank of a microbe's genus within the sample | Traditional metric; performance can be variable [74] |
| Genus Rank Ratio | Ratio of reads assigned to a specific genus to the total reads assigned to its parent taxonomic rank | Provides contextual abundance within a taxonomic framework [74] | |
| King Genus Rank Ratio | A specialized rank ratio metric | Serves as a component in more complex composite parameters [74] | |
| Composite Indicators | Genus Rank Ratio * Genus Rank | Product of Genus Rank Ratio and Genus Rank | Exhibits superior diagnostic efficiency compared to simpler read-count metrics [74] |
| King Genus Rank Ratio * Genus Rank | Product of King Genus Rank Ratio and Genus Rank | Another high-performance composite parameter for accurate pathogen identification [74] | |
| Genomic Coverage | Coverage | Percentage of the reference genome covered by sequencing reads | Can indicate completeness; however, its diagnostic AUC may be lower than other novel parameters [74] |
Performance Evaluation of Key Parameters
Research analyzing bronchoalveolar lavage fluid (BALF) samples for eight bacterial pathogens demonstrated that novel parameters significantly outperform traditional ones. The double-discard reads method and composite indicators like Genus Rank Ratio * Genus Rank achieved Area Under the Curve (AUC) values predominantly greater than 0.9, with corresponding sensitivity and specificity mostly exceeding 0.8 [74]. Furthermore, all evaluated parameters showed high negative predictive values (NPV > 0.9), making them particularly reliable for ruling out infections when results are negative [74].
Experimental Protocol: An NGS-Assisted Diagnostic Workflow for Bloodstream Infections
The following protocol, adapted from a clinical study on sepsis, outlines an end-to-end workflow for culture-independent pathogen detection and antimicrobial resistance prediction from whole blood.
Materials and Equipment
- Sample Type: Whole blood (20 mL collected in culture bottles)
- DNA Extraction Kit: MagMax Microbiome Ultra II kit (Applied Biosystems)
- Automated Extraction System: KingFisher (Thermo Fisher Scientific)
- Sequencing Technology: Oxford Nanopore GridION Mk1b
- Sequencing Kits: SQK-PRB114.24 for metagenomics; 16S rRNA amplification reagents
- Bioinformatics Tools: PISTE technology pipeline or similar for analysis [32] [3]
Step-by-Step Procedure
Sample Collection and Preparation:
- Collect blood using sterile technique into blood culture bottles (e.g., BACT/ALERT FA Plus) prior to antibiotic administration.
- Incubate culture bottles at 37°C for 6 hours in an automated system (e.g., BACT/ALERT VIRTUO).
- After incubation, aspirate a 0.5-5.5 mL aliquot under sterile conditions for NGS analysis. Centrifuge if necessary to pellet cellular material. Store samples at -80°C if not processed immediately [3].
Nucleic Acid Extraction:
- Use the MagMax kit on the KingFisher system for automated DNA extraction from 0.5 mL of processed sample. This ensures high yield and minimizes cross-contamination [3].
Library Preparation and Sequencing:
- For Full-Length 16S rRNA Gene Sequencing: Amplify the full-length 16S rRNA gene to enable precise taxonomic classification at the species level. This strategy allows for rapid pathogen identification (approx. 6 hours) [32] [3].
- For Metagenomic Analysis: Prepare a sequencing library directly from the extracted DNA using the SQK-PRB114.24 kit without amplification. This shotgun approach facilitates the detection of non-bacterial pathogens and antimicrobial resistance (AMR) genes [32] [3].
- Load the libraries onto the GridION Mk1b sequencer for real-time, high-throughput sequencing.
Bioinformatic Analysis:
- Data Processing: Base-calling and quality filtering of raw sequencing data.
- Taxonomic Assignment: For 16S data, compare sequences to curated databases (e.g., SILVA, Greengenes) using tools like DADA2 or Emu for high-resolution sample inference [32]. For metagenomic data, align non-host reads to comprehensive microbial genome databases.
- AMR Gene Detection: Use a dedicated pipeline, such as the NCBI's Pathogen Detection pipeline, which employs SAUTE and SKESA for guided and de novo assembly, followed by AMRFinderPlus to comprehensively catalog resistance genes [75].
- Quality Control: Apply robust validation rules, including duplication checks, foreign contamination screening (e.g., for phiX or adapters), and Average Nucleotide Identity (ANI) species checks to ensure assembly integrity and correct taxonomic assignment [75].
Diagram 1: NGS pathogen detection workflow from sample to report.
Performance Metrics
In a clinical validation study, this workflow demonstrated an overall accuracy of 95.7% compared to standard blood cultures, with a sensitivity of 91.7% and specificity of 96.5%. The median time to pathogen identification and AST prediction was 12 hours, significantly faster than the 30.4 hours required for standard culture [32].
Quality Control and Validation Frameworks
Rigorous quality control is indispensable for differentiating true signals from noise. The NCBI Pathogen Detection pipeline exemplifies a robust framework with multiple validation stages [75].
Table 2: Essential Quality Control Checks in Pathogen Detection Pipelines
| QC Stage | Check Type | Purpose | Outcome of Failure |
|---|---|---|---|
| Pre-Assembly | Duplication Check | Identifies and avoids re-processing identical sequence runs using checksums. | Prevents data redundancy and false positives from repeated submissions [75]. |
| Readset Validation | Checks reads for minimal length, coverage, and mate-pair consistency. | Prevents bad runs from proceeding to assembly and clustering [75]. | |
| Post-Assembly | Assembly Validation | Species-specific tests on the assembled genome for quality and completeness. | Assembly may be excluded from SNP clustering, AMR reporting, and GenBank submission [75]. |
| Foreign Contamination Check | Detects technical adapters, eukaryotic, viral, or phage DNA. | Assembly is reported as an exception but may still be used for clustering/AMR [75]. | |
| ANI Species Check | Verifies taxonomic identification via Average Nucleotide Identity. | Flags potential mis-identification [75]. | |
| Cluster Formation | wgMLST / k-mer Validation | Ensures sufficient core genome loci are found (wgMLST) or checks for contamination via "triangle inequality" of k-mer distances. | Prevents mis-identified or contaminated assemblies from being used in phylogenetic clusters [75]. |
Interpreting AMR Genotypes
The detection of antimicrobial resistance genes must be paired with an understanding of the genotype categories assigned by analysis tools like AMRFinderPlus. These categories indicate the confidence and nature of the gene detection, which is critical for accurate reporting [75].
- COMPLETE: Sequences with BLAST alignments covering ≥90% of the reference protein. This high-confidence category includes perfect allele matches (ALLELE/EXACT methods) and high-similarity matches (BLAST method) [75].
- PARTIAL: Sequences covering >50% but <90% of the reference, not at a contig boundary. Suggests a divergent gene or assembly issue.
- PARTIALENDOF_CONTIG: Partial alignments that end at a contig boundary, indicating the gene was likely split by a sequencing or assembly artifact [75].
- HMM: Proteins identified only by Hidden Markov Models, indicating distant homology to reference proteins without a confident BLAST hit.
- POINT: Mutations (e.g., R78Q) identified by BLAST that are associated with resistance [75].
Diagram 2: Decision logic for AMR genotype categorization.
The Scientist's Toolkit: Research Reagent Solutions
Table 3: Essential Reagents and Tools for Culture-Independent Pathogen Detection
| Item | Function/Application | Example Products/Technologies |
|---|---|---|
| Automated DNA Extraction System | Standardized purification of microbial nucleic acids from complex clinical samples, reducing contamination and improving yield. | KingFisher (Thermo Fisher Scientific), MagMax Microbiome Ultra II kit [3] |
| Long-Read Sequencer | Enables real-time sequencing and generation of long reads, which improves genome assembly and resolution of complex genomic regions. | Oxford Nanopore GridION Mk1b [32] [3] |
| Sequencing Kits | Library preparation for specific applications: metagenomics or targeted amplification. | SQK-PRB114.24 (Metagenomics), 16S rRNA PCR kits [32] |
| Bioinformatics Pipelines | For taxonomic assignment, AMR gene detection, assembly, and quality control. | PISTE, NCBI Pathogen Detection Pipeline, AMRFinderPlus [32] [75] |
| Human Fecal Markers (for WBS) | Normalization controls in wastewater-based surveillance to account for dilution from inflow/infiltration. | crAssphage, HF183, mitochondrial DNA (hCYTB484) [76] |
| Reference Databases | Curated collections of microbial genomes, genes, and marker sequences essential for accurate classification. | Pathogen Detection Reference Gene Catalog, AMRFinderPlus database, SILVA [75] |
Addressing Specificity Concerns and Avoiding False Positives in Clinical Reporting
The shift towards culture-independent diagnostic tests (CIDTs) for pathogen detection represents a significant advancement in clinical microbiology, offering rapid turnaround times and high sensitivity [77]. However, this transition brings forth considerable challenges in maintaining diagnostic specificity and mitigating false-positive results. These inaccuracies can trigger a cascade of negative outcomes, including unnecessary treatments, patient psychological distress, increased healthcare costs, and flawed public health decisions [78]. Within the broader thesis on culture-independent pathogen detection research, this application note addresses the critical need for robust protocols and analytical frameworks to safeguard the reliability of clinical reporting. We provide a detailed examination of specificity concerns, supported by quantitative data and actionable experimental protocols to enhance diagnostic accuracy.
Quantitative Data on Test Performance and False Positives
Understanding the performance characteristics of diagnostic tests is the first step in managing false positives. The following tables summarize key metrics and comparative performance data relevant to specificity.
Table 1: Key Performance Metrics for Diagnostic Tests [79]
| Metric | Definition | Formula | Impact of False Positives |
|---|---|---|---|
| Sensitivity | Ability to correctly identify diseased individuals (true positives). | True Positives / (True Positives + False Negatives) | Not directly affected. |
| Specificity | Ability to correctly identify healthy individuals (true negatives). | True Negatives / (True Negatives + False Positives) | Directly reduced by false positives. |
| Positive Predictive Value (PPV) | Proportion of positive tests that are true positives. | True Positives / (True Positives + False Positives) | Decreases as false positives increase. |
| Negative Predictive Value (NPV) | Proportion of negative tests that are true negatives. | True Negatives / (True Negatives + False Negatives) | Not directly affected. |
Table 2: Comparative Performance of Diagnostic Platforms for Enteric Pathogens [77]
This table summarizes a public health surveillance analysis comparing the BioFire FilmArray GI Panel to other CIDTs.
| Pathogen | Testing Platform | Percentage Positivity | Culture Confirmation Rate | Implication |
|---|---|---|---|---|
| Campylobacter | FilmArray GI Panel | Higher | 62% | Suggests potential false positives |
| Other CIDTs | Lower | 78% | Benchmark confirmation rate | |
| Salmonella | FilmArray GI Panel | Higher | No significant difference | Acceptable performance |
| Other CIDTs | Lower | No significant difference | Acceptable performance | |
| STEC | FilmArray GI Panel | Higher | No significant difference | Acceptable performance |
| Other CIDTs | Lower | No significant difference | Acceptable performance |
Table 3: Performance of NGS vs. Standard-of-Care in Sepsis [3]
| Parameter | PISTE NGS Workflow | Standard-of-Care (Culture) |
|---|---|---|
| Overall Accuracy | 95.7% | Reference |
| Sensitivity | 91.7% | Reference |
| Specificity | 96.5% | Reference |
| Positive Predictive Value (PPV) | 84.6% | Reference |
| Negative Predictive Value (NPV) | 98.2% | Reference |
| Median Time to Identification & AST | 12.0 hours | 30.4 hours |
Experimental Protocols for Investigating False Positives
Protocol 1: Public Health Surveillance for Platform Performance Monitoring
This protocol is based on the methodology used to identify potential false-positive Campylobacter results with the FilmArray GI panel [77].
- Objective: To evaluate the real-world specificity of a CIDT by comparing its results to culture confirmation across multiple testing sites over time.
- Materials:
- Clinical specimens (e.g., stool samples for GI panel testing).
- CIDT platform (e.g., BioFire FilmArray GI Panel).
- Culture equipment and media appropriate for the target pathogen(s).
- Procedure:
- Data Collection: Collect testing data from clinical laboratories over a defined period (e.g., several years). Stratify data by the CIDT platform used.
- Calculate Percent Positivity: For each target pathogen (e.g., Campylobacter, Salmonella, STEC), calculate the percentage of specimens testing positive on each CIDT platform.
- Culture Confirmation: Perform culture on all specimens positive for the target pathogen by any CIDT. Use standard microbiological methods.
- Analyze Culture Confirmation Rates: Calculate the percentage of CIDT-positive specimens that are confirmed by culture for each platform.
- Statistical Analysis: Compare the culture confirmation rates between different CIDT platforms using appropriate statistical tests (e.g., chi-square test). A significantly lower confirmation rate for a specific platform/pathogen pair suggests potential false positives.
- Supplementary Analysis: For platforms showing lower confirmation rates, perform secondary analyses such as:
- Transport Time Analysis: Correlate culture confirmation rates with specimen transport time to rule out culture failure due to delays.
- Melt Curve Analysis: Examine the melt curves of positive results on the CIDT. Atypical melt curves in samples that failed culture confirmation can provide technical evidence of non-specific detection [77].
Protocol 2: Bioinformatics Pipeline for Mitigating False Positives in Metagenomic Sequencing
This protocol outlines steps to optimize specificity in shotgun metagenomics for pathogen detection, addressing challenges highlighted in recent research [80].
- Objective: To configure a bioinformatics workflow that minimizes false-positive read classification while retaining high sensitivity for pathogen detection in complex metagenomic samples.
- Materials:
- Shotgun metagenomic sequencing data from clinical samples (e.g., whole blood, tissue).
- High-performance computing cluster.
- Taxonomic classification software (e.g., Kraken2).
- Custom database of species-specific regions (SSRs) for the target pathogen.
- Procedure:
- Read Classification with Adjustable Confidence:
- Process raw sequencing reads through a taxonomic classifier like Kraken2.
- Crucially, do not use the default confidence setting (0). Instead, run the classifier at multiple confidence levels (e.g., 0, 0.1, 0.25, 0.5, 0.75, 1.0). Higher confidence thresholds require more unique k-mer evidence for a classification, reducing false positives at the potential cost of sensitivity [80].
- Database Selection:
- Use a curated reference database that is appropriate for the sample type. The choice of database (e.g., standard, miniKraken, or custom-built) significantly impacts the precision-recall trade-off.
- SSR Confirmation Step:
- Extract all reads classified as the target pathogen (e.g., Salmonella genus) at a given confidence level.
- Align these putative pathogen reads to a database of pre-defined SSRs. These are genomic regions unique to the pathogen of interest, previously validated to be absent in other organisms [80].
- Retain only those reads that map reliably to an SSR.
- Threshold Determination and Final Call:
- Establish a minimum threshold of confirmed SSR reads for a sample to be considered positive. This threshold should be determined using validated positive and negative control samples.
- A sample is reported as positive only if the number of confirmed reads exceeds this threshold.
- Read Classification with Adjustable Confidence:
Visualization of Diagnostic and Bioinformatics Workflows
Diagnostic False-Positive Investigation Pathway
The following diagram outlines a systematic workflow for investigating potential false-positive results in a clinical laboratory setting, incorporating triggers and actions based on CDC recommendations and published findings [77] [81].
Specificity-Focused Metagenomic Analysis Workflow
This diagram details a bioinformatics pipeline designed to maximize specificity in pathogen detection from shotgun metagenomic sequencing data, using methods proven to reduce false positives [80].
The Scientist's Toolkit: Essential Reagents and Materials
Table 4: Key Research Reagent Solutions for Specificity Assurance
| Item | Function/Application in Specificity Assurance |
|---|---|
| Culture Media & Automation | Serves as the reference standard for confirmation of CIDT results. Automated incubators (e.g., BACT/ALERT VIRTUO) standardize growth conditions [3]. |
| Bioinformatic Databases | Curated genomic databases (e.g., RefSeq, custom pathogen-specific databases) are essential for accurate taxonomic classification. Database choice and quality directly impact false positive rates [80]. |
| Species-Specific Region (SSR) Panels | Pre-defined sets of unique genomic sequences for a pathogen. Used as a confirmatory step in bioinformatic pipelines to filter out falsely classified reads, dramatically increasing specificity [80]. |
| Synthetic Negative Controls | These controls contain no target pathogen and are processed alongside patient samples. They are critical for detecting background contamination or kit-derived false positives [78]. |
| External Quality Assurance (EQA) Panels | Commercially available panels of characterized samples provided by external agencies. They offer an independent assessment of laboratory testing accuracy and help identify systematic issues leading to false positives [78]. |
| Automated Nucleic Acid Extraction Systems | Reduce human error and cross-contamination during sample preparation, a common source of false-positive results. Examples include systems using KingFisher technology [3] [78]. |
Benchmarking Performance: Sensitivity, Specificity, and Clinical Concordance
In the field of clinical microbiology, the shift from traditional, culture-based pathogen identification to culture-independent diagnostic tests (CIDTs) represents a paradigm change. While techniques like multiplex nucleic acid amplification and metagenomic next-generation sequencing (mNGS) offer rapid, comprehensive pathogen detection, their performance is rigorously quantified against the established benchmark of culture [82]. This document details the application of culture as a reference standard, defining the key metrics of concordance, sensitivity, and specificity within the context of pathogen detection research. These principles are foundational for researchers and drug development professionals validating novel diagnostic platforms and interpreting their results in clinical and public health settings.
Key Metrics and Quantitative Performance
The evaluation of any new diagnostic method against a reference standard involves calculating core performance metrics. Sensitivity measures the test's ability to correctly identify true positives, while Specificity measures its ability to correctly identify true negatives. Concordance reflects the overall agreement between the new test and the reference method. Recent studies with mNGS powerfully illustrate these concepts in practice.
The table below summarizes quantitative data from recent clinical studies comparing mNGS with standard blood cultures in patients with suspected bloodstream infections or sepsis.
Table 1: Performance Metrics of mNGS vs. Blood Culture in Recent Studies
| Study Population | Sample Size | Positive Detection Rate (Culture) | Positive Detection Rate (mNGS) | Sensitivity | Specificity | Key Findings |
|---|---|---|---|---|---|---|
| Suspected Sepsis [3] | 71 (Sepsis-3 criteria) | Not Specified | Not Specified | 91.7% | 96.5% | Median time to identification & AST: 12.0 hrs (mNGS) vs. 30.4 hrs (culture). |
| Suspected Bloodstream Infection [83] | 99 | 13.13% (13/99) | 65.66% (65/99) | Not specified for direct comparison | Not specified for direct comparison | mNGS and culture agreed on bacteria/fungi in only 12.00% of positive results. |
| Kidney Transplant Patients [84] | 141 | 24.8% (35/141) (Organ fluid) | 47.5% (67/141) (Organ fluid) | Varied by pathogen type (see Section 2.2) | Not Specified | mNGS detected 79.2% of culture-positive Enterobacteriaceae but only 22.2% of Gram-positive bacteria. |
Analysis of Concordance and Detection Rates
A consistent theme across studies is the higher positive detection rate of mNGS compared to culture. In a study of 99 patients with suspected bloodstream infection, mNGS identified pathogenic microorganisms in 65.66% of cases, significantly higher than the 13.13% rate of blood culture [83]. Similarly, in kidney transplantation, mNGS detected potential pathogens in organ preservation fluid at nearly double the rate of culture (47.5% vs. 24.8%) [84]. However, this increased sensitivity can complicate the interpretation of concordance. The same study of bloodstream infection found that for bacteria and fungi, the concordance rate between mNGS and culture was only 12.00%, highlighting the challenge of distinguishing true pathogens from background nucleic acid or non-viable organisms [83].
Limitations of Culture as a Benchmark
While culture is the standard, its limitations are a critical part of defining new test performance. Culture-based methods can have low sensitivity, particularly when patients have received prior antibiotic therapy, or for fastidious, slow-growing, or unculturable pathogens [3] [83]. This means a culture result can be a false negative, which in turn causes the sensitivity of the new CIDT to be underestimated. Furthermore, some pathogens detected by mNGS, such as Mycobacterium, Clostridium tetani, and parasites, may not be recoverable by routine culture at all [84]. In these cases, the "culture-independent" test is not just an alternative but the primary diagnostic tool, and its results must be adjudicated using clinical correlation or other non-culture standards.
Experimental Protocols
Protocol: Conventional Blood Culture and Antimicrobial Susceptibility Testing (AST)
This protocol outlines the standard-of-care method for pathogen identification and AST from blood samples, serving as the reference against which CIDTs are validated [3].
I. Principle: Microorganisms present in a blood sample are amplified in nutrient-rich broth under controlled conditions. Following growth detection, organisms are isolated for species identification and tested for susceptibility to antimicrobial agents.
II. Materials and Reagents:
- BD BACTEC Plus Aerobic/F Culture Vials or BACT/ALERT FA Plus Culture Bottles
- Automated Blood Culture Incubator (e.g., BD BACTEC FX or bioMérieux VIRTUO)
- Columbia Sheep Blood Agar Plates
- Automated Identification & AST System (e.g., BD Phoenix M50)
- Identification Panels (e.g., BD Phoenix PMIC/ID-88)
- AST Panels (e.g., BD Phoenix NMIC/ID-503)
III. Procedure:
- Sample Collection & Inoculation: Aseptically collect 20-30 mL of blood from the patient and inoculate 5-10 mL into each aerobic and anaerobic culture vial [83].
- Incubation: Load culture vials into an automated incubator at 37°C. The system continuously monitors for microbial growth (production of CO₂).
- Time to Positivity (TTP): Record the time from incubation start until the system flags the vial as positive.
- Subculturing: Upon positivity, aspirate broth and subculture onto Columbia Sheep Blood Agar plates. Incubate plates at 37°C for 18-24 hours.
- Species Identification: Harvest pure colonies from the subculture plate. Use an automated system like MALDI-TOF MS or the BD Phoenix system for identification [84] [3].
- Antimicrobial Susceptibility Testing (AST): Prepare a standardized inoculum from pure colonies and load into the AST panel. The automated system incubates the panel and determines the Minimum Inhibitory Concentration (MIC) and susceptibility category (S/I/R). Typical turnaround time for identification and AST is 16-48 hours after a vial turns positive [3].
Protocol: Metagenomic Next-Generation Sequencing (mNGS) from Whole Blood
This protocol describes a culture-independent workflow for comprehensive pathogen detection and resistance gene profiling directly from blood, as used in recent sepsis studies [3] [83].
I. Principle: Cell-free and microbial DNA is extracted directly from blood or incubated culture broth, converted into sequencing libraries, and sequenced on a high-throughput platform. Bioinformatic analysis identifies pathogen sequences and antimicrobial resistance (AMR) genes.
II. Materials and Reagents:
- DNA Extraction Kit: MagMax Microbiome Ultra II kit or QIAamp DNA Micro Kit.
- Library Preparation Kit: Depends on platform (e.g., SQK-PRB114.24 for Oxford Nanopore).
- Sequencing Platform: Oxford Nanopore GridION Mk1b or Illumina NextSeq 550.
- Bioinformatics Server with analysis pipeline.
III. Procedure:
- Sample Preparation: Collect 6-10 mL of whole blood. For a hybrid approach, incubate blood culture bottles for 6 hours, then aliquot 0.5-5.5 mL of broth for DNA extraction [3] [83].
- DNA Extraction: Extract total DNA using a commercial kit according to the manufacturer's instructions. This includes steps for cell lysis, DNA binding, washing, and elution.
- Library Preparation: The extracted DNA is processed for sequencing. This involves:
- DNA Fragmentation (if required by the platform).
- Adapter Ligation: Attaching platform-specific oligonucleotide adapters to DNA fragments.
- Library Quality Control: Assess DNA concentration and library size distribution using systems like Qubit and Agilent 2100 Bioanalyzer.
- Sequencing: Load the qualified library onto the sequencer (e.g., Oxford Nanopore GridION or Illumina NextSeq). Real-time sequencing is performed.
- Bioinformatic Analysis:
- Quality Control & Host Depletion: Raw reads are filtered for low quality and aligned to the human reference genome (e.g., hg38) for removal.
- Pathogen Identification: Non-host reads are aligned to comprehensive microbial genome databases. Positive detection criteria are applied (e.g., microbe's coverage ranks in the top 10 for its kind, or RPMsample/RPMNTC > 10) [83].
- AMR Gene Detection: Reads are aligned against a database of known antimicrobial resistance genes.
- Turnaround Time: The entire mNGS workflow, from sample to result, can be completed in approximately 12 hours [3].
Diagram 1: Culture-based Pathogen ID & AST Workflow
Diagram 2: Culture-independent mNGS Workflow
The Scientist's Toolkit: Essential Research Reagents and Materials
The following table catalogues key reagents, kits, and instruments essential for executing the culture and mNGS protocols described in this document.
Table 2: Key Research Reagents and Solutions for Pathogen Detection
| Item Name | Function/Application | Specific Example(s) |
|---|---|---|
| Blood Culture Bottles | Enrichment of microorganisms from blood samples for culture. | BACTEC Plus Aerobic/F [83], BACT/ALERT FA Plus [3] |
| Automated Blood Culture System | Automated incubation and continuous monitoring of culture bottles for growth. | BD BACTEC FX [83], bioMérieux VIRTUO [3] |
| Nucleic Acid Extraction Kit | Isolation of high-quality microbial and host DNA from complex clinical samples. | MagMax Microbiome Ultra II kit [3], QIAamp DNA Micro Kit [83] |
| Sequencing Library Prep Kit | Preparation of DNA fragments for sequencing by fragmentation, end-repair, and adapter ligation. | SQK-PRB114.24 (Oxford Nanopore) [3], QIAseq Ultralow Input Library Kit (Illumina) [83] |
| High-Throughput Sequencer | Platform for performing massively parallel DNA sequencing. | Oxford Nanopore GridION Mk1b [3], Illumina NextSeq 550 [83] |
| Automated ID/AST System | Automated phenotypic identification and antimicrobial susceptibility testing of bacterial isolates. | BD Phoenix M50 System [3] |
| MALDI-TOF Mass Spectrometer | Rapid identification of microorganisms from pure colonies using protein mass fingerprinting. | Bruker MALDI-TOF MS [84] |
Culture-independent diagnostic methods have transformed the landscape of clinical microbiology, offering powerful alternatives to traditional culture for pathogen detection. Within this paradigm, metagenomic next-generation sequencing (mNGS) and 16S ribosomal RNA gene next-generation sequencing (16S rRNA NGS) represent two transformative technologies with distinct advantages and limitations. This Application Note provides a structured comparison of these methods against the historical gold standard of culture, focusing on their application in body fluid analysis. We present quantitative performance data, detailed experimental protocols, and practical workflow visualizations to guide researchers and drug development professionals in selecting appropriate methodologies for specific diagnostic scenarios.
Performance Comparison: Quantitative Data Analysis
The table below summarizes key performance metrics from recent clinical studies comparing mNGS, 16S rRNA NGS, and culture methods in body fluid specimens.
Table 1: Comparative Performance of Pathogen Detection Methods in Body Fluids
| Performance Measure | Culture | 16S rRNA NGS | mNGS (Whole-Cell DNA) | mNGS (Cell-Free DNA) | Notes |
|---|---|---|---|---|---|
| Overall Sensitivity | 42% [85] | 53% [85] | 74.07% [44] | 62.07% (for BSI) [86] | Sensitivity varies significantly by specimen type and pathogen. |
| Specificity | High (reference) | Not fully quantified | 56.34% [44] | 57.14% (for BSI) [86] | mNGS may detect non-viable or contaminant DNA, reducing specificity. |
| Polymicrobial Detection | Limited | Excellent [85] | Excellent [44] | Excellent [44] | Culture struggles with mixed infections. |
| Impact of Prior Antibiotics | Significant reduction [87] [85] | Minimal impact [87] [85] | Moderate impact | Moderate impact | 16S NGS maintains 63% sensitivity in antibiotic-treated patients vs. 41% for culture [85]. |
| Concordance with Culture | Reference | 58.54% [44] | 70.7% (bacterial) [44] | 46.67% [44] | wcDNA mNGS shows higher consistency than cfDNA mNGS. |
| Detects Viruses/Fungi | No (specialized) | No (bacteria only) | Yes | Yes | mNGS offers a universal pathogen detection approach. |
Table 2: Advantages and Limitations of Each Method
| Method | Key Advantages | Major Limitations |
|---|---|---|
| Culture | Gold standard; allows antibiotic susceptibility testing; low cost. | Long turnaround (2-5 days); low sensitivity for fastidious organisms; severely impacted by antibiotics. |
| 16S rRNA NGS | High sensitivity; identifies non-culturable bacteria; excellent for polymicrobial infections; less affected by antibiotics. | Limited to bacteria; requires careful contamination control; complex bioinformatics. |
| mNGS (wcDNA) | Unbiased detection of all pathogen types (bacteria, viruses, fungi, parasites); high sensitivity. | High host DNA interference; costly; complex data analysis; requires specialized expertise. |
| mNGS (cfDNA) | Reduced host DNA background (in plasma); good for detecting viruses and intracellular pathogens [88]. | May miss some pathogens; potentially lower bacterial detection sensitivity [44]. |
Experimental Protocols for Method Comparison
Sample Processing and DNA Extraction
The initial handling of body fluid samples critically impacts downstream sequencing success, particularly regarding host nucleic acid content.
- Sample Collection: Collect sterile body fluids (e.g., cerebrospinal fluid, pleural fluid, synovial fluid) in appropriate sterile containers [44].
- Centrifugation: For separating whole-cell DNA (wcDNA) and cell-free DNA (cfDNA) fractions, centrifuge samples at 20,000 × g for 15 minutes [44]. The pellet contains microbial cells and human cells, while the supernatant contains cfDNA.
- wcDNA Extraction: Resuspend the pellet and use mechanical lysis with bead beating (e.g., using 3-mm nickel beads shaken at 3,000 rpm for 5 minutes). Extract DNA from the lysate using commercial kits such as the Qiagen DNA Mini Kit [44].
- cfDNA Extraction: Extract DNA from 400 μL of supernatant using a specialized cfDNA kit, such as the VAHTS Free-Circulating DNA Maxi Kit, which typically involves proteinase K treatment, binding to magnetic beads, washing, and elution [44].
Library Preparation and Sequencing
16S rRNA NGS Library Preparation:
- Target Amplification: Amplify the hypervariable regions (e.g., V3-V4) of the bacterial 16S rRNA gene using universal primers (341F and 806R) with adapters [44] [86].
- Sequencing: Perform sequencing on an Illumina NovaSeq platform with a 2×250 paired-end configuration, generating approximately 50,000 reads per sample [44].
mNGS Library Preparation:
- DNA Fragmentation: Randomly fragment DNA to an average size of 300-350 bp using mechanical shearing (e.g., Covaris S220) [86]. For RNA viruses, include a reverse transcription step to generate cDNA [86].
- Library Construction: Use a universal library prep kit such as the VAHTS Universal Pro DNA Library Prep Kit for Illumina. The process includes end repair, adapter ligation, purification, and PCR amplification [44] [86].
- Sequencing: Sequence on an Illumina NovaSeq platform with a 2×150 paired-end configuration, generating approximately 20-30 million reads per sample (∼8 GB of data) [44].
Bioinformatic Analysis
16S rRNA NGS Analysis: Process data using pipelines like QIIME2 or Mothur. Cluster sequences into Operational Taxonomic Units (OTUs) at a 97% identity threshold. Classify taxonomy by comparing to reference databases (e.g., SILVA, Greengenes). For species-level identification, manually align ambiguous sequences using NCBI BLAST [44] [87].
mNGS Analysis:
- Quality Control: Remove low-quality reads, adapter sequences, and duplicates using tools like Fastp [86].
- Host Depletion: Map reads to the human reference genome (hg38/hg19) using BWA or Bowtie2 and remove aligning reads [83].
- Pathogen Identification: Align non-host reads to comprehensive microbial genome databases (NCBI, RefSeq) using specialized classifiers. Report pathogens meeting validated thresholds (e.g., reads >100 for bacteria, z-score >3 compared to negative controls) [44].
Workflow Visualization
The following diagram illustrates the parallel and integrated workflows for culture, 16S rRNA NGS, and mNGS diagnostics, highlighting critical decision points and methodological distinctions.
The Scientist's Toolkit: Essential Research Reagents
Successful implementation of these molecular methods requires specific reagent systems and computational tools, as detailed in the table below.
Table 3: Essential Reagents and Tools for Sequencing-Based Pathogen Detection
| Category | Specific Product/Platform | Application & Function |
|---|---|---|
| Nucleic Acid Extraction | Qiagen DNA Mini Kit [44] | Extraction of high-quality whole-cell DNA from pellets. |
| VAHTS Free-Circulating DNA Maxi Kit [44] | Specialized extraction of cell-free DNA from supernatants. | |
| Library Preparation | VAHTS Universal Pro DNA Library Prep Kit [44] [86] | Construction of sequencing libraries for Illumina platforms. |
| Primers 341F/806R [86] | Amplification of V3-V4 hypervariable region of 16S rRNA gene. | |
| Sequencing Platforms | Illumina NovaSeq [44] [86] | High-throughput sequencing for both mNGS and 16S NGS. |
| Ion PGM Platform [87] | Alternative sequencing platform for 16S rRNA NGS. | |
| Bioinformatic Tools | Fastp [86] | Quality control and preprocessing of raw sequencing data. |
| BWA/Bowtie2 [83] | Alignment to reference genomes for host DNA depletion. | |
| Pavian [44] | Statistical analysis and reporting of pathogen detection. | |
| RipSeq NGS [85] | Analysis and interpretation of 16S rRNA NGS data. | |
| Reference Databases | NCBI RefSeq [83] | Comprehensive microbial genome database for mNGS. |
| SILVA/Greengenes [87] | Curated 16S rRNA databases for taxonomic classification. |
The integration of mNGS and 16S rRNA NGS into the diagnostic workflow for body fluid analysis represents a significant advancement over traditional culture. While mNGS offers the broadest pathogen detection capability, 16S rRNA NGS provides a highly sensitive, cost-effective alternative for bacterial identification, particularly in culture-negative cases. The choice between methods should be guided by clinical context, required turnaround time, budgetary constraints, and available expertise. As these technologies continue to evolve and become more accessible, they promise to enhance precision medicine approaches in infectious disease management and drug development.
Performance Evaluation of Commercial Bloodstream Infection Panels
Bloodstream infections (BSIs) and sepsis remain major global health challenges, responsible for significant morbidity and mortality worldwide. Conventional blood culture, while considered the historical gold standard, requires 2-5 days for pathogen identification and additional time for antimicrobial susceptibility testing, creating critical delays in appropriate therapeutic intervention [89]. Molecular rapid diagnostic assays have emerged as transformative technologies that can dramatically shorten turnaround time to just 1-3 hours after blood culture positivity, enabling earlier targeted antimicrobial therapy [89] [90]. This application note provides a comprehensive performance evaluation of commercially available bloodstream infection panels, detailing their analytical characteristics, clinical utility, and implementation protocols within the broader context of culture-independent pathogen detection research.
Performance Comparison of Commercial BSIPs
Table 1: Analytical Performance of Commercial Bloodstream Infection Panels
| Platform | Target Coverage | Turnaround Time | Sensitivity Range | Specificity Range | Resistance Genes Detected |
|---|---|---|---|---|---|
| BioFire FilmArray BCID | 27 targets: 8 Gram+, 11 Gram-, 5 Yeast, 3 resistance genes | ~1 hour | 97.3-100% [91] | 99.8-100% [91] | mecA, vanA/B, blaKPC |
| Luminex Verigene (BC-GP) | 13 targets: 9 species, 4 genera, 3 resistance genes | ~2.5 hours | 92-95.6% [91] | >99.5% [91] | mecA, vanA, vanB |
| Luminex Verigene (BC-GN) | 15 targets: 9 species, 6 genera, 6 resistance genes | ~2.5 hours | 90-99% [91] | >99.5% [91] | CTX-M, IMP, KPC, NDM, OXA-48-like, VIM |
| GenMark ePlex BCID | 66 targets: 56 pathogens, 10 resistance genes | ~1.5 hours | 96-100% [90] | >99% [90] | mecA, mecC, vanA, vanB, CTX-M, KPC, NDM, IMP, VIM, OXA |
Table 2: Clinical Impact Assessment of Rapid BSIP Implementation
| Parameter | Pre-Implementation (Culture) | Post-Implementation (Molecular) | Relative Improvement |
|---|---|---|---|
| Time to Effective Therapy | 48-72 hours [92] | 18-24 hours [89] | ~60% reduction |
| Time to De-escalation | 3-5 days [90] | 1-2 days [90] | ~50% reduction |
| Mortality Rate | 20-40% [89] [90] | 15-25% [89] | 25-40% relative reduction |
| Length of Stay | 7-14 days [91] | 5-9 days [91] | 2-5 day reduction |
Experimental Protocols for BSIP Evaluation
Sample Processing and Testing Workflow
Principle: This protocol outlines the standard procedure for evaluating commercial bloodstream infection panels using positive blood culture bottles identified by continuous monitoring systems [90].
Materials:
- Positive blood culture bottles (BD Bactec, BacT/ALERT)
- Commercial BSIP kits (FilmArray, Verigene, or ePlex)
- Sample extraction reagents and disposables
- Molecular biology grade water
- Personal protective equipment
Procedure:
- Gram Stain Confirmation: Perform Gram staining on positive blood cultures to confirm microbial presence and morphology [90].
- Sample Aliquoting: Aseptically withdraw 100-500 μL from positive blood culture bottles depending on manufacturer specifications.
- Sample Loading: Transfer aliquot to BSIP test cartridge or extraction tube according to manufacturer instructions.
- Instrument Operation: Load cartridge onto appropriate platform (FilmArray, Verigene, or ePlex systems) and initiate test run.
- Result Interpretation: Review automatically generated results for pathogen identification and resistance marker detection.
Quality Control:
- Include manufacturer-provided positive and negative controls with each batch.
- Verify results concordance between molecular detection and standard culture methods.
- Document any discrepancies for further analysis.
Method Comparison Protocol
Principle: This protocol validates BSIP performance against reference standard methods including conventional culture, MALDI-TOF MS identification, and phenotypic susceptibility testing [92].
Materials:
- Paired blood samples from patients with suspected BSIs
- Blood culture bottles (aerobic and anaerobic)
- Culture media (blood agar, chocolate agar, MacConkey agar)
- MALDI-TOF MS system
- Automated susceptibility testing system
Procedure:
- Sample Collection: Collect paired blood samples simultaneously for molecular testing and culture.
- Parallel Processing: Inoculate blood culture bottles and process samples for molecular testing concurrently.
- Reference Identification: Subculture positive blood cultures and identify isolates using MALDI-TOF MS.
- Susceptibility Testing: Perform automated or manual antimicrobial susceptibility testing on all isolates.
- Data Analysis: Compare identification results between molecular and culture methods.
- Discrepancy Resolution: Use expanded molecular testing or sequencing to resolve discordant results.
Molecular Detection Technologies
Commercial BSIPs employ various core technologies for pathogen nucleic acid detection:
Multiplex PCR with Microarray Detection (FilmArray): Utilizes nested PCR amplification followed by endpoint melt curve analysis on a microarray for amplicon detection, enabling multiplexing of 27 targets in a single reaction [91].
Gold Nanoparticle Probe Technology (Verigene): Employs functionalized gold nanoparticles conjugated with oligonucleotides specific for DNA/RNA targets, providing enhanced signal-to-noise ratio through silver staining amplification [89].
Electronic Microarray Detection (ePlex): Uses competitive DNA hybridization and electrochemical detection on a custom microarray, allowing random access testing with minimal hands-on time [90].
The Scientist's Toolkit: Research Reagent Solutions
Table 3: Essential Research Reagents for Bloodstream Pathogen Detection
| Reagent/Material | Function | Application Example |
|---|---|---|
| Nucleic Acid Extraction Kits | Isolation of pathogen DNA/RNA from blood cultures | Automated extraction from positive blood cultures [92] |
| Multiplex PCR Master Mixes | Simultaneous amplification of multiple pathogen targets | FilmArray nested PCR reactions [91] |
| Gold Nanoparticle Probes | Specific target hybridization and signal generation | Verigene microarray detection [89] |
| Microarray Substrates | Solid support for nucleic acid hybridization | ePlex electrochemical detection system [90] |
| Positive Control Panels | Quality assurance of assay performance | Verification of detection limits and specificity [91] |
| Blood Culture Media | Enrichment of pathogens from blood specimens | BD Bactec, BacT/ALERT systems [90] [92] |
Workflow and Decision Pathway Diagrams
BSI Diagnostic Workflow
Therapeutic Decision Pathway
Commercial bloodstream infection panels represent significant advancements in molecular diagnostics, offering rapid turnaround times, high sensitivity and specificity, and detection of critical resistance markers. When integrated with antimicrobial stewardship programs, these panels facilitate earlier appropriate therapy, reduce unnecessary antibiotic exposure, and improve patient outcomes. The continuous evolution of culture-independent pathogen detection technologies promises further enhancements in diagnostic accuracy, throughput, and comprehensive resistance profiling to address the ongoing challenge of antimicrobial resistance.
Conventional culture-based methods, long considered the gold standard in clinical microbiology, struggle to provide a comprehensive picture in polymicrobial infections (PMIs). It is estimated that 20–50% of severe clinical infections are polymicrobial, a figure that rises to 60–80% for biofilm-associated and device-related infections in hospitalized patients [93]. These complex infections are associated with a 2- to 3-fold increase in mortality risk and extended hospital stays compared to their monomicrobial counterparts [94]. The diagnostic bottleneck lies in the nature of culture itself, which often favors fast-growing, dominant microbes while missing slow-growing, fastidious, anaerobic, or non-cultivatable pathogens [94] [93]. This diagnostic shortfall can lead to inadequate antimicrobial therapy, with studies showing that treatments are insufficient in approximately two out of every three cases of polymicrobial bloodstream infections [94].
The emergence of culture-independent molecular techniques is transforming our ability to diagnose these complex infections. This application note presents detailed case studies and protocols showcasing how advanced molecular methods are uncovering culture-missed pathogens and providing a more accurate representation of polymicrobial disease states, thereby enabling more targeted and effective therapeutic interventions.
Case Study: NGS-Assisted Diagnosis of Sepsis (PISTE Workflow)
Background and Objective
Sepsis is a life-threatening medical emergency where every hour delay in appropriate antibiotic treatment decreases survival by 7.6% [94]. Conventional blood cultures, the standard of care (SoC), require 2–5 days for pathogen identification and antimicrobial susceptibility testing (AST), and their sensitivity is compromised by prior antibiotic administration [94] [3]. This multicenter, prospective study evaluated the PISTE (Pathogen Identification and quantification Sequencing Technology) workflow, an NGS-based approach, for the rapid and culture-independent detection of bloodstream pathogens and prediction of antimicrobial resistance in patients with suspected sepsis [3].
Experimental Protocol
Study Design and Sample Collection
- Patient Cohort: 100 adult patients with suspected sepsis were enrolled from four hospitals. Of these, 71 met the Sepsis-3 criteria [3].
- Sample Collection: For each patient, 20 mL of whole blood was drawn before the administration of antibiotics and inoculated into blood culture flasks [3].
- Sample Processing for NGS: After 6 hours of incubation, a 5.5 mL aliquot was removed from the culture flask under sterile conditions and stored at -80°C for subsequent NGS analysis [3]. The remaining culture was continuously monitored for microbial growth per SoC protocol.
Standard-of-Care (SoC) Workflow
- Blood culture flasks were incubated in an automated system until positivity.
- Upon growth detection, samples were subcultured.
- Pathogen identification and AST were performed using the BD Phoenix M50 Automated Microbiology System [3].
PISTE NGS Workflow
The following diagram illustrates the integrated NGS-assisted diagnostic workflow:
Figure 1: NGS-Assisted Diagnostic Workflow for Sepsis (PISTE). The workflow integrates a short culture step with parallel sequencing strategies for comprehensive pathogen identification and resistance profiling.
- Step 1: DNA Extraction. Total DNA was automatically purified from 0.5 mL of whole blood using the MagMax Microbiome Ultra II kit on a KingFisher system [3].
- Step 2: Library Preparation and Sequencing. Two parallel sequencing strategies were employed:
- Full-length 16S rRNA Gene Sequencing: For rapid and accurate bacterial identification to the species level (~6 hours) [3].
- Metagenomic Sequencing: Using Oxford Nanopore Technologies' SQK-PRB114.24 kit and GridION Mk1b device for unbiased detection of all microbial DNA and antimicrobial resistance (AMR) genes [3].
- Step 3: Bioinformatic Analysis. A dedicated computational pipeline was used for pathogen detection and AST profile prediction based on identified AMR genes.
Key Results and Performance Metrics
The PISTE workflow demonstrated superior performance compared to the standard of care, with significantly faster turnaround times.
Table 1: Diagnostic Performance of PISTE NGS Workflow vs. Standard-of-Care Blood Cultures
| Metric | PISTE NGS Workflow | Standard-of-Care Culture |
|---|---|---|
| Overall Accuracy | 95.7% | (Reference) |
| Sensitivity | 91.7% | (Reference) |
| Specificity | 96.5% | (Reference) |
| Positive Predictive Value (PPV) | 84.6% | (Reference) |
| Negative Predictive Value (NPV) | 98.2% | (Reference) |
| Median Time to Pathogen ID & AST | 12.0 hours | 30.4 hours |
The resistance gene profiles generated by the PISTE workflow showed strong agreement with SoC AST results, particularly for β-lactam and carbapenem resistance [3].
Case Study: A Multi-Scale Modeling Framework for Pathogen Detection
Background and Objective
Low-level pathogen detections in quantitative real-time PCR (qPCR) are often classified as "inconclusive" and excluded from analyses, potentially leading to missed early infections. This case study presents a novel multi-scale dynamic occupancy hurdle model (MS-DOHM) that utilizes qPCR cycle threshold (Ct) values not just for detection, but also to estimate pathogen prevalence and load, thereby overcoming the limitations of traditional binary detection frameworks [95].
Experimental Protocol
Field Sampling for White-Nose Syndrome
- Pathogen: Pseudogymnoascus destructans (Pd), a fungal pathogen.
- Host: Little brown bats (Myotis lucifugus).
- Method: Bats in 42 hibernation sites were swabbed on the forearm and muzzle. Swabs were stored in RNAlater until DNA extraction and qPCR analysis [95].
qPCR Analysis
- Each swab was run in duplicate or triplicate via qPCR.
- A sample was considered positive if at least one run had a Ct value ≤ 40.
- Pathogen load was estimated from the Ct value using a standard quantification curve [95].
Statistical Modeling: The MS-DOHM Framework
The model operates at three hierarchical levels:
- Site Occupancy (ψ): The probability that a hibernaculum is occupied by Pd.
- Pathogen Prevalence (θ): The probability that an individual bat in an occupied site is infected.
- Pathogen Load (λ): The expected pathogen load on a swab from an infected bat.
This model incorporates detection probability, allowing it to distinguish between a true negative and a false negative, which is a critical advancement over naive methods that treat low-level positives as "inconclusive" [95].
Key Results and Performance Metrics
The MS-DOHM framework provided a more sensitive and nuanced understanding of pathogen dynamics than conventional methods.
Table 2: Comparison of Pathogen Detection and Estimation Methods
| Metric | Naïve Detection | Dynamic Occupancy Model | MS-DOHM Framework |
|---|---|---|---|
| Estimated Site-Level Pathogen Presence | (Baseline) | Up to 11.9% higher than Naïve | Up to 35.7% higher than Naïve |
| Estimation of Pathogen Arrival | (Baseline) | 2 years earlier than Naïve | 3 years earlier than Naïve |
| Information on Pathogen Load | No | No | Yes |
| Ability to Model Prevalence | No | No | Yes |
This model demonstrated that accounting for pathogen load and prevalence resulted in a better-fitting model with greater predictive ability, allowing for earlier conservation intervention [95].
The Scientist's Toolkit: Essential Research Reagent Solutions
The following table details key reagents and kits used in the featured NGS case study, which are essential for replicating this culture-independent workflow.
Table 3: Key Research Reagent Solutions for NGS-Based Pathogen Detection
| Item Name | Function/Application | Specific Use Case in Protocol |
|---|---|---|
| MagMax Microbiome Ultra II Kit | Automated nucleic acid extraction & purification | Isolation of total DNA from 0.5 mL of whole blood post-culture incubation [3]. |
| Oxford Nanopore Technologies SQK-PRB114.24 | Library preparation kit for metagenomic sequencing | Prepared sequencing libraries for unbiased detection of all microbial DNA and AMR genes [3]. |
| BACT/ALERT FA Plus Culture Flask | Growth medium for blood culture | Standardized sample collection and initial incubation of whole blood samples [3]. |
| BD Phoenix ID Broth & AST Panels | Microbial identification & antimicrobial susceptibility testing | Provided comparator identification and AST results for the standard-of-care arm [3]. |
The presented case studies underscore a paradigm shift in clinical microbiology diagnostics. The application of NGS and advanced statistical modeling moves beyond the limitations of traditional cultures, offering a powerful strategy to uncover the true complexity of polymicrobial infections. The PISTE workflow demonstrates that a culture-assisted NGS approach can deliver comprehensive pathogen identification and resistance profiling in ~12 hours, a critical improvement for life-threatening conditions like sepsis. Simultaneously, the MS-DOHM framework shows how leveraging quantitative data from qPCR can provide earlier detection and a more robust understanding of pathogen dynamics. Together, these culture-independent methods provide researchers and clinicians with the tools necessary to make more informed decisions, ultimately guiding targeted therapies and improving patient outcomes in the face of complex polymicrobial diseases.
Correlating Culture-Independent Microbial Load with Quantitative Culture Results
The accurate quantification of microbial load is a cornerstone of clinical microbiology, environmental monitoring, and public health surveillance. For over a century, quantitative culture has served as the reference standard, providing viable colony-forming unit (CFU) counts that inform critical decisions in disease diagnosis and treatment [96]. However, the well-documented limitations of culture-based methods—including prolonged turnaround times (often 24-72 hours), an intrinsic bias against uncultivable organisms, and low sensitivity in samples with low bacterial burden—have driven the development of culture-independent molecular techniques [73] [97].
These advanced methods, particularly those based on the detection and sequencing of the 16S ribosomal RNA (rRNA) gene, have revealed a vast and previously uncharacterized microbial diversity [73]. They have proven invaluable for pathogen discovery and for analyzing complex microbial communities, or microbiomes, in various habitats [73]. Despite their increasing adoption, a significant challenge remains: bridging the gap between the quantitative data generated by traditional culture (CFU/ml) and the quantitative or semi-quantitative data outputs of molecular methods (e.g., genome copies/ml, relative abundance, or sequencing read counts) [97]. Establishing a robust correlation is essential for validating molecular assays, defining clinical thresholds, and integrating new technologies into diagnostic and public health frameworks.
This Application Note synthesizes recent evidence and provides detailed protocols for performing parallel measurements of microbial load, aiming to standardize the correlation between culture-independent results and quantitative culture.
Synthesized Quantitative Data from Comparative Studies
Comparative studies across clinical and environmental samples consistently demonstrate that culture-independent methods detect a greater microbial diversity and, in many cases, a higher prevalence of bacteria than culture-based methods.
Table 1: Summary of Comparative Performance in Clinical Specimens
| Sample Type | Culture-Independent Method | Key Finding | Correlation with Culture | Reference |
|---|---|---|---|---|
| Bronchoalveolar Lavage (BAL) | 16S rRNA Pyrosequencing & qPCR | Bacteria detected in 95.7% (44/46) of specimens vs. 80.4% (37/46) by culture. | Culture positivity correlated with higher bacterial DNA burden (qPCR) and lower community diversity. | [97] |
| Blood (Sepsis) | PISTE (NGS-based workflow) | Overall accuracy of 95.7%, sensitivity of 91.7%, specificity of 96.5%. | High concordance with standard-of-care culture; significantly faster time-to-result (12.0h vs 30.4h). | [98] |
| Blood (Sepsis) | Tm Mapping Method & qPCR | Enabled identification and quantification of unknown bacteria directly from blood. | Quantification results were adjusted based on 16S rRNA operon copy number for accurate correlation. | [99] |
| Industrial Water | Next-Generation Sequencing (NGS) | NGS identified taxa in BART test tubes; population profiles sometimes differed from source water. | Showed general agreement but highlighted that culture-dependent tests may not fully represent original sample diversity. | [100] |
Table 2: Technical Comparison of Quantitative Methods
| Method | Target | Output Metric | Key Advantages | Key Limitations |
|---|---|---|---|---|
| Quantitative Culture | Viable cells | Colony Forming Units (CFU)/mL | Gold standard for viability; allows for antibiotic susceptibility testing (AST). | Long turnaround time; cannot detect viable but non-culturable (VBNC) or fastidious bacteria. |
| qPCR / ddPCR | Specific gene or 16S rRNA | Gene Copies/mL | High sensitivity and specificity; rapid turnaround (hours). | Requires pathogen identity for specific assays; universal primers may be affected by contaminating bacterial DNA. |
| 16S rRNA Sequencing | 16S rRNA Gene | Relative Abundance / Operational Taxonomic Units (OTUs) | Comprehensive, unbiased community profiling; identifies unculturable bacteria. | Semi-quantitative without normalization; result is relative, not absolute abundance. |
| Metagenomic NGS | All Genomic DNA | Absolute or Relative Read Counts | Provides species-level resolution and detects antimicrobial resistance genes. | Complex data analysis; high cost; requires careful calibration for absolute quantification. |
Detailed Experimental Protocols
Below are standardized protocols for conducting correlated analyses of microbial load using both culture-dependent and culture-independent methods.
Protocol 1: Parallel Analysis from Whole Blood for Sepsis Diagnosis
This protocol is adapted from a study demonstrating high diagnostic concordance between NGS and blood culture [98].
A. Sample Collection and Pre-processing
- Collect whole blood (e.g., 20 mL) in appropriate blood culture bottles (e.g., BACT/ALERT FA Plus) prior to antibiotic administration.
- Incubate the blood culture bottle at 37°C in an automated system (e.g., BACT/ALERT VIRTUO).
- After a short incubation period (e.g., 6 hours), aseptically remove a 5.5 mL aliquot for culture-independent analysis. The remaining volume continues incubation for standard culture.
B. Standard-of-Care Culture and Identification
- Monitor the blood culture bottle for positivity. Record the Time to Positivity (TTP).
- Upon positivity, subculture onto solid media (e.g., Columbia Sheep Blood Agar).
- Identify bacterial species and perform Antimicrobial Susceptibility Testing (AST) using an automated system (e.g., BD Phoenix).
C. PISTE Culture-Independent Workflow
- DNA Extraction: Extract total DNA from 0.5 mL of the incubated blood aliquot using a bead-beating-based kit (e.g., MagMax Microbiome Ultra II kit) on an automated system (e.g., KingFisher).
- Library Preparation and Sequencing:
- Perform full-length 16S rRNA gene amplification using universal primers and a high-fidelity master mix.
- Prepare sequencing libraries (e.g., using SQK-PRB114.24 kit) for real-time sequencing on a portable device (e.g., Oxford Nanopore GridION Mk1b).
- Data Analysis:
- Use a dedicated bioinformatics pipeline for pathogen identification based on 16S rRNA sequences.
- For metagenomic analysis, perform resistance gene profiling from the sequenced data.
D. Correlation and Data Analysis
- Compare the identity of the pathogen(s) detected by both methods.
- Correlate the quantitative signal from sequencing (e.g., read counts normalized per mL of blood) with the quantitative culture result (CFU/mL). Statistical analyses (e.g., Spearman correlation) can be applied to establish a relationship.
Protocol 2: Correlation in Respiratory Specimens using 16S rRNA qPCR
This protocol is based on a systematic comparison in bronchoalveolar lavage (BAL) fluid from lung transplant recipients [97].
A. Sample Acquisition and Splitting
- Collect BAL fluid specimens following standard clinical procedures.
- Fractionate the sample into two aliquots immediately after collection.
- One aliquot is sent to the clinical microbiology laboratory for routine quantitative culture.
- The second aliquot is centrifuged to pellet cells and microbes, with the pellet stored at -80°C for molecular analysis.
B. Quantitative Culture
- Culture BAL fluid using standard clinical protocols (e.g., plating on chocolate, blood, and MacConkey agar).
- Report quantitative results as CFU/mL, with a typical clinical threshold of >10⁴ CFU/mL for significance.
C. Culture-Independent 16S rRNA Gene Analysis
- DNA Extraction: Extract genomic DNA from the BAL pellet using a kit optimized for environmental and complex samples (e.g., DNeasy Blood and Tissue Kit with bead-beating homogenization).
- Quantitative PCR (qPCR):
- Perform qPCR targeting the bacterial 16S rRNA gene using broad-range primers and a TaqMan hydrolysis probe.
- Include a standard curve of known bacterial genomic DNA copy numbers to allow absolute quantification.
- Report results as 16S rRNA gene copies per mL of BAL fluid.
- Pyrosequencing (for community analysis):
- Amplify the hypervariable regions (e.g., V3-V5) of the 16S rRNA gene for sequencing on a platform like the Roche 454 GS Junior or its equivalents.
- Process sequences using a pipeline like mothur to determine community composition and diversity.
E. Data Correlation
- Classify samples based on culture status (positive vs. negative) and culture load.
- Compare the mean 16S rRNA gene copy number (from qPCR) across these categories. Studies show significantly higher bacterial DNA burden in culture-positive samples [97].
- Analyze sequencing data to determine if specific microbial community profiles (e.g., low diversity, dominance by a known pathogen like Pseudomonas aeruginosa) are associated with positive, high-load quantitative cultures.
Workflow and Relationship Diagrams
The following diagram illustrates the logical and procedural relationship between culture-dependent and culture-independent methods when processing a single sample for correlative analysis.
The Scientist's Toolkit: Key Research Reagent Solutions
Successful correlation studies depend on specific reagents and kits designed to overcome technical challenges such as low microbial biomass and contaminating bacterial DNA.
Table 3: Essential Reagents for Correlation Studies
| Item/Category | Function & Rationale | Example Products |
|---|---|---|
| Bead-Beating DNA Extraction Kits | Mechanical lysis is crucial for breaking open a wide range of bacterial cell walls, especially Gram-positive species, ensuring unbiased DNA recovery from complex samples. | MagMax Microbiome Ultra II Kit [98], DNeasy PowerSoil Pro Kit |
| Eukaryote-Made Thermostable DNA Polymerase | Essential for sensitive bacterial universal PCR. Polymerases produced in E. coli can be contaminated with bacterial DNA, leading to false positives. Eukaryote-made versions are free from such contamination. | Eukaryote-made DNA polymerase [99] |
| Broad-Range 16S rRNA Primers | Allow for the amplification of a wide phylogenetic spectrum of bacteria from a single sample, enabling pathogen discovery and community profiling without prior knowledge of the species present. | Primers targeting V3-V5 (357F-929R) [97] or V4 (515F-806R) [100] regions |
| Standardized Mock Community DNA | Comprises genomic DNA from a known mix of bacterial species at defined abundances. Serves as an essential control for validating the accuracy and quantitative performance of both qPCR and NGS workflows. | ZymoBIOMICS Microbial Community Standard |
| Bioinformatics Pipelines | Specialized software is required to process raw sequencing data into biologically meaningful information, including taxonomic classification, abundance estimation, and resistance gene identification. | mothur [97], USEARCH [100], PISTE Dedicated Pipeline [98] |
Conclusion
Culture-independent methods for pathogen detection represent a transformative advancement, offering unprecedented speed, breadth, and the unique ability to identify viable but non-culturable organisms that evade traditional methods. While techniques like phage-based assays and wcDNA mNGS demonstrate superior sensitivity for detecting viable pathogens, challenges remain in optimizing specificity, standardizing bioinformatic analyses, and reducing host-derived background interference. The future of the field lies in the continued refinement of these technologies, the development of integrated sample preparation workflows, and the execution of large-scale clinical outcome studies to firmly establish their impact on patient management, antimicrobial stewardship, and public health safety. The combined use of culture-independent and refined culture-based methods may ultimately provide the most comprehensive diagnostic picture.
References
- 1. Culture-independent identification of bloodstream infections ... [https://pmc.ncbi.nlm.nih.gov/articles/PMC10935643/]
- 2. Non-culture methods for detecting infection [https://australianprescriber.tg.org.au/articles/non-culture-methods-for-detecting-infection.html]
- 3. An NGS-assisted diagnostic workflow for culture ... [https://www.frontiersin.org/journals/cellular-and-infection-microbiology/articles/10.3389/fcimb.2025.1656171/full]
- 4. Culture-free detection of bacteria from blood for rapid ... [https://www.nature.com/articles/s41746-025-01948-w]
- 5. Impact of Culture-Independent Studies on the Emerging ... [https://pmc.ncbi.nlm.nih.gov/articles/PMC107498/]
- 6. To culture or not to culture: a snapshot of ... [https://pmc.ncbi.nlm.nih.gov/articles/PMC8418214/]
- 7. Culture-Independent molecular techniques for bacterial ... [https://www.sciencedirect.com/science/article/pii/S1687428524000992]
- 8. Impact of Culture-Independent Diagnostic Testing on ... [https://pmc.ncbi.nlm.nih.gov/articles/PMC6248818/]
- 9. Recent Methods for the Viability Assessment of Bacterial ... [https://www.mdpi.com/2076-0817/11/9/1057]
- 10. Rapid Detection and Fast Induction of Viable but ... [https://www.sciencedirect.com/science/article/pii/S0362028X25001759]
- 11. A Review of Methods to Determine Viability, Vitality, and ... [https://pmc.ncbi.nlm.nih.gov/articles/PMC7705206/]
- 12. Defining bacterial heterogeneity and dormancy with the ... [https://www.sciencedirect.com/science/article/abs/pii/S2214799322000042]
- 13. How to Evaluate Non-Growing Cells—Current Strategies ... [https://pmc.ncbi.nlm.nih.gov/articles/PMC7912045/]
- 14. The importance of the viable but non-culturable state in ... [https://pmc.ncbi.nlm.nih.gov/articles/PMC4040921/]
- 15. Viable but nonculturable (VBNC) state, an underestimated ... [https://www.sciencedirect.com/science/article/abs/pii/S0966842X23001476]
- 16. Bacterial persisters: molecular mechanisms and ... [https://www.nature.com/articles/s41392-024-01866-5]
- 17. Bacterial Persister Cells and Development of Antibiotic ... - PMC [https://pmc.ncbi.nlm.nih.gov/articles/PMC11335562/]
- 18. Molecular mechanism and application of emerging ... [https://pmc.ncbi.nlm.nih.gov/articles/PMC11568608/]
- 19. The Role of Bacterial Biofilms in Antimicrobial Resistance [https://asm.org/articles/2023/march/the-role-of-bacterial-biofilms-in-antimicrobial-re]
- 20. Detection and Quantification Methods for Viable but Non ... [https://www.frontiersin.org/journals/microbiology/articles/10.3389/fmicb.2020.00673/full]
- 21. Persistence and viable but non-culturable state induced by ... [https://www.frontiersin.org/journals/microbiology/articles/10.3389/fmicb.2024.1346300/full]
- 22. for Methods of viable foodborne detection : current... pathogens [https://link.springer.com/article/10.1007/s00253-020-10542-x]
- 23. Pneumonia surveillance with culture-independent ... [https://pmc.ncbi.nlm.nih.gov/articles/PMC12193104/]
- 24. Faster Food Safety with Culture-Independent Testing [https://www.thermofisher.com/blog/food/foodnet-update-faster-food-safety-with-culture-independent-testing/]
- 25. Foodborne Illness and Culture-Independent Diagnostic Tests [https://www.cdc.gov/foodnet/reports/cidt.html]
- 26. Clinical utility of multiplex PCR in the detection ... [https://pubmed.ncbi.nlm.nih.gov/38470149/]
- 27. Viability PCR Reagent System Technical Manual [https://www.promega.com/resources/protocols/technical-manuals/500/viability-pcr-reagent-system-protocol-tm736/]
- 28. Optimization and Testing of a Commercial Viability PCR ... [https://pmc.ncbi.nlm.nih.gov/articles/PMC11052410/]
- 29. Application of Reverse Transcription-PCR and Real-Time ... [https://pmc.ncbi.nlm.nih.gov/articles/PMC5087796/]
- 30. Basic Principles of RT-qPCR [https://www.thermofisher.com/us/en/home/brands/thermo-scientific/molecular-biology/molecular-biology-learning-center/molecular-biology-resource-library/spotlight-articles/basic-principles-rt-qpcr.html]
- 31. Application of metagenomic next-generation sequencing in ... [https://pmc.ncbi.nlm.nih.gov/articles/PMC11604630/]
- 32. An NGS-assisted diagnostic workflow for culture ... [https://pubmed.ncbi.nlm.nih.gov/40959141/]
- 33. Comparison between Quantitative Nucleic Acid Sequence ... [https://pmc.ncbi.nlm.nih.gov/articles/PMC2224296/]
- 34. Comparison of nucleic acid-based detection methods for ... [https://www.sciencedirect.com/science/article/pii/S0044848625001048]
- 35. Bacteriophages as a modern diagnostic tool - PubMed Central [https://pmc.ncbi.nlm.nih.gov/articles/PMC12511255/]
- 36. Bacteriophage-based methods [https://bio-protocol.org/exchange/minidetail?id=8274027&type=30]
- 37. Evaluating phage lytic activity: from plaque assays to single ... [https://www.frontiersin.org/journals/microbiology/articles/10.3389/fmicb.2025.1659093/full]
- 38. A comparison of phage susceptibility testing with two liquid ... [https://pmc.ncbi.nlm.nih.gov/articles/PMC11335653/]
- 39. A rigorous assessment and comparison of enumeration ... [https://www.nature.com/articles/s41598-020-75490-y]
- 40. Comparative analysis of phage cocktail activity against ... [https://www.sciencedirect.com/science/article/pii/S2215016125004431]
- 41. Clinical Metagenomic Next-Generation Sequencing for ... [https://pmc.ncbi.nlm.nih.gov/articles/PMC6345613/]
- 42. Comparison of metagenomic next-generation sequencing ... [https://pmc.ncbi.nlm.nih.gov/articles/PMC9684712/]
- 43. Clinical evaluation of cell-free and cellular metagenomic ... [https://pmc.ncbi.nlm.nih.gov/articles/PMC10770109/]
- 44. Comparative analysis of metagenomic next-generation ... [https://pmc.ncbi.nlm.nih.gov/articles/PMC11934473/]
- 45. Metagenomic next-generation sequencing of plasma cell-free ... [https://bmcinfectdis.biomedcentral.com/articles/10.1186/s12879-024-09043-3]
- 46. Ultra-broad hybrid capture-based targeted next-generation ... [https://pmc.ncbi.nlm.nih.gov/articles/PMC12576977/]
- 47. Functionalized magnetic covalent organic frameworks with refining tunable cores for highly selective adsorption of immunosuppressive drugs | Analytical and Bioanalytical Chemistry [https://link.springer.com/article/10.1007/s00216-025-05877-1]
- 48. Advancing protein biosensors: redefining detection through ... [https://pubs.rsc.org/en/content/articlehtml/2025/ra/d4ra06791f]
- 49. Electrochemical Biosensors: A Prospective Insight to ... [https://www.sciencedirect.com/science/article/abs/pii/S2451910325001358]
- 50. Immune Cell Dynamics and Diagnostic Capabilities [https://link.springer.com/article/10.1007/s44174-025-00490-3]
- 51. Immuno-SPR biosensor for the detection of Brucella abortus [https://www.nature.com/articles/s41598-023-50344-5]
- 52. Applications and development trend of biosensors in the ... [https://pmc.ncbi.nlm.nih.gov/articles/PMC12131493/]
- 53. Biosensors for immune cell analysis—A perspective - PMC [https://pmc.ncbi.nlm.nih.gov/articles/PMC3360707/]
- 54. Biosensors, Volume 15, Issue 6 (June 2025) – 62 articles [https://www.mdpi.com/2079-6374/15/6]
- 55. Emerging analytical techniques for determination of ... [https://link.springer.com/article/10.1007/s44187-025-00590-5]
- 56. Effect of Culture-Independent Diagnostic Tests on Future ... [https://pmc.ncbi.nlm.nih.gov/articles/PMC4550165/]
- 57. Nanoparticle-based detection of foodborne pathogens [https://pmc.ncbi.nlm.nih.gov/articles/PMC12266482/]
- 58. Determining Matrix Effects in Complex Food Samples [https://www.waters.com/blog/understanding-sample-complexity-determining-matrix-effects-in-complex-food-samples/?srsltid=AfmBOoorCgDf6gmgTO_I1zE9HAU0oEp0wLFn4t_zsZb_-JgrFHZKTG8G]
- 59. Sample preparation for the detection of foodborne ... [https://www.sciencedirect.com/science/article/abs/pii/B9781845694968500119]
- 60. Variability of matrix effects in liquid and gas ... [https://pubmed.ncbi.nlm.nih.gov/23182936/]
- 61. Automated Sample Treatment System for Enhanced ... [https://link.springer.com/article/10.1007/s13206-025-00193-3]
- 62. Optimization of Metagenomic Next-Generation Sequencing ... [https://pubmed.ncbi.nlm.nih.gov/40670871/]
- 63. Host DNA depletion on frozen human respiratory samples ... [https://www.nature.com/articles/s42003-024-07290-3]
- 64. Metagenomic Sequencing: Strategies for Host DNA Removal [https://www.cd-genomics.com/microbioseq/resource-metagenomic-sequencing-host-dna-removal.html]
- 65. Optimization of Metagenomic Next-Generation Sequencing ... [https://pmc.ncbi.nlm.nih.gov/articles/PMC12436562/]
- 66. Evaluating urine volume and host depletion methods to ... [https://microbiomejournal.biomedcentral.com/articles/10.1186/s40168-025-02191-x]
- 67. Clinical characteristics of the host DNA-removed ... [https://www.frontiersin.org/journals/immunology/articles/10.3389/fimmu.2022.1016440/full]
- 68. Guidelines for preventing and reporting contamination in ... [https://www.nature.com/articles/s41564-025-02035-2]
- 69. Planning and analyzing a low-biomass microbiome study [https://pmc.ncbi.nlm.nih.gov/articles/PMC12445924/]
- 70. Optimization of Low-Biomass Sample Collection and ... [https://pmc.ncbi.nlm.nih.gov/articles/PMC9769501/]
- 71. Protocol for microbial profiling of low-biomass upper ... [https://www.sciencedirect.com/science/article/pii/S2666166725001467]
- 72. Enhancing pathogen identification through AI-assisted ... [https://pmc.ncbi.nlm.nih.gov/articles/PMC12493982/]
- 73. Pathogen Discovery, Detection, and Diagnostics - NCBI - NIH [https://www.ncbi.nlm.nih.gov/books/NBK221492/]
- 74. Frontiers | Development of novel parameters for pathogen identification in clinical metagenomic next-generation sequencing [https://www.frontiersin.org/journals/genetics/articles/10.3389/fgene.2023.1266990/full]
- 75. Pathogen Detection - NCBI - NIH [https://www.ncbi.nlm.nih.gov/pathogens/docs/data_processing]
- 76. Comparative Assessment of Wastewater-Based Surveillance Normalization Methods to Improve Pathogen Monitoring in Rural Sewersheds - PMC [https://pmc.ncbi.nlm.nih.gov/articles/PMC12164260/]
- 77. Percentage of culture confirmation and melting curve ... [https://pubmed.ncbi.nlm.nih.gov/40657925/]
- 78. The Implications of False Positives in Diagnostic Testing [https://www.apbiocode.com/false-positives/]
- 79. Diagnostic Testing Accuracy: Sensitivity, Specificity, Predictive ... [https://www.ncbi.nlm.nih.gov/books/NBK557491/]
- 80. Managing false positives during detection of pathogen ... [https://bmcbioinformatics.biomedcentral.com/articles/10.1186/s12859-024-05952-x]
- 81. False Positive Investigation Toolkit: Laboratory Monitoring [https://www.cdc.gov/tb/php/false-positive-investigation-toolkit/laboratory-monitoring.html]
- 82. Clinical Microbiology Laboratories' Adoption of Culture ... [https://pmc.ncbi.nlm.nih.gov/articles/PMC5228220/]
- 83. Comparison of pathogen detection consistency between ... [https://www.nature.com/articles/s41598-023-36681-5]
- 84. Comparison of pathogen detection performance between ... [https://pmc.ncbi.nlm.nih.gov/articles/PMC12375685/]
- 85. Targeted Metagenomic Sequencing-based Approach ... [https://pmc.ncbi.nlm.nih.gov/articles/PMC9662179/]
- 86. Comparison of metagenomic next-generation sequencing ... [https://www.frontiersin.org/journals/cellular-and-infection-microbiology/articles/10.3389/fcimb.2024.1338861/full]
- 87. Performance of 16S rRNA Gene Next-Generation ... [https://www.mdpi.com/2075-4418/14/13/1318]
- 88. Clinical evaluation of cell-free and cellular metagenomic ... [https://www.sciencedirect.com/science/article/pii/S2090123223000681]
- 89. Diagnosis and Management of Bloodstream Infections With ... [https://pmc.ncbi.nlm.nih.gov/articles/PMC8966137/]
- 90. Evaluation of Microbiological Performance and the ... [https://www.frontiersin.org/journals/cellular-and-infection-microbiology/articles/10.3389/fcimb.2020.594951/full]
- 91. Rapid Molecular Panels for the Identification ... [https://www.cap.org/member-resources/articles/rapid-molecular-panels-for-the-identification-of-bloodstream-pathogens]
- 92. A Comparison of Blood Pathogen Detection Among ... [https://www.frontiersin.org/journals/microbiology/articles/10.3389/fmicb.2021.641202/full]
- 93. Polymicrobial Infections: A Comprehensive Review on ... [https://www.mdpi.com/2813-9054/70/4/39]
- 94. A 'Culture' Shift: Application of Molecular Techniques for ... [https://pmc.ncbi.nlm.nih.gov/articles/PMC6447436/]
- 95. A novel method for estimating pathogen presence ... [https://www.nature.com/articles/s41598-025-93865-x]
- 96. Molecular Methods for Pathogenic Bacteria Detection and ... [https://www.mdpi.com/2073-4441/13/24/3551]
- 97. Analysis of Culture-Dependent versus ... [https://pmc.ncbi.nlm.nih.gov/articles/PMC4187760/]
- 98. An NGS-assisted diagnostic workflow for culture-independent ... [https://pmc.ncbi.nlm.nih.gov/articles/PMC12434068/]
- 99. Novel rapid method for identifying and quantifying ... [https://www.nature.com/articles/s41598-023-50864-0]
- 100. A Comparison of the Microbial Populations in a Culture ... [https://www.mdpi.com/2673-8007/4/3/73]