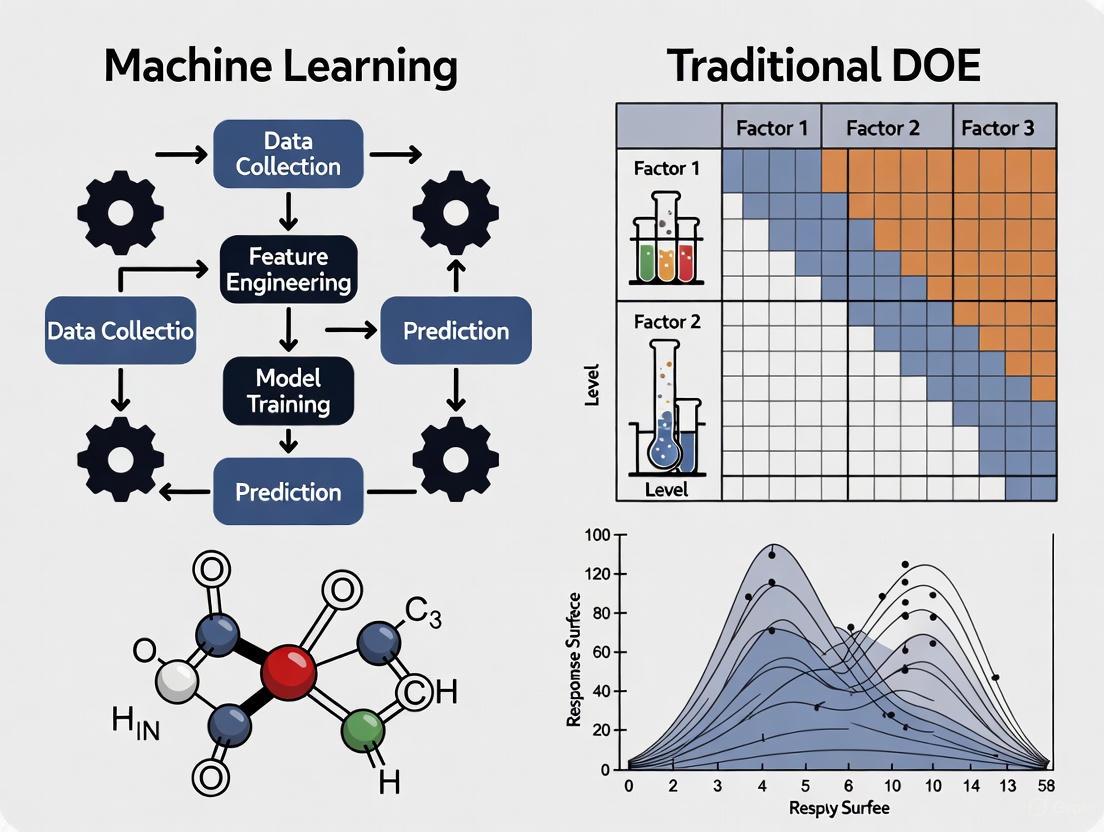
Beyond Trial and Error: Machine Learning vs Traditional DOE for Bioprocess Medium Optimization
This article provides a comprehensive comparison between Traditional Design of Experiments (DOE) and Machine Learning (ML)-guided DOE for medium optimization in biomedical and clinical research.
Beyond Trial and Error: Machine Learning vs Traditional DOE for Bioprocess Medium Optimization
Abstract
This article provides a comprehensive comparison between Traditional Design of Experiments (DOE) and Machine Learning (ML)-guided DOE for medium optimization in biomedical and clinical research. Tailored for researchers, scientists, and drug development professionals, it covers the foundational principles of both approaches, delves into practical methodologies and applications, addresses common troubleshooting and optimization challenges, and offers a rigorous validation framework. The goal is to equip R&D teams with the knowledge to select the right strategy, enhance experimental efficiency, reduce costs, and accelerate the development of robust bioprocesses.
Understanding the Core Principles: From Statistical Frameworks to Adaptive Learning
What is Traditional DOE? The Backbone of Systematic Experimentation
Traditional Design of Experiments (DOE) is a branch of applied statistics that deals with the planning, conducting, analyzing, and interpreting of controlled tests to evaluate the factors that control the value of a parameter or group of parameters [1]. It represents a systematic framework for conducting scientific investigations that allows researchers to efficiently explore the relationship between multiple input factors and a desired output. As a powerful data collection and analysis tool, traditional DOE enables scientists to manipulate several input factors simultaneously, determining their individual and combined effects on a response variable [1]. This methodology stands in stark contrast to less efficient one-factor-at-a-time (OFAT) approaches, which often fail to identify critical interactions between variables that can significantly impact experimental outcomes [2].
The historical foundation of modern DOE traces back to the pioneering work of Sir Ronald Fisher in the early 20th century, who demonstrated how serious consideration of experimental design before implementation helps avoid common analytical problems [1]. Fisher's principles—including randomization, replication, and blocking—established the bedrock upon which traditional DOE was built [3]. These principles ensure that experiments produce reliable, valid, and reproducible results that can withstand scientific scrutiny. Over subsequent decades, DOE has evolved into an indispensable methodology across scientific and engineering disciplines, particularly in fields requiring rigorous process optimization and characterization [2].
In the context of modern research, particularly in bioprocess optimization and medium development, traditional DOE serves as a crucial bridge between rudimentary OFAT approaches and emerging machine learning-driven methodologies. While advanced computational approaches offer new opportunities for modeling complex systems, traditional DOE provides the structured statistical framework and foundational experimental principles necessary for generating high-quality data [4]. This article explores traditional DOE as the backbone of systematic experimentation, examining its core principles, methodological framework, and contemporary applications in research settings where medium optimization is critical.
Core Principles: The Pillars of Traditional DOE
The robustness of traditional Design of Experiments stems from several foundational principles that ensure the validity and reliability of experimental findings. These principles, established through Fisher's early work and refined over decades of application, provide the theoretical underpinnings for all designed experiments [3].
Comparison
The principle of comparison emphasizes that experimental evaluations gain scientific value when treatments are compared against appropriate baselines or controls [3]. In traditional DOE, this often involves comparing the effects of different factor levels against a standard or control treatment that serves as a reference point. This comparative framework allows researchers to distinguish actual treatment effects from random variation or external influences. In medium optimization research, for instance, new nutrient combinations might be systematically compared against established basal media formulations to determine their relative effectiveness [4].
Randomization
Randomization refers to the practice of determining the experimental run order through a random sequence, which helps eliminate the effects of unknown or uncontrolled variables [1]. By randomizing the order in which experimental trials are performed, researchers minimize the risk that systematic biases or lurking variables will confound the results. For example, in a cell culture experiment investigating multiple medium components, randomization ensures that any undetected environmental fluctuations (such as minor temperature variations in an incubator) do not systematically favor one experimental condition over another. This principle is essential for establishing cause-and-effect relationships with confidence [2].
Replication
Replication involves the repetition of complete experimental treatments, including the setup [1]. This principle serves two crucial purposes: it allows researchers to estimate the inherent variability in the experimental system, and it provides a more reliable estimate of treatment effects by averaging out random variations. The number of replications directly impacts the statistical power of an experiment—its ability to detect true effects when they exist. In traditional DOE, replication should not be confused with repeated measurements; true replication involves independently executing the entire experimental treatment multiple times [3].
Blocking
Blocking is the non-random arrangement of experimental units into groups (blocks) consisting of units that are similar to one another [3]. This principle allows researchers to account for known sources of variation that are not the primary focus of investigation but could otherwise obscure treatment effects. When randomizing a factor is impossible or too costly, blocking enables researchers to restrict randomization by carrying out all trials with one setting of the factor before switching to another setting [1]. In biological experiments, blocking might involve grouping experimental units by batch of raw materials, time of day, or operator to control for these potential sources of variation.
Traditional DOE vs. One-Factor-at-a-Time Approach
A fundamental advantage of traditional DOE over the more intuitive one-factor-at-a-time (OFAT) approach lies in its efficient and systematic investigation of factor effects and interactions. The OFAT method, while straightforward and widely taught, involves changing a single factor at a time while holding all others constant [5]. This approach suffers from critical limitations that traditional DOE effectively addresses.
Table 1: Comparison of OFAT and Traditional DOE Approaches
| Aspect | One-Factor-at-a-Time (OFAT) | Traditional DOE |
|---|---|---|
| Efficiency | Inefficient use of resources [5] | Establishes solutions with minimal resources [5] |
| Experimental Space Coverage | Limited coverage [5] | Thorough, systematic coverage [5] |
| Interaction Detection | Fails to identify interactions [5] [2] | Systematically investigates all interactions [1] |
| Optimal Solution Identification | May miss the optimal solution [5] | Comprehensive mapping to identify true optimum |
| Underlying Methodology | Straightforward, widely taught [5] | Systematic structured approach [5] |
The critical limitation of OFAT is its inability to detect interactions between factors—situations where the effect of one factor depends on the level of another factor [2]. In complex biological systems such as culture media optimization, these interactions are common and often significant. For example, the effect of a growth hormone in a culture medium might depend on the concentration of specific micronutrients—a relationship that OFAT would likely miss but that traditional DOE would systematically uncover [4]. Traditional DOE captures these interactions by deliberately varying all factors simultaneously according to a predetermined pattern, allowing researchers to build a comprehensive model of the system behavior [1].
The statistical efficiency of traditional DOE derives from its ability to extract maximum information from a limited number of experimental runs. While a OFAT approach investigating 5 factors at 3 levels each would require 3⁵ = 243 experiments, a carefully designed fractional factorial DOE might achieve similar insights with only a fraction of these runs [2]. This efficiency makes traditional DOE particularly valuable in research settings where resources, time, or materials are constrained—common challenges in medium optimization and bioprocess development [6].
The Traditional DOE Methodology: A Structured Framework
Implementing traditional DOE typically follows a structured, multi-stage process that guides researchers from initial planning through final verification. This methodological framework ensures that experiments are strategically designed to answer specific research questions while efficiently utilizing resources.
The Five Stages of Traditional DOE
Table 2: Stages of Traditional DOE Implementation
| Stage | Primary Objective | Key Activities |
|---|---|---|
| Planning | Define objectives and constraints [2] | - Establish clear experimental objectives- Identify potential factors and responses- Assess resources and constraints- Form multidisciplinary team |
| Screening | Identify vital few factors [2] | - Narrow from many potential factors to critical few- Use efficient designs (e.g., Plackett-Burman)- Focus on main effects rather than interactions |
| Optimization | Determine optimal factor settings [2] | - Characterize response surfaces- Identify factor settings that maximize, minimize, or achieve target response- Use designs like Central Composite or Box-Behnken |
| Robustness Testing | Make process insensitive to noise [2] | - Identify control factor settings that minimize variability- Make product/process robust to uncontrollable factors- Use parameter designs |
| Verification | Confirm optimal settings [2] | - Conduct follow-up confirmation runs- Validate that system performs as expected- Finalize operational specifications |
The planning phase is particularly critical, as careful planning before embarking on experimentation significantly enhances the value and efficiency of the entire process [2]. During this stage, researchers develop a comprehensive understanding of the inputs and outputs being investigated, often using process flowcharts or process maps for visualization [1]. Consultation with subject matter experts is essential to identify all potentially relevant factors and ensure that the appropriate response measures are selected. The planning phase also involves determining realistic high and low levels for each input factor that represent extreme but achievable operating conditions [1].
Screening experiments deserve special attention in medium optimization contexts, where numerous factors (pH, temperature, nutrient components, dissolved oxygen, etc.) might potentially influence critical quality attributes [6]. Traditional DOE offers specialized screening designs, such as fractional factorials or Plackett-Burman designs, that efficiently identify the "vital few" factors from the "trivial many" using a minimal number of experimental runs [2]. This approach prevents researchers from wasting resources investigating insignificant factors while ensuring that important factors aren't overlooked.
Traditional DOE Methodology: A Cyclical Process for Systematic Optimization
Factorial Designs: The Workhorse of Traditional DOE
At the heart of traditional DOE lie factorial designs, which involve varying multiple factors simultaneously according to a predetermined pattern. In these designs, multiple factors are investigated together, and the objective is to identify which factors significantly affect the response while also investigating interaction effects [2].
The most basic factorial design involves factors each at two levels (high and low), coded as +1 and -1 for mathematical convenience [1]. For example, a 2-factor experiment requires 4 experimental runs (2²), while a 3-factor experiment requires 8 runs (2³). The number of experimental runs can be calculated using the formula 2ⁿ, where n is the number of factors [1]. Full factorial designs investigate all possible combinations of factor levels, allowing researchers to estimate all main effects and interactions [2].
When the number of factors makes full factorial designs impractical, fractional factorial designs investigate only a carefully selected subset of the possible combinations [1]. These designs sacrifice the ability to estimate higher-order interactions (which are often negligible) in exchange for significantly reduced experimental effort. The strategic selection of which runs to include follows sophisticated statistical principles that preserve the ability to estimate important effects while minimizing confounding.
Application in Medium Optimization: A Detailed Protocol
Traditional DOE finds particularly valuable application in culture medium optimization, where multiple components and process parameters interact to influence critical quality attributes of biological products [6]. The following detailed protocol illustrates how traditional DOE can be implemented for optimizing a culture medium formulation.
Experimental Protocol: Traditional DOE for Medium Optimization
Objective: To optimize a culture medium formulation for enhanced monoclonal antibody production in CHO cells by investigating four critical medium components and their interactions.
Factors and Levels:
- Factor A: Glucose concentration (2g/L vs. 6g/L)
- Factor B: Glutamine concentration (2mM vs. 6mM)
- Factor C: Specific growth factor (Present vs. Absent)
- Factor D: Trace element cocktail (Standard vs. Enhanced)
Response Variables:
- Primary: Final mAb titer (mg/L)
- Secondary: Cell viability (%), Specific productivity (pg/cell/day)
Experimental Design: 2⁴ Full Factorial Design (16 experimental runs, plus 3 center point replicates for curvature detection)
Table 3: Traditional DOE Design Matrix for Medium Optimization
| Run Order | Glucose | Glutamine | Growth Factor | Trace Elements | mAb Titer (mg/L) | Cell Viability (%) | Specific Productivity (pg/cell/day) |
|---|---|---|---|---|---|---|---|
| 1 | -1 (2g/L) | -1 (2mM) | -1 (Absent) | -1 (Standard) | 245 | 78.2 | 8.4 |
| 2 | +1 (6g/L) | -1 (2mM) | -1 (Absent) | -1 (Standard) | 285 | 82.5 | 9.1 |
| 3 | -1 (2g/L) | +1 (6mM) | -1 (Absent) | -1 (Standard) | 265 | 80.1 | 8.7 |
| 4 | +1 (6g/L) | +1 (6mM) | -1 (Absent) | -1 (Standard) | 325 | 85.3 | 9.8 |
| 5 | -1 (2g/L) | -1 (2mM) | +1 (Present) | -1 (Standard) | 295 | 83.2 | 9.3 |
| 6 | +1 (6g/L) | -1 (2mM) | +1 (Present) | -1 (Standard) | 365 | 87.6 | 10.5 |
| 7 | -1 (2g/L) | +1 (6mM) | +1 (Present) | -1 (Standard) | 335 | 85.1 | 10.1 |
| 8 | +1 (6g/L) | +1 (6mM) | +1 (Present) | -1 (Standard) | 425 | 89.8 | 11.4 |
| 9 | -1 (2g/L) | -1 (2mM) | -1 (Absent) | +1 (Enhanced) | 275 | 81.3 | 8.9 |
| 10 | +1 (6g/L) | -1 (2mM) | -1 (Absent) | +1 (Enhanced) | 315 | 84.7 | 9.6 |
| 11 | -1 (2g/L) | +1 (6mM) | -1 (Absent) | +1 (Enhanced) | 305 | 83.5 | 9.4 |
| 12 | +1 (6g/L) | +1 (6mM) | -1 (Absent) | +1 (Enhanced) | 385 | 88.1 | 10.8 |
| 13 | -1 (2g/L) | -1 (2mM) | +1 (Present) | +1 (Enhanced) | 345 | 86.2 | 10.3 |
| 14 | +1 (6g/L) | -1 (2mM) | +1 (Present) | +1 (Enhanced) | 445 | 90.5 | 11.9 |
| 15 | -1 (2g/L) | +1 (6mM) | +1 (Present) | +1 (Enhanced) | 405 | 88.9 | 11.2 |
| 16 | +1 (6g/L) | +1 (6mM) | +1 (Present) | +1 (Enhanced) | 525 | 93.7 | 12.8 |
| 17-19 | 0 (4g/L) | 0 (4mM) | 0 (Half) | 0 (Intermediate) | 395-405 | 87.1-88.2 | 10.5-10.7 |
Statistical Analysis Approach:
- Calculate main effects for each factor
- Estimate two-factor interaction effects
- Perform Analysis of Variance (ANOVA) to identify statistically significant effects (p < 0.05)
- Develop regression model to predict responses
- Identify optimal factor level combinations
Effect Calculation Example: The main effect of Glucose on mAb titer would be calculated as the average of all runs at high glucose level minus the average of all runs at low glucose level [1]. For the above data, this would be approximately 105 mg/L, indicating a strong positive effect of increasing glucose concentration.
Research Reagent Solutions for Medium Optimization
Table 4: Essential Research Reagents for Culture Medium Optimization
| Reagent/Category | Function in Medium Optimization | Typical Concentration Ranges |
|---|---|---|
| Basal Medium | Provides essential nutrients, vitamins, and salts for cell growth | NA (formulation basis) |
| Glucose | Primary carbon and energy source for cellular metabolism | 1-6 g/L [6] |
| Glutamine | Essential amino acid providing nitrogen and carbon skeletons | 2-8 mM [6] |
| Growth Factors | Signaling molecules that regulate cell proliferation and productivity | Species-specific |
| Trace Elements | Metal ions (Cu, Zn, Fe, etc.) serving as enzyme cofactors | Various cocktails |
| pH Buffers | Maintain optimal pH for cellular processes and product stability | Physiological range (7.0-7.4) |
| Amino Acids | Building blocks for protein synthesis, including mAbs | Various compositions |
| Hormones/Steroids | Regulate metabolic pathways and cellular differentiation | Species-specific |
Traditional DOE in the Machine Learning Era: A Complementary Foundation
The emergence of machine learning (ML) approaches in bioprocess optimization has created a new context for traditional DOE, with these methodologies serving complementary rather than competing roles. While ML offers powerful capabilities for modeling complex, nonlinear relationships, traditional DOE provides the structured approach to experimental design that generates the high-quality data necessary for effective ML model training [4].
Traditional DOE fails to capture the complex, nonlinear interactions between culture parameters in systems where multiple factors interact in higher-order ways [6]. This limitation becomes particularly evident in biological systems characterized by extensive nonlinearity and complex interactions, where response surface methodology and other advanced DOE variants still struggle to fully characterize the system behavior [7]. ML approaches can model these complex relationships without requiring predetermined model forms, making them particularly valuable for optimizing complex biological systems [6].
However, the effectiveness of ML is heavily dependent on the quality and structure of the training data. Traditional DOE provides an ideal framework for generating this data through its systematic variation of input factors and efficient coverage of the experimental space [4]. The structured approach of traditional DOE ensures that the resulting data set has appropriate statistical properties (orthogonality, balance, etc.) that enable ML algorithms to accurately discern patterns and relationships. In this sense, traditional DOE serves as the foundational data generation engine that powers effective ML applications in medium optimization [6].
Traditional DOE and Machine Learning: A Synergistic Relationship for Process Optimization
The integration of traditional DOE and ML follows a logical progression where initial screening and characterization experiments using traditional DOE provide the foundational understanding of the system, which then informs more focused data generation for ML model development [6]. This hybrid approach leverages the strengths of both methodologies: the structured efficiency of traditional DOE for initial exploration and the adaptive, nonlinear modeling capabilities of ML for refined optimization. As noted in recent research, "Machine learning accelerates and improves tissue culture media optimization" precisely because it can build upon the structured knowledge generated through traditional experimental approaches [4].
Traditional Design of Experiments remains an indispensable methodology in scientific research, particularly in complex optimization challenges such as culture medium development. Its systematic approach to experimental planning, execution, and analysis provides a rigorous framework for efficiently extracting maximum information from limited resources. The core principles of comparison, randomization, replication, and blocking ensure the validity and reliability of experimental findings, while factorial and fractional factorial designs enable comprehensive investigation of factor effects and interactions.
In contemporary research contexts, traditional DOE serves as the crucial foundation upon which more advanced optimization approaches, including machine learning, are built. While ML offers exciting capabilities for modeling complex biological systems, its effectiveness depends heavily on the quality of training data—data that traditional DOE is uniquely positioned to generate through its structured approach. The integration of these methodologies represents the future of efficient process optimization in biotechnology and pharmaceutical development.
For researchers, scientists, and drug development professionals, mastery of traditional DOE principles and methodologies remains essential for designing informative experiments, avoiding common pitfalls of one-factor-at-a-time approaches, and building the foundational knowledge necessary for implementing more advanced optimization strategies. As the backbone of systematic experimentation, traditional DOE continues to provide the statistical rigor and methodological discipline required for advancing scientific understanding and technological innovation in medium optimization and beyond.
In the competitive fields of drug development and materials science, optimizing complex processes like medium composition is a fundamental but resource-intensive challenge. For decades, Design of Experiments (DOE) has been the cornerstone statistical approach for systematically exploring how different variables influence a desired outcome. Traditional DOE is excellent for local optimization using linear models within a limited design space [8]. However, the exponential growth in experimental complexity and the high-dimensional nature of modern research problems have exposed its limitations. Enter Machine Learning (ML)-guided DOE—a paradigm that merges adaptive AI modeling with iterative experimentation to accelerate discovery.
This new approach uses machine learning algorithms to create predictive models from existing data. Crucially, these models not only predict outcomes but also quantify their own uncertainty [8]. This allows researchers to strategically select each subsequent experiment, either to exploit promising leads with high predicted performance or to explore regions of the design space where the model lacks information. This iterative, AI-guided methodology, often called Sequential Learning, is revolutionizing research and development by making every experiment count [8].
Head-to-Head Comparison: Traditional DOE vs. ML-Guided DOE
The fundamental differences between traditional and ML-guided DOE impact everything from experimental efficiency to the types of problems that can be tackled. The table below summarizes these core distinctions.
Table 1: Fundamental Differences Between Traditional DOE and ML-Guided DOE
| Feature | Traditional DOE | ML-Guided DOE (Sequential Learning) |
|---|---|---|
| Primary Goal | Statistical inference of treatment effects; local optimization [9] [8] | Accurate prediction and global optimization over complex spaces [9] [8] |
| Experimental Strategy | One-off, fixed grid of experiments designed upfront [8] | Iterative, closed-loop; each experiment is informed by previous results [8] [10] |
| Handling of High Dimensions | Number of experiments grows exponentially with variables [8] | Number of experiments scales linearly with the number of dimensions [8] |
| Data Utilization | Purely statistical; does not use domain knowledge or past project data [8] | Leverages existing data and incorporates domain knowledge to improve models [8] |
| Data Type Compatibility | Best with simple, structured, tabular data [8] | Can handle varied, complex, and unstructured data (e.g., micrographs) [8] |
| Uncertainty Quantification | Not a core feature | Core feature; guides strategic choice between exploration and exploitation [8] |
Quantitative Performance Analysis
The theoretical advantages of ML-guided DOE are compelling, but the most convincing evidence comes from documented performance in real-world R&D settings. The following table compiles key metrics from published studies and industry implementations.
Table 2: Documented Performance Metrics of ML-Guided DOE vs. Traditional Methods
| Metric | Traditional DOE | ML-Guided DOE | Context/Source |
|---|---|---|---|
| Reduction in Experiments | Baseline | 50% - 90% [8] | Materials & chemicals R&D to reach target performance [8] |
| Acceleration of Timelines | Baseline | ~20x faster (6 months vs. 10 years) [10] | Synthetic biology for new commercially viable molecules [10] |
| Throughput of Automated Labs | Human researcher baseline | 50x - 100x more samples per day [10] | A-Lab at Berkeley Lab for materials synthesis [10] |
| Candidate Screening Speed | Trial-and-error synthesis of a few candidates | Screening of ~50,000 structures to identify top candidates [10] | Discovery of a record-breaking capacitor material [10] |
| Data Analysis Speed | Years | Minutes [10] | OmniFold tool for particle collider data analysis [10] |
Experimental Protocols and Workflows
Understanding the practical implementation of these methodologies is crucial for researchers. Below are the generalized protocols for both traditional and ML-guided approaches.
Traditional DOE Workflow
Traditional DOE is a linear, upfront process focused on modeling and inference.
Diagram 1: Traditional DOE Linear Workflow
Step-by-Step Protocol:
- Define Objective and Variables: Clearly state the optimization goal (e.g., maximize cell growth). Identify all independent variables (factors) and their ranges.
- Design Fixed Experiment Grid: Select a DOE design (e.g., full factorial, fractional factorial, Response Surface Methodology - RSM) to create a predefined set of experimental runs. This design aims to maximize information while controlling for the number of experiments.
- Execute All Experiments: Conduct the entire set of experiments from the design matrix. The order is typically randomized to avoid bias.
- Statistical Analysis: Analyze the collected response data using statistical methods like Analysis of Variance (ANOVA) to identify which factors have significant effects.
- Build Model: Fit a linear or polynomial model (e.g., a quadratic model in RSM) that describes the relationship between the variables and the response.
- Validate Model: Perform confirmation experiments to test the model's predictive accuracy within the studied experimental region.
ML-Guided DOE (Sequential Learning) Workflow
This is an iterative, closed-loop process that emphasizes continuous learning and prediction.
Diagram 2: ML-Guided DOE Iterative Workflow
Step-by-Step Protocol:
- Acquire Initial Training Dataset: Compile data from prior experiments, literature, or initial screening studies. This dataset forms the foundation for the first model.
- Train ML Model: Use an ML algorithm (e.g., Random Forest, Gaussian Process, Neural Networks) to train a model that maps input variables to the output response(s).
- Predict Outcomes & Uncertainty: The trained model is used to predict the performance of untested variable combinations across the entire design space. Crucially, the model also estimates the uncertainty for each prediction.
- AI Suggests Next Experiments: An acquisition function uses the predictions and uncertainty to propose the most informative next experiments. This balances exploration (testing high-uncertainty areas) and exploitation (testing high-predicted-performance areas).
- Execute Selected Experiments: A human researcher or an automated robotic system (like Berkeley Lab's A-Lab [10]) performs the shortlisted experiments.
- Update Dataset: The new experimental results are added to the training dataset.
- Iterate or Conclude: The model is retrained with the enriched dataset. The loop continues until a performance target is met or the budget is exhausted.
The Scientist's Toolkit: Essential Research Reagents and Materials
Implementing these methodologies, especially in biological contexts, requires a suite of key reagents and tools. The following table details essential items for a medium optimization study in drug development.
Table 3: Key Research Reagent Solutions for Medium Optimization
| Reagent/Material | Function in Experiment |
|---|---|
| Chemically Defined Media Components | Provides a base with known concentrations of nutrients (e.g., amino acids, vitamins, salts). Essential for precisely controlling independent variables in a DOE or ML-DOE study. |
| Growth Factors & Cytokines | Signaling molecules that can be varied as factors to optimize cell growth, viability, and productivity in biopharmaceutical production. |
| Metabolomics Assay Kits | Used to measure metabolite consumption/production (e.g., glucose, lactate) as critical response variables to understand cell metabolism and medium efficiency. |
| Cell Viability & Apoptosis Assays | Measures key performance indicators (KPIs) like viability and apoptosis rates, which are common optimization targets in bioprocessing. |
| High-Throughput Screening Plates | (e.g., 96-well, 384-well) Enable the parallel execution of dozens to hundreds of medium condition tests, which is fundamental for both DOE and ML-DOE. |
| Process Analytical Technology (PAT) | Sensors for online monitoring of parameters like pH, dissolved oxygen, and biomass. Provide rich, high-frequency data to train more accurate ML models. |
The evidence clearly demonstrates that ML-guided DOE represents a significant leap forward in experimental science. While traditional DOE remains a powerful tool for well-defined, low-dimensional problems, its rigid structure is ill-suited for the complex, high-dimensional optimization challenges that define modern R&D. ML-guided DOE, with its ability to learn from data, quantify uncertainty, and strategically guide an iterative experimental process, offers unparalleled efficiency, speed, and scope [8] [10].
The documented outcomes—reductions in experiments by 50-90%, the acceleration of development timelines from a decade to mere months, and the successful navigation of vast design spaces—make a compelling case for its adoption [8] [10]. For researchers, scientists, and drug development professionals focused on medium optimization and similar complex tasks, integrating ML-guided DOE is no longer a futuristic concept but a practical strategy to drive innovation and maintain a competitive edge.
In the field of medium optimization for bioprocesses, such as drug development, researchers are often faced with a fundamental choice between two distinct analytical philosophies: the traditional, knowledge-driven rule-based approach and the modern, pattern-based data-driven logic. The rule-based approach, often implemented through traditional Design of Experiments (DOE), relies on predefined human expertise and structured experimental designs to systematically explore variable space [11]. In contrast, the data-driven approach, frequently employing machine learning (ML), learns relationships directly from historical and experimental data to model and predict optimal conditions [12] [13]. This guide objectively compares these methodologies within the context of medium optimization research, providing experimental data, detailed protocols, and resource information to inform researchers and scientists in the pharmaceutical and biotech industries.
Core Philosophical Differences
The divergence between rule-based and data-driven logic stems from their foundational principles, which dictate their application, strengths, and limitations.
Rule-Based Logic (Traditional DOE): This philosophy is rooted in causation and control. It depends on explicit domain knowledge encoded into a system—for example, in the form of "if-then" rules or a predefined experimental matrix [12] [14]. The experimenter controls the input variables based on a specific design (e.g., factorial or response surface methodology) to establish clear, causal links between inputs and outputs [11]. The primary goal is to understand the "why" behind a process, ensuring that the system's behavior is transparent, deterministic, and valid within expected conditions [12].
Data-Driven Logic (Machine Learning): This philosophy is centered on correlation and learning. Instead of being explicitly programmed with rules, ML algorithms identify complex, non-linear patterns and relationships from data [12] [15]. The system's logic is embedded in the algorithm's model, which is derived from the data itself [14]. The focus shifts from pre-defined understanding to discovering hidden insights, enabling the model to adapt and improve as more data becomes available [15]. The goal is often high-fidelity prediction, even if the underlying causal mechanisms remain partially opaque—a characteristic often described as the "black box" problem [11].
Table 1: A Comparison of Foundational Philosophies
| Aspect | Rule-Based / Traditional DOE | Data-Driven / Machine Learning |
|---|---|---|
| Primary Foundation | Pre-existing expert knowledge, physical laws [12] | Historical and experimental data patterns [12] [15] |
| Core Logic | Deterministic, "if-then" rules [14] | Probabilistic, statistical models [15] |
| Goal of Analysis | Causal inference, understanding "why" [11] | Predictive accuracy, forecasting outcomes [11] |
| Adaptability | Static; requires manual updates by experts [12] [15] | Dynamic; autonomously adapts to new data [15] [14] |
| Transparency | High; decisions are easily interpretable [12] [14] | Lower; can be a "black box" requiring XAI techniques [13] [11] |
Experimental Performance and Quantitative Data
Recent studies in synthetic biology and biomanufacturing provide concrete data on the performance of these approaches for medium optimization.
Case Study: Flaviolin Production inPseudomonas putida
A seminal 2025 study directly compared a traditional one-factor-at-a-time (OFAT) method, a rule-based Response Surface Methodology (RSM), and a data-driven ML active learning process for optimizing the production of flaviolin, a valuable chemical precursor [13].
Key Findings:
- The ML active learning process achieved the highest improvements, increasing flaviolin titer by 60% and 70% in two different campaigns, and process yield by 350% in a third campaign [13].
- The ML model, through explainable AI (XAI) techniques, identified that sodium chloride (NaCl) was the most important component influencing production—a non-intuitive relationship that was not pre-defined in any rule set [13].
- The optimal salt concentration was found to be very high, comparable to seawater, demonstrating ML's ability to discover novel and high-performing operating regimes beyond typical human expertise [13].
Table 2: Performance Comparison in Flaviolin Medium Optimization
| Optimization Method | Key Outcome | Experimental Effort | Key Insight Revealed |
|---|---|---|---|
| Traditional OFAT | Baseline performance | Cumbersome, inefficient for multi-variable systems [13] | Limited to one variable at a time |
| Rule-Based RSM | Moderate improvement | Structured but can be suboptimal for complex spaces [13] | Models based on 2nd-degree polynomials |
| Data-Driven ML | +60% to +70% titer; +350% yield [13] | Highly efficient via active learning [13] | Identified NaCl as critical factor [13] |
General Performance Trends
A broader analysis of the two approaches reveals consistent trade-offs:
- Rule-based/DOE systems excel in environments where failures are rare and data is scarce, as they do not require large historical datasets [12]. They provide high reliability and accuracy within their predefined, stable domains [12] [14].
- Data-driven/ML systems significantly outperform in complex, non-linear scenarios with many interacting variables [12] [13]. They are, however, highly dependent on the quality and quantity of the data used for training, and their development is often more complex and resource-intensive [14].
Detailed Experimental Protocols
Protocol for Rule-Based Medium Optimization using DOE
This protocol outlines a standard RSM approach for optimizing a medium with multiple components [13] [11].
- Problem Formulation: Define the response variable (e.g., product titer, growth rate) and select the critical medium components (e.g., carbon source, nitrogen source, salts, inducters) to be investigated as independent variables.
- Experimental Design: Create a design matrix (e.g., Central Composite Design) that specifies the exact combinations and concentrations of each variable to be tested. This design efficiently covers the experimental space while minimizing the number of required runs.
- Execution & Data Collection:
- Prepare media according to the design matrix.
- Inoculate with the production host (e.g., P. putida, E. coli).
- Cultivate under controlled conditions (temperature, pH, O₂).
- Harvest samples and quantify the response (e.g., via HPLC, absorbance assays).
- Model Fitting & Analysis: Fit a second-degree polynomial model to the collected data. Use analysis of variance (ANOVA) to identify which factors and interactions are statistically significant.
- Optimization & Validation: Use the fitted model to predict the combination of factor levels that will maximize the response. Perform confirmatory experiments at the predicted optimum to validate the model's accuracy.
Protocol for Data-Driven Medium Optimization using Active Learning
This protocol describes an ML-driven active learning cycle, as implemented in the flaviolin case study [13].
- Initial Data Collection: Compile any existing historical data on the host and product. If no data exists, start with a small, space-filling set of experiments (e.g., a sparse DOE or random sampling).
- Model Training: Train a machine learning model (e.g., Random Forest, Gaussian Process, or a custom tool like the Automated Recommendation Tool - ART [13]) on the available data. The model learns to map media compositions to the output performance metric.
- Recommendation (Active Learning): The trained ML algorithm evaluates millions of potential media compositions in silico and recommends a shortlist (e.g., 10-15) of the most promising candidates to test next. These are typically points predicted to yield high performance or those where the model is most uncertain, balancing exploration and exploitation.
- Automated Testing:
- An automated liquid handler prepares the recommended media designs in multi-well plates.
- The plates are inoculated and cultivated in an automated bioreactor system (e.g., a BioLector) for highly repeatable, small-scale cultivation.
- Product formation is measured using a high-throughput assay (e.g., microplate reader absorbance).
- Iteration (DBTL Cycle): The new experimental results are added to the dataset. The cycle repeats from Step 2, creating a closed Design-Build-Test-Learn (DBTL) loop. With each iteration, the model becomes more accurate and hones in on the global optimum more efficiently than one-shot DOE [13].
Workflow and Relationship Visualization
The following diagrams illustrate the logical workflows of both the rule-based and data-driven approaches, culminating in a hybrid model.
Rule-Based DOE Workflow
Data-Driven Active Learning Workflow
Hybrid DOE-ML Optimization Workflow
The Scientist's Toolkit: Essential Research Reagents and Platforms
Successfully implementing these optimization strategies requires a combination of biological, computational, and automation resources.
Table 3: Essential Reagents and Platforms for Medium Optimization Research
| Item | Function / Description | Relevance to Approach |
|---|---|---|
| Automated Liquid Handler | Precisely dispenses liquid to prepare complex media formulations according to a digital design file. | Critical for ML active learning to rapidly prepare many different media designs [13]. |
| Micro-scale Bioreactors (e.g., BioLector) | Provides high-throughput, reproducible cultivation with tight control over conditions (O₂, pH) in 48- or 96-well plates. | Essential for both, but enables the rapid DBTL cycles in ML workflows [13]. |
| High-Throughput Assay | A fast, reliable method to quantify the output (e.g., product titer, cell density). Absorbance assays are common. | Vital for ML to quickly phenotype many samples; used in both for data collection [13]. |
| DOE Software (e.g., JMP, MODDE) | Software used to create optimal experimental designs (e.g., RSM) and analyze the resulting data. | Core for rule-based DOE strategy [16]. |
| Machine Learning Platform / Code | Software or custom code (e.g., in Python/R) for building ML models. Active learning tools (e.g., ART) are key. | Core for data-driven ML strategy [13]. |
| Data Management System (e.g., EDD) | A database (e.g., Experiment Data Depot) to store and manage experimental designs and results. | Important for both, but critical for ML to maintain a clean, accessible dataset for iterative learning [13]. |
The comparison reveals that the choice between rule-based and data-driven logic is not necessarily a binary one. Rule-based DOE offers interpretability, reliability, and structured causal inference, making it ideal for well-understood systems or when data is limited [12] [11]. Data-driven ML provides superior adaptability, efficiency in complex spaces, and the ability to uncover novel, non-intuitive relationships, as demonstrated by the 70% titer increase and the discovery of salt's critical role in flaviolin production [13].
The most powerful emerging trend is the hybridization of these philosophies [16] [11]. In this synergistic model, an initial structured DOE can be used to generate a high-quality foundational dataset, which is then used to train an ML model. The ML model then guides subsequent, more efficient active learning cycles to refine and optimize the process further [16]. This combined approach leverages the structured, causal grounding of DOE with the adaptive, predictive power of ML, creating a robust framework for accelerating medium optimization and bioprocess development in drug discovery and beyond.
Core Components of an ML-DOE Framework for Bioprocesses
The optimization of bioprocesses, particularly culture media, is fundamental to achieving the titers, rates, and yields (TRY) required for commercially viable biomanufacturing. For decades, the field has been dominated by traditional Design of Experiments (DoE) approaches, which use structured experimental campaigns to fit statistical models, typically linear or second-order polynomials, to process data [13]. While these methods brought rigor, they often struggle with the complex, non-linear nature of biological systems and can require an impractical number of experiments when many factors are involved [17]. The emergence of Machine Learning (ML) presents a paradigm shift. ML algorithms can learn complex, non-linear relationships directly from data, offering the potential to uncover deeper insights and identify optimal conditions with greater efficiency [18] [6]. This guide provides a comparative analysis of ML-based and traditional DoE frameworks, detailing their core components through objective data and experimental protocols.
Core Components of an ML-DOE Framework
An effective ML-DOE framework integrates the strategic design of experiments with advanced data modeling. Its core components form an iterative cycle for accelerated process understanding and optimization.
Experimental Design: This component involves selecting which experiments to run. Traditional DoE often uses factorial or response surface methodology (RSM) designs that perturb factors around "corner points." In contrast, ML-beneficial designs, such as space-filling designs (e.g., Latin Hypercube Sampling), distribute experiments uniformly across the entire design space to generate richer data for training non-linear models [17]. Definitive Screening Designs (DSDs) are a hybrid, enabling efficient evaluation of main effects and quadratic relationships with minimal experimental runs [19].
Data Generation and Management: This involves executing experiments and curating the resulting data. A key advancement is the development of semi-automated pipelines that use liquid handlers and automated bioreactors to rapidly and reproducibly test ML-suggested media conditions, drastically reducing hands-on time and variability [13]. The data generated—including process parameters, metabolite concentrations, and product quality attributes—must be stored in structured databases.
Modeling Engine: This is the analytical core of the framework. While traditional DoE relies on linear regression, ML employs a suite of algorithms. Artificial Neural Networks (ANNs) are frequently used for their high predictive accuracy with complex data [20] [21]. Hybrid models combine a mechanistic backbone (representing known scientific principles) with a machine learning layer to capture unknown non-linear behaviors, offering high accuracy and data efficiency [17]. For improved interpretability, Symbolic Regression can find simple, human-readable equations that rival the performance of "black-box" models like ANNs [20].
Insight and Recommendation: The trained models are used to generate predictions and insights. Explainable AI (XAI) techniques, such as SHapley Additive exPlanations (SHAP), quantify the importance of each input parameter (e.g., pH, salt concentration) on the output, moving beyond correlation to actionable causality [20] [13]. Based on these insights, the model recommends a new set of promising conditions to test, thus closing the loop.
The following diagram illustrates the workflow of an ML-DOE framework, highlighting its iterative "Design-Build-Test-Learn" (DBTL) nature.
Comparative Analysis: ML vs. Traditional DoE
The choice between ML and traditional DoE has significant implications for experimental burden, model complexity, and interpretability. The table below summarizes their key differences.
Table 1: A comparative overview of Machine Learning and Traditional DoE frameworks for bioprocess optimization.
| Feature | Machine Learning (ML) Framework | Traditional DoE Framework |
|---|---|---|
| Underlying Model | Non-linear models (e.g., ANN, Random Forest), Hybrid models [17] [20] | Linear regression, Response Surface Methodology (RSM) [13] |
| Handling of Complexity | Excels at capturing complex, non-linear interactions and combinatorial effects [17] | Struggles with high non-linearity; often oversimplifies complex systems [17] |
| Data Efficiency | Hybrid models are highly data-efficient; pure ML can be data-hungry [17] | Relatively data-efficient for linear effects, but limited in scope [17] |
| Experimental Design | Space-filling designs, active learning cycles [17] [13] | Factorial designs, central composite designs, Definitive Screening Designs (DSDs) [19] |
| Interpretability | Often "black-box"; requires XAI (e.g., SHAP) for interpretation [20] | Highly interpretable; main and interaction effects are directly quantified [13] |
| Integration of Prior Knowledge | Enabled via transfer learning and hybrid modeling [17] | Challenging; each DoE is typically treated as a de novo project [17] |
Performance and Experimental Data
Direct comparisons and real-world case studies demonstrate the tangible impact of adopting an ML-DOE framework.
Quantitative Performance Comparison
ML approaches have demonstrated superior performance in several key metrics, including a significant reduction in the number of experiments required and improved predictive accuracy.
Table 2: Summary of quantitative performance data from comparative studies and case studies.
| Application / Case Study | Optimization Method | Key Outcome | Experimental Load |
|---|---|---|---|
| General Bioprocess Characterization [19] | Definitive Screening Design (DSD) | Identified Critical Process Parameters (CPPs) and optimal ranges for pDNA production | >50% reduction vs. traditional DoE |
| CHO Cell mAb Production [21] | Artificial Neural Network (ANN) | Increased final mAb titer by up to 48% | Trained on historical data + new experiments |
| Flaviolin Production in P. putida [13] | Active Learning (Automated Recommendation Tool) | Increased titer by 60-70%; increased process yield by 350% | 15 media designs tested per DBTL cycle |
Detailed Experimental Protocols
To ensure reproducibility, below are the detailed methodologies from two key studies cited in the performance table.
CHO Cell mAb Production Optimization using ANN [21]
- Cell Line and Culture: A CHO DG44 cell line producing an IgG1 mAb was used. Cultivations were performed in a small-scale modular bioreactor system (ambr15) with a working volume of 10–15 mL.
- Data Collection: Online data (pH, dissolved oxygen) and daily offline samples were collected. Offline analysis included viable cell density (VCD), viability, and concentrations of metabolites (glucose, lactate) and mAb (IgG1).
- Data Preprocessing: A dataset of 735 data points was curated. Data cleaning removed 19 points due to contamination or equipment issues. Feature engineering was performed to identify the most important process parameters.
- Model Training and Validation: A Multilayer Perceptron (MLP) was selected after comparing classical methods (Linear Regression, PLS, Random Forest). The ANN was trained on the historical and newly generated data to predict mAb titer based on process parameters.
- Optimization and Validation: The trained model suggested new cultivation settings. These were tested in validation experiments, which confirmed the significant increase in final mAb titer.
Flaviolin Production Optimization via Active Learning [13]
- Semi-Automated Pipeline Setup: A system was created integrating an automated liquid handler, a microbioreactor platform (BioLector), and a microplate reader.
- Active Learning Cycle (DBTL):
- Design: The ML algorithm (Automated Recommendation Tool, ART) suggested 15 media designs by varying the concentrations of 12-13 components.
- Build: The liquid handler automatically prepared the media designs according to ART's instructions.
- Test: The media were dispensed into a 48-well plate, inoculated with engineered P. putida, and cultivated for 48 hours. Flaviolin production was measured via absorbance at 340 nm.
- Learn: Production data and media compositions were stored. ART used these to update its model and recommend a new set of 15 media designs for the next cycle.
- Analysis: After multiple DBTL cycles, Explainable AI techniques were applied to the model to identify the most influential media components, revealing NaCl as a critical factor.
The Scientist's Toolkit: Key Reagents and Materials
The successful implementation of an ML-DOE framework relies on a suite of laboratory technologies and reagents.
Table 3: Essential research reagents and solutions for ML-DOE driven bioprocess optimization.
| Item | Function in the Framework | Example from Research |
|---|---|---|
| Automated Bioreactor Systems | Enables high-throughput, reproducible generation of cultivation data under controlled conditions. | ambr15 system [21]; BioLector [13] |
| Automated Liquid Handlers | Precisely and rapidly prepares complex media designs as specified by the ML algorithm, ensuring consistency. | Central to semi-automated pipelines [13] |
| Chemically Defined Media & Feed | Serves as the base for optimization; a defined composition is essential for modeling input-output relationships. | Sartorius Stedim Cellca platform media [21] |
| High-Throughput Assays | Rapidly quantifies key outputs (e.g., product titer, metabolite concentration) to feed data back to the model. | Cedex Bio Analyzer [21]; Absorbance microplate reader [13] |
| Critical Process Parameter (CPP) Stocks | The variables being optimized (e.g., salts, vitamins, pH, temperature). Their systematic variation drives learning. | NaCl was identified as a key CPP for flaviolin production [13] |
The integration of Machine Learning with Design of Experiments represents a significant leap forward in bioprocess optimization. While traditional DoE remains a valuable tool for simpler, well-understood systems, the ML-DOE framework excels in navigating the complexity and non-linearity inherent in biology. As evidenced by the experimental data, its ability to unlock substantial performance gains—such as 48% higher mAb titers and 350% improved process yields—while simultaneously reducing experimental burden, makes it an indispensable approach for modern researchers and drug development professionals. The future of bioprocess development lies in the continued adoption and refinement of these intelligent, data-driven frameworks.
Identifying the Right Problem Type for Each Approach
In the field of bioprocess development, optimizing culture medium is a critical and costly endeavor. Researchers traditionally relied on Traditional Design of Experiments (DOE), but Machine Learning (ML)-guided approaches are now emerging as a powerful alternative. This guide provides an objective comparison of these methodologies, helping scientists select the right tool based on their project's specific constraints and goals.
At a Glance: DOE vs. Machine Learning
The table below summarizes the core characteristics of each approach to help you make an initial assessment.
| Feature | Traditional Design of Experiments (DOE) | Machine Learning (ML)-Guided Optimization |
|---|---|---|
| Core Philosophy | Statistically driven pre-planned experimental matrices [22] [23] | Iterative, data-driven learning loop; an AI-guided R&D methodology [13] [8] |
| Typical Workflow | Single-phase experiment execution followed by model building and analysis [23] | Cyclic "Design-Build-Test-Learn" (DBTL) process [13] |
| Experimental Efficiency | Number of experiments grows exponentially with variables; efficient for local optimization [8] | 50-90% fewer experiments reported; linear growth with variables; suited for global optimization [13] [8] |
| Data Handling | Best with simple, structured, tabular data [8] | Can handle varied, complex, and unstructured data (e.g., micrographs) [8] |
| Model Output | Polynomial regression models (e.g., linear, quadratic) [22] [23] | Flexible models (e.g., tree-based, neural networks); can provide uncertainty estimates [24] [13] [8] |
| Ideal Problem Scope | Problems with a limited number of variables (factors); local optimization [22] [8] | Multi-dimensional, complex problems with large search spaces; leveraging existing data [13] [8] |
| Key Advantage | Well-established, does not require pre-existing data [8] | High data efficiency and ability to find non-obvious, high-performing conditions [13] [8] |
Quantitative Performance Comparison
Independent studies across various domains consistently show that ML methods can match or surpass the predictive accuracy of models derived from Traditional DOE, while often achieving this with greater experimental efficiency.
The table below presents a comparison of model performance from various optimization studies.
| Study / Application | Methodologies Compared | Key Performance Outcomes |
|---|---|---|
| Flaviolin Production in P. putida [13] | ML-led Active Learning vs. Traditional Baseline | ML led to 60% and 70% increases in titer and a 350% increase in process yield over three optimization campaigns. |
| Diclofenac Potassium Removal [25] | RSM vs. Artificial Neural Network (ANN) | Both models were effective, but the ANN model demonstrated superior predictive accuracy compared to the RSM model. |
| Dyeing Process Optimization [22] | Taguchi vs. Box-Behnken (BBD) vs. Central Composite (CCD) | Taguchi achieved 92% accuracy (most efficient), BBD 96%, and CCD 98% accuracy (most accurate). |
| UBC of Shallow Foundations [24] | Six ML Algorithms (e.g., AdaBoost, kNN, RF) | AdaBoost performed best (Training R²: 0.939, Testing R²: 0.881), demonstrating ML's high predictive capability for complex systems. |
Experimental Protocols in Practice
Understanding the detailed workflows of each approach is crucial for selecting and implementing the right methodology.
Detailed Protocol: ML-Guided Medium Optimization
The following protocol is adapted from a study that optimized flaviolin production in Pseudomonas putida using a active learning pipeline [13]. This molecule- and host-agnostic process can be applied to recombinant protein production.
1. Planning and Initial Data Collection:
- Define the Design Space: Select 12-13 variable medium components (e.g., carbon sources, nitrogen sources, salts, trace metals) and their concentration ranges [13].
- Establish a Baseline: Run initial experiments (e.g., using a standard medium) to establish a baseline production titer or yield [13].
- Build an Initial Dataset: Perform a small, space-filling set of experiments (e.g., 15-20 conditions) to generate the initial data required to train the first ML model [8].
2. ML Model Training and Recommendation:
- Train the Model: Use a machine learning algorithm (e.g., the Automated Recommendation Tool - ART, Random Forest, or Bayesian Optimization) to train a model on the collected dataset. The model learns the complex relationships between medium composition and the output (e.g., protein titer) [13].
- Recommend New Experiments: The ML algorithm selects the next set of promising medium compositions to test. It often uses an "exploration vs. exploitation" strategy, balancing testing of high-performing predictions with testing in uncertain regions of the design space [13] [8].
3. Automated Experimental Execution ("Semi-Automated Pipeline"):
- Media Preparation: Use an automated liquid handler to prepare the recommended medium designs in triplicate or quadruplicate in a 48-well plate [13].
- Cultivation: Inoculate the media and cultivate them in a controlled, automated bioreactor platform (e.g., a BioLector) for a defined period (e.g., 48 hours). This ensures high reproducibility [13].
- Product Quantification: Measure the product (e.g., via absorbance for colored compounds, or HPLC for recombinant proteins) using a microplate reader or other high-throughput systems [13].
4. Analysis and Iteration:
- The new production data is fed back into the database (e.g., Experiment Data Depot - EDD) [13].
- The ML model is retrained with the expanded dataset, and the DBTL cycle repeats until a performance target is met or the experimental budget is exhausted [13].
Detailed Protocol: Traditional DOE for Medium Optimization
This protocol outlines the key stages of a "smart" medium optimization process using Traditional DOE, as applied in recombinant protein production [26] [27].
1. Planning:
- Define Objectives: Identify the key response variables (e.g., protein yield, quality, cell growth) [26].
- Select Factors and Levels: Choose which medium components (factors) to investigate and the concentration ranges (levels) to test. The complexity depends on the number of factors and levels [26].
2. Screening:
- Execute Screening Design: Use a screening design (e.g., a fractional factorial or Plackett-Burman design) to identify which of the many potential medium components have a statistically significant impact on the response variables. This reduces the number of factors for subsequent, more detailed optimization steps [26].
3. Modeling and Optimization:
- Execute Detailed DOE: For the significant factors (typically 3-5), run a more detailed experimental design like a Central Composite Design (CCD) or Box-Behnken Design (BBD) [26] [22] [23].
- Build a Response Model: Use regression analysis to fit a quadratic polynomial model (e.g., using Response Surface Methodology - RSM) to the experimental data. The model describes how the factors influence the response [22] [23].
- Find the Optimum: Use the fitted model to identify the factor levels that theoretically produce the maximum or minimum response (e.g., highest protein yield). This is often visualized with contour plots [23].
4. Validation:
- The optimal conditions predicted by the model are experimentally validated in a follow-up experiment to confirm performance [26].
Decision Framework: Choosing Your Approach
The choice between DOE and ML is not about which is universally better, but which is more suitable for your specific context. The diagram below outlines a decision pathway to guide researchers.
Pathway to Selection:
- Choose Machine Learning when facing high-dimensional problems, seeking a global optimum, or when valuable historical data exists. ML is transformational for exploring vast, complex design spaces efficiently [26] [8].
- Choose Traditional DOE when starting from scratch without pre-existing data, when the system is well-understood with few critical factors, or when project goals are focused on local optimization of a known region [8].
- Consider a Hybrid Strategy for a balanced approach. Use Traditional DOE (e.g., a screening design) to identify the most important factors from a large set, then apply ML for in-depth optimization of those key factors [26].
The Scientist's Toolkit: Key Reagents & Materials
The table below lists essential materials and resources used in the featured experiments, particularly in ML-guided bioprocess optimization.
| Item | Function in the Experiment |
|---|---|
| Automated Liquid Handler | Precisely combines multiple stock solutions to create numerous, distinct medium formulations with minimal human error, enabling high-throughput [13]. |
| Microtiter Plates (e.g., 48-well) | Serve as mini-bioreactors for cultivating dozens of different medium conditions in parallel under controlled conditions [13]. |
| Automated Cultivation Platform (e.g., BioLector) | Provides tight control and real-time monitoring of culture conditions (e.g., O₂, pH, shake speed), ensuring highly reproducible growth data across many samples [13]. |
| Microplate Reader | Enables rapid, high-throughput quantification of the product, such as by measuring absorbance for pigments like flaviolin [13]. |
| Machine Learning Platform | Software (e.g., Citrine, custom scripts with ART) that trains models on experimental data and recommends the next best experiments to run, driving the active learning cycle [13] [8]. |
| Stock Solutions | Concentrated solutions of carbon sources, nitrogen sources, salts, trace metals, and buffers used as building blocks for creating defined medium compositions [13]. |
Key Takeaways for Researchers
- For unprecedented processes with little existing data, Traditional DOE provides a robust, reliable starting point.
- For optimizing complex processes with many interacting variables, ML-driven approaches offer significant efficiency gains and a higher probability of discovering high-performing conditions.
- The future is hybrid: Combining the initial screening power of DOE with the deep optimization capabilities of ML presents a powerful strategy for accelerating bioprocess development.
The decision between Traditional DOE and Machine Learning is strategic. By aligning the problem type with the strengths of each approach, researchers and drug development professionals can dramatically increase their R&D efficiency and achieve superior outcomes.
A Practical Guide to Implementing DOE and ML in Your Lab
In the context of medium formulation and optimization research, a fundamental choice often presents itself: using a traditional Design of Experiments (DoE) approach or employing a Machine Learning (ML)-driven method. While ML optimization offers the power to capture complex, non-linear interactions and can enable rapid project turnaround, its success is almost entirely dependent on the quality and quantity of the data used for its training [28].
Traditional DoE provides a structured, statistical framework for acquiring this essential process knowledge efficiently. It is a systematic approach to planning, conducting, and analyzing controlled tests to determine the relationship between multiple input factors (e.g., component concentrations) and output responses (e.g., cell growth, yield) [29] [30]. This guide will provide a detailed, step-by-step protocol for executing a traditional DoE, serving as a critical reference for comparing its performance and data generation capabilities against ML-based techniques.
Core Concepts: Why Move Beyond One-Factor-at-a-Time?
The "one-factor-at-a-time" (OFAT) approach, where a single variable is changed while all others are held constant, is an intuitive but flawed method for complex systems like medium formulation. Its primary weakness is the inability to detect interactions between factors [29] [31]. For example, the optimal level of a growth factor might depend on the concentration of a specific salt. OFAT experiments would miss this interaction, potentially leading to a suboptimal formulation and an incomplete understanding of the system [31].
Traditional DoE overcomes this by varying all relevant factors simultaneously across a predefined experimental space. This allows researchers to not only measure the individual (main) effect of each factor but also to quantify the interaction effects between them, leading to a more robust and predictive model [29].
Key Terminology of DoE
- Factors: The independent input variables that can be controlled and manipulated (e.g., temperature, pH, concentration of components A, B, C) [29] [32].
- Levels: The specific settings or values chosen for each factor (e.g., for Concentration A: 0.1 g/L (low) and 0.5 g/L (high)) [29].
- Responses: The dependent output variables or measured results (e.g., final titer, cell density, product purity) [29] [32].
- Interactions: Occur when the effect of one factor on the response depends on the level of another factor. Uncovering these is a key advantage of DoE [29] [31].
Experimental Protocol: A Step-by-Step Guide
Executing a traditional DoE for medium formulation is a disciplined process. The following workflow outlines the critical stages, from planning to validation.
Diagram Title: Traditional DoE Workflow
Step 1: Define the Problem and Goals
Clearly state the objective of the experiment. For a medium formulation study, this could be "to maximize final product titer while minimizing impurity levels." Identify the key performance indicators (responses) you need to measure [29].
Step 2: Select Factors and Levels
Identify all potential variables (factors) that could influence the responses. These can be quantitative (e.g., concentration of glucose, glutamine) or qualitative (e.g., supplier of a raw material) [32]. Based on prior knowledge or preliminary experiments, select a realistic and sufficiently wide range for each factor by defining its high and low levels [29] [30]. For a screening design, 2-3 factors each at two levels is a common starting point.
Table: Example Factors and Levels for a Medium Formulation Screening DoE
| Factor Name | Factor Type | Low Level (-1) | High Level (+1) |
|---|---|---|---|
| Glucose Concentration | Quantitative | 2.0 g/L | 6.0 g/L |
| Glutamine Concentration | Quantitative | 2.0 mM | 6.0 mM |
| Serum Percentage | Quantitative | 2% | 5% |
Step 3: Choose an Experimental Design
The choice of design depends on the number of factors and the goal of the study.
- Full Factorial Design: The gold standard for investigating a small number of factors (typically ≤ 4). It tests every possible combination of factor levels. For k factors each at 2 levels, it requires 2k runs. This design can estimate all main effects and all interactions [29] [30].
- Fractional Factorial Design: An efficient alternative for screening a larger number of factors (e.g., 5-10). It tests only a carefully selected fraction of the full factorial combinations, sacrificing the ability to measure higher-order interactions in exchange for a significantly reduced number of experiments [29].
For the 3-factor example in the table above, a full factorial design would require 2³ = 8 unique experimental runs.
Table: Full Factorial Design Matrix for 3 Factors
| Run Order | Glucose | Glutamine | Serum | Response: Titer |
|---|---|---|---|---|
| 1 | -1 (2.0 g/L) | -1 (2.0 mM) | -1 (2%) | To be measured |
| 2 | +1 (6.0 g/L) | -1 (2.0 mM) | -1 (2%) | ... |
| 3 | -1 (2.0 g/L) | +1 (6.0 mM) | -1 (2%) | ... |
| 4 | +1 (6.0 g/L) | +1 (6.0 mM) | -1 (2%) | ... |
| 5 | -1 (2.0 g/L) | -1 (2.0 mM) | +1 (5%) | ... |
| 6 | +1 (6.0 g/L) | -1 (2.0 mM) | +1 (5%) | ... |
| 7 | -1 (2.0 g/L) | +1 (6.0 mM) | +1 (5%) | ... |
| 8 | +1 (6.0 g/L) | +1 (6.0 mM) | +1 (5%) | ... |
Step 4: Conduct the Experiments
The experiments must be executed according to a randomized run order generated by statistical software. Randomization is critical to minimize the effects of uncontrolled, "lurking" variables (e.g., minor day-to-day equipment calibration drift) that could bias the results [29] [30].
Step 5: Analyze the Data and Build a Model
Input the experimental results into a statistical software package. The analysis will typically involve:
- Analysis of Variance (ANOVA) to determine which factors and interactions have a statistically significant effect on the responses.
- Generating coefficients for a mathematical model (e.g., a linear or quadratic equation) that describes the relationship between the factors and the response [31].
- Creating visualizations like Pareto charts (to see the relative importance of effects) and interaction plots (to understand how factors influence each other) [30].
Step 6: Validate the Model and Confirm Optimal Settings
Run a small number of confirmation experiments at the factor settings predicted by the model to be optimal. The agreement between the predicted and actual measured values validates the model and confirms the robustness of the optimized medium formulation [29].
The Scientist's Toolkit: Essential Research Reagent Solutions
The following table details key materials and reagents commonly used in bioprocess development and medium optimization studies.
Table: Essential Reagents for Cell Culture Medium Optimization
| Research Reagent | Function in Medium Formulation |
|---|---|
| Basal Medium | Provides the essential foundation of inorganic salts, amino acids, vitamins, and carbohydrates to support basic cellular metabolism and growth. |
| Growth Factors | Proteins (e.g., IGF, FGF) that signal cells to proliferate and survive, directly impacting final cell density and productivity. |
| Serum | A complex, undefined mixture (e.g., Fetal Bovine Serum) that provides a wide range of growth factors, hormones, and attachment factors. |
| Chemically Defined Supplements | Used to replace serum, these precise formulations (e.g., lipids, trace elements) reduce variability and enhance process control. |
| pH Indicator | A dye (e.g., phenol red) that provides a visual assessment of medium pH, serving as an initial check for metabolic activity and culture health. |
Performance Comparison: Traditional DoE vs. Machine Learning
The following table summarizes a objective comparison between Traditional DoE and ML-based optimization based on available literature and practical considerations.
Table: Performance Comparison of Traditional DoE vs. Machine Learning
| Characteristic | Traditional DoE | Machine Learning |
|---|---|---|
| Underlying Approach | Structured, statistical framework based on predefined matrices and linear regression/RSM [29] [31]. | Ensemble of algorithms (e.g., neural networks, random forest) trained on data to capture complex patterns [28]. |
| Data Generation | Active and Direct: Designs and executes specific experiments to efficiently fill the design space [29]. | Passive and Dependent: Requires a pre-existing dataset (often initially generated by DoE) for training [28]. |
| Handling of Interactions | Excellent at detecting and quantifying two-factor interactions; can model higher-order interactions with more complex designs [29]. | Superior at modeling complex, non-linear, and higher-order interactions if the training data is sufficient [28]. |
| Number of Experiments | Highly efficient and predetermined; provides maximum information from a minimum number of runs (e.g., 8 runs for 3 factors) [29] [31]. | Can be high; requires a substantial dataset for accurate training, though it can predict optima without running every possible combination [28]. |
| Interpretability | High: Produces a transparent model (e.g., an equation) where the effect of each factor is clear and quantifiable [30]. | Low (Black Box): The model's predictions can be difficult to interpret and trace back to specific factor contributions. |
| Best Application | Building foundational process understanding, screening critical factors, and initial optimization under a Quality by Design (QbD) framework [29]. | Fine-tuning and optimization within a well-understood design space, especially for systems with known high non-linearity [28]. |
| Computational Cost | Low to moderate. | High, due to the training of complex models. |
| Regulatory Compliance | Well-established and accepted by regulatory bodies like the FDA as part of a QbD paradigm [29]. | Emerging; requires rigorous validation to demonstrate model predictability and reliability. |
Traditional Design of Experiments remains an indispensable tool in the researcher's arsenal, particularly for the initial stages of medium formulation. Its power lies in its systematic, efficient, and transparent approach to building fundamental process understanding. By revealing critical main effects and interactions through a minimal number of experiments, it creates a robust and defensible knowledge base.
In the broader thesis of ML versus traditional DoE, they are not purely adversarial but often complementary. A traditional DoE is frequently the most scientifically sound and resource-efficient method to generate the high-quality initial dataset required to train a powerful ML model. This synergy allows researchers to first establish causal relationships and a stable operating space with DoE, and then leverage ML to navigate that space and uncover deeper, non-linear patterns for ultimate optimization.
The optimization of culture media is a critical, yet notoriously challenging, step in biopharmaceutical development and regenerative medicine. Both media and biological systems are highly complex, with numerous components interacting in non-linear ways that are difficult to predict. For decades, researchers have relied on traditional One-Factor-at-a-Time (OFAT) approaches and statistical Design of Experiments (DOE) methods to navigate this complexity, despite their recognized limitations. The emergence of machine learning (ML) presents a transformative opportunity to enhance these traditional methodologies, particularly when integrated within a structured data foundation.
This guide objectively compares the performance of traditional DOE, ML, and hybrid ML-DOE approaches for medium optimization, drawing on recent experimental studies and providing the methodological details researchers need to implement these strategies effectively.
Traditional vs. Modern Optimization Approaches
Limitations of Traditional Methods
Traditional optimization methods have been widely used but possess significant drawbacks for complex biological systems:
One-Factor-at-a-Time (OFAT): This approach varies a single factor while holding all others constant. While straightforward and widely taught, OFAT provides limited coverage of the experimental space, fails to identify interactions between factors, and is an inefficient use of resources, often missing the optimal solution [5].
Design of Experiments (DOE): DOE employs a structured set of tests to systematically explore the experimental "space." It is more efficient than OFAT, able to establish solutions with minimal resources. However, it typically requires a minimum entry of approximately 10 experiments and may still require running experiments that researchers anticipate will "fail" [5]. Furthermore, DOE methods like Response Surface Methodology (RSM) often rely on quadratic polynomial approximations, which may be too simple to represent the comprehensive interactions in a highly complex medium [33].
The Rise of Machine Learning and Active Learning
Machine learning, particularly active learning, has emerged as a powerful alternative. Unlike traditional DOE, active learning uses ML algorithms to select which experiments to perform next in an iterative loop, dramatically increasing data efficiency [33] [13].
Table 1: Core Characteristics of Different Optimization Frameworks
| Method | Key Principle | Strengths | Weaknesses |
|---|---|---|---|
| OFAT | Vary one factor at a time | Simple to implement and interpret | Inefficient; misses factor interactions; suboptimal solutions |
| Traditional DOE | Structured variation of multiple factors | Systematic coverage; resource-efficient for limited factors | Limited model complexity; struggles with high-dimensionality |
| Machine Learning (ML) | Algorithmic learning from data to make predictions | Handles complex, non-linear relationships; high-dimensional data | Requires large datasets; "black box" interpretation can be challenging |
| Active Learning | ML iteratively selects the most informative experiments | Highly data-efficient; rapidly converges on optima | Complex setup; requires integration of ML and experimental workflows |
Performance Comparison: DOE vs. Machine Learning
Recent experimental studies directly compare the outcomes of these methodologies in biological medium optimization.
Case Study: Mammalian Cell Culture Optimization
A 2023 study optimized a medium for HeLa-S3 cells using a Gradient-Boosting Decision Tree (GBDT) algorithm in an active learning setup, fine-tuning 29 different medium components [33].
Experimental Protocol: The researchers first acquired initial training data by performing cell culture in 232 different medium combinations. Cellular NAD(P)H abundance, measured as absorbance at 450 nm (A450), was used as the indicator for culture quality. The active learning loop involved:
- Training the GBDT model on existing data.
- Using the model to predict promising medium combinations.
- Experimentally validating the top 18-19 predictions.
- Adding the new results to the training dataset and repeating the cycle.
Performance Results: The active learning process successfully fine-tuned the medium, leading to a significant increase in the cellular concentration of NAD(P)H. The model's prediction accuracy improved with each iterative round. The study also developed a "time-saving mode" that used cell culture data from 96 hours instead of 168 hours to guide the optimization of the final endpoint, successfully shortening the development timeline without sacrificing outcome quality [33].
Case Study: Microbial Flaviolin Production
A landmark 2025 study demonstrated a semi-automated, active learning process to optimize the culture medium for flaviolin production in Pseudomonas putida KT2440 [13].
Experimental Protocol: The team created a semi-automated pipeline to test up to 15 medium conditions in triplicate/quadruplicate within three days. The workflow involved:
- An automated liquid handler preparing media from stock solutions.
- Cultivation in an automated bioreactor system (BioLector).
- High-throughput measurement of flaviolin via absorbance.
- The Automated Recommendation Tool (ART) ML algorithm recommending new medium designs for the next cycle.
Performance Results: The active learning process yielded a 60-70% increase in titer and a 350% increase in process yield across three different optimization campaigns. Explainable AI techniques identified that common salt (NaCl) was the most critical component, with an optimal concentration near the tolerance limit of the bacteria—a non-intuitive finding that traditional knowledge-based approaches might have missed [13].
Case Study: Biosurfactant Production with DOE
A 2024 study on optimizing a minimal medium for biosurfactant production by Aureobasidium pullulans utilized a classic two-stage DOE approach [34].
Experimental Protocol:
- Factor Screening: A two-level-factorial design was used to identify the most influential factors.
- Optimization: A Central Composite Design (CCD) was then employed to model the response surface and pinpoint optimal factor levels.
Performance Results: This DOE-based strategy successfully increased the polyol lipid titer by 56% to 48 g L⁻¹ and the space-time yield from 0.13 to 0.20 g L⁻¹ h⁻¹ in microtiter plates. The results were successfully scaled to a 1 L bioreactor, demonstrating the robustness of the model [34].
Table 2: Quantitative Comparison of Experimental Outcomes
| Study & Method | Optimization Target | Key Improvement | Experimental Scale & Efficiency |
|---|---|---|---|
| Hashizume et al. (2023) Active Learning [33] | HeLa-S3 Cell Culture Medium (29 components) | Significant increase in NAD(P)H (culture quality) | 232 initial + ~19/learning cycle; "Time-saving" mode developed |
| Torres et al. (2025) Active Learning [13] | Flaviolin Production in P. putida | 60-70% titer increase; 350% process yield increase | Semi-automated pipeline; 15 designs/3-day cycle |
| Peters et al. (2024) DOE [34] | Biosurfactant Minimal Medium | 56% titer increase (to 48 g L⁻¹) | DOE screening + CCD; Successful scale-up to 1L bioreactor |
The Integrated ML-DOE Workflow
The most powerful approach is a hybrid that leverages the strengths of both DOE and ML. DOE provides an excellent initial structure for data collection, while ML can build more powerful models from that data and guide subsequent experimentation.
The Hybrid Experimental Workflow
The following diagram illustrates a robust, iterative ML-DOE workflow for medium optimization.
Diagram 1: ML-DOE Hybrid Workflow
Key Reagents and Research Solutions
The successful implementation of an ML-DOE strategy relies on a foundation of specific reagents, tools, and technologies.
Table 3: Essential Research Reagent Solutions for ML-DOE Medium Optimization
| Category | Specific Item / Solution | Function in the Workflow |
|---|---|---|
| Cell Culture & Biologicals | HeLa-S3 cell line [33], Pseudomonas putida KT2440 [13], Aureobasidium pullulans [34] | Model organisms for testing and optimizing medium composition. |
| Basal Media & Components | Eagle’s Minimum Essential Medium (EMEM) components [33], Defined Vitamin & Trace Element Solutions [34], Sodium Chloride (NaCl) [13] | The variables to be optimized; provide essential nutrients, growth factors, and osmolality control. |
| Analysis & Assay Kits | CCK-8 Assay Kit [33], BioLector Microbioreactor System [13] | High-throughput methods to quantify key performance indicators (e.g., cell viability, metabolite production). |
| Software & Algorithms | Gradient-Boosting Decision Tree (GBDT) [33], Automated Recommendation Tool (ART) [13], RSM/DOE Software (JMP, Modde, Design-Expert) [16] [35] | Machine learning and statistical algorithms for data analysis, model building, and experimental recommendation. |
| Automation Hardware | Automated Liquid Handlers [13], Microplate Readers [33] [13] | Enables semi-automated, high-throughput experimentation necessary for generating large, consistent datasets. |
The integration of Machine Learning with Design of Experiments represents a paradigm shift in medium optimization research. While traditional DOE remains a valuable tool for initial structured investigation, the evidence shows that ML-driven active learning can achieve superior outcomes, especially in highly complex, multi-component systems. The key to success lies in building a robust data foundation through systematic experimentation, whether initially guided by DOE or directly by ML algorithms. The hybrid ML-DOE approach maximizes efficiency and effectiveness, leveraging the structured planning of DOE with the adaptive, predictive power of ML to uncover non-intuitive optima and accelerate the development of robust, high-performance bioprocesses.
The optimization of culture media is a pivotal challenge in biotechnology and pharmaceutical development, directly impacting the success of cell culture systems, bioproduction efficiency, and the consistent quality of biologics. Traditional approaches to this problem have predominantly relied on statistical Design of Experiments (DOE) methodologies. However, these conventional methods often struggle with the complex, nonlinear interactions present in biological systems. In recent years, machine learning (ML) has emerged as a transformative tool, enabling more efficient, precise, and adaptive optimization strategies. This guide provides a objective comparison between these methodologies, focusing on their application within closed-loop, adaptive workflows for medium optimization.
The fundamental limitation of traditional methods like one-factor-at-a-time (OFAT) or even standard DOE is their inability to efficiently capture complex interactions between culture parameters and medium components [6]. In contrast, ML-driven approaches utilize large datasets and advanced algorithms to uncover hidden patterns and predict optimal conditions, even when the underlying biological mechanisms are not fully understood [6]. This capability is particularly valuable for optimizing Critical Quality Attributes (CQAs), such as charge heterogeneity in monoclonal antibodies [6], or for enhancing the titers, rates, and yields (TRY) needed for commercial viability in synthetic biology [13].
Methodological Comparison: Experimental Protocols and Workflows
Traditional DOE Workflow
Traditional DOE relies on statistically planned experiments to explore a predefined parameter space. The workflow is generally linear and requires complete execution before analysis.
- Pre-experimental Planning: Researchers first identify the factors (e.g., concentrations of medium components like glucose, metal ions, amino acids) and their ranges. A specific statistical design (e.g., Full Factorial, Central Composite Design (CCD), or Latin Hypercube Design (LHD)) is then selected to generate a fixed set of experimental runs [36] [7].
- Experiment Execution: All experiments in the design are conducted, often in a randomized order to minimize bias. This step involves preparing media according to the specified combinations and cultivating cells or microorganisms.
- Data Analysis and Modeling: After all data is collected, a model (typically a second-degree polynomial in Response Surface Methodology) is fitted to characterize the relationship between the factors and the target response (e.g., cell growth, product titer) [13].
- Optimization and Verification: The fitted model is used to predict the optimum conditions, which must then be validated through a final confirmatory experiment.
ML-Mediated Adaptive Closed-Loop Workflow
The ML-driven workflow is an iterative, closed-loop process that leverages machine learning to intelligently select the most informative experiments to run next. A prominent framework for this is the Design-Build-Test-Learn (DBTL) cycle [13].
Figure 1: The ML-mediated adaptive closed-loop workflow, based on the Design-Build-Test-Learn (DBTL) cycle. This iterative process allows for continuous optimization based on incoming data [13].
- Initial Design: The process often begins with a small, space-filling initial design (e.g., a Latin Hypercube) to gather a first dataset that broadly covers the parameter space [36].
- Build and Test: This phase involves the high-throughput, semi-automated execution of experiments. For example, an automated liquid handler prepares media, which is then dispensed into multi-well plates for cultivation in a bioreactor platform. Product formation is measured via a microplate reader or HPLC [13].
- Learn: A machine learning model (e.g., the Automated Recommendation Tool, ART) is trained on all accumulated data to learn the complex relationships between medium composition and the performance output [13].
- Recommend: The trained ML algorithm then recommends a new set of promising medium compositions expected to improve performance. These recommendations are based on the model's predictions and an internal assessment of uncertainty or potential gain.
- Iterate: The loop continues until a performance target is met or resources are exhausted. This active learning process dramatically increases data efficiency by focusing experiments on the most promising regions of the parameter space [13] [37].
Performance Comparison: Quantitative Data Analysis
The following tables summarize experimental data from published studies, providing a direct comparison of the performance achievable with traditional versus ML-driven optimization methods.
Table 1: Comparison of optimization performance in different bioproduction case studies.
| Host Organism / System | Target Product / Goal | Traditional DOE Result | ML-Driven Adaptive DOE Result | Key Improvement | Source |
|---|---|---|---|---|---|
| Pseudomonas putida | Flaviolin Titer | Baseline (Reference) | 60-70% increase in titer | ~65% average titer increase | [13] |
| Pseudomonas putida | Flaviolin Process Yield | Baseline (Reference) | 350% increase | 3.5-fold higher yield | [13] |
| CHO Cell System | Charge Variant Control | Failed to capture complex interactions | Effectively modeled and reduced variants | Improved CQA consistency | [6] |
| Mammalian Cell Culture (HeLa) | Cell Growth / Tailored Media | Suboptimal, knowledge-based formulation | Data-driven optimization of EMEM base medium | Improved cell growth and targeted gene expression | [37] |
Table 2: Characteristics and resource requirements of different optimization strategies.
| Characteristic | Traditional DOE (e.g., CCD, RSM) | ML-Driven Adaptive DOE |
|---|---|---|
| Underlying Principle | Statistical planning and polynomial modeling | Machine learning and active learning |
| Handling of Complexity | Struggles with high-dimensional, nonlinear problems | Excels at modeling complex, nonlinear interactions |
| Data Efficiency | Lower; requires a fixed set of runs upfront | Higher; focuses on informative experiments, reducing total runs needed [13] |
| Experimental Workflow | Linear and fixed | Iterative, closed-loop (DBTL) |
| Adaptability | Low; new factors require a new design | High; model updates with new data |
| Implementation Barrier | Lower, well-established software and training | Higher, requires ML expertise and often automation |
| Optimal Use Case | Characterizing processes with limited factors and expected linear/quadratic behavior | Optimizing complex systems with many interacting factors and noisy data |
Successful implementation of an adaptive DOE workflow, particularly one involving ML, relies on a combination of biological, computational, and analytical components.
Table 3: Key research reagent solutions and resources for ML-driven medium optimization.
| Tool / Resource | Function / Description | Example in Context |
|---|---|---|
| Automated Liquid Handler | Precisely dispenses medium components to assemble numerous media designs with high reproducibility. | Critical for the "Build" phase in the DBTL cycle to ensure accuracy and speed [13]. |
| Micro-Bioreactor System | Provides controlled, parallel cultivation with online monitoring of parameters like pH and dissolved oxygen. | Systems like the BioLector offer high reproducibility and data density for the "Test" phase [13]. |
| Analytical Instrumentation | Quantifies product titer, cell density, and critical quality attributes. | Microplate readers (for absorbance/fluorescence), HPLC, and capillary electrophoresis for charge variant analysis [6] [13]. |
| Active Learning Software Platform | The core ML engine that learns from data and recommends new experiments. | Tools like the Automated Recommendation Tool (ART) guide the optimization process [13]. |
| Data Management System | A centralized database to store and manage all experimental designs, process data, and results. | Systems like the Experiment Data Depot (EDD) are essential for tracking iterations in a DBTL cycle [13]. |
| Cell Line / Microbial Strain | The biological system of interest, engineered for production if necessary. | Engineered P. putida for flaviolin production [13] or CHO cells for mAb production [6]. |
| Chemical Stock Solutions | The library of medium components (salts, sugars, amino acids, vitamins, inducters) used to formulate media. | Components like NaCl were surprisingly identified as the most important for flaviolin production in P. putida [13]. |
The empirical data and case studies presented in this guide demonstrate a clear paradigm shift in medium optimization. While traditional DOE methods remain valuable for characterizing well-behaved systems with a limited number of factors, ML-driven adaptive DOE offers superior performance for navigating the high-dimensional, nonlinear landscapes typical of biological processes. The key advantage of the adaptive closed-loop workflow is its data efficiency, leveraging active learning to minimize the number of experiments required to reach a performance target [13] [36].
Future developments in this field will likely focus on increasing the accessibility and robustness of these methods. This includes the development of more user-friendly AutoML platforms tailored to biological data [36], strategies to manage data quality and model interpretability challenges [6], and the creation of clearer regulatory pathways for model-informed processes [38]. As these tools mature, ML-driven adaptive DOE is poised to become the standard for bioprocess optimization, enabling more rapid development of robust and economically viable bioprocesses.
The optimization of cell culture media is a critical step in biopharmaceutical development, directly impacting the yield, quality, and cost of therapeutic products like monoclonal antibodies (mAbs) and cell therapies. For decades, statistical Design of Experiments (DoE) has been the cornerstone of systematic media development, with Definitive Screening Designs (DSD) emerging as a particularly efficient screening method. DSDs allow researchers to screen a large number of factors—such as nutrients, salts, and trace elements—with a minimal number of experimental runs, providing a significant advantage over traditional One-Factor-at-a-Time (OFAT) approaches [39] [40].
However, the field is now witnessing a paradigm shift with the integration of machine learning (ML). This case study objectively compares the performance of a stand-alone DSD approach against a hybrid methodology that enhances DSD with an ML pipeline. Framed within the broader thesis of machine learning versus traditional DoE, this analysis provides experimental data and protocols to guide researchers and drug development professionals in selecting the most effective optimization strategy for their specific applications [41].
Experimental Design and Protocol: DSD and ML Pipeline
This section details the core methodologies for both the traditional and the hybrid optimization approaches.
Definitive Screening Design (DSD) Protocol
The following protocol outlines the key steps for implementing a DSD in a medium optimization context, as exemplified by the T cell culture case study [40].
- Step 1: Factor and Level Selection: Identify
nmedium components (e.g., amino acids, vitamins, trace elements) to be screened. For each component, define a high (+) and a low (-) concentration level based on prior knowledge or preliminary experiments. In the featured study, 12 major media components were selected for optimization [40]. - Step 2: Experimental Design Generation: Use statistical software to generate a DSD matrix. For
kfactors, a DSD requires only2k + 1experimental runs. For the 12 factors, this resulted in2*12 + 1 = 25unique media formulations [40]. - Step 3: Cell Culture and Data Collection:
- Cells: Primary human CD3+ T cells were purified from multiple healthy donors via negative magnetic bead isolation [40].
- Culture Conditions: Cells were activated with CD3/CD28 beads and cultured in the 25 test formulations, supplemented with IL-7 and IL-15. Cells were cultured in 96-well plates for 6 days [40].
- Response Measurement: Key response variables were recorded:
- Cell Viability: Measured on day 3 using 7-AAD staining and flow cytometry.
- Cell Expansion: Total cell count determined on day 6 using flow cytometry [40].
Machine Learning Pipeline Protocol
The traditional DSD workflow was enhanced with a machine learning pipeline to create a "one-time optimization" protocol [40].
- Step 1: Data Preprocessing: The experimental data from the DSD (25 formulations × donor responses) served as the training dataset for the ML models.
- Step 2: Model Training and Selection: For each donor and each response variable (viability and expansion), multiple competitive ML algorithms were trained and evaluated. This included:
- Elastic Net Regularized General Linear Models: Helps in feature selection and handles multicollinearity.
- Random Forest: An ensemble method that captures complex, non-linear interactions between medium components [40].
- Models were evaluated based on prediction accuracy (e.g., R² > 0.92, RMSE < 1.5) [40].
- Step 3: In Silico Prediction and Formulation Selection:
- The best-performing models were used to predict T cell viability and expansion for 105 random, in silico-generated media formulations for each donor.
- The top 40 predicted formulations for each donor and response were pooled.
- Unsupervised k-means clustering was applied to this pool to identify groups of similar formulations that performed well across all donors.
- The median value of each media component within a cluster was calculated to define a single, consensus "cluster medium" formulation for experimental testing [40].
The workflow below illustrates the hybrid DSD-ML pipeline.
Performance Comparison: DSD vs. DSD-ML Hybrid
The following table summarizes the quantitative outcomes and characteristics of the two approaches based on the experimental case study [40].
Table 1: Performance comparison of traditional DSD and hybrid DSD-ML pipeline
| Feature | Traditional DSD Workflow | DSD with ML Pipeline |
|---|---|---|
| Experimental Scale | 25 formulations (for 12 factors) [40] | Initial 25 formulations + confirmation runs [40] |
| Key Output | Identifies significant factors; a starting point for further optimization [40] | A single, optimized "cluster medium" formulation [40] |
| Handling of Donor Variability | Challenging; effect sizes of components are donor-dependent [40] | Robust; creates individual donor models to find a consensus formulation [40] |
| Modeling Approach | Ordinary Least Squares (OLS) regression; interpretable but less complex [40] | Competitive ML (Elastic Net, Random Forest); high accuracy, less interpretable [40] |
| Predicted vs. Actual Expansion | Not fully detailed for OLS model | Precisely matched average prediction from donor models (R² > 0.92, RMSE < 1.5) [40] |
| Final Performance (Expansion) | Serves as a baseline | 2.3-fold higher than reference medium; outperformed other test media [40] |
The Scientist's Toolkit: Essential Research Reagents
Table 2: Key reagents and materials for DSD-based T cell medium optimization
| Reagent/Material | Function in the Experiment |
|---|---|
| Primary Human CD3+ T Cells | The primary biological system for evaluating medium performance; sourced from multiple donors to assess variability [40]. |
| Definitive Screening Design (DSD) | The statistical framework for efficiently screening a large number of medium components with a minimal set of experiments [40]. |
| Base Medium | A proprietary, serum-free formulation serving as the foundation to which the 12 tested components were added [40]. |
| CD3/CD28 Activation Beads | Simulate antigen presentation to activate T cells, initiating proliferation and mimicking physiological conditions [40]. |
| Recombinant Human IL-7 and IL-15 | Critical cytokines that promote T-cell survival, homeostatic proliferation, and maintenance of a naive/memory phenotype [40]. |
| Elastic Net & Random Forest Algorithms | Machine learning models used to predict cell performance based on medium composition and identify a consensus, high-performing formulation [40]. |
Discussion: ML as a Force Multiplier for Traditional DoE
The experimental data demonstrates that ML does not simply replace traditional DoE but rather augments it. The DSD-ML hybrid approach successfully addressed the primary challenge of donor variability in primary T cells, which often confounds traditional sequential optimization [40]. By building individual models for each donor, the ML pipeline incorporated biological heterogeneity directly into the optimization process, leading to a robust, universally supportive medium.
This aligns with the broader trend in bioprocessing. While systems biology provides mechanistic insights by modeling cellular metabolism, data-driven ML approaches excel at predicting optimal outcomes even when the underlying biological mechanisms are incompletely understood [41]. Advanced ML techniques like active learning and Bayesian Optimization further enhance efficiency by iteratively guiding experiments, balancing exploration of new conditions with exploitation of promising ones, and significantly reducing the experimental burden [42] [43] [44]. For instance, one study using Bayesian Optimization for PBMC culture media achieved optimization with 3-30 times fewer experiments than a standard DoE approach [43].
The conceptual relationship between these methodologies is illustrated below.
This case study demonstrates that while Definitive Screening Designs remain a powerful and efficient tool for screening critical medium components, their limitations in handling complex biological variability can be overcome by integration with a machine learning pipeline. The data shows that the DSD-ML hybrid approach enabled a "one-time optimization," successfully yielding a formulated medium that significantly enhanced T cell expansion across a diverse donor pool [40].
The future of cell culture medium optimization lies not in a contest between traditional and modern methods, but in their strategic integration. The combination of statistically rigorous experimental design, like DSD, with the predictive power and adaptability of machine learning creates a robust framework for accelerating bioprocess development and meeting the demanding standards of therapeutic manufacturing [41] [39] [40].
In the competitive and high-stakes realm of biopharmaceutical manufacturing, maintaining consistent bioreactor operation is paramount. Unplanned downtime or subtle process deviations can compromise product quality and lead to multimillion-dollar losses [45]. For decades, the industry has relied on traditional Design of Experiments (DOE) and reactive maintenance strategies. However, these methods often fail to capture the complex, nonlinear interactions inherent in living biological systems [6]. The emergence of Machine Learning (ML) presents a paradigm shift, enabling a new era of predictive maintenance (PdM). This case study objectively compares the application of traditional DOE with ML-DOE hybrid frameworks for predictive maintenance in bioreactor operations, providing experimental data and protocols to guide researchers and drug development professionals.
Performance Comparison: Traditional DOE vs. ML-DOE
The following tables synthesize quantitative data from experimental studies, comparing the performance of traditional approaches against ML-DOE in modeling and optimizing bioreactor processes.
Table 1: Model Performance Metrics for a Simulated Bioprocess (2x3 ODE system) [46]
| Modeling Approach | R² | RMSE | Computational Efficiency | Ability to Capture Nonlinear Dynamics |
|---|---|---|---|---|
| ML Models: Autoregressive ANN | >0.95 | Lowest | High | Excellent |
| ML Models: LSTM | 0.90-0.94 | Very Low | Medium | Very Good |
| Transfer Function | 0.85-0.89 | Low | High | Good |
| Non-ML: Multiple Linear Regression (MLR) | 0.70-0.80 | Moderate | Very High | Poor |
Table 2: Performance in Media Optimization and Control [46] [13] [6]
| Aspect | Traditional/DOE Approach | ML-DOE Hybrid Approach |
|---|---|---|
| Experimental Efficiency | Low; requires many runs (e.g., 510 for 10 components) [13] | High; active learning minimizes experiments (e.g., 15-20 designs) [13] |
| Titer/Yield Improvement | Moderate, often suboptimal | 60-70% increase in titer; 350% increase in process yield demonstrated [13] |
| Handling of Non-linear Interactions | Limited, often pre-defined | Excellent, discovered automatically (e.g., identified NaCl as key factor) [13] |
| Real-time Predictive Capability | Not feasible for real-time control | Enabled model predictive control (MPC) with high accuracy [46] |
| Failure Forecasting Accuracy | N/A (Not designed for PdM) | High; models show high precision/recall in forecasting equipment faults [45] |
Experimental Protocols for ML-DOE in Predictive Maintenance
Implementing an ML-DOE framework for bioreactor predictive maintenance involves a structured, cyclical process. The workflow below integrates the Design-Build-Test-Learn (DBTL) paradigm with PdM objectives.
Phase 1: Data Generation and Preprocessing
Step 1: Define Predictive Target and Install Sensor Ecosystem The objective is to forecast specific equipment failures or process deviations. For a bioreactor agitator, the target is predicting Remaining Useful Life (RUL) based on vibration signatures [45]. The experimental setup involves:
- Sensor Installation: Mounting high-frequency, industrial-grade vibration sensors (e.g., accelerometers) on the agitator's motor and gearbox. These sensors must be housed in enclosures capable of withstanding sterilization-in-place (SIP) procedures [45].
- Data Integration: Correlating vibration data with contextual process data from the SCADA system, such as agitation speed, power draw, dissolved oxygen, and temperature [45].
- Data Collection: Collecting time-series data over multiple bioreactor batches, including data leading up to both normal operation and known failure events.
Step 2: Data Preprocessing and Feature Engineering Raw sensor data is cleaned and transformed to create meaningful features for ML models [47] [48].
- Data Cleaning: Removing erroneous readings and outliers using methods like Interquartile Range (IQR) filtering, replacing extreme values with daily or weekly averages [48].
- Feature Extraction: For vibration data, this involves applying Fourier transforms to convert time-domain signals into frequency-domain spectra. Rolling averages and Z-scores are also calculated to identify trends and anomalies [47].
- Data Structuring: The cleaned dataset is split into training, validation, and test sets, typically in a 12:1:1 month ratio for a 14-month dataset [48].
Phase 2: Active Learning and Model Development
Step 3: Active Learning-Driven Experimental Design Instead of testing all possible factor combinations, an active learning algorithm like the Automated Recommendation Tool (ART) is used [13]. The protocol is:
- The algorithm is initialized with a small, diverse set of historical operational data.
- After each batch, the ML model analyzes the results and recommends the next set of process parameters or operating conditions to test, focusing on areas with high uncertainty or high potential for improving performance or failure understanding.
- This creates a semi-automated DBTL cycle, dramatically reducing the number of experiments needed to identify optimal and failure-boundary conditions [13].
Step 4: Model Training and Validation Multiple ML algorithms are trained and compared for predictive accuracy.
- Model Selection: Common architectures for time-series data in bioprocesses include:
- CNN-LSTM Hybrid: Combines Convolutional Neural Networks (CNN) to identify critical feature patterns at specific moments with Long Short-Term Memory (LSTM) networks to forecast future dynamics. This architecture is particularly effective for multi-dimensional, nonlinear time-series data [48].
- Random Forest: Effective for classification tasks, such as identifying different failure modes [47].
- Anomaly Detection Models (e.g., Autoencoders): Learn the "normal" operating signature and flag any deviations, catching novel problems [45].
- Model Training: Models are trained on historical data. For a CNN-LSTM, the CNN layer first extracts features from input sequences, which are then passed to the LSTM layer to learn temporal dependencies [48].
- Validation and Metrics: Models are evaluated on the hold-out test set. Key metrics include:
Phase 3: Deployment and Continuous Improvement
Step 5: Deployment for Real-Time Prediction The validated model is deployed in a real-time monitoring system.
- Edge Computing: For low-latency, critical predictions, the model can be deployed on edge devices for immediate analysis of sensor data on the factory floor [47].
- Alert Generation: The system raises alerts when predictions exceed predefined thresholds (e.g., a 15% increase in vibration RMS over 72 hours [45]), generating work orders in the Computerized Maintenance Management System (CMMS).
Step 6: Continuous Learning The model's performance is continuously monitored. As new operational and failure data is collected, the model is periodically retrained to improve its accuracy and adapt to process changes, closing the DBTL loop [47].
The Scientist's Toolkit: Essential Research Reagents and Solutions
Table 3: Key Research Reagent Solutions for ML-DOE Experiments
| Item | Function in ML-DOE Experimental Protocol |
|---|---|
| IIoT Sensor Network (Vibration, Thermal, Acoustic) [45] | The data source for predictive models. Monitors equipment health parameters (e.g., imbalance, bearing wear, temperature) in real-time. |
| Automated Cultivation Platform (e.g., BioLector) [13] | Provides high-quality, reproducible cultivation data under tightly controlled conditions, essential for training reliable ML models. |
| Automated Liquid Handler [13] | Enables rapid, precise, and repeatable preparation of media or feed conditions as dictated by the active learning algorithm's experimental design. |
| Process Analytical Technology (PAT) (pH, DO, Metabolite Probes) [46] | Generates real-time, high-frequency data on Critical Process Parameters (CPPs) and Critical Quality Attributes (CQAs), forming the basis for soft sensors. |
| Data Repository (e.g., Experiment Data Depot - EDD) [13] | A centralized, structured database for all experimental data (process parameters, sensor readings, outcomes), crucial for accessible and auditable ML training. |
| ML Frameworks (e.g., TensorFlow, PyTorch, Scikit-learn) [47] | Provides the algorithmic toolkit for building, training, and validating predictive maintenance models (e.g., CNN-LSTM, Random Forest). |
The experimental data and protocols presented in this case study demonstrate a clear and objective advantage of ML-DOE frameworks over traditional approaches for predictive maintenance in bioreactor operations. The ability of ML models, particularly hybrids like CNN-LSTM, to learn complex, nonlinear relationships from high-dimensional data enables them to accurately forecast failures and optimize processes in ways that are computationally intractable for traditional DOE or mechanistic models alone [46] [48]. While challenges regarding data quality, model interpretability, and regulatory compliance remain, the integration of explainable AI (XAI) techniques and robust data integrity practices paves the way for widespread adoption [49] [6]. For researchers and scientists, mastering this ML-DOE paradigm is no longer optional but essential for advancing the reliability, efficiency, and productivity of modern biomanufacturing.
Overcoming Common Challenges and Maximizing Experimental Efficiency
Design of Experiments (DOE) is a statistical methodology used for planning and conducting experiments, analyzing the resulting data, and interpreting the outcomes to efficiently achieve research objectives. It represents a powerful approach for optimizing processes and products by systematically investigating the effects of multiple variables and their interactions. In fields ranging from chemical engineering to biotechnology, DOE has been a cornerstone for quality control and process improvement, enabling researchers to move beyond inefficient one-factor-at-a-time (OFAT) approaches. The method employs controlled tests to model relationships between input factors (independent variables) and observed responses (dependent variables), allowing for evidence-based decisions with minimal experimental runs. The fundamental goal is to extract maximum information from limited resources while maintaining statistical validity [35] [50].
Despite its theoretical advantages, traditional DOE implementation faces significant practical challenges that limit its effectiveness in modern research environments. Conventional DOE methods are rooted in statistical and combinatorial theory, with software packages such as JMP and Minitab forming the cornerstone of current practice. These tools have evolved to offer extensive statistical models for different experimental scenarios and sophisticated graphical analysis capabilities. However, organizations frequently encounter substantial barriers when implementing these methods, including resistance to changing established workflows, perceived complexity requiring specialized training, and the need for significant statistical expertise to select appropriate models and interpret results correctly. These challenges often restrict DOE usage to a small group of expert statisticians rather than being accessible to the broader research community [51].
The most pressing limitations of traditional DOE fall into two primary categories: methodological complexity and substantial experimental burden. The methodological complexity stems from the need for researchers to possess considerable statistical knowledge to select appropriate experimental designs, determine optimal factor levels, and correctly interpret resulting models and diagnostics. This complexity is particularly pronounced in multifactorial or non-linear scenarios where traditional DOE methods struggle to capture intricate relationships between variables. Meanwhile, the experimental burden arises from the fundamental requirement of traditional DOE to explore the entire design space with a sufficient number of experimental runs to build reliable models. Although DOE theoretically reduces experiments compared to OFAT approaches, it still generates a relatively high experimental load, consuming significant time, resources, and materials—particularly problematic in research areas where these are limited or expensive [51] [50].
Critical Analysis of Traditional DOE Limitations
Methodological Complexity and Statistical Barriers
Traditional DOE presents significant methodological challenges that hinder its broader adoption in research settings. The first major barrier is the substantial statistical expertise required to implement these methods effectively. Researchers must possess familiarity with statistical methods to select appropriate models for different experimental scenarios, properly configure experimental designs, and accurately interpret the resulting output. This requirement often limits DOE usage to specialized statisticians or highly trained experts, excluding many domain specialists who could otherwise benefit from these approaches. The complexity is not merely theoretical; conventional DOE software interfaces often presume comfort with statistical concepts and terminology, creating a steep learning curve that demands initial training investment. In environments where time is limited and budgets are constrained, organizations often avoid implementing DOE or restrict it to a few specialized users, thereby limiting its organizational impact [51].
The second significant challenge involves handling complex experimental scenarios, particularly those involving multiple interacting factors or non-linear system responses. Traditional DOE methods struggle with multifactorial designs, which remain complicated to implement and interpret. As a result, many DOE approaches intentionally limit the number of input variables varied simultaneously, potentially missing important interactions or optimization opportunities. Furthermore, standard DOE methods typically lack the flexibility to effectively model complicated non-linear responses to input variables in an experiment. This limitation is particularly problematic in biological systems and medium optimization research, where response surfaces are rarely simple linear or quadratic relationships. The mathematical models underlying traditional DOE often cannot capture the complex, high-dimensional relationships present in many modern research applications, especially those involving biological systems with intrinsic variability and multiple interacting components [51] [35].
High Experimental Burden and Design Space Challenges
The experimental burden imposed by traditional DOE represents another critical limitation for research applications. While DOE theoretically reduces the number of experiments compared to one-factor-at-a-time approaches, it still requires a substantial number of experimental runs to adequately explore the designated design space and build reliable statistical models. For a full factorial design with k factors, the number of experimental runs required is 2^k, which becomes prohibitively large as the number of factors increases. For example, a two-level design with four factors (2^4) requires 16 runs, while seven factors (2^7) necessitates 128 runs. Although fractional factorial designs can reduce this burden, they still generate a significant experimental load, particularly when multiple replicates are required for statistical power [35].
The fundamental challenge lies in the approach to design space coverage. Traditional DOE methods attempt to define a set of experiments that comprehensively explore the entire chosen design space. Unless used with exceptional care, DOE can generate a relatively high experimental burden that may be impractical in resource-constrained research environments. As a user, it is possible to limit this space, but doing so risks excluding potential solutions that may not be intuitively obvious at the experimental design stage. This approach of "one big experiment" is often less effective than an iterative, sequential strategy, though the latter requires additional planning and coordination. The practical considerations for DOE implementation—including checking gauge performance, ensuring all planned runs are feasible, watching for process drifts, maintaining effective ownership of each step, and preserving all raw data—further contribute to the experimental burden and complexity [51] [52].
Table 1: Quantitative Experimental Burden of Traditional DOE Designs
| Design Type | Number of Factors | Number of Experimental Runs | Key Limitations |
|---|---|---|---|
| Full Factorial | 3 | 8 (2^3) | Becomes prohibitive with increasing factors |
| Full Factorial | 4 | 16 (2^4) | Rapid expansion of experimental requirements |
| Full Factorial | 7 | 128 (2^7) | Completely impractical for most research settings |
| Fractional Factorial | 8 | 256 (2^8) with half fraction | Still substantial resource commitment |
| Genetic Pathway Optimization | 8 genes with 3 regulatory levels each | 6561 (3^8) | Intractably large for conventional DOE |
Machine Learning-Enhanced DOE as a Solution
Adaptive DOE and Machine Learning Integration
Machine learning-enhanced DOE represents a paradigm shift in experimental design, directly addressing the core limitations of traditional approaches. Unlike conventional DOE that requires pre-specified statistical models and comprehensive design space coverage, ML-enhanced methods employ adaptive, iterative approaches that dramatically reduce experimental burden while maintaining or improving model accuracy. The fundamental innovation lies in using machine learning to "train" a model by learning from existing data without requiring users to select specific statistical approaches. The model self-adjusts to the experimental scenario, eliminating the need for deep statistical expertise and making sophisticated experimental design accessible to domain specialists [51].
The most significant advancement comes through adaptive DOE methodologies that leverage machine learning's predictive capabilities. Instead of attempting to cover all available design space with experiments, ML algorithms identify which experiments are most likely to deliver results that approach user-specified targets. This iterative, target-driven approach has demonstrated 50-80% fewer experiments than conventional DOE while achieving equivalent or superior optimization outcomes. The approach is intrinsically multi-factorial and non-linear, automatically capturing complex inter-relationships revealed by data without requiring manual specification of interaction terms or nonlinear transforms. This capability is particularly valuable in medium optimization research where multiple nutrient components, growth factors, and environmental conditions interact in complex ways to influence cellular growth and productivity [51].
Model-based design of experiments (MBDoE) represents another ML-enhanced approach that explicitly addresses prediction uncertainty while optimizing experimental design. Recent advancements like G-map eMBDoE leverage G-optimality to minimize prediction uncertainty across the entire design space, enabling faster reduction of uncertainty on model predictions and parameters. This method has demonstrated superior performance compared to both space-filling designs and standard MBDoE methods, particularly for models of increasing complexity. By mapping model prediction variance and focusing experimental efforts where they provide the most information, these approaches achieve more efficient design space exploration while simultaneously reducing model prediction uncertainty and maximizing parameters precision [53].
Comparative Performance and Experimental Efficiency
The performance advantages of machine learning-enhanced DOE over traditional approaches are substantial and well-documented across multiple research domains. In direct comparisons, ML-enhanced methods consistently achieve equivalent or superior optimization outcomes with significantly fewer experimental iterations. The adaptive nature of these approaches allows for continuous refinement of experimental strategy based on accumulating data, enabling more efficient resource allocation and faster convergence to optimal solutions. This efficiency is particularly valuable in research settings with limited resources, expensive reagents, or time constraints [51] [35].
In tissue engineering applications, ML-enhanced DOE has demonstrated particular effectiveness for optimizing complex processes like 3D bioprinting, where multiple material properties, printing parameters, and biological factors interact to determine construct quality and functionality. Traditional DOE approaches face limitations in these applications due to the high-dimensional parameter space and complex, non-linear relationships between factors. ML algorithms, including artificial neural networks (ANN), convolutional neural networks (CNN), and Bayesian optimization (BO), overcome these limitations by automatically learning complex patterns from data without requiring pre-specified model forms. This capability enables more effective optimization of tissue-engineered constructs while saving time, reducing consumption of laboratory resources, and decreasing overall development costs [35].
Table 2: Performance Comparison: Traditional DOE vs. ML-Enhanced DOE
| Performance Metric | Traditional DOE | ML-Enhanced DOE | Advantage |
|---|---|---|---|
| Experimental Burden | 100% (baseline) | 20-50% of baseline | 50-80% reduction in experiments [51] |
| Statistical Expertise Required | High | Low to Moderate | Democratizes access to sophisticated design |
| Handling of Non-linear Responses | Limited, requires manual specification | Automatic detection and modeling | More accurate process models |
| Multifactorial Optimization | Becomes complex with >4 factors | Intrinsically multi-factorial | Scales effectively with factor number |
| Design Space Exploration | Comprehensive coverage required | Targeted, iterative approach | Focuses resources on promising regions |
| Model Uncertainty Quantification | Limited in conventional approaches | Explicitly modeled and minimized | More reliable predictions |
Experimental Protocols and Methodologies
Traditional DOE Workflow Protocol
The traditional DOE approach follows a systematic, sequential workflow that encompasses planning, execution, analysis, and validation stages. The process begins with problem identification, where researchers clearly define the main project outcomes and objectives. This is followed by structuring the DOE, which involves detailed experimental planning and establishing the mathematical framework for analysis. The critical third step involves determining the specific factors, levels, and responses to be investigated, including identifying response assumptions and defining measurement methodologies. Researchers must carefully select variable ranges and the number of experimental runs, balancing comprehensiveness against practical constraints [35] [52].
Experiments are then conducted according to the predetermined experimental plan, with careful attention to controlling extraneous variables and maintaining consistent conditions. The resulting output data is used to build mathematical models of the studied process, typically using regression analysis to quantify factor effects and interactions. Model evaluation employs diagnostic plots and statistical measures to assess goodness-of-fit and identify potential lack-of-fit. Significant factors are identified through statistical testing, with subsequent optimization experiments conducted to verify the model's optimal responses. The process often concludes with additional testing to address missing data or explore altered factor ranges. Throughout this workflow, practical considerations include checking measurement device performance, ensuring all planned runs are feasible, monitoring for process drifts during execution, maintaining effective ownership of each step, preserving all raw data (not just summary statistics), and thoroughly documenting all experimental conditions and observations [35] [52].
Traditional DOE Sequential Workflow: This linear, predetermined process requires comprehensive planning before experimentation begins, with limited flexibility for mid-course adjustments based on emerging results.
Machine Learning-Enhanced DOE Protocol
Machine learning-enhanced DOE employs an iterative, adaptive workflow that fundamentally differs from the linear traditional approach. The process begins with initial experimental design, which may incorporate any existing historical data or domain knowledge. Unlike traditional DOE, this initial design can be relatively small, as the adaptive nature of the approach will identify informative subsequent experiments. The next stage involves conducting experiments according to the current design, followed by data acquisition and preprocessing to ensure quality and consistency. The core differentiator emerges in the machine learning modeling phase, where algorithms automatically learn relationships between factors and responses without requiring pre-specified model forms [51] [35].
The ML model undergoes rigorous validation using appropriate techniques such as cross-validation or holdout testing to assess predictive performance and guard against overfitting. Based on the validated model, the algorithm identifies the most informative next experiments by analyzing prediction uncertainty and optimization targets. This experimental selection phase represents the key adaptive mechanism, focusing resources on regions of the design space that promise the greatest information gain or progress toward objectives. The selected experiments are then executed, with their results feeding back into the modeling process to refine understanding and guide subsequent iterations. This cyclic process continues until meeting convergence criteria, such as sufficient optimization achievement, diminished improvement returns, or resource exhaustion. Throughout this workflow, ML-enhanced DOE provides natural uncertainty quantification, as the models inherently capture prediction confidence, enabling more informed decision-making [51] [53] [35].
ML-Enhanced DOE Adaptive Workflow: This iterative approach uses machine learning to selectively identify the most informative experiments, creating a feedback loop that continuously refines understanding and focuses resources on promising regions of the design space.
Essential Research Reagent Solutions
Successful implementation of either traditional or ML-enhanced DOE requires appropriate research reagents and materials tailored to the specific application domain. For medium optimization research in pharmaceutical and biotechnological applications, certain core components form the foundation of experimental workflows. The selection of these reagents significantly influences both the experimental process and the resulting outcomes, making careful consideration essential for research planning and execution.
Table 3: Essential Research Reagents for Medium Optimization Studies
| Reagent Category | Specific Examples | Function in Research | Compatibility Notes |
|---|---|---|---|
| Carbon Sources | Glucose, Glycerol, Succinate | Energy source for cellular growth and product formation | Concentration significantly affects yield; often a key DOE factor [50] |
| Induction Agents | IPTG (Isopropyl β-d-1-thiogalactopyranoside) | Induction of recombinant protein expression in bacterial systems | Concentration and timing critically impact protein yield and quality [50] |
| Nitrogen Sources | Ammonium salts, Yeast extract, Peptones | Provides nitrogen for amino acid and nucleotide synthesis | Source and concentration affect growth rates and metabolic activity |
| Promoter Systems | Constitutive, Inducible, Repressible promoters | Control strength and timing of gene expression in engineered systems | Recent advances enable quantitative characterization as continuous variables [50] |
| Selection Markers | Antibiotic resistance genes | Maintenance of plasmid constructs in engineered strains | Choice affects genetic stability and may influence metabolic burden |
| Buffer Components | Phosphates, TRIS, HEPES | pH maintenance and osmotic balance | Critical for reproducible results in biological assays |
| Trace Elements | Metal ions (Mg, Fe, Zn, Ca) | Cofactors for enzymatic reactions and cellular processes | Often interact in complex ways with other medium components |
The comparison between traditional DOE and machine learning-enhanced approaches reveals significant advantages for ML-integrated methods in addressing the dual challenges of complexity and experimental burden. Traditional DOE, while mathematically rigorous and historically valuable, presents substantial barriers including requirements for specialized statistical expertise, limitations in handling complex multifactorial and non-linear scenarios, and significant experimental burdens that strain research resources. These limitations become particularly pronounced in modern research environments characterized by complex biological systems, high-dimensional parameter spaces, and resource constraints [51] [35].
Machine learning-enhanced DOE methodologies directly address these limitations through adaptive, iterative approaches that leverage algorithms capable of learning complex relationships directly from data without requiring pre-specified model forms. The demonstrated 50-80% reduction in experimental requirements, combined with reduced dependency on statistical expertise, makes sophisticated experimental design accessible to broader research communities. The intrinsic capability of ML methods to handle multifactorial and non-linear scenarios enables more accurate modeling of complex biological systems relevant to medium optimization and pharmaceutical development [51] [53] [35].
For researchers and drug development professionals, the implications are substantial. ML-enhanced DOE offers a pathway to accelerate optimization processes, reduce resource consumption, and navigate increasingly complex design spaces more effectively. This advantage is particularly valuable in pharmaceutical development timelines where accelerated process optimization can significantly impact overall development costs and time-to-market. As these methodologies continue evolving and integrating with emerging technologies, their potential to transform research efficiency and effectiveness across multiple domains continues to grow, offering promising avenues for addressing increasingly complex research challenges in medium optimization and beyond.
Table of Contents
- Introduction: The New Frontier in Experimental Design
- Quantitative Comparison: ML-DOE vs. Traditional DOE
- Overcoming Data Scarcity: Strategic Approaches and Experimental Protocols
- Ensuring Data Quality: From Challenge to Solution
- Achieving Model Transparency: A Non-Negotiable for Scientific Trust
- The Researcher's Toolkit: Essential Reagents for ML-DOE
- Conclusion: Navigating the Future of Experimental Optimization
The integration of Machine Learning (ML) with traditional Design of Experiments (DOE) is revolutionizing medium optimization and drug development. This paradigm shift promises to move beyond the constraints of classical statistical designs, enabling the exploration of more complex parameter spaces with greater efficiency. However, this powerful synergy introduces a new set of challenges centered on three core pillars: data scarcity, data quality, and model transparency. For researchers and scientists, navigating these hurdles is critical to building reliable, trustworthy, and effective ML-driven experimental frameworks. This guide provides a objective comparison and detailed methodologies to overcome these obstacles, ensuring that ML-DOE can be implemented with rigor and confidence in scientific research.
Quantitative Comparison: ML-DOE vs. Traditional DOE
The choice between traditional DOE and ML-DOE is not a matter of superiority but of context. The following table summarizes their core performance characteristics based on current research and implementation data.
Table 1: Objective Comparison of Traditional DOE vs. ML-DOE Performance Characteristics
| Characteristic | Traditional DOE | ML-DOE | Supporting Data & Context |
|---|---|---|---|
| Data Efficiency | Less efficient in high-dimensional spaces; requires structured, pre-planned points. [36] | Superior for complex, non-linear systems; uses active learning to sample intelligently. [36] | A 3-level Full Factorial Design for 10 factors requires 59,049 points, often prohibitive. [36] |
| Handling High Dimensions | Struggles as factors increase; relies on fractional designs that may miss interactions. [36] | Excels at exploring high-dimensional parameter spaces and discovering complex interactions. | Space-filling designs and active learning maximize diversity of information from fewer points. [36] |
| Adaptability | Static, one-shot design; cannot incorporate new knowledge during data acquisition. [36] | Highly adaptive; sequential design updates the model to focus on regions of interest or high uncertainty. [36] | Model-based active learning identifies areas "most in demand for exploration" in the parameter space. [36] |
| Transparency & Explainability | Inherently transparent; design structure and analysis are well-established and interpretable. | "Black-box" nature is a significant risk; lack of transparency can erode trust and hinder adoption. [54] [55] | 85% of AI projects fail due to a lack of transparency, and 75% of organizations consider explainability crucial. [54] |
| Performance under Noise | Robust, often includes replication explicitly to quantify and account for noise. | Performance highly dependent on strategy; replication may be better than broad exploration with noisy data. [36] | Studies indicate replication-oriented strategies can be advantageous with non-negligible noise and intermediate resources. [36] |
| Implementation & Skill Barrier | Well-integrated into statistical software; requires statistical expertise. | Faces a significant talent shortage; requires specialized skills in data science and ML. [55] | ~40% of enterprises lack adequate AI expertise internally to meet their goals, creating a major barrier. [55] |
Overcoming Data Scarcity: Strategic Approaches and Experimental Protocols
Data scarcity, defined as the "insufficient availability of high-quality training data," is a fundamental bottleneck that can hinder model development and reduce AI performance. [56] However, several proven strategies and experimental protocols can mitigate this challenge.
Key Strategies to Mitigate Data Scarcity
- Leveraging Proprietary Data: The vast majority of data is proprietary and sits on company servers. The key is unlocking this data, which is often siloed across departments (e.g., CRM, ERP). [56] [55] Centralizing data into data lakes and building integration pipelines is a critical first step. [55]
- Data Augmentation and Synthetic Data: If data volume is low, techniques like data augmentation (modifying existing records) can generate additional training examples. [55] Furthermore, synthetic data tools can create realistic, simulated datasets without compromising privacy or waiting for organic collection. [57] [55] However, caution is advised, as over-reliance on synthetic data can lead to "benchmaxing," where systems perform well on benchmarks but not in the real world. [56]
- Advanced ML Techniques: Methods like transfer learning (using knowledge from a pre-trained model) and few-shot learning (learning from very few examples) are designed to enhance model flexibility in low-data settings. [57] Federated learning allows for training models across multiple decentralized data sources without moving the data, preserving privacy and access to otherwise inaccessible datasets. [55]
Experimental Protocol: An AutoML Workflow for DOE Benchmarking
A robust, automated workflow is essential for fairly evaluating different data sampling strategies under resource constraints. The following protocol, adapted from a study published in Scientific Reports, provides a reproducible methodology for comparing DOE strategies in data-scarce environments. [36]
Diagram 1: AutoML Workflow for DOE Benchmarking
Title: AutoML Workflow for DOE Benchmarking
Detailed Methodology: [36]
- Define Parameter Space and Complexity: Start by defining the input factors and their ranges. Quantify the "complexity" of the problem not just by dimension, but by the data volume required to train a surrogate model to a pre-defined performance threshold (e.g., R² > 0.9) on a large, pre-constructed test set.
- Select Candidate DOE Strategies: Choose a set of strategies to compare. This typically includes:
- Traditional DOE: Central Composite Design (CCD), Latin Hypercube Design (LHD).
- ML-DOE (Active Learning): Strategies such as query-by-committee or Monte Carlo Dropout for uncertainty sampling.
- Generate Training Sets: Use each selected DOE strategy to guide the acquisition of a limited training dataset, simulating a low-data scenario.
- Construct a Large Test Set: Independently, generate a large, comprehensive test set that broadly covers the parameter space. This set is used only for final evaluation, not for training, to ensure a fair assessment.
- Automated ML (AutoML) Modeling: For each generated training set, use an AutoML framework (e.g., auto-sklearn) to automate the model development process. This involves running multiple independent modeling tasks to control for the uncertainty of suboptimal modeling and to identify the best-performing model for each dataset.
- Evaluation and Comparison: The best model from each training set is evaluated on the large, independent test set. The performance of these optimal models (e.g., average R² score) is then used as the quantitative performance measure for the DOE strategy that generated the training data.
This workflow systematically controls for uncertainties in stochastic sampling, modeling, and evaluation, providing a fair and reproducible comparison framework.
Ensuring Data Quality: From Challenge to Solution
Data quality is the most cited technical barrier to AI success, with 64% of organizations naming it their top challenge and 77% rating their own data quality as average or worse. [58] Poor data quality leads to flawed models, unreliable predictions, and significant financial costs, estimated at $15 million annually for the average organization. [59]
Table 2: Common Data Quality Problems and Their Fixes
| Data Quality Problem | Impact on ML-DOE | Evidence-Based Solution |
|---|---|---|
| Incomplete Data (Missing values) [59] | Broken workflows, faulty analysis, biased models. [59] | Implement data validation and presence checks during collection; improve metadata to trace completeness. [59] |
| Inaccurate Data (Errors, discrepancies) [59] | Misleading analytics, incorrect model parameters, regulatory penalties. [59] | Rigorous data cleansing; rule-based validation (format, range); data quality monitoring with alerts. [59] |
| Duplicate Data (Multiple records for one entity) [59] | Redundancy, skewed statistics, increased storage costs. [59] | De-duplication processes using fuzzy matching or ML models; implement unique identifiers. [59] |
| Inconsistent Data (Conflicting values across systems) [59] | Erodes trust, causes decision paralysis, leads to audit issues. [59] | Establish and enforce clear data standards and a "single source of truth"; use metadata for harmonization. [59] |
| Outdated Data (No longer current or relevant) [59] | Decisions based on obsolete information, lost revenue. [59] | Schedule regular data audits; implement data aging policies and refresh procedures. [59] |
Achieving Model Transparency: A Non-Negotiable for Scientific Trust
The "black-box" nature of complex ML models, particularly deep learning, poses a significant risk for scientific applications. A lack of transparency can decrease trust, reduce adoption, and invite regulatory scrutiny. [54] This is critically evident in regulated fields like healthcare, where a study of FDA-reviewed AI/ML medical devices found major transparency gaps, with an average score of only 3.3 out of 17 on a transparency reporting metric. [60]
Explainable AI (XAI) Techniques
To build trust, models must provide explanations for their decisions. Explainable AI (XAI) tools and techniques are essential, with the market expected to grow significantly. [54]
- Local vs. Global Explanations: Local explanations focus on individual predictions, answering "Why did the model make this specific prediction?" (e.g., using feature importance scores for a single data point). Global explanations aim to understand the model's overall behavior and decision-making logic across the entire parameter space. [54]
- Technical vs. User-Friendly Explanations: The type of explanation must be tailored to the audience. Technical explanations (e.g., feature importance plots, partial dependence plots) are suitable for ML engineers, while business stakeholders and scientists need user-friendly explanations that tie model outputs to domain knowledge and business KPIs. [54]
Decision Framework for Implementing Transparency
The following diagram outlines a strategic approach to integrating transparency into the ML-DOE lifecycle, ensuring it is considered at every stage from problem definition to deployment and monitoring.
Diagram 2: XAI Implementation Strategy
Title: XAI Implementation Strategy
Key Actions:
- Define Transparency Needs: Identify stakeholders (regulators, scientists, engineers) and determine the required level and type of explanation (local/global, technical/user-friendly). [54]
- Select Appropriate XAI Techniques: Integrate tools that provide model interpretability, such as SHAP or LIME, into the model development pipeline. [54]
- Document and Report Comprehensively: Follow GxP-like principles. Publicly document data sources (including demographics), dataset sizes, model architecture, and a comprehensive set of performance metrics (sensitivity, specificity, PPV, NPV, AUROC) for the overall population and key subgroups. [60]
- Establish Human Oversight and Feedback: Implement a "human-in-the-loop" system where domain experts review AI-driven results, especially early on. Create continuous feedback loops to refine the AI system based on real-world use. [55]
The Researcher's Toolkit: Essential Reagents for ML-DOE
Successfully implementing an ML-DOE framework requires a suite of methodological and software tools. The following table details key solutions and their functions in the context of mitigating the core hurdles.
Table 3: Research Reagent Solutions for ML-DOE Implementation
| Solution Category | Specific Tool/Technique | Primary Function in ML-DOE |
|---|---|---|
| Data Scarcity Mitigation | Synthetic Data Generation | Creates realistic, privacy-preserving data to augment small experimental datasets. [57] [55] |
| Transfer Learning | Leverages knowledge from pre-trained models on large datasets to bootstrap models with limited new data. [57] | |
| Active Learning Sampling | Intelligently selects the most informative next experiment to run, maximizing knowledge gain from limited resources. [36] | |
| Data Quality Assurance | Automated Data Quality Rules | Defines and monitors rules (e.g., completeness, validity) with real-time alerts for violations. [59] |
| Data De-duplication Tools | Identifies and merges duplicate records using fuzzy matching and ML models. [59] | |
| Data Validation Frameworks | Performs rule-based (format, range) and statistical checks during data ingestion. [59] | |
| Model Transparency & Explainability | Explainable AI (XAI) Platforms | Provides insights into model predictions via local and global explanations (e.g., feature importance). [54] |
| AutoML Frameworks | Automates model selection and tuning, reducing skill barriers and ensuring optimal, reproducible modeling. [36] | |
| Model Cards & Documentation | Standardized reporting for model characteristics, intended use, and performance metrics. [60] |
The integration of Machine Learning with traditional Design of Experiments presents a powerful frontier for accelerating research in medium optimization and drug development. However, this guide's comparison reveals that there is no single best option; the choice is contextual. Traditional DOE offers robustness and transparency in well-characterized, lower-dimensional spaces. In contrast, ML-DOE provides unparalleled efficiency and power for navigating complex, high-dimensional landscapes but demands careful management of data scarcity, quality, and the "black-box" problem. By adopting the strategic frameworks, experimental protocols, and toolkit solutions outlined here—from leveraging synthetic data and AutoML workflows to enforcing rigorous XAI and data governance—researchers can systematically overcome these hurdles. This enables the full potential of ML-DOE to be realized, fostering a future of faster, more insightful, and deeply trustworthy scientific discovery.
Optimizing for Complex, Multifactorial, and Non-Linear Systems
Table of Contents
- Introduction: The Optimization Challenge
- Conceptual Foundations: DOE vs. Machine Learning
- Quantitative Performance Comparison
- Experimental Protocols and Workflows
- Essential Research Reagent Solutions
- Conclusion and Strategic Outlook
Optimizing complex biological systems, such as cell culture media for biopharmaceutical production or metabolite synthesis, is a central challenge in biotechnology and drug development. These systems are inherently multifactorial and non-linear, where interactions between components like pH, temperature, nutrients, and metal ions can profoundly impact critical quality attributes and yields [6]. For decades, Traditional Design of Experiments (DOE) has been the statistical cornerstone for navigating these multi-parameter spaces. However, its limitations in capturing high-dimensional complexity are increasingly apparent [6]. Meanwhile, Machine Learning (ML) has emerged as a transformative tool, promising to decode these intricate relationships. This guide provides an objective comparison of these two methodologies, equipping researchers with the data and insights needed to select the optimal strategy for their specific optimization challenges.
Conceptual Foundations: DOE vs. Machine Learning
While both DOE and ML aim to model and optimize processes, their core philosophies and mechanisms differ significantly. The table below summarizes their fundamental characteristics.
Table 1: Fundamental Characteristics of DOE and Machine Learning
| Feature | Traditional DOE | Machine Learning |
|---|---|---|
| Primary Goal | Establish causal inference and understand factor effects [9] | Make accurate predictions and find global optima [9] [8] |
| Underlying Model | Typically linear or low-order polynomial models (e.g., Response Surface Methodology) [9] | Flexible, non-linear models (e.g., Random Forests, Neural Networks, Gaussian Processes) [61] |
| Approach to Experimentation | Pre-defined, static experimental matrices (e.g., Full Factorial, Central Composite Design) [36] | Iterative, sequential learning where each experiment informs the next [13] [8] |
| Handling of Complexity | Struggles with high-dimensional, complex non-linear interactions [6] | Excels at modeling complex, non-linear interactions and high-dimensional spaces [8] |
| Use of Domain Knowledge | Purely statistical; does not incorporate external domain knowledge [8] | Can incorporate underlying science/domain knowledge to guide the search [8] |
| Data Requirements | Requires its own designed data; cannot leverage existing historical data [8] | Can leverage data from past projects or adjacent domains via transfer learning [8] |
Quantitative Performance Comparison
A rigorous comparison of DOE and ML reveals dramatic differences in efficiency and performance, particularly as system complexity increases.
Table 2: Quantitative Performance and Efficiency Comparison
| Metric | Traditional DOE | Machine Learning | Context and Evidence |
|---|---|---|---|
| Experimental Efficiency | Number of experiments grows exponentially with dimensions [8]. | Number of experiments grows linearly with dimensions [8]; Reduces experiments by 50-90% to reach target [8]. | Case study: ML-led media optimization for flaviolin production in P. putida achieved up to 70% increase in titer and 350% increase in process yield [13]. |
| Predictive Accuracy | Limited by polynomial model structure, often outperformed by ML on complex systems [13]. | Superior for non-linear systems; Neural Networks shown to outperform Response Surface Methodology (RSM) [13]. | Comparative studies show ML models like ANNs and Random Forests achieve higher predictive accuracy with the same data [61]. |
| Noise and Data Handling | Replication-oriented strategies can be advantageous for statistical noise reduction [36]. | Handles complex, unstructured data (e.g., micrographs); performance can be affected by data quality and noise [36] [8]. | A study on electrical circuit models found that with non-negligible noise, replication strategies (common in DOE) should not be dismissed [36]. |
Experimental Protocols and Workflows
Traditional DOE Workflow
The traditional approach is a sequential, knowledge-driven process:
- Screening Designs: Use fractional factorial or Plackett-Burman designs to identify a subset of critical factors from a large pool of potential variables.
- Optimization Designs: Apply Response Surface Methodology (RSM) using designs like Central Composite Design (CCD) or Box-Behnken Design (BBD) to model quadratic relationships and locate optimal conditions [61].
- Model Fitting and Validation: Fit a polynomial model to the experimental data and validate its predictive power with a new set of confirmation experiments.
Machine Learning-Driven Active Learning Workflow
ML introduces an iterative, data-driven cycle known as Design-Build-Test-Learn (DBTL) or Active Learning [13]. The workflow below visualizes this adaptive process, which is particularly powerful for medium optimization.
Diagram 1: ML Active Learning Workflow for Media Optimization. This iterative cycle allows the model to intelligently explore the parameter space, focusing on high-potential or highly informative conditions.
Detailed Methodology for ML-Mediated Medium Optimization:
- Step 1: Initial Data Collection and Pipeline Setup: The process begins with the development of a highly repeatable, often automated, pipeline for high-throughput experimentation. For example, a liquid handler prepares media with specified component concentrations, which are dispensed into multi-well plates, inoculated, and cultivated in a controlled bioreactor [13]. Key output data (e.g., product titer, cell viability, charge variant profiles) are automatically measured and stored in a centralized database [13] [6].
- Step 2: Model Training and Explanation: An initial dataset, which can be from a classical DOE or a space-filling design, is used to train a machine learning model. Common models used in this context include Random Forests, Artificial Neural Networks (ANNs), and Gaussian Processes [61]. Explainable AI (XAI) techniques can then be applied to the trained model to identify which medium components (e.g., salt, metal ions, amino acids) are the most influential drivers of the output, providing valuable biological insights [13].
- Step 3: Active Learning Cycle: The core of the optimization is the iterative loop shown in Diagram 1. The trained ML model predicts the outcomes of thousands of candidate medium formulations. It then recommends the next set of experiments to run, typically focusing on candidates with either the highest predicted performance or the highest prediction uncertainty (to improve the model itself). These experiments are executed in the automated pipeline, and the results are used to retrain and refine the ML model, closing the DBTL loop [13] [8].
Essential Research Reagent Solutions
The successful implementation of these optimization strategies, particularly the ML-driven approach, relies on a suite of key reagents, tools, and platforms.
Table 3: Key Research Reagent Solutions for Medium Optimization
| Category | Item | Function in Optimization |
|---|---|---|
| Medium Components | Amino Acids | Building blocks for protein synthesis; specific types can influence post-translational modifications like charge heterogeneity in mAbs [6]. |
| Metal Ions (e.g., Zn²⁺, Cu²⁺) | Cofactors for enzymes; levels can affect cellular metabolism and critical quality attributes [6]. | |
| Salts (e.g., NaCl) | Regulates osmotic pressure; unexpectedly identified as a key factor for flaviolin production in P. putida [13]. | |
| Glucose & Other Carbon Sources | Primary energy and carbon source; concentration can drive non-enzymatic modifications like glycation [6]. | |
| Analytical Tools | Cation Exchange Chromatography (CEX) | Gold-standard method for separating and quantifying charge variants of monoclonal antibodies [6]. |
| Capillary Isoelectric Focusing (cIEF) | High-resolution technique for characterizing charge heterogeneity based on isoelectric point [6]. | |
| LC-MS / Peptide Mapping | Used for deep characterization and identification of specific post-translational modifications causing charge variation [6]. | |
| Software & Platforms | Automated Machine Learning (AutoML) | Platforms like auto-sklearn or H2O.ai automate model selection and hyperparameter tuning, reducing the ML expertise barrier [36] [61]. |
| Active Learning Platforms | Tools like the Automated Recommendation Tool (ART) manage the iterative DBTL cycle by recommending the next best experiments [13]. | |
| Experiment Data Depots (EDD) | Centralized databases for storing and managing all experimental data, ensuring consistency and accessibility for ML models [13]. |
The choice between Traditional DOE and Machine Learning is not merely a technical decision but a strategic one, impacting resource allocation, project timelines, and the potential for breakthrough discoveries.
- For local optimization and factor effect understanding, where the number of variables is small and the system is reasonably linear, Traditional DOE remains a powerful and interpretable method.
- For global optimization of complex, non-linear systems, where the design space is vast and high-dimensional, Machine Learning is unequivocally superior. Its ability to reduce experimental burden by 50-90% while achieving superior outcomes makes it an indispensable tool for modern bioprocess development [8] [13].
The future of optimization lies in hybrid and adaptive approaches. DOE-informed ML is one such frontier, where initial DOE data is used to pre-train deep learning models, enhancing their performance with very small experimental datasets [62]. Furthermore, the integration of automation, high-throughput analytics, and adaptive ML algorithms into a seamless DBTL cycle represents the new paradigm, poised to dramatically accelerate innovation in drug development and beyond [13].
Strategies for Managing Change and Building Team Expertise
The optimization of culture media and bioprocess conditions is a critical, yet historically arduous, task in biopharmaceutical development and synthetic biology. For decades, the field has relied on systematic statistical approaches, primarily Design of Experiments (DoE), to navigate this complex challenge. However, a new paradigm is emerging: Machine Learning (ML)-driven optimization. This shift from traditional statistics to artificial intelligence represents a fundamental change in how research is conducted, demanding new expertise and adapted workflows. This guide provides an objective comparison of these two methodologies, equipping research leaders with the data and insights needed to manage this transition and build effective, future-ready teams.
Methodological Comparison: DoE vs. Machine Learning
Understanding the core principles, strengths, and weaknesses of each approach is the first step in strategic decision-making.
Design of Experiments (DoE): The Established Standard
DoE is a mathematical approach for planning, conducting, and analyzing controlled tests to model the relationship between factors and observed responses [35]. Its primary goal is statistical inference to understand the individual and interactive effects of input variables, often to establish causal relationships [9]. DoE is most effective for local optimization where the response can be approximated by linear or quadratic models, such as in Response Surface Methodology (RSM) [8]. A typical DoE workflow is highly structured, as shown in the diagram below.
Machine Learning: The Adaptive Contender
Machine Learning describes a suite of algorithms that learn complex, non-linear relationships directly from data without being explicitly programmed for a specific model form [4] [6]. Its primary strength is predictive accuracy and handling high-dimensional, complex data types that are incompatible with traditional DoE [35]. ML excels at global optimization across vast, complex design spaces [8]. A common and efficient ML application is active learning, which iteratively selects the most informative experiments to run.
Side-by-Side Comparison
Table 1: A direct comparison of Design of Experiments and Machine Learning for medium optimization.
| Aspect | Design of Experiments (DoE) | Machine Learning (ML) |
|---|---|---|
| Primary Goal | Statistical inference, understanding causal effects [9] | Predictive accuracy, forecasting outcomes [9] |
| Underlying Model | Pre-defined (e.g., linear, quadratic polynomial) [35] | Data-driven, non-linear (e.g., neural networks, tree-based models) [4] |
| Handling Complexity | Best for local optimization with limited factors; struggles with high-dimensional spaces [8] | Excels at global optimization in high-dimensional, complex design spaces [8] |
| Data Efficiency | Requires a pre-planned set of experiments; inefficient for exploring many factors [35] | High efficiency with active learning; focuses on informative experiments, reducing runs by 50-90% [8] |
| Data Types | Structured, quantitative, tabular data [8] | Handles diverse data (images, audio, high-dimensional data) [35] |
| Use of Prior Data | Not typically incorporated; each DoE is a new project [8] | Can leverage historical data from past projects via transfer learning [8] |
| Integration of Domain Knowledge | Purely statistical; does not incorporate external scientific knowledge [8] | Can be incorporated to improve model performance [8] |
Performance and Experimental Data
Theoretical advantages are meaningful, but empirical evidence is crucial for evaluation.
Quantitative Performance Benchmarks
Table 2: Documented performance improvements from ML-driven optimization in recent studies.
| Application Context | ML Approach | Reported Outcome | Reference |
|---|---|---|---|
| Flaviolin Production in P. putida | Active Learning (Automated Recommendation Tool) | 60-70% increase in titer; 350% increase in process yield; identified NaCl as a critical, non-intuitive factor [13] | Communications Biology (2025) |
| Charge Heterogeneity in mAb Production | Supervised Learning & Regression Models | Optimized culture parameters (pH, temperature) to reduce acidic/basic variants, improving Critical Quality Attributes (CQAs) [6] | mAbs Journal (2025) |
| General R&D Efficiency | AI-driven Sequential Learning | 50-90% reduction in the number of experiments required to reach target performance compared to traditional DoE [8] | Citrine Platform Case Studies |
Case Study: A Detailed Workflow for ML-Mediated Optimization
A 2025 study in Communications Biology provides a clear protocol for implementing an ML-driven approach. The research aimed to optimize the culture media for flaviolin production in Pseudomonas putida KT2440 using a semi-automated, active learning pipeline [13].
Experimental Protocol:
- Factor Selection: 12-13 media components (e.g., salts, nitrogen sources, carbon sources) were selected as variable factors.
- Automated Media Preparation: An automated liquid handler prepared media blends according to designs generated by the ML algorithm.
- Cultivation & Analysis: Cultures were grown in a controlled, automated bioreactor system (BioLector) for 48 hours. Production was measured via high-throughput absorbance assays and validated with HPLC.
- Data Integration & Modeling: Production data and media compositions were stored in a central database (Experiment Data Depot). The Automated Recommendation Tool (ART) used this data to build a predictive model and recommend the next set of media designs to test.
- Iterative Learning: Steps 2-4 were repeated in sequential "Design-Build-Test-Learn" (DBTL) cycles, with each round refining the model's accuracy and guiding the search toward the optimum [13].
Key Reagent Solutions:
- Host Organism: Pseudomonas putida KT2440, a robust chassis for bioproduction.
- Carbon/Nitrogen Sources: Variable components in the media design.
- Salts (NaCl): Identified by explainable AI as the most critical factor for flaviolin production, with an optimal concentration near the tolerance limit of the bacteria [13].
Strategic Implementation Guide
Choosing between DoE and ML is not about finding a universal winner, but about selecting the right tool for the problem at hand.
Decision Framework: When to Use Which Tool
Table 3: A strategic guide for selecting an optimization methodology based on project parameters.
| Project Characteristic | Recommended Method | Rationale |
|---|---|---|
| Number of Factors | DoE: Low (e.g., <5)ML: High (e.g., >5) | DoE runs grow exponentially with factors; ML remains linear [8]. |
| Data Availability | DoE: No prior dataML: Existing historical data | ML requires a training set; DoE can start from scratch [8]. |
| Problem Scope | DoE: Local optimization, understanding specific effectsML: Global optimization, exploring vast spaces | DoE fits local models; ML scouts entire design spaces [8]. |
| Data Type | DoE: Simple, structured, tabularML: Complex, unstructured (images, spectra) | DoE tools are generic; ML platforms are built for complex data [35] [8]. |
| Goal | DoE: Causal inference, process understandingML: Maximizing prediction accuracy and final performance | Core philosophies differ between inference and prediction [9]. |
A Hybrid Future
The most powerful strategy may be a hybrid one. Researchers can use DoE for initial screening to identify the most critical factors from a large set with minimal runs. Subsequently, ML can take over for deep optimization of those shortlisted factors, efficiently navigating their complex interactions to find a global optimum [35]. This leverages the respective strengths of both methodologies.
Building Team Expertise for the ML Transition
Adopting ML is a cultural and technical shift that requires proactive management.
- Assess and Bridge Skill Gaps: Traditional teams strong in statistics and domain knowledge must build competency in data science, programming (e.g., Python), and fundamentals of ML algorithms. Invest in targeted training and workshops.
- Foster Cross-Functional Collaboration: Break down silos by creating small, mixed teams that pair bioprocess experts with data scientists. This facilitates knowledge transfer and ensures ML models are grounded in biological reality.
- Implement Phased Pilots: Manage risk and build confidence by starting with a well-scoped, non-critical project. A successful pilot provides a proof-of-concept, demonstrates value, and creates internal champions for the new approach.
- Invest in Enabling Infrastructure: ML requires more than algorithms. Prioritize investments in data management systems to ensure data quality and accessibility, automation for high-throughput data generation, and user-friendly MLOps platforms to streamline the experimental lifecycle [63].
The evolution from DoE to ML represents a significant leap in the capability to optimize complex bioprocesses. While DoE remains a powerful, foundational tool for structured investigation, ML offers a transformative potential for efficiency and discovery, as evidenced by its ability to drastically reduce experimental runs and uncover non-intuitive optimizations. The optimal path forward involves a strategic blend of both, guided by a clear understanding of their strengths. Successfully managing this change requires more than just adopting new software; it demands a concerted effort to cultivate a culture of data-driven experimentation and build the interdisciplinary expertise that will define the future of biopharmaceutical R&D.
This guide provides an objective comparison between Machine Learning (ML) and traditional Design of Experiments (DOE) for optimizing culture media in bioprocess development. For researchers and drug development professionals, selecting the right optimization strategy is critical for efficiency, cost, and achieving commercially viable titers, rates, and yields (TRY).
Experimental Comparison: ML vs. Traditional DOE
The following quantitative comparison is based on published experimental data, particularly from a 2025 study optimizing flaviolin production in Pseudomonas putida using a machine learning-led approach versus traditional methods [13].
Performance and Resource Metrics
Table 1: Direct performance and resource comparison between Traditional DOE and Machine Learning approaches for medium optimization.
| Metric | Traditional DOE (e.g., OFAT, RSM) | Machine Learning (Active Learning) | Experimental Context & Notes |
|---|---|---|---|
| Titer Increase | Not specifically quantified; generally lower efficiency [13] | 60% and 70% increase in two separate campaigns [13] | For flaviolin production in P. putida [13]. |
| Process Yield Increase | Not specifically quantified; generally lower efficiency [13] | 350% increase [13] | For flaviolin production in P. putida; reflects output per input resource [13]. |
| Experimental Efficiency | Inefficient for high-dimensional spaces; testing 10 components at 5 levels requires 50 (OFAT) or 510 (Full Combinatorial) experiments [13]. | High data efficiency; active learning minimizes experiments needed to reach goal (e.g., 15 media designs per DBTL cycle) [13]. | ML uses an iterative Design-Build-Test-Learn (DBTL) cycle to guide experiments [13]. |
| Ability to Model Complex Interactions | Limited; RSM fits 2nd-degree polynomials, often missing complex, non-linear interactions [6]. | High; ML algorithms (e.g., neural networks) excel at capturing non-linear relationships between components [13] [6]. | Crucial for accurately modeling biological systems [6]. |
| Key Finding | Relies on pre-existing biological knowledge, potentially overlooking novel factors [13]. | Identified NaCl (common salt) as the most important component for production, a non-intuitive, high-impact factor [13]. | Optimal salt concentration was near the host's tolerance limit [13]. |
Investment and Return Metrics
Table 2: Comparison of investment, cost, and overall return metrics between the two approaches.
| Metric | Traditional DOE | Machine Learning | Context and Implications |
|---|---|---|---|
| Implementation Timeline | Shorter initial setup, but longer total experimental timeline. | Longer initial setup for pipeline and model development; faster overall optimization (3-day DBTL cycles) [13]. | The semi-automated ML pipeline enabled rapid iteration [13]. |
| Personnel & Skillset | Requires knowledge of statistical experimental design. | Requires cross-functional teams with data science and ML expertise [64]. | Building multidisciplinary teams is a recognized best practice for high AI/ML ROI [64]. |
| Data Requirements | Can generate actionable insights with smaller, structured datasets. | Requires abundant, high-quality data for training; performance is highly dependent on data quality [13] [6]. | The ML approach invested in a semi-automated pipeline for high-quality, reproducible data [13]. |
| Reported ROI | General AI/ML initiatives in business show a median ROI of 5.9% for struggling enterprises [64]. | High-performing, well-implemented AI projects report a median ROI of 55% for generative AI [64]. | This broader business data contextualizes the potential financial return of a strategic vs. a basic approach [64]. |
Detailed Experimental Protocols
Machine Learning Active Learning Protocol
The following workflow outlines the semi-automated, active learning process used for ML-driven medium optimization [13].
Title: ML Active Learning Workflow for Medium Optimization
Key Steps [13]:
- Data Collection & Pipeline Setup: A semi-automated pipeline was established using an automated liquid handler, a BioLector for automated cultivation (controlling O2, shake speed, humidity), and a microplate reader for high-throughput product quantification (Abs340 for flaviolin). This system could test 15 media conditions in triplicate/quadruplicate in three days with less than four hours of hands-on time.
- Initial Model Training: The process begins with an initial dataset of media compositions and corresponding production yields.
- Active Learning Loop: The Automated Recommendation Tool (ART) machine learning algorithm analyzes the collected data and recommends a new set of promising media designs to test.
- Iterative DBTL Cycles: The recommended designs are automatically prepared, cultured, and measured. The results are stored in the Experiment Data Depot (EDD), and the cycle repeats. ART uses these fast cycles to learn efficiently and non-monotonically improve production.
Traditional Design of Experiments (DOE) Protocol
The traditional DOE approach, while systematic, lacks the iterative, learning-driven automation of the ML method.
Title: Traditional DOE Workflow for Medium Optimization
- Experimental Design: Based on prior biological knowledge, factors (media components) and their levels (concentrations) are selected. The design is created using methods like One-Factor-at-a-Time (OFAT) or Response Surface Methodology (RSM).
- Manual Execution: All experiments in the design are manually set up and executed. This can be time-consuming and prone to human error, especially for complex designs with many factors.
- Data Analysis & Interpretation: The results from all experiments are collected and analyzed using statistical software to build a model (e.g., a polynomial equation in RSM) and identify the optimal conditions within the tested range.
- Limitation: This approach is often a single, large batch of experiments rather than an iterative cycle. It struggles with high-dimensionality and can miss non-intuitive, optimal conditions that were not part of the initial design or biological hypothesis.
The Scientist's Toolkit: Research Reagent Solutions
Table 3: Key reagents, materials, and instruments used in ML-driven bioprocess optimization.
| Item | Function in Experiment | Specific Example from Context |
|---|---|---|
| Automated Liquid Handler | Precisely dispenses stock solutions to assemble complex media designs according to ML recommendations, ensuring reproducibility and high-throughput. | Used to create 15 different media designs per DBTL cycle [13]. |
| Automated Cultivation System (e.g., BioLector) | Provides high-throughput, reproducible cultivation with tight control over critical parameters (O2, temperature, humidity), generating consistent data for ML models. | BioLector was used for its reproducibility and ability to produce results that scale to higher volumes [13]. |
| Microplate Reader | Enables high-throughput quantification of product titer or cell density, providing the essential data for the ML algorithm to learn from. | Used to measure flaviolin production via absorbance at 340 nm [13]. |
| Specialized ML Algorithm (e.g., ART) | The core software that actively learns from experimental data and recommends the next best experiments to perform, maximizing learning efficiency. | The Automated Recommendation Tool (ART) was used to lead the active learning process [13]. |
| Data Management Platform (e.g., EDD) | Centralized repository for storing all experimental data (media compositions, process parameters, and yields), crucial for model training and traceability. | Experiment Data Depot (EDD) was used to store production data and media designs [13]. |
| High-Quality Stock Solutions | The foundational chemical components of the culture media that are varied to find the optimal composition. | The study optimized 12-13 variable media components [13]. A key finding was the critical role of NaCl [13]. |
| Ion Exchange Chromatography (CEX) | The analytical standard for separating and quantifying charge variants of monoclonal antibodies, a key Critical Quality Attribute (CQA). | Used to analyze charge heterogeneity (acidic/main/basic species) in mAb production [6]. |
Measuring Success: A Rigorous Comparison of Outcomes and Performance
This guide provides a quantitative comparison between Machine Learning (ML) and traditional Design of Experiments (DoE) for medium optimization in bioprocess development. Direct experimental data and modeling studies demonstrate that ML-driven approaches can reduce the number of required experiments by 50-90% to achieve target performance, significantly lowering experimental burden and accelerating time-to-solution compared to traditional statistical methods [8].
Quantitative Performance Comparison
Experimental Efficiency and Performance Gains
Table 1: Comparative experimental efficiency of ML versus DoE methodologies
| Metric | Traditional DoE | Machine Learning | Data Source |
|---|---|---|---|
| Experiment Reduction | Baseline | 50-90% reduction | Citrine Platform [8] |
| Titer Improvement | Baseline | 60-70% increase | Flaviolin production [13] |
| Process Yield Improvement | Baseline | 350% increase | Flaviolin production [13] |
| Performance Gain | Baseline | 25% increase | Rifamycin B production [13] |
| Optimal Point Identification | Local optimization | Global optimization in complex spaces | [8] |
Resource Scaling with Problem Dimensionality
Table 2: Resource scaling comparison relative to experimental dimensions
| Experimental Dimensions | DoE Resource Scaling | ML Resource Scaling | Key Differentiator |
|---|---|---|---|
| Low-dimensional (1-5 factors) | Efficient with fractional factorial | May be comparable | DoE sufficient for simple spaces [35] |
| Multi-dimensional (5+ factors) | Exponential growth: 3^k for k factors | Linear growth with dimensions | ML advantage increases dramatically [8] |
| High-dimensional (10+ factors) | Prohibitive: 3^10 = 59,049 experiments | Efficient sequential learning | ML enables feasible optimization [36] |
Experimental Protocols and Methodologies
Traditional Design of Experiments Workflow
The established DoE methodology follows a structured, sequential process optimized for statistical rigor and reproducibility [35]:
- Problem Identification: Define clear objectives and response variables
- Experimental Structuring: Plan experiments using statistical designs (factorial, Latin square, response surface methodology)
- Factor Determination: Identify factors, levels, and responses to investigate
- Parallel Experimentation: Execute all planned experiments simultaneously
- Model Development: Build mathematical models from response data
- Model Evaluation: Validate models using statistical plots and diagnostics
- Factor Significance Testing: Identify statistically significant factors
- Verification Experiments: Conduct additional runs to confirm optimal conditions
- Iterative Refinement: Perform additional testing with altered factor ranges as needed
Traditional DoE methods include full factorial designs (2^k experiments for k factors at 2 levels), fractional factorial designs (reduced runs when interactions are negligible), and response surface methodology (RSM) for modeling quadratic responses [35]. These approaches are deterministic—once factors and ranges are defined, experimental points are fixed by statistical design [36].
Machine Learning-Driven Optimization Protocol
ML approaches employ iterative, adaptive learning cycles that leverage predictive modeling and uncertainty quantification [13] [36]:
- Initial Dataset Collection: Gather initial training data from historical experiments or limited initial runs
- Predictive Model Training: Employ ML algorithms (GBDT, Random Forest, XGBoost, neural networks) to learn relationships between medium components and outputs
- Uncertainty Quantification: Calculate prediction uncertainties for all candidate experiments
- Candidate Selection: Identify promising experiments balancing exploitation (high predicted performance) and exploration (high uncertainty regions)
- Parallel Experimentation: Execute top-ranked experiments in batch
- Model Retraining: Incorporate new results to improve model accuracy
- Iterative Optimization: Repeat steps 3-6 until performance targets are met
Active learning implementations using tools like the Automated Recommendation Tool (ART) demonstrate particular efficiency, with semi-automated pipelines testing 15 media designs in triplicate/quadruplicate within three days with less than four hours of hands-on time [13].
Figure 1: ML-active learning iterative optimization workflow
Detailed Experimental Case Studies
Microbial Metabolite Production Optimization
A comprehensive study comparing ML and traditional approaches for optimizing aromatic compound production in engineered E. coli provides direct performance comparisons [65]:
Experimental Protocol:
- Strains: Engineered E. coli producing 4-aminophenylalanine (4APhe) or tyrosine (Tyr)
- Medium Components: 48 pure chemicals including buffers, sugars, nitrogen sources, amino acids, metals, vitamins, antibiotics, and inducers
- Experimental Scale: 192-378 medium combinations tested per strain
- ML Methodology: Gradient-boosted decision trees (GBDT) compared against five other ML models
- Feature Importance: ML identified glucose as primary component for 4APhe production and IPTG for Tyr production
- Validation: Fine-tuned concentrations based on ML predictions significantly increased yields
Performance Outcome: ML analysis revealed differentiated optimization strategies for native versus foreign metabolites, enabling targeted component adjustment that would be difficult to identify using traditional DoE screening approaches [65].
Tissue Engineering and Biomaterials Optimization
In tissue engineering applications, ML has demonstrated advantages for processing complex data types that challenge traditional DoE [35]:
Experimental Scope: Optimization of 3D bioprinting processes for tissue-engineered constructs Data Complexity: Includes physicochemical analysis, microstructural imaging, rheological assessment, mechanical testing, and degradation measurements ML Advantage: Capability to process high-dimensional data, images, and unstructured data formats DoE Limitation: Primarily suitable for quantitative, structured, tabular data
Resource Burden Analysis
Experimental Burden Comparison
The fundamental difference in approach between DoE and ML drives significant variance in experimental resource requirements:
DoE Resource Characteristics [35] [36]:
- Requires predetermined experimental points before any data collection
- Resource needs grow exponentially with factor increase (3^k for k factors at 3 levels)
- Optimal for low-dimensional spaces with known important factors
- Efficient for local optimization around known operating conditions
ML Resource Characteristics [13] [8]:
- Adaptive experimental selection based on accumulating knowledge
- Linear scaling with dimensions enables high-dimensional optimization
- Uncertainty quantification enables strategic risk management in experimental selection
- Global optimization capability across complex design spaces
Table 3: Time and resource requirements for medium optimization
| Aspect | Traditional DoE | Machine Learning |
|---|---|---|
| Initial Planning | Extensive statistical design required | Flexible initial data collection |
| Experiment Batch Size | Large batches based on statistical design | Smaller, targeted batches |
| Iteration Cycle | Fewer, larger iterations | More frequent, smaller iterations |
| Hands-on Time | Higher due to comprehensive parallel experiments | Lower with semi-automation [13] |
| Total Time to Solution | Longer due to fixed design constraints | Shorter due to adaptive targeting |
Implementation Considerations
- Low-dimensional problems (1-5 factors)
- Limited or no historical data available
- Local optimization around known operating conditions
- Structured, quantitative data only
- Linear or quadratic response surfaces expected
- Multi-dimensional optimization (5+ factors)
- Availability of historical data for initial training
- Global optimization across complex design spaces
- Complex, unstructured data types (images, spectra)
- Non-linear response surfaces expected
- Incorporation of domain knowledge beneficial
Figure 2: Methodology selection decision tree
The Scientist's Toolkit: Essential Research Reagents and Solutions
Table 4: Key research reagents and solutions for medium optimization studies
| Reagent Category | Specific Examples | Function in Optimization |
|---|---|---|
| Carbon Sources | Glucose, Glycerol | Primary metabolic energy and carbon source [65] |
| Nitrogen Sources | Ammonium salts, Amino acids | Nitrogen for biomass and product formation [65] |
| Inducers | IPTG | Regulate expression of synthetic pathways [65] |
| Buffers | Phosphates, TRIS | Maintain optimal pH for growth and production [65] |
| Salts | NaCl, MgSO₄, CaCl₂ | Osmolarity regulation, enzyme cofactors [13] |
| Vitamins & Cofactors | B vitamins, Trace elements | Essential cofactors for enzymatic reactions [65] |
| Antibiotics | Chloramphenicol, Ampicillin | Selective pressure for engineered strains [65] |
| Specialized Additives | Precursors, Metabolic intermediates | Direct enhancement of target pathway flux [65] |
The quantitative evidence demonstrates clear advantages for ML-driven approaches in medium optimization across multiple metrics. ML methods reduce experimental burden by 50-90%, improve product titers by 25-70%, and significantly accelerate time-to-solution compared to traditional DoE [13] [8]. The adaptive nature of ML sequential learning provides particular benefit for high-dimensional optimization problems where traditional DoE requires prohibitive experimental resources. However, traditional DoE remains valuable for low-dimensional, local optimization scenarios, particularly when historical data is limited. Researchers should select methodology based on problem dimensionality, data availability, and optimization scope to maximize efficiency in medium development campaigns.
The optimization of culture media is a critical, yet historically cumbersome, process in biological research and drug development. A well-designed medium provides the essential nutrients, growth factors, and environmental conditions necessary for robust cell proliferation, differentiation, and optimal production of target metabolites or therapeutics [4]. For decades, the field has relied on traditional methods, often adapting a limited set of initial media formulations developed for a small number of model species on an ad-hoc basis for new applications [4]. This approach is not only inefficient but can severely limit the commercial viability of bioprocesses by failing to achieve the necessary titers, rates, and yields (TRY).
The emergence of machine learning (ML) presents a paradigm shift, offering a new avenue to overcome these long-standing limitations. ML-mediated optimization leverages artificial intelligence to dramatically improve the speed, precision, and efficiency of culture media development [4]. This guide provides an objective, data-driven comparison between traditional Design of Experiments (DOE) and modern machine learning approaches, evaluating them across three core dimensions critical for research and industrial application: depth of insight, predictability, and scalability. The analysis is framed within the context of medium optimization for enhanced in vitro performance, a pivotal step in biotechnology and pharmaceutical development [4].
Methodological Comparison: Core Protocols
The fundamental difference between the two approaches lies in their experimental design and data processing logic.
Traditional Design of Experiments (DOE)
Traditional DOE encompasses several statistical methods aimed at understanding the relationship between factors (e.g., media components) and responses (e.g., product titer).
- One-Factor-at-a-Time (OFAT) Protocol: This is the most rudimentary traditional approach. It involves varying a single factor while holding all other factors constant to observe its effect on the output. For a medium with n components, investigating k concentration levels for each would require a base number of experiments proportional to n × k. This method fails to capture any interaction effects between components [13].
- Response Surface Methodology (RSM) Protocol: RSM is a more sophisticated DOE technique that fits the experimental response to a second-degree polynomial model. The typical workflow involves:
- Screening Design: First, a fractional factorial or Plackett-Burman design is used to identify the most influential factors from a large set of potential components.
- Optimization Design: Next, a central composite design or Box-Behnken design is employed around the promising factor ranges identified in the screening phase.
- Model Fitting & Validation: A quadratic model is fitted to the data, and the resulting response surface is analyzed to find the optimal factor settings, which are then validated experimentally [13].
Machine Learning-Mediated Active Learning
Machine learning, particularly active learning, represents a dynamic and iterative methodology. A prominent example is the use of tools like the Automated Recommendation Tool (ART) within a semi-automated Design-Build-Test-Learn (DBTL) pipeline [13].
- Initial Experimental Design: The process begins with an initial dataset, which can be a small set of randomly selected media compositions or a sparse historical dataset.
- Model Training: A machine learning model (e.g., Gaussian process regression, random forest) is trained on the available data to learn the complex, non-linear relationships between media composition and the performance output (e.g., flaviolin titer).
- Recommendation Generation: The trained ML algorithm then evaluates millions of potential media compositions and recommends a new set of experiments (typically 10-15 designs) that are predicted to maximize the target output or maximize the information gain (exploration).
- Automated Testing: The recommended media designs are prepared, often using an automated liquid handler, and cultivated in a highly controlled, automated bioreactor platform (e.g., BioLector). The product is then quantified using a high-throughput assay (e.g., absorbance measurement, HPLC) [13].
- Iterative Learning: The new experimental results are fed back into the database, and the cycle repeats. With each iteration, the model becomes more accurate, efficiently guiding the search toward the global optimum with minimal experimental effort [13].
Comparative Analysis: Depth of Insight, Predictability, and Scalability
The following tables provide a structured, qualitative comparison of ML and traditional DOE across the three core assessment criteria, supported by experimental findings.
Table 1: Qualitative Comparison of Insight, Predictability, and Scalability
| Assessment Criteria | Machine Learning (ML) Approach | Traditional DOE (e.g., RSM) |
|---|---|---|
| Depth of Insight | High. Capable of revealing complex, non-linear interactions and non-intuitive factor importances that are often missed by traditional methods. For example, ML explainable AI (XAI) techniques identified common salt (NaCl) as the most critical component for flaviolin production in P. putida, a surprising finding [13]. | Medium. Limited to the structure of the pre-defined model (e.g., quadratic in RSM). Can identify two-factor interactions but struggles with higher-order complexities and may overlook critical but non-intuitive factors. |
| Predictability | High for interpolations within the explored design space. Performance can be non-monotonous but shows strong overall improvement over cycles. ML models like neural networks have been shown to outperform RSM in predictive accuracy for biological systems [13]. | Medium. Good predictability within the confines of the experimental design, but accuracy drops significantly outside this range or when underlying interactions are more complex than the model can capture. |
| Scalability | High for problem complexity. Efficiently handles a large number of factors (10+) due to its data-driven, iterative nature. An active learning process testing 15 media designs per cycle can manage 12-13 variable components effectively [13]. | Low to Medium. Becomes prohibitively expensive and time-consuming as the number of factors increases due to the combinatorial explosion of required experiments. |
| Experimental Efficiency | High. An active learning process requires significantly fewer experiments to reach a high-performing optimum. A semi-automated pipeline can test 15 media conditions in triplicate/quadruplicate in just three days [13]. | Low. The "one-factor-at-a-time" approach for 10 components at 5 levels requires 50 experiments, while a full factorial for the same would require 510 (over 9 million) experiments, making comprehensive exploration impractical [13]. |
| Handling of Non-linearity | Excellent. ML algorithms are inherently suited for capturing and modeling complex, non-linear relationships and interactions between multiple factors without prior assumption [13]. | Limited. RSM assumes a specific, often quadratic, non-linearity. It cannot effectively model systems with more complex, non-smooth response surfaces. |
| Metric | Traditional / Baseline Performance | ML-Optimized Performance | Experimental Context & Notes |
|---|---|---|---|
| Flaviolin Titer | Baseline (100%) | 160% - 170% of baseline | Achieved in three separate optimization campaigns for Pseudomonas putida KT2440. The increase was validated via HPLC [13]. |
| Process Yield | Baseline (100%) | ~450% of baseline | Represents a 350% increase, demonstrating a dramatic improvement in efficiency for one of the optimization campaigns [13]. |
| Key Insight | Biological prior knowledge | NaCl pinpointed as most important factor | Explainable AI techniques revealed the critical role of salt at a concentration near the tolerance limit of the host, a non-intuitive finding [13]. |
Visualizing the Workflows
The core difference between the traditional and ML-led processes is their structure: traditional DOE is often a linear or batch process, while ML-mediated optimization is an iterative, closed-loop cycle.
Diagram: Traditional DOE vs. ML-Mediated Workflow
The Scientist's Toolkit: Essential Research Reagents and Platforms
This table details key materials and platforms used in a state-of-the-art, ML-led medium optimization campaign as described in recent literature [13].
Table 3: Key Research Reagent Solutions for ML-Led Medium Optimization
| Item | Function in the Protocol | Specific Example / Note |
|---|---|---|
| Automated Liquid Handler | Precisely combines stock solutions to create a wide array of media compositions according to the ML algorithm's recommendations, ensuring speed and reproducibility. | Critical for implementing the "Build" phase of the DBTL cycle with high repeatability. |
| Miniaturized Bioreactor System | Provides a controlled, high-throughput environment for cultivating microbial or cell cultures under defined conditions (O2, humidity, temperature). | Systems like the BioLector provide reproducible data that scales to higher volumes [13]. |
| Microplate Reader | Enables rapid, high-throughput quantification of the target output, such as product titer or cell density, using optical measurements (e.g., absorbance, fluorescence). | Used for measuring flaviolin via Abs340; other targets may require HPLC or GC-MS for validation [13]. |
| Machine Learning Platform | The core software that trains models on existing data and recommends the next set of experiments to be performed. | Tools like the Automated Recommendation Tool (ART) are designed for active learning in scientific domains [13]. |
| Data Management Platform | A centralized database to store and manage all experimental data, including media compositions, growth conditions, and outcome measurements. | Platforms like the Experiment Data Depot (EDD) are used to log data for model training [13]. |
| Chemical Stock Solutions | The foundational components of the culture media, including macronutrients, micronutrients, vitamins, amino acids, and inducters. | The specific components are variable and defined by the optimization problem. NaCl was a key finding in one study [13]. |
Head-to-Head Comparison Table: Traditional vs. ML-DOE at a Glance
The optimization of cell culture and fermentation media is a critical, yet resource-intensive, step in biopharmaceutical development. The choice of experimental strategy—Traditional Design of Experiments (DOE) or a hybrid Machine Learning-enhanced DOE (ML-DOE)—significantly impacts the efficiency, cost, and success of this process. This guide provides an objective, data-driven comparison of these two methodologies to inform research and development.
Methodologies at a Glance
The table below summarizes the core distinctions between Traditional DOE and ML-DOE based on their fundamental philosophies and operational characteristics.
| Feature | Traditional DOE | ML-DOE Hybrid Approach |
|---|---|---|
| Core Philosophy | A model-free, statistically principled method for exploring a predefined parameter space. It emphasizes structured data collection to establish causation [11]. | An adaptive, model-based approach that uses machine learning to iteratively learn from data and guide experiments toward optimal regions [36] [16]. |
| Experimental Design | Relies on pre-defined, static matrices (e.g., Full Factorial, Central Composite Design) to ensure balanced coverage and facilitate causal inference [11]. | Employs sequential, adaptive design where each round of experiments is proposed by an ML model to maximize information gain or target a specific objective [36] [66]. |
| Data Handling | Requires data from specifically designed experiments. Struggles with integrating unstructured or historical data [11]. | Can integrate data from DOE studies, historical records, and previous research, creating a unified knowledge base for modeling [16]. |
| Optimization Approach | Typically uses Response Surface Methodology (RSM) to build polynomial models for navigating the experimental space [11]. | Uses ML algorithms (e.g., Random Forests, ANNs) to model complex, non-linear relationships and directly propose optimal conditions [11] [66]. |
| Primary Strength | High reliability for establishing cause-effect relationships within the studied space. Robust and well-understood. | Superior efficiency in navigating high-dimensional and complex non-linear parameter spaces. Maximizes learning per experiment [67] [36]. |
| Key Limitation | Can be inefficient for high-dimensional or highly non-linear systems, as the required number of experiments grows rapidly [36]. | ML models can function as "black boxes," making causal interpretation difficult. Performance is dependent on the quality and quantity of data [11]. |
Quantitative Performance Comparison
The following table consolidates key performance metrics reported from industrial and research applications, demonstrating the tangible impact of each approach.
| Performance Metric | Traditional DOE | ML-DOE Hybrid Approach | Source / Context |
|---|---|---|---|
| Reduction in Experimental Cost | Baseline | 15% - 25% reduction | Industry case study [67] |
| Acceleration of Development Cycles | Baseline | Up to 30% faster | Industry case study [67] |
| Prediction Accuracy | Baseline (RSM models) | Up to 30% lower Mean Squared Error (MSE) vs. convenience samples [67] | Comparative study on data collection strategies [67] |
| Modeling Capability | Best for linear and quadratic relationships. | Excels at capturing complex, non-linear interactions between variables [11] [66]. | General consensus from multiple applications |
| Resource Efficiency | Requires all experiments to be planned upfront. | Reduces the total number of experiments through adaptive selection of the most informative tests [16]. | Core stated benefit of the hybrid approach |
Detailed Experimental Protocols
Protocol 1: Traditional DOE for Media Optimization
This protocol outlines the standard workflow for optimizing media components using a Traditional DOE approach, such as a Central Composite Design (CCD) [36].
- Define Objective and Variables: Clearly state the Critical Quality Attributes (CQAs) to be optimized (e.g., cell density, product titer, specific productivity). Identify the critical process parameters (CPPs) or media components to be studied and their respective ranges.
- Select and Generate Experimental Design: Choose an appropriate statistical design (e.g., CCD, Latin Hypercube Design (LHD)) to structure the experiment. The design matrix specifies the exact combinations of factor levels to be tested.
- Execute Experiments: Conduct the bioreactor or cell culture runs as specified by the design matrix. The order of experiments is typically randomized to avoid bias.
- Modeling with RSM: Analyze the collected data using Response Surface Methodology. A quadratic polynomial model with interaction terms is typically fitted to the data to describe the relationship between the factors and the responses.
- Validation and Optimization: Use the fitted model to identify the optimal factor settings that maximize or minimize the desired responses. Confirm the predicted optimum by running a set of validation experiments.
Protocol 2: ML-DOE Sequential Learning for Media Optimization
This protocol describes an iterative, ML-driven methodology for media optimization, as implemented in industrial settings [66].
- Initial DOE and Data Collection: Start with a small initial dataset. This can be a sparse traditional DOE (e.g., a fractional factorial or a small LHD) or a set of historical data.
- Train ML Model: Train a machine learning model (e.g., Random Forest, Gaussian Process, or Artificial Neural Network) on the available dataset. The model learns to predict the CQAs based on the input parameters.
- Model-Based Experiment Proposal: Use the trained model to screen a vast virtual design space. The ML platform then proposes a new list of experiments expected to either improve the objective (e.g., increase titer) or reduce the model's prediction uncertainty in critical areas.
- Execute and Re-ingest Data: Perform the top-ranked proposed experiments in the lab. The results from this new round of experimentation are then added to the existing dataset.
- Iterate to Convergence: Repeat steps 2 through 4, re-training the model with the updated, larger dataset after each cycle. The process continues until the performance objectives are met or the model predictions converge, resulting in a highly optimized media formulation.
Workflow Visualization
Traditional DOE Workflow
ML-DOE Hybrid Workflow
The Scientist's Toolkit: Essential Research Reagents and Solutions
This table lists key materials and software solutions commonly used in the featured experiments for medium optimization.
| Item | Function in Experiment |
|---|---|
| Statistical Software (JMP, MODDE, Design-Expert) | Used to create traditional DOE matrices, perform statistical analysis, and generate Response Surface Models [16]. |
| ML Software Platforms (e.g., Intellegens, custom Python/R) | Provides the algorithms (Random Forests, ANNs, etc.) to build predictive models from data and propose new experiments in an ML-DOE workflow [66] [16]. |
| Chemically Defined Media Components | The variables being optimized (e.g., glucose, amino acids, growth factors). Their concentrations are adjusted as per the experimental design to assess impact on CQAs. |
| Bench-scale Bioreactor Systems | The physical platform for conducting cell culture experiments under controlled conditions (pH, temperature, dissolved oxygen) to generate reliable data. |
| Analytical Instruments (HPLC, GC) | Used to measure Critical Quality Attributes (CQAs) from experiments, such as metabolite concentrations, product titer, and impurity levels, providing the response data for modeling [66]. |
Validating Model Predictions with Laboratory Experiments
In the field of medium optimization research, particularly for drug development, a significant shift is occurring from traditional Design of Experiment (DOE) methods to data-driven machine learning (ML) approaches. The core of this transition lies in the critical process of validating computational predictions with rigorous laboratory experiments. For researchers and scientists, this validation is not merely a procedural step but the foundation for building trust in model outputs and ensuring their practical applicability in bioprocess development. This guide provides an objective comparison of ML and traditional DOE performance, supported by experimental data and detailed protocols for robust validation.
Comparative Performance: Machine Learning vs. Traditional DOE
Traditional DOE approaches rely on structured, often factorial, experimental designs to build statistical models relating inputs to outputs. In contrast, machine learning models can learn complex, non-linear relationships directly from historical data. The table below summarizes a performance comparison based on a published study predicting the ultimate bearing capacity of shallow foundations—an analogous optimization problem—which provides a framework for understanding their potential in medium optimization [24].
Table 1: Comparative Performance of Machine Learning and Traditional Models
| Model Type | Specific Model/Theory | Training R² | Testing R² | Key Strengths | Key Limitations |
|---|---|---|---|---|---|
| Machine Learning | AdaBoost | 0.939 | 0.881 | High predictive accuracy, handles complex non-linear relationships [24]. | Risk of overfitting with small datasets; "black box" nature [24]. |
| k-Nearest Neighbors (kNN) | N/P | N/P | Simple, effective for data with clear clusters [24]. | Performance drops with high-dimensional data [24]. | |
| Random Forest (RF) | N/P | N/P | Robust to outliers, provides feature importance [24]. | Computationally intensive for very large datasets [24]. | |
| Extreme Gradient Boosting (xGBoost) | N/P | N/P | High speed and efficiency, built-in regularization [24]. | Requires careful hyperparameter tuning [24]. | |
| Artificial Neural Network (NN) | N/P | N/P | Can model highly complex, non-linear systems [24]. | High computational demand; large data requirements [24]. | |
| Traditional Method | Terzaghi (1943) Theory | N/P | N/P | Physically intuitive, well-established theoretical basis [24]. | Can be overly conservative; relies on simplifying assumptions [24]. |
| Hansen (1970) Theory | N/P | N/P | Refinement of earlier theories, more comprehensive factors [24]. | Can lead to increased construction costs and potential inaccuracies [24]. | |
| Vesic (1973) Theory | N/P | N/P | Further refinements for various foundation conditions [24]. | Oversimplifies soil behavior as homogeneous and isotropic [24]. |
N/P: The specific metric was not provided in the source for this model, but the overall model ranking was: AdaBoost > kNN > RF > xGBoost > NN > SGD [24].
Experimental Protocol for Model Validation
Validating a predictive model is an iterative, constructive process aimed at progressively building trust in its outputs [68]. The following workflow and detailed methodology outline how to corroborate ML or traditional model predictions with laboratory experiments.
Figure 1: The Iterative Model Validation Workflow. This diagram outlines the cyclic process of building trust in a model through repeated experimental testing and refinement [68].
Detailed Validation Methodology
The process illustrated in Figure 1 can be broken down into the following concrete steps:
Establish a Priori Trust and Define Model Scope: Begin by quantifying the initial confidence in the model,
V_prior, based on existing knowledge or preliminary data. If the model is new,V_priorcan be set to 1, as its relative change is more important than its absolute value [68]. Crucially, define the model's intended use and the specific conditions of the medium optimization problem (e.g., cell culture growth, protein expression yield).Conduct Laboratory Experiments: Execute a controlled laboratory study based on the model's input parameters. For medium optimization, this typically involves preparing culture media with varying concentrations of key components (e.g., glucose, amino acids, growth factors) as predicted by the model.
Generate Model Predictions: Input the exact experimental conditions (the input features) into the predictive model to obtain its forecasts for the outcomes (e.g., final cell density, product titer).
Statistical Comparison and Hypothesis Testing: Compare the model's predictions with the actual experimental measurements. This is formalized as a statistical test of significance [68]. The null hypothesis (H₀) is that the model is a sufficient representation of the real system. Use multiple metrics for a robust evaluation [24]:
- Coefficient of Determination (R²): Measures the proportion of variance in the observed data that is predictable from the model.
- Root Mean Squared Error (RMSE): Indicates the absolute magnitude of the average prediction error.
- Mean Absolute Error (MAE): Provides a linear score for the average error.
Iterate to Build Trust: The validation process is iterative [68]. If the model is rejected (i.e., shows statistically significant disagreement with the data), it must be refined and the cycle repeats. Each successful experiment increases the trust metric,
V_updated, moving the model closer to being validated for its intended use.
The Scientist's Toolkit: Research Reagent Solutions
The following table details essential materials and their functions for conducting validation experiments in bioprocess and medium optimization research.
Table 2: Key Research Reagents for Medium Optimization Validation
| Reagent/Material | Function in Validation Experiments |
|---|---|
| Chemically Defined Media Basal | Serves as a consistent, reproducible base for formulating different medium compositions as predicted by the model. Eliminates variability introduced by complex components like serum. |
| Growth Factors & Cytokines | Used as input variables to test the model's ability to predict their optimal concentrations for maximizing cell growth and viability (e.g., IGF-1, FGF, TGF-β). |
| Metabolite Standards | Essential for quantifying key metabolites (e.g., glucose, lactate, amino acids) via HPLC or GC-MS to collect high-quality data on medium consumption and byproduct formation. |
| Bioanalyzer & Consumables | Provides high-throughput, automated analysis of cell viability, density, and size. Generates critical output data for model validation. |
| ELISA/Kits for Product Titer | Measures the concentration of the target product (e.g., a recombinant protein, antibody, viral vector). This is a primary output variable for validating optimization models. |
Data Quality and Model Optimization
The performance of any model is fundamentally constrained by the quality of the data used for its training and validation [69]. Inaccurate, incomplete, or inconsistent experimental data will lead to unreliable models, regardless of the algorithmic sophistication.
Furthermore, ML models require careful optimization to perform effectively. Techniques such as hyperparameter tuning (e.g., using grid search, random search, or Bayesian optimization) and regularization (to prevent overfitting) are critical steps in the model development pipeline [70] [71]. For tree-based models like AdaBoost and xGBoost, which showed strong performance in our comparison, built-in regularization and boosting mechanisms contribute significantly to their predictive power [24] [71].
Visualizing the Validation Workflow
The following diagram provides a high-level overview of the entire validation workflow, connecting computational and laboratory activities.
Figure 2: Integrated Computational and Laboratory Workflow. This diagram shows the continuous feedback loop between model prediction and experimental validation, which is essential for iterative model improvement.
In the field of medium optimization research, particularly within pharmaceutical development, the choice of experimental design methodology is crucial. Researchers are often faced with a decision between traditional, statistically-based Design of Experiments (DOE) and modern Machine Learning (ML)-driven approaches. This guide objectively compares these methodologies and demonstrates how a hybrid strategy leverages the strengths of both to achieve superior robustness and efficiency.
Understanding the Core Methodologies
The foundational principles of traditional DOE and ML-driven sampling are fundamentally different, each with distinct strengths and weaknesses for exploring a parameter space.
Traditional Design of Experiments (DOE)
Traditional DOE encompasses a range of statistically planned strategies for efficient parameter space exploration. These methods are model-free, meaning the data points are selected based on statistical principles rather than on-the-fly data analysis [36].
- Key Optimization Criteria: The quality of a traditional design is often evaluated using specific optimality criteria focused on the information matrix [72]:
- D-Optimality: Aims to maximize the determinant of the information matrix. It minimizes the generalized variance of parameter estimates, making it ideal for precise multivariate estimation [72].
- A-Optimality: Seeks to minimize the trace of the inverse of the information matrix. This reduces the average variance of the parameter estimates, providing balanced precision [72].
- E-Optimality: Focuses on maximizing the smallest eigenvalue of the information matrix. This criterion safeguards against high worst-case variance in any direction, which is critical in sensitive applications [72].
- Space-Filling Designs: Strategies like Latin Hypercube Design (LHD) prioritize evenly covering the experimental region. This is especially valuable for exploratory research when the underlying model is unknown [36].
Machine Learning-Driven Active Learning
ML-driven approaches, specifically Active Learning (AL), represent a model-based paradigm. An initial predictive model is trained on a starting dataset, and this model then guides the sequential selection of subsequent data points from the parameter space [36].
- Core Mechanism: The model identifies areas where its predictions have the highest uncertainty or where information entropy is greatest. Sampling then focuses on these informative regions, aiming to reduce the overall prediction error as efficiently as possible [36].
- Inherent Stochasticity: Unlike most traditional DOE, AL strategies can be stochastic. Their performance may depend on the initial data, model hyperparameters, and random initializations, requiring multiple runs for a fair performance assessment [36].
Comparative Analysis: Traditional DOE vs. ML-Driven Approaches
The table below summarizes the objective comparison between the two methodologies, highlighting their respective pros, cons, and ideal use cases.
| Feature | Traditional DOE | ML-Driven Active Learning |
|---|---|---|
| Core Objective | Maximize information gain based on statistical planning (e.g., D, A, E-optimality) or space-filling [72] [36]. | Minimize model prediction error by sampling in high-uncertainty regions [36]. |
| Primary Strength | Provides a proven, deterministic framework. Excellent for establishing a robust foundational understanding of the factor space [72]. | High data efficiency; can significantly reduce the number of experiments needed to achieve a target model accuracy [36]. |
| Primary Weakness | Can be inefficient for very complex, high-dimensional relationships; may not adapt to the specific problem dynamics [36]. | Performance is tied to the quality of the initial model; can be computationally intensive and sensitive to initial conditions [36]. |
| Handling of Noise | Strategies like replication are explicitly designed to reduce the impact of stochastic noise [36]. | Can be misled by noisy data, as it may repeatedly sample noisy, high-uncertainty points [36]. |
| Computational Demand | Generally low; designs are generated offline without iterative model training [72]. | High; requires iterative model training, prediction, and uncertainty quantification [36]. |
| Ideal Application | Early-stage process characterization, factor screening, and quality-by-design where a structured approach is critical [72]. | Optimizing complex, non-linear systems (e.g., cell culture media) where experimental resources are limited and costly [36]. |
Supporting Experimental Data: A 2024 study in Scientific Reports benchmarked DOE strategies using an Automated Machine Learning (AutoML) workflow. The results demonstrated that the performance of ML-driven AL strategies is highly context-dependent. The study found that not all AL sampling strategies outperform conventional DOE strategies. The superiority of AL depends on the available data volume, the complexity of the dataset, and the level of data uncertainties. Furthermore, in scenarios with non-negligible noise, replication-oriented traditional strategies often proved more advantageous than broad exploration for ensuring model robustness [36].
The Hybrid Workflow: A Practical Implementation
The hybrid approach strategically blends traditional and ML methods to create a more robust and efficient validation pipeline. It uses traditional DOE to build a foundational model and ML to refine it.
Detailed Hybrid Workflow Protocol
The following diagram, generated from the DOT script below, illustrates the sequential and iterative stages of a robust hybrid validation workflow.
Phase 1: Initial Screening with Traditional DOE
- Objective: To efficiently cover the factor space and build a foundational dataset without prior knowledge.
- Protocol: Begin with a space-filling design like Latin Hypercube Design (LHD) or a screening design like a fractional factorial. This initial design should be executed with a predetermined number of experimental runs. The data collected here is used to train the first iteration of a predictive ML model [36].
Phase 2: Model-Guided Refinement with Active Learning
- Objective: To iteratively improve model accuracy by targeting experiments in the most informative regions of the parameter space.
- Protocol:
- Uncertainty Quantification: Use the current ML model to predict outcomes and estimate prediction uncertainty across the entire factor space.
- Query Strategy: Identify the factor combinations where the model's uncertainty is highest. Common strategies include querying the point with the largest predictive variance or using a committee-based approach (e.g., query-by-committee) [36].
- Iterative Loop: Run the new experiments selected by the query strategy. Add the new data to the training set and retrain/update the ML model. This loop continues until a pre-defined stopping criterion is met, such as a target model performance level, exhaustion of resources, or minimal incremental improvement [36].
Phase 3: Final Validation and Robustness Checking
- Objective: To ensure the final model is robust, generalizable, and not overfitted to the training data.
- Protocol: The performance of the final model must be evaluated on a completely independent test set that was not used in any phase of the training or active learning process. This set should be generated using a separate, dense sampling method (e.g., a large, random LHD) to provide a reliable estimate of the model's real-world performance [36].
The Scientist's Toolkit: Essential Research Reagents and Solutions
For researchers implementing this hybrid approach in a biopharma context, the following tools and reagents are critical.
| Item | Function in Hybrid Workflow |
|---|---|
| Cell Culture Media Components | The factors to be optimized (e.g., glucose, amino acids, growth factors). Their concentrations are the inputs in the experimental design. |
| Automated ML Platform (e.g., Auto-sklearn) | An Automated Machine Learning tool to standardize and accelerate the repetitive modeling tasks, ensuring a fair comparison between different DOE strategies and minimizing suboptimal modeling bias [36]. |
| High-Throughput Screening Assays | Enable the rapid generation of the initial DOE dataset and the subsequent iterative experiments required by the active learning loop. |
| Latin Hypercube Design (LHD) | A specific type of space-filling design highly recommended for generating the initial dataset in Phase 1, as it ensures broad coverage of the multi-dimensional factor space [36]. |
| Statistical Software (R/Python with DoE packages) | Essential for generating traditional DOE designs (e.g., DoE.base in R, pyDOE in Python) and for building the predictive ML models for the active learning phase [72]. |
The ultimate success of the hybrid approach is measured by its performance against pure traditional or pure ML methods. The following diagram, generated from the DOT script below, synthesizes findings from comparative studies to illustrate typical performance outcomes.
Conclusion:
The hybrid approach of blending traditional DOE with ML methods is not merely a compromise but a strategic integration for achieving robust validation in medium optimization. While traditional DOE provides a structured, reliable foundation and ML-driven active learning offers superior data efficiency for refinement, the hybrid model capitalizes on both. Evidence shows that a purely ML-driven approach can be fragile, especially with noisy data or in the very early stages of research [36]. By using traditional designs for initial screening and model-based active learning for targeted optimization, researchers can build more accurate, generalizable, and validated models with fewer resources, ultimately accelerating critical research and development timelines.
Conclusion
The evolution from Traditional DOE to ML-guided DOE represents a paradigm shift for medium optimization in biomedical research. While Traditional DOE offers a reliable, structured framework for well-characterized systems, ML-DOE provides a powerful, adaptive tool for navigating complex, multifactorial design spaces with significantly higher efficiency—potentially reducing experimental runs by 50-80%. The key takeaway is not that one replaces the other, but that they are complementary. The future lies in hybrid models that leverage the robustness of statistical DOE with the predictive power of ML. For clinical research, this means accelerated development of cell therapies, vaccines, and biomanufacturing processes, ultimately leading to faster translation of scientific discoveries into life-saving treatments. Researchers are encouraged to start with pilot projects to build confidence and data infrastructure, progressively integrating ML to drive innovation and maintain a competitive edge.
References
- 1. What Is Design of Experiments (DOE)? [https://asq.org/quality-resources/design-of-experiments?srsltid=AfmBOor-fSdXDAidqfWvYjOQLlJMQVNu8vKKUbxgJlDncPl859frWS59]
- 2. DOE Overview [https://help.reliasoft.com/reference/experiment_design_and_analysis/doe/doe_overview.html]
- 3. Design of experiments [https://en.wikipedia.org/wiki/Design_of_experiments]
- 4. A comprehensive guide to machine learning-mediated ... [https://www.sciencedirect.com/science/article/pii/S1878818125003238]
- 5. Comparing Traditional Approaches to Experimental Design [https://learning.acsgcipr.org/process-design/design-of-experiments/comparing-traditional-approaches-to-experimental-design/]
- 6. Machine learning-driven optimization of culture conditions ... [https://pmc.ncbi.nlm.nih.gov/articles/PMC12355708/]
- 7. Designing the design of experiments (DOE) [https://www.sciencedirect.com/science/article/pii/S037877882100582X]
- 8. Design of Experiment (DOE) or Machine Learning [https://citrine.io/doe/]
- 9. Difference between supervised machine learning and design ... [https://stats.stackexchange.com/questions/319085/difference-between-supervised-machine-learning-and-design-of-experiments]
- 10. Harnessing Artificial Intelligence for High-Impact Science [https://newscenter.lbl.gov/2025/04/29/harnessing-artificial-intelligence-for-high-impact-science/]
- 11. Machine learning and design of experiments with an ... [https://pmc.ncbi.nlm.nih.gov/articles/PMC9225671/]
- 12. A Comparative Study of Rule-Based and Data-Driven ... [https://arxiv.org/html/2509.15848v1]
- 13. Machine learning-led semi-automated medium ... [https://www.nature.com/articles/s42003-025-08039-2]
- 14. Choosing between a rule-based vs. machine learning system [https://www.techtarget.com/searchenterpriseai/feature/How-to-choose-between-a-rules-based-vs-machine-learning-system]
- 15. Rule-Based Vs. Machine Learning AI: Which Produces ... [https://www.pecan.ai/blog/rule-based-vs-machine-learning-ai-which-produces-better-results/]
- 16. Why you should combine DOE and machine learning [https://intellegens.com/why-you-should-combine-doe-and-machine-learning/]
- 17. Transitioning to Digital Bioprocessing with Hybrid Modeling ... [https://datahow.ch/transitioning-to-digital-bioprocessing-with-hybrid-modeling-technologies/]
- 18. Review on machine learning-based bioprocess ... [https://www.sciencedirect.com/science/article/abs/pii/S0960852422018569]
- 19. How Definitive Screening Designs Enable Faster, Cheaper ... [https://bioprocessingjournal.com/breaking-the-doe-bottleneck-how-definitive-screening-designs-enable-faster-cheaper-biologics-process-development/]
- 20. Machine learning framework to predict product distribution ... [https://www.sciencedirect.com/science/article/abs/pii/S0960852425007126]
- 21. Machine Learning‐Powered Optimization of a CHO Cell ... [https://pmc.ncbi.nlm.nih.gov/articles/PMC11975184/]
- 22. Comparison between response surface methodology and ... [https://www.nature.com/articles/s41598-025-94919-w]
- 23. A Study of the Response Surface Methodology Model with ... [https://www.mdpi.com/2571-5577/8/4/99]
- 24. Comparative performance evaluation of machine learning ... [https://www.nature.com/articles/s41598-025-13926-z]
- 25. Comparative analysis of the response surface ... [https://www.sciencedirect.com/science/article/pii/S2666086525000220]
- 26. Smart culture medium optimization for recombinant protein ... [https://www.sciencedirect.com/science/article/abs/pii/S0734975025002241]
- 27. Smart culture medium optimization for recombinant protein ... [https://pubmed.ncbi.nlm.nih.gov/41106510/]
- 28. Smarter Solutions: How Machine Learning Enables Rapid ... [https://convergecfd.com/blog/smarter-solutions-how-machine-learning-enables-rapid-optimization-in-cfd]
- 29. Using Design of Experiments (DoE) in Method Development [https://www.labmanager.com/using-design-of-experiments-doe-in-method-development-34251]
- 30. What Is Design of Experiments (DOE)? [https://asq.org/quality-resources/design-of-experiments?srsltid=AfmBOoqzTEDDjgc4PaND1Wg_k0042gcfgvm6_wefoafl8c-U1VNdDBKY]
- 31. Design of Experiments | Statistics Knowledge Portal [https://www.jmp.com/en/statistics-knowledge-portal/design-of-experiments]
- 32. Design of Experiments Introduction | by Victor Guiller [https://medium.com/@victor.guiller/design-of-experiments-introduction-ddb7a1a7dda9]
- 33. Employing active learning in the optimization of culture ... [https://pmc.ncbi.nlm.nih.gov/articles/PMC10229643/]
- 34. DoE-based medium optimization for improved ... [https://www.frontiersin.org/journals/bioengineering-and-biotechnology/articles/10.3389/fbioe.2024.1379707/full]
- 35. The Role of Machine Learning and Design of Experiments in ... [https://pmc.ncbi.nlm.nih.gov/articles/PMC9598592/]
- 36. AutoML based workflow for design of experiments (DOE) ... [https://www.nature.com/articles/s41598-024-83581-3]
- 37. A data-driven approach for cell culture medium optimization [https://www.sciencedirect.com/science/article/pii/S1369703X24003784]
- 38. Advancing drug development with “Fit-for-Purpose” modeling ... [https://pmc.ncbi.nlm.nih.gov/articles/PMC12436579/]
- 39. A review of algorithmic approaches for cell culture media ... [https://pmc.ncbi.nlm.nih.gov/articles/PMC10213948/]
- 40. One-Time Optimization of Advanced T Cell Culture Media ... [https://www.frontiersin.org/journals/bioengineering-and-biotechnology/articles/10.3389/fbioe.2021.614324/full]
- 41. Recent advances in culture medium design for enhanced ... [https://www.sciencedirect.com/science/article/abs/pii/S0734975024001745]
- 42. Employing active learning in the optimization of culture ... [https://www.nature.com/articles/s41540-023-00284-7]
- 43. Accelerating cell culture media development using ... [https://www.nature.com/articles/s41467-025-61113-5]
- 44. Biology-aware machine learning for culture medium ... [https://www.sciencedirect.com/science/article/pii/S1871678425000731]
- 45. AI Predictive Maintenance Use Cases in Pharma | 2025 Guide [https://f7i.ai/blog/beyond-the-buzz-7-real-world-ai-predictive-maintenance-use-cases-in-pharma-for-2025]
- 46. Machine learning model-based design and ... [https://www.sciencedirect.com/science/article/pii/S0967066124003575]
- 47. Future of Predictive Maintenance with AI and Machine ... [https://visionx.io/blog/future-of-predictive-maintenance/]
- 48. Enhanced Performance of Wastewater Membrane ... [https://www.mdpi.com/2673-4591/91/1/4]
- 49. Explainable machine-learning tools for predictive ... [https://www.sciencedirect.com/science/article/pii/S1738573325001561]
- 50. Using design of experiments to guide genetic optimization of ... [https://pmc.ncbi.nlm.nih.gov/articles/PMC10981448/]
- 51. What limits the effectiveness of DOE? [https://intellegens.com/overcoming-limitations-of-conventional-doe/]
- 52. 5.1.3. What are the steps of DOE? [https://www.itl.nist.gov/div898/handbook/pri/section1/pri13.htm]
- 53. An exploratory model-based design of experiments ... [https://www.sciencedirect.com/science/article/pii/S0098135423002235]
- 54. Top 10 Tools for Achieving AI Transparency and ... [https://superagi.com/top-10-tools-for-achieving-ai-transparency-and-explainability-in-2025-2/]
- 55. The 7 Biggest AI Adoption Challenges for 2025 [https://www.stack-ai.com/blog/the-biggest-ai-adoption-challenges]
- 56. Running Out Of Data: It's A Strange Problem [https://www.forbes.com/sites/johnwerner/2025/10/15/running-out-of-data-its-a-strange-problem/]
- 57. The Future of Artificial Intelligence in the Face of Data ... [https://www.sciencedirect.com/org/science/article/pii/S1546221825005375]
- 58. 50 Statistics Every Technology Leader Should Know in 2025 [https://www.integrate.io/blog/data-transformation-challenge-statistics/]
- 59. Data Quality Problems? 8 Ways to Fix Them in 2025 [https://atlan.com/data-quality-problems/]
- 60. Evaluating transparency in AI/ML model characteristics for ... [https://www.nature.com/articles/s41746-025-02052-9]
- 61. Design of experiments and machine learning with ... [https://link.springer.com/article/10.1007/s00362-023-01437-w]
- 62. Design of experiments informed deep learning for ... [https://www.sciencedirect.com/science/article/pii/S0264127522007201]
- 63. Best Tools for ML Experiment Tracking and Management in ... [https://neptune.ai/blog/best-ml-experiment-tracking-tools]
- 64. How to maximize ROI on AI in 2025 [https://www.ibm.com/think/insights/ai-roi]
- 65. Machine learning-assisted medium optimization revealed the ... [https://pmc.ncbi.nlm.nih.gov/articles/PMC10149329/]
- 66. 5 Benefits Of Leveraging Machine Learning In Your ... [https://grace.com/insights/5-Benefits-Of-Leveraging-Machine-Learning-In-PD-Workflows/]
- 67. Leveraging Design of Experiments and Machine Learning ... [https://www.linkedin.com/pulse/leveraging-design-experiments-machine-learning-product-sayed-utkef]
- 68. Algorithm for model validation: Theory and applications [https://pmc.ncbi.nlm.nih.gov/articles/PMC1871825/]
- 69. The effects of data quality on machine learning ... [https://www.sciencedirect.com/science/article/pii/S0306437925000341]
- 70. AI Model Optimization Techniques for Enhanced ... [https://www.netguru.com/blog/ai-model-optimization]
- 71. Recent Advances in Optimization Methods for Machine ... [https://www.mdpi.com/2227-7390/13/13/2210]
- 72. Criteria in Optimization : A Guide DOE [https://www.numberanalytics.com/blog/optimization-criteria-doe-guide]