Breaking the Barrier: Novel Strategies to Enhance Antibiotic Penetration in Bacterial Biofilms
This article addresses the critical challenge of antibiotic penetration through the biofilm matrix, a major contributor to treatment failure in chronic infections.
Breaking the Barrier: Novel Strategies to Enhance Antibiotic Penetration in Bacterial Biofilms
Abstract
This article addresses the critical challenge of antibiotic penetration through the biofilm matrix, a major contributor to treatment failure in chronic infections. Aimed at researchers and drug development professionals, it provides a comprehensive analysis of the biofilm barrier's structural and functional basis. The scope ranges from foundational concepts of biofilm-mediated resistance to cutting-edge methodological approaches for enhancing drug delivery. It further explores troubleshooting for combinatorial therapies and discusses advanced validation models. The synthesis of these areas aims to guide the development of effective clinical interventions against resilient biofilm-associated infections.
Deconstructing the Fortress: Understanding the Biofilm Matrix as a Physical and Physiological Barrier
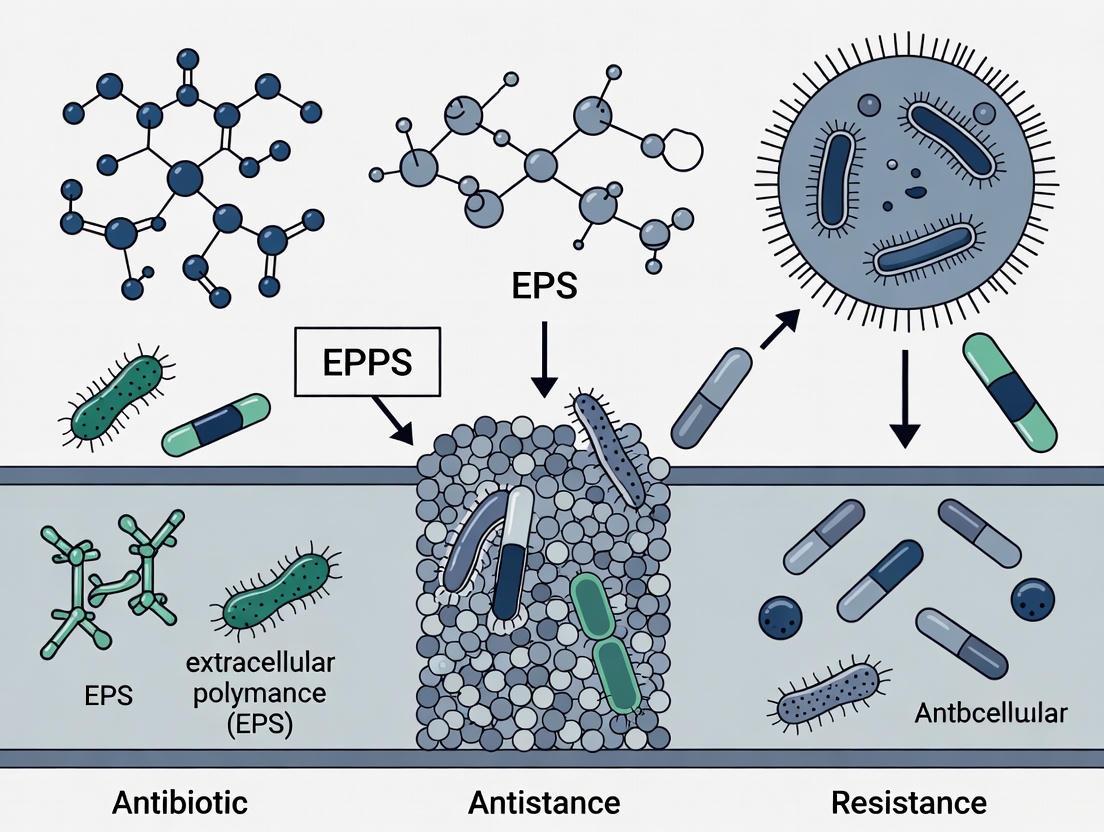
Composition and Architecture of the Extracellular Polymeric Substance (EPS) Matrix
FAQs: Core Concepts and Troubleshooting
FAQ 1: What are the main components of the EPS matrix and their primary functions? The EPS matrix is a complex mixture of biopolymers. It is more than just polysaccharides and includes proteins, nucleic acids, and lipids. The key components and their functions are summarized in the table below [1] [2].
| EPS Component | Primary Functions |
|---|---|
| Polysaccharides | Structural scaffolding, water retention, mechanical stability, adhesion to surfaces [1]. |
| Proteins & Glycoproteins | Structural support (e.g., amyloid adhesins), enzymatic activity (polymer degradation), specific recognition [1]. |
| Extracellular DNA (e-DNA) | Structural integrity (intercellular connector, filamentous networks), horizontal gene transfer, cation chelation [1] [3]. |
| Lipids & Amphiphiles | Interface interactions, surface-active properties [1]. |
| Membrane Vesicles | Act as "parcels" for enzyme/nucleic acid transport, "biological warfare" via lytic enzymes [1]. |
FAQ 2: Why is the EPS matrix a major barrier to effective antibiotic treatment? The EPS matrix contributes to antibiotic resistance through multiple, interconnected mechanisms [3]. It is not just a physical barrier but a dynamic functional component of biofilm resistance.
- Limited Antibiotic Penetration: The matrix can physically hinder the diffusion of antibiotics. Positively charged antibiotics (e.g., aminoglycosides like tobramycin) can bind to negatively charged matrix components like e-DNA or alginate, sequestering them at the biofilm periphery and preventing deep penetration [3] [4]. However, this is antibiotic-specific; neutral antibiotics like ciprofloxacin often penetrate more readily [4].
- Physiological Heterogeneity: The 3D structure creates gradients of nutrients, oxygen, and waste products. This leads to zones of slow-growing or dormant persister cells that are highly tolerant to antibiotics [3] [5].
- Enhanced Efflux Pumps: Expression of multidrug efflux pumps can be upregulated in biofilm cells, actively expelling antibiotics [5].
- Enzymatic Inactivation: Extracellular enzymes within the matrix can degrade or inactivate some antibiotics [3].
FAQ 3: Our antibiotic penetration data is inconsistent. What factors could be causing this? Inconsistent penetration data is a common challenge. Key factors to control in your experiments are listed in the following table [6] [3] [4].
| Factor | Impact on Penetration & Resistance |
|---|---|
| Bacterial Genus & Strain | EPS composition and matrix structure vary significantly between species and even strains (e.g., S. aureus vs. P. aeruginosa) [6]. |
| Antibiotic Chemistry | Molecular charge, size, and hydrophobicity critically affect diffusion and binding (e.g., tobramycin vs. ciprofloxacin) [6] [4]. |
| Biofilm Age & Growth Conditions | Nutrient availability, carbon source, and shear stress can alter EPS production and biofilm architecture [3]. |
| Matrix Composition | The specific makeup of polysaccharides, e-DNA, and proteins determines the binding and diffusion properties of the matrix [1] [4]. |
FAQ 4: How does the EPS matrix create microenvironments that enhance virulence? The EPS matrix is not a homogeneous gel. It forms a complex 3D architecture with bacterial-islets or microcolonies enmeshed in a polymer network [7]. This structure creates compartmentalized microenvironments:
- Acidic Niches: Bacterial metabolism in the protected interiors of microcolonies produces acids. The EPS network retards the diffusion of buffers, leading to sustained acidic pockets that demineralize tooth enamel in dental caries or may alter antibiotic efficacy [7].
- Synergistic Interactions: In multi-species biofilms, the matrix facilitates metabolic cooperation and protects mutualistic consortia, enhancing overall community virulence and resilience [7].
Experimental Protocols & Data
Protocol: Agar Disk Diffusion Assay for Antibiotic Penetration
This protocol assesses the ability of antibiotics to diffuse through a biofilm, adapted from published methods [6] [8].
Principle: An antibiotic disk is placed on top of a pre-formed biofilm. The antibiotic must diffuse through the biofilm to reach the underlying lawn of indicator cells on agar. The resulting zone of inhibition reflects the antibiotic's penetration capacity.
Materials:
- Mueller-Hinton Agar (MHA) plates
- Sterile antibiotic disks
- Test bacterial strain for biofilm formation
- Indicator lawn culture
Procedure:
- Biofilm Formation: Grow a biofilm of your test strain on a sterile membrane placed on MHA for 24-48 hours.
- Lawn Preparation: Create a uniform lawn of the indicator cells on a fresh MHA plate.
- Assay Setup: Carefully transfer the biofilm-covered membrane onto the surface of the seeded agar lawn.
- Antibiotic Application: Place an antibiotic disk on top of the biofilm.
- Incubation and Analysis: Incubate the plate and measure the zone of inhibition after 18-24 hours. Compare this to a control where the disk is placed directly on the lawn without a biofilm.
Protocol: Direct Measurement of Antibiotic Penetration using Fluorescent Tags
This protocol uses fluorescently labeled antibiotics and confocal microscopy to visualize penetration in real-time [4].
Principle: Antibiotics are conjugated to a fluorophore (e.g., Cy5). The diffusion of these tagged molecules through a live biofilm is monitored using time-lapse confocal microscopy.
Materials:
- Fluorescently labeled antibiotics (e.g., Cy5-tobramycin, Cy5-ciprofloxacin)
- Confocal Laser Scanning Microscope (CLSM)
- Flow cell or chamber for growing biofilms under shear stress
Procedure:
- Biofilm Growth: Grow a structured biofilm in a flow cell system with appropriate media.
- Antibiotic Exposure: Stop the flow and introduce the solution of fluorescent antibiotic.
- Image Acquisition: Use CLSM to capture Z-stack images at regular intervals (e.g., every 2.5 minutes) during the static exposure phase.
- Wash Phase: Resume flow with buffer to wash off unbound antibiotic, continuing image acquisition.
- Data Analysis: Analyze the time-series images to determine the rate and depth of antibiotic penetration and identify any spatial sequestration.
Quantitative Penetration Data
The table below summarizes experimental findings on the penetration of different antibiotics through various biofilms [6] [4].
| Antibiotic | Class | Charge | Biofilm Model | Key Penetration Finding |
|---|---|---|---|---|
| Tobramycin | Aminoglycoside | Positive | P. aeruginosa (non-mucoid) | Sequestered at biofilm periphery (~4.6 µm penetration); limited penetration due to ionic interactions [4]. |
| Ciprofloxacin | Fluoroquinolone | Neutral | P. aeruginosa (non-mucoid) | Readily penetrated the biofilm; no significant barrier [4]. |
| Vancomycin | Glycopeptide | Variable | Staphylococcus spp. | Penetration was hindered [6]. |
| Chloramphenicol | Phenicol | Neutral | Staphylococcus spp., E. coli, K. pneumoniae | Penetration was hindered, indicating factors beyond just charge can be at play [6]. |
Visualization: EPS Matrix and Antibiotic Barrier
EPS Matrix-Mediated Antibiotic Resistance
The Scientist's Toolkit: Research Reagent Solutions
| Reagent / Material | Function in EPS & Penetration Research |
|---|---|
| Cation Exchange Resin (CER) | Used in standard EPS extraction protocols to disrupt ionic interactions between matrix components and cells [9]. |
| Fluorescently Labeled Lectins | Binds to specific sugar residues, allowing in situ visualization of exopolysaccharides in the biofilm matrix without extraction [1]. |
| Fluorescent Antibiotics (e.g., Cy5-conjugated) | Enable real-time, direct visualization and quantification of antibiotic penetration and localization within biofilms via microscopy [4]. |
| DNase I | An enzyme that degrades extracellular DNA (e-DNA). Used to probe the structural and protective role of e-DNA in the matrix [3]. |
| Specific Glycoside Hydrolases | Enzymes that break down specific polysaccharides (e.g., cellulase, amylase). Used to dissect the role of particular exopolysaccharides [3]. |
| Cyclic-di-GMP | A key intracellular secondary messenger molecule. High levels promote biofilm formation; used to study matrix regulation [3]. |
Frequently Asked Questions (FAQs)
Q1: What are the primary mechanisms by which the biofilm matrix hinders antibiotic diffusion?
The biofilm matrix impedes antibiotic penetration through two major mechanisms: molecular sequestration via binding interactions, and the physical barrier created by the dense extracellular polymeric substance (EPS).
- Molecular Sequestration: Positively charged antibiotic molecules, such as tobramycin, can be electrostatically bound and sequestered by negatively charged components within the biofilm matrix, including filamentous Pf bacteriophages, extracellular DNA (eDNA), and polymers. This binding significantly reduces the amount of free, active antibiotic available to reach bacterial cells [10] [11].
- Physical Barrier: The EPS, a dense network of polysaccharides, proteins, and nucleic acids, acts as a diffusion barrier. It can slow the inward diffusion of antibiotics through mechanisms including molecular sieving, increased path length, and interaction with matrix components. In some cases, antibiotics can be trapped and inactivated by enzymes present in the matrix [11] [12] [13].
Q2: Why are some antibiotics more affected by these mechanisms than others?
The impact is highly dependent on the physicochemical properties of the antibiotic, particularly its molecular charge and size.
- Charge: Antibiotics with a strong positive charge (e.g., aminoglycosides like tobramycin, polymyxins like colistin) are more susceptible to electrostatic sequestration by anionic matrix components. In contrast, neutral antibiotics (e.g., ciprofloxacin) demonstrate much better diffusion through the same biofilm [10].
- Size and Hydrophobicity: Larger molecules and those with specific hydrophobic/hydrophilic properties can be hindered by the mesh-like structure of the EPS, which acts as a molecular sieve [12].
Q3: What is the role of Pf bacteriophages in antibiotic tolerance?
Pf bacteriophages, filamentous viruses produced by Pseudomonas aeruginosa, have been identified as a key structural element in biofilms that exacerbates antibiotic tolerance.
- Liquid Crystal Formation: Pf phages can interact with anionic polymers in the sputum (e.g., DNA, mucin) to form organized liquid crystalline structures [10].
- Enhanced Binding: These liquid crystalline assemblies exhibit a greater binding constant for charged antibiotics like tobramycin compared to individual polymers, leading to more effective sequestration and a sharper reduction in the antibiotic's diffusion coefficient [10].
- Physical Shielding: Pf phages can form dense, occlusive sheaths around bacterial cells, physically shielding them from antibiotic exposure [10].
Q4: What emerging strategies can overcome these diffusion barriers?
Research is focused on developing innovative delivery systems that can penetrate the biofilm matrix more effectively.
- Nanocarriers: Framework Nucleic Acids (FNAs), particularly DNA tetrahedrons (Td), have shown exceptional promise. Their defined 3D structure and biocompatibility allow for superior penetration into the biofilm depth. When loaded with antibiotics like Polymyxin B, these nanocarriers enhance biofilm permeability and bacterial killing efficacy both in vitro and in vivo [14] [15].
- Efflux Pump Inhibitors: Compounds that inhibit bacterial efflux pumps can reduce the biofilm's ability to expel antibiotics that have managed to penetrate, thereby increasing intracellular antibiotic concentration [12].
- Bacteriophage Therapy: Using specific bacteriophages that target and degrade the biofilm matrix or lyse the bacterial cells within is another active area of investigation [16].
Troubleshooting Common Experimental Challenges
Problem: Variable Antibiotic Diffusion Results in FRAP Assays
Challenge: Inconsistent or irreproducible measurements of antibiotic diffusion coefficients in biofilms using Fluorescence Recovery After Photobleaching (FRAP).
Solution:
- Standardize Matrix Composition: Biofilm heterogeneity is a major confounder. For mechanistic studies, use a defined "simple sputum" model containing consistent concentrations of key polymers like DNA (e.g., 4 mg/ml) and mucin. This reduces patient-to-patient sample variability [10].
- Control Antibiotic Charge: Always include a neutral-charge antibiotic control (e.g., Cy5-labelled ciprofloxacin) alongside your charged target antibiotic (e.g., Cy5-labelled tobramycin). The neutral molecule should show faster recovery, serving as an internal control for your assay system [10].
- Verify Labeling Integrity: Ensure the fluorescent tag (e.g., Cy5) does not alter the charge or biological activity of the antibiotic. Use isothermal titration calorimetry (ITC) to confirm that the binding interactions of the labelled antibiotic mirror those of the unlabeled compound [10].
Problem: Ineffective Antibiotic Penetration in a Chronic Infection Model
Challenge: An antibiotic that is effective in standard susceptibility testing fails to eradicate bacteria in a biofilm model.
Solution:
- Profile the Matrix: Characterize the specific composition of your biofilm model. Use PCR to check for the presence of Pf bacteriophages and assays to quantify eDNA, as these are major sequestration agents [10].
- Consider Combination Therapy: Pair your antibiotic with an adjuvant that disrupts the matrix. For instance, use DNase I to degrade eDNA or metallic nanoparticles that can disrupt EPS integrity, thereby improving antibiotic access [11] [16].
- Employ a Advanced Delivery System: Formulate the antibiotic into a penetrating nanocarrier. The DNA tetrahedron (Td) platform has demonstrated a 6-fold increase in biofilm permeability for Polymyxin B compared to the free drug, leading to lower eradication concentrations [14] [15].
Quantitative Data on Antibiotic-Biofilm Interactions
Table 1: Diffusion Coefficients and Efficacy of Antibiotics in Biofilm Models
| Antibiotic | Charge at physiological pH | Apparent Diffusion Coefficient (tau⁻¹) in Sputum | Impact of Pf Phage on Diffusion & Efficacy | Key Interacting Matrix Components |
|---|---|---|---|---|
| Tobramycin | Positive [10] | Significantly lower in Pa+Pf+ sputum [10] | Highly statistically significant decrease in bacterial killing; Slower diffusion [10] | Pf phages, eDNA, mucin [10] |
| Colistin/Polymyxin B | Positive [10] | Data not provided in search results | Highly statistically significant decrease in bacterial killing [10] | Pf phages, eDNA, mucin [10] |
| Ciprofloxacin | Neutral [10] | Less affected; faster recovery in FRAP [10] | Minimal impact on diffusion and efficacy [10] | Limited interaction due to neutral charge [10] |
| Aztreonam | Data not provided | Data not provided in search results | Less statistically significant decrease in killing [10] | Data not provided |
Table 2: Performance of a Novel Nano-Delivery System
| Delivery System | Antibiotic Loaded | Biofilm Permeability (Relative to Free Drug) | Half-Maximal Biofilm Eradication Concentration (MBEC₅₀) | Key Advantage |
|---|---|---|---|---|
| Free PMB | Polymyxin B | 1x (Baseline) | >16.3 µM [14] | Baseline |
| PMB@Lipo (Liposome) | Polymyxin B | Data not provided | 16.3 µM [14] | Conventional nanocarrier |
| PMB@Td (DNA Tetrahedron) | Polymyxin B | 6-fold increase [14] | 12.8 µM [14] | Superior penetration & lower toxicity [14] |
Detailed Experimental Protocols
Protocol 1: Measuring Antibiotic Diffusion using FRAP
This protocol is adapted from studies investigating tobramycin diffusion in CF sputum [10].
Key Research Reagent Solutions:
- Fluorescently-labeled Antibiotics: e.g., Cy5-TOB (Tobramycin), Cy5-CIP (Ciprofloxacin). Verify that labeling does not alter antimicrobial activity.
- Artificial Sputum Medium: A defined polymer mixture: DNA (4 mg/ml) and mucin (to 8% solids w/w) in buffer to standardize the matrix [10].
- FRAP Microscope: Confocal laser scanning microscope equipped with a photobleaching module.
Methodology:
- Sample Preparation: Mix the biofilm matrix (e.g., patient sputum or artificial sputum) homogeneously with the fluorescent antibiotic. For test conditions, spike the sample with purified Pf phage.
- Photobleaching: Use a high-intensity laser to irreversibly photobleach a defined region of interest (ROI) within the sample, eliminating fluorescence in that spot.
- Recovery Monitoring: Immediately after bleaching, monitor the fluorescence intensity within the bleached ROI over time (e.g., 3-5 minutes). Fluorescent molecules from the surrounding, unbleached area will diffuse back into the ROI.
- Data Analysis: Plot the fluorescence recovery curve. Calculate the apparent diffusion coefficient (tau⁻¹) from this curve, which provides a quantitative measure of the antibiotic's mobility within the biofilm environment [10].
Protocol 2: Fabricating a DNA Tetrahedron (Td) for Antibiotic Delivery
This protocol is based on the synthesis of framework nucleic acid (FNA) carriers [14] [15].
Key Research Reagent Solutions:
- DNA Oligonucleotides: Four specifically designed single-stranded DNA sequences (Td-S1, Td-S2, Td-S3, Td-S4) that are complementary to form the tetrahedron's edges.
- TM Buffer: 12.5 mM Tris, 5 mM MgCl₂, pH 7.8-8.0. Mg²⁺ ions are crucial for proper folding and stability.
- Polymyxin B (PMB): The antibiotic cargo for loading into the Td.
Methodology:
- Self-Assembly: Mix the four DNA strands at an equimolar concentration in TM buffer.
- Thermal Annealing: Heat the mixture to 95°C for 5 minutes in a thermal cycler to denature the strands, then rapidly cool the sample on ice for 1 hour. This controlled cooling allows the strands to self-assemble into the rigid, 3D tetrahedral structure.
- Purification and Characterization: Verify successful assembly using 1.5% agarose gel electrophoresis (Td migrates as a distinct band). Confirm structure and size with Atomic Force Microscopy (AFM) and Dynamic Light Scattering (DLS).
- Drug Loading: Incubate the purified Td with Polymyxin B at an optimal molar ratio (e.g., 10:1, PMB:Td) at 37°C for 30 minutes to form PMB@Td complexes [14].
- Efficacy Testing: Evaluate the penetration and antibacterial efficacy of PMB@Td against pre-formed biofilms using assays like MBEC determination and confocal microscopy to visualize depth of penetration.
Mechanistic Diagrams
Diagram Title: Molecular Sequestration Hinders Antibiotic Diffusion
Diagram Title: DNA Tetrahedron Delivery System Workflow
The Role of Metabolic Heterogeneity and Nutrient Gradients in Creating Tolerant Persister Cells
Frequently Asked Questions (FAQs)
FAQ 1: What are the primary metabolic characteristics of persister cells within a biofilm? Persister cells are a sub-population of metabolically dormant or slow-growing bacterial cells within an isogenic population. They are not genetically resistant but exhibit multi-drug tolerance. Key metabolic features include:
- Reduced Growth and Metabolism: Persisters often reside in a slow- or non-growing state, with transcriptome analyses indicating a downregulation of metabolic genes [17].
- Active but Altered Metabolic Pathways: Despite overall dormancy, specific metabolic pathways can remain active. Isotopolog profiling in Staphylococcus aureus persisters has demonstrated active amino acid anabolism, glycolysis, TCA cycle, and pentose phosphate pathway, even under antibiotic challenge [17].
- Response to Nutrient Availability: The presence of certain carbohydrates can act as a trigger for persisters to exit the dormant state, while nutrient starvation can induce and maintain the persister phenotype [17].
FAQ 2: How do nutrient gradients within a biofilm drive the formation of persister cells? Nutrient gradients are a fundamental feature of biofilm architecture and a key driver of persister formation.
- Oxygen and Nutrient Gradients: From the biofilm surface to the substratum, gradients of oxygen and nutrients are established. Cells in the inner layers experience nutrient limitation and hypoxia [18].
- Induction of a Stress Response: This nutrient shortage activates stress responses. A central mediator is the stringent response, signaled by the alarmone (p)ppGpp, which is triggered by amino acid depletion [17].
- Activation of Toxin-Antitoxin (TA) Systems: The stringent response and other stress signals can activate TA systems. The toxins from these systems can then corrupt essential cellular functions like translation and replication, forcing cells into a dormant, persistent state [17] [19].
FAQ 3: What are the key signaling molecules and pathways linking nutrient stress to persister cell formation? Several interconnected signaling pathways translate nutrient stress into the persister phenotype.
- (p)ppGpp (Stringent Response): This is a key alarmone that accumulates during amino acid or carbon starvation. High levels of ppGpp are associated with reduced growth, RNA polymerase activity, and the activation of TA systems, leading to increased antibiotic tolerance [17].
- Toxin-Antitoxin (TA) Systems: TA systems are major regulators of persister formation. Toxins such as HipA and RelE can inhibit vital processes like translation, inducing dormancy. Their activity is tightly regulated by nutritional cues and ppGpp [17].
- cAMP-CRP Complex: In conditions of low glucose, intracellular cAMP levels rise. The cAMP-CRP complex can activate the expression of genes involved in persistence, including relA (increasing ppGpp) and the stationary-phase cold shock protein CspD, which inhibits DNA replication [17].
FAQ 4: My experiments yield low and inconsistent persister cell counts. What could be going wrong? Inconsistent persister levels are a common challenge, often stemming from variations in experimental conditions.
- Inoculum Age and Growth Phase: The growth stage of the culture is critical. Stationary-phase cultures typically have much higher persister levels than exponential-phase cultures. Ensure the inoculum age is consistent between experiments [17].
- Insufficient Antibiotic Kill Step: The concentration and duration of antibiotic treatment used to isolate persisters must be optimized to kill all non-persister cells without being toxic to the persisters themselves.
- Natural Heterogeneity and Sample Timing: Persister formation can be stochastic. Using synchronized cultures and precise timing for sampling and antibiotic addition can improve reproducibility [17].
- Failure to Induce Stress: For consistent results, explicitly inducing a stress response (e.g., nutrient limitation, oxidative stress) before antibiotic treatment can help standardize persister levels.
FAQ 5: Which experimental techniques are best for directly studying the metabolism of persister cells? Studying persister metabolism is challenging due to their low abundance and the difficulty of isolating them without altering their state.
- Isotopolog Profiling (¹³C-Tracing): This powerful technique involves feeding cells ¹³C-labeled nutrients (e.g., glucose) and tracking the label into metabolic intermediates. It reveals the relative activity of different metabolic pathways in persisters, as demonstrated in S. aureus [17].
- Fluorescence-Activated Cell Sorting (FACS): Cells can be stained with fluorescent dyes that report on metabolic activity (e.g., redox potential or membrane potential). Persisters can be separated from active cells using FACS based on these dyes or reporters like unstable GFP [17].
- Phenotype Microarrays: These are high-throughput screens that assay the metabolic activity of cells by measuring their ability to reduce a tetrazolium dye in the presence of various carbon sources, providing a profile of metabolic capabilities [17].
Data Presentation: Quantitative Analysis of Persister Cell Physiology
The following table summarizes key metabolic and physiological parameters that differ between persister and actively growing planktonic cells.
Table 1: Comparative Physiology of Planktonic vs. Persister Cells
| Parameter | Planktonic (Active) Cells | Persister (Dormant) Cells | Experimental Evidence / Notes |
|---|---|---|---|
| Growth Rate | High | Non- or slow-growing (dormant) | Defined characteristic; observed in E. coli, S. aureus, M. tuberculosis [17] |
| Metabolic Activity | High | Significantly reduced, but specific pathways active | Transcriptome data shows downregulation of metabolic genes; isotopolog profiling shows selective pathway activity [17] |
| ATP Levels | High | Variable; can be low or maintained | Conflicting data: E. coli mutants with low ATP had fewer persisters, while inhibition of ATP synthesis increased persistence [17] |
| Proton Motive Force (PMF) | High | Can be reduced | Expression of the TisB toxin decreases PMF and increases persister formation [17] |
| (p)ppGpp Level | Low | High | A key trigger; mimics nutrient starvation and activates TA systems [17] |
| Antibiotic Tolerance | Low | High (up to 1000x more tolerant) | Up to 1000x greater resistance to antibiotics compared to planktonic counterparts [19] |
| Primary Induction Signal | N/A | Nutrient starvation, stress signals, QS molecules | Induced by gradients in biofilms, stochastic events, or external cues like indole [17] [18] |
Table 2: Impact of Specific Nutrient Gradients on Persister Mechanisms
| Nutrient Condition | Signaling Pathway Activated | Downstream Effect on Persistence | Key Genes/Proteins Involved |
|---|---|---|---|
| Amino Acid Starvation | Stringent Response | (p)ppGpp accumulation, TA system activation | relA, spoT, hipA, relE [17] |
| Carbon/Glucose Starvation | cAMP-CRP & Stringent Response | Increased ppGpp, CspD expression inhibits DNA replication | cya, crp, cspD [17] |
| General Nutrient Limitation (in biofilms) | (p)ppGpp & TA Systems | Metabolic shutdown, dormancy | Various TA loci (hipBA, tisB/istR), spoT [17] [19] |
| Phosphate Limitation | Pho Regulon & Stringent Response | Metabolic adaptation, potential overlap with persistence pathways | phoB, phoR |
Experimental Protocols for Studying Persister Metabolism
Protocol 1: Inducing Persisters via Nutrient Gradients in a Biofilm Model
This protocol describes how to generate persister cells using a simple biofilm model that creates nutrient gradients.
- Principle: Growing biofilms in a static, nutrient-rich medium leads to the formation of oxygen and nutrient gradients, inducing a sub-population of persister cells in the anoxic/nutrient-depleted inner layers [18].
- Materials:
- Bacterial strain (e.g., Pseudomonas aeruginosa, Staphylococcus aureus)
- Rich broth medium (e.g., LB, TSB)
- Sterile flat-bottomed polystyrene plates or cell culture flasks
- Phosphate Buffered Saline (PBS)
- Appropriate antibiotics for selection and killing
- Procedure:
- Biofilm Growth: Inoculate bacteria in rich medium within a well plate or flask. Incubate statically for 48-72 hours at the optimal growth temperature to allow for robust biofilm formation.
- Biofilm Harvesting: Carefully remove and discard the planktonic culture. Gently wash the adhered biofilm twice with PBS to remove loosely attached cells.
- Persister Isolation: Add a high concentration of a bactericidal antibiotic (e.g., 100x MIC of ciprofloxacin) in fresh medium or PBS to the biofilm. Incubate for a defined period (e.g., 5-24 hours) to kill all metabolically active, non-persister cells.
- Cell Recovery: Remove the antibiotic solution and wash the biofilm with PBS. To harvest the viable persisters, scrape the biofilm into PBS and vortex vigorously or sonicate at low power to disaggregate clumps.
- Enumeration: Serially dilute the cell suspension and plate on nutrient agar. The resulting colonies represent the persister population that survived antibiotic treatment.
Protocol 2: Analyzing Metabolic Flux in Persisters using ¹³C Isotopolog Profiling
This protocol outlines the core steps for using ¹³C-labeled substrates to investigate which metabolic pathways are active in persister cells.
- Principle: Feeding cells a ¹³C-labeled nutrient (e.g., [U-¹³C]-glucose) allows for tracking the flow of carbon through central metabolic pathways. The distribution of the ¹³C label in proteinogenic amino acids and other metabolites can be analyzed by Gas Chromatography-Mass Spectrometry (GC-MS) to infer relative pathway activities [17].
- Materials:
- Purified persister cell population
- Defined minimal medium
- [U-¹³C]-Glucose (or other ¹³C-labeled substrate)
- GC-MS system with appropriate analytical column
- Derivatization reagents
- Procedure:
- Pulse Labeling: Resuspend the purified persister cells in minimal medium containing the ¹³C-labeled substrate. Incubate for a specific "pulse" period (e.g., 30-120 minutes) to allow the label to be incorporated into metabolites.
- Metabolite Extraction: Quench metabolism rapidly (e.g., using cold methanol). Extract intracellular metabolites.
- Derivatization and GC-MS Analysis: Derivatize the metabolites (e.g., to form TMS derivatives) to make them volatile for GC-MS analysis. Run the samples on the GC-MS to obtain mass spectra for key metabolites.
- Data Analysis: Analyze the mass spectral data to determine the ¹³C-labeling patterns (isotopolog distribution). For example, the labeling in glutamate (derived from TCA cycle α-ketoglutarate) and alanine (derived from glycolysis) can reveal the relative activities of the TCA cycle and glycolysis, respectively. Compare the labeling patterns to those from actively growing cells to identify differences in metabolic flux [17].
The Scientist's Toolkit: Research Reagent Solutions
Table 3: Essential Reagents for Studying Persister Cell Metabolism
| Reagent / Material | Function / Application in Persister Research | Example Use Case |
|---|---|---|
| ¹³C-labeled Substrates (e.g., Glucose, Acetate) | Tracing metabolic flux in central carbon metabolism via isotopolog profiling. | Determine if the TCA cycle is active in persisters isolated from a biofilm [17]. |
| Tetrazolium Dyes (e.g., CTC, XTT) | Serve as indicators of microbial respiration and metabolic activity. | Used in phenotype microarrays to profile the metabolic capabilities of persister-enriched populations [17]. |
| Carbonyl Cyanide m-Chlorophenyl Hydrazone (CCCP) | A protonophore that dissipates the proton motive force (PMF). | Experimentally test the role of energy generation in persister formation and survival [17]. |
| Anti-(p)ppGpp Antibodies / HPLC-MS | Detection and quantification of the stringent response alarmone (p)ppGpp. | Correlate intracellular ppGpp levels with the frequency of persister cells under different nutrient conditions [17]. |
| Bactericidal Antibiotics (e.g., Ciprofloxacin, Amikacin) | Selective killing of non-persister cells to isolate the persister subpopulation. | Standard method for enriching and quantifying persisters from a heterogeneous bacterial culture [17] [19]. |
Signaling and Experimental Workflow Visualization
The following diagram illustrates the primary signaling pathways that connect nutrient gradients to the formation of persister cells.
Diagram 1: Signaling Pathways from Nutrient Gradients to Persister Formation.
This workflow provides a generalized schema for designing experiments to investigate metabolic heterogeneity and persister cell formation.
Diagram 2: Experimental Workflow for Persister Metabolism Studies.
Biofilms as Hotspots for Horizontal Gene Transfer and Resistance Gene Amplification
Frequently Asked Questions (FAQs)
General Mechanisms
Q1: Why are biofilms considered hotspots for Horizontal Gene Transfer (HGT)? Biofilms are structured microbial communities encased in an extracellular polymeric substance (EPS). This environment promotes HGT through several key features:
- Close Cell-to-Cell Contact: The dense, aggregated nature of biofilm cells facilitates intimate contact, which is essential for conjugation, the primary mechanism of HGT [20] [21].
- Retention of Genetic Material: The EPS matrix acts as a scaffold, trapping released DNA and membrane vesicles, making them available for uptake by other cells via transformation and transduction [20] [3].
- Stable Microenvironments: Biofilms provide stable, protected niches where bacteria have long retention times, allowing for efficient genetic exchange and integration [20] [22].
- Enhanced Plasmid Persistence: Studies show that multidrug resistance (MDR) plasmids are retained for longer periods in biofilms compared to planktonic cultures, even in the absence of antibiotic selection, making biofilms effective "refugia" for resistance genes [22].
Q2: What are the primary HGT mechanisms operating within biofilms? The three classical HGT mechanisms are all enhanced in biofilms [20]:
- Conjugation: Direct cell-to-cell transfer of genetic material, especially plasmids, via a pilus. This is the most frequent and significant mechanism in biofilms [20] [22].
- Transformation: Uptake and incorporation of free extracellular DNA (eDNA) from the environment. The biofilm matrix is rich in eDNA, providing a constant source of genetic material [20] [21].
- Transduction: Transfer of DNA between bacteria using bacteriophages (viruses that infect bacteria) as vectors [20].
Q3: How does the biofilm matrix contribute to antibiotic resistance? The EPS matrix contributes to resistance through multiple, often synergistic, mechanisms [12] [3] [13]:
- Physical Barrier: The matrix can hinder the penetration of antibiotic molecules into the deeper layers of the biofilm.
- Chemical Inactivation: Some antibiotics bind to or are broken down by matrix components like eDNA and exopolysaccharides before reaching their bacterial targets.
- Altered Microenvironment: Gradients of nutrients and oxygen within the biofilm create zones of slow or non-growing cells. These "persister" cells are highly tolerant to antibiotics that target active cellular processes [12] [3].
- Efflux Pump Activity: The expression of multidrug efflux pumps can be upregulated in specific regions of the biofilm, actively expelling antibiotics [12].
Experimental Challenges
Q4: What are common challenges when studying HGT in biofilms, and how can they be troubleshooted?
- Challenge: Low and Variable HGT Frequency. HGT events can be rare and heterogeneously distributed within a biofilm, leading to high experimental variability.
- Troubleshooting Guide:
- Ensure Mature Biofilms: Use established biofilm models (e.g., flow cells, peg lids) and confirm maturity via microscopy or quantitative assays before starting HGT experiments.
- Optimize Donor/Recipient Ratios: Test different initial ratios of donor and recipient strains to find the optimum for conjugation efficiency.
- Increase Replication: Perform a sufficient number of biological replicates (e.g., n≥6) to account for inherent variability.
- Use Robust Selection: Employ dual antibiotic selection markers and confirm the stability of the acquired genes in transconjugants.
- Troubleshooting Guide:
- Challenge: Differentiating Between HGT Mechanisms. It can be difficult to conclusively prove which mechanism (conjugation, transformation, transduction) is responsible for a gene transfer event.
- Troubleshooting Guide:
- Use Controlled Systems: For conjugation, use plasmid-free recipients and DNase treatments to rule out transformation. For transformation, use purified DNA and DNase controls.
- Genetic Controls: Utilize mutant strains deficient in key processes (e.g., pilus formation for conjugation, competence genes for transformation).
- Physical Separation: In conjugation experiments, use filters that allow medium exchange but prevent direct cell-cell contact to confirm the requirement for contact.
- Troubleshooting Guide:
Q5: Why do standard antibiotic susceptibility tests (AST) fail to predict efficacy against biofilm infections? Standard AST is performed on planktonic (free-floating) bacteria, while bacteria in a biofilm exhibit dramatically different physiology and resistance [13]. The minimum inhibitory concentration (MIC) for a biofilm can be 100 to 1000-fold greater than for its planktonic counterparts [12] [23]. This discrepancy is due to the multifactorial resistance mechanisms of the biofilm state, which are not activated in standard planktonic cultures [20] [13]. Relying on standard AST can lead to treatment failure, as the antibiotic dose is insufficient to eradicate the biofilm infection.
Troubleshooting Guides
Guide 1: Investigating Conjugative Plasmid Transfer in a Biofilm Model
Objective: To quantify the transfer rate of a multidrug resistance plasmid from a donor to a recipient strain within a biofilm.
Protocol Overview:
Strain Preparation:
- Donor Strain: Contains a conjugative plasmid with an MDR cassette (e.g., pB10) and a selective marker (e.g., tetracycline resistance).
- Recipient Strain: Plasmid-free, with a different selective marker (e.g., rifampicin resistance).
- Control: Plasmid-free donor to check for spontaneous resistance.
Biofilm Co-culture:
- Inoculate a biofilm system (e.g., flow cell, microtiter plate, CDC biofilm reactor) with a defined mixture of donor and recipient cells (e.g., 1:1 ratio).
- Allow biofilms to develop for 24-48 hours under relevant growth conditions.
Harvesting and Quantification:
- Disrupt the biofilm using sonication or vigorous vortexing to create a homogeneous cell suspension.
- Serially dilute and plate the suspension onto three types of agar plates:
- Non-selective: To determine the total viable cell count.
- Selective for Recipient: (e.g., rifampicin) to count recipient cells.
- Double-selective: (e.g., rifampicin + tetracycline) to count transconjugants (recipient cells that have acquired the plasmid).
Calculation:
- Conjugation Frequency = (Number of transconjugants) / (Total number of recipients)
Troubleshooting Table:
| Problem | Potential Cause | Solution |
|---|---|---|
| No transconjugants detected | Plasmid is non-conjugative; strains are incompatible; insufficient cell contact. | Verify plasmid mobility and host range. Optimize biofilm growth time to ensure mature microcolonies form. |
| High background growth on selective plates | Inadequate antibiotic concentration; cross-feeding of resistance. | Determine minimum inhibitory concentration (MIC) for all strains and use antibiotics at 2x MIC. Include all necessary controls. |
| Extremely low conjugation frequency | Poor biofilm formation; plasmid fitness cost is too high. | Use a validated biofilm-forming strain. Consider using a "persistent" plasmid variant evolved in biofilms [22]. |
Guide 2: Assessing Antibiotic Penetration Through a Biofilm
Objective: To evaluate the extent to which a biofilm matrix impedes the diffusion of an antibiotic.
Protocol Overview:
- Biofilm Growth: Grow a thick, uniform biofilm on a membrane filter placed on an agar plate or in a flow cell.
- Antibiotic Application: Apply the antibiotic of interest to the top of the biofilm.
- Spatial Analysis:
- Method A (Microtome Sectioning): After a set time, cryo-embed the biofilm, thinly section it with a microtome, and assay each section for viable bacteria and antibiotic concentration.
- Method B (Microelectrode): Use a antibiotic-specific microelectrode to measure the concentration gradient of the antibiotic at different depths within the biofilm in real-time.
- Analysis: Compare the antibiotic concentration at the top vs. the bottom of the biofilm. A significant gradient indicates penetration limitation.
Troubleshooting Table:
| Problem | Potential Cause | Solution |
|---|---|---|
| No penetration gradient observed | Biofilm is too thin; antibiotic diffuses too quickly. | Grow a thicker, more robust biofilm. Use a faster-acting antibiotic or shorten the exposure time before analysis. |
| High variability between replicates | Inhomogeneous biofilm structure. | Standardize biofilm growth conditions. Increase the number of biological replicates and sampling points. |
| Difficulty measuring antibiotic concentration | Lack of sensitive assay for the specific antibiotic. | Use radiolabeled antibiotics or HPLC-MS for precise quantification if microelectrodes are not available. |
Data Presentation: Quantitative Resistance in Biofilms
Table 1: Comparative Antibiotic Resistance in Planktonic vs. Biofilm Cells. This table summarizes the dramatic increase in resistance observed when bacteria transition to the biofilm state [12] [13] [23].
| Bacterial Species | Antibiotic | Planktonic MIC (µg/mL) | Biofilm MIC (µg/mL) | Fold Increase in Resistance |
|---|---|---|---|---|
| Staphylococcus epidermidis | Vancomycin | Susceptible | Resistant | >1000 [13] |
| Pseudomonas aeruginosa | Tobramycin | 1 | 1000 | 1000 [24] |
| Klebsiella pneumoniae | Ampicillin | Not specified | Not specified | Significant (penetration blocked) [24] |
| General (Multiple Species) | Various | - | - | 10 - 1000 [23] |
Table 2: Key Reagent Solutions for Biofilm HGT and Resistance Studies. This table lists essential materials and their functions for setting up relevant experiments.
| Research Reagent | Function/Brief Explanation |
|---|---|
| Flow Cell Systems | Devices for growing biofilms under continuous nutrient supply and shear force, allowing for real-time, non-destructive microscopy. Ideal for studying biofilm architecture and spatial distribution of HGT. |
| Extracellular DNA (eDNA) | A key component of the biofilm matrix. Serves as a substrate for natural transformation and can be targeted for disruption using DNase I to study its role in biofilm integrity and HGT. |
| Conjugative Plasmids (e.g., pB10) | Self-transmissible MDR plasmids used as models to study the transfer and persistence of resistance genes in biofilm communities [22]. |
| Quorum Sensing Inhibitors (QSIs) | Small molecules that disrupt bacterial cell-to-cell communication. Used to investigate the role of QS in regulating biofilm maturation and HGT frequency. |
| Dispersin B | An enzyme that degrades the polysaccharide component of the biofilm matrix. Used to chemically disrupt the biofilm and assess its role as a physical barrier to antibiotics and HGT. |
| Microtiter Plates (Peg Lids) | High-throughput platform for growing multiple biofilm samples simultaneously, used for standardized screening of biofilm formation and antimicrobial susceptibility. |
Experimental Workflow and Signaling Pathways
The following diagram illustrates the core experimental workflow for establishing and analyzing a model system to study plasmid persistence in biofilms, as referenced in the research [22].
Diagram 1: Workflow for Analyzing Plasmid Evolution in Biofilms.
This diagram outlines the key regulatory systems and their logical relationships in controlling biofilm development, a process critical to creating a permissive environment for HGT.
Diagram 2: Key Regulators of Biofilm Formation and HGT.
Breaching the Defenses: A Toolkit of Emerging Technologies for Enhanced Drug Delivery
Frequently Asked Questions (FAQs)
What are matrix-degrading enzymes and why are they important for biofilm research? Matrix-degrading enzymes are biological catalysts that target and break down the key components of the extracellular polymeric substance (EPS) in bacterial biofilms. The EPS matrix, which consists of polysaccharides, proteins, extracellular DNA (eDNA), and lipids, acts as a formidable barrier that restricts antibiotic penetration and protects embedded bacterial cells [25] [3]. By disrupting this matrix, these enzymes can disperse biofilms, exposing the bacterial cells to antimicrobial agents and the host immune system, thereby overcoming a major challenge in treating biofilm-associated infections [26] [27].
How does Dispersin B function, and against which biofilms is it most effective? Dispersin B is a glycoside hydrolase produced by Aggregatibacter actinomycetemcomitans that specifically hydrolyzes poly-β(1,6)-N-acetylglucosamine (PNAG), a common polysaccharide in biofilm matrices [28] [29]. It is highly effective against biofilms formed by a broad spectrum of pathogens, including Staphylococcus aureus, Staphylococcus epidermidis, Escherichia coli, and Yersinia pestis [28] [26]. Its mechanism involves cleaving the glycosidic bonds in PNAG, which weakens the structural integrity of the biofilm, leading to detachment and dispersal of bacterial cells [29].
What is the specific role of DNase I in biofilm disruption? DNase I degrades extracellular DNA (eDNA), a key structural component in the EPS of many bacterial biofilms [30] [27]. eDNA facilitates initial cell attachment, stabilizes the mature biofilm structure, and can bind to cationic antibiotics, neutralizing them [25] [3]. By hydrolyzing eDNA, DNase I disrupts the biofilm scaffold, which can inhibit biofilm formation and detach established biofilms. It is particularly effective against pathogens like Pseudomonas aeruginosa and Staphylococcus aureus, where eDNA is a major matrix constituent [30] [3].
What are the key advantages of using enzymatic disruption over conventional antibiotics alone? Enzymatic disruption offers several key advantages:
- Targets the Protection Barrier: Unlike conventional antibiotics that target bacterial cells, enzymes degrade the protective EPS matrix, making the now-dispersed, planktonic cells susceptible to co-administered antimicrobials [25] [26].
- Reduced Selection Pressure: Since they do not directly kill bacteria, matrix-degrading enzymes may exert less selection pressure for developing traditional antibiotic resistance [28].
- Broad-Spectrum Potential: Enzymes like Dispersin B target highly conserved EPS components (e.g., PNAG) found in many Gram-positive and Gram-negative pathogens, offering a broad-spectrum anti-biofilm strategy [28] [26].
- Biocompatibility and Specificity: They are typically biodegradable and can operate under mild physiological conditions, making them suitable for clinical applications [25].
Troubleshooting Guide for Experimental Workflows
Problem: Inconsistent or Low Biofilm Dispersal Efficacy with Enzymes
Potential Cause 1: Variation in EPS Composition. The composition of the EPS matrix can vary significantly based on bacterial species, strain, growth medium, and environmental conditions [25]. An enzyme effective against one biofilm may be less effective against another.
- Solution:
- Characterize the EPS: Perform preliminary analyses (e.g., using specific dyes or enzymatic probes) to identify the major EPS components (polysaccharides, proteins, eDNA) in your target biofilm [25] [27].
- Use Enzyme Cocktails: Combine multiple enzymes that target different EPS components. For example, use a mixture of Dispersin B (for PNAG), Proteinase K (for proteins), and DNase I (for eDNA) for a synergistic effect [25] [30] [31]. A study demonstrated that a complex enzyme formulation containing DNase, polysaccharide-hydrolyzing enzymes, and proteases is often necessary for successful removal of complex biofilms [31].
Potential Cause 2: Suboptimal Enzyme Activity or Delivery. The activity of enzymes can be influenced by pH, temperature, and the presence of inhibitors. Furthermore, the biofilm matrix itself can hinder enzyme penetration.
- Solution:
- Optimize Reaction Conditions: Confirm the optimal pH and temperature for your enzyme(s) from the supplier's documentation or literature. For instance, cellulase showed better efficacy against P. aeruginosa biofilms at pH 5 than at pH 7 [31].
- Combine with Chelators or Detergents: The use of metal chelators (e.g., EDTA) or mild detergents can enhance the efficacy of enzymes like Dispersin B by further destabilizing the matrix and improving access [28].
- Consider Enzyme Immobilization: For surface coating applications (e.g., on medical devices), immobilizing the enzyme can provide sustained anti-biofilm activity [25].
Problem: Lack of Expected Synergy Between Enzymes and Antibiotics
Potential Cause: Insufficient Contact or Dosing. Dispersed cells may re-aggregate if not promptly eliminated by antibiotics or the host immune system.
- Solution:
- Sequential Dosing: Consider a sequential treatment where the biofilm is pre-treated with the enzyme to induce dispersal, followed by the application of antibiotics to kill the newly vulnerable planktonic cells [26].
- Validate Antibiotic Sensitivity: Ensure that the dispersed planktonic cells are susceptible to the chosen antibiotic. Re-check the Minimum Inhibitory Concentration (MIC) for the target organism in its planktonic state.
- Incorporate into Advanced Formulations: Develop wound gels or nanoparticle carriers that allow for the co-delivery or sequential release of both the enzyme and the antibiotic to the infection site [27].
Problem: Enzyme Toxicity or Stability Issues in Models
Potential Cause: Cytotoxicity of Enzymes or Formulation Components. Some enzymes or impurities in enzyme preparations may show toxicity toward host cells.
- Solution:
- Source High-Purity Reagents: Use pharmaceutical or research-grade enzymes to minimize contaminants.
- Titrate Enzyme Concentration: A screen of 16 glycoside hydrolases found that while many showed some toxicity in cell culture, most were safe in a mouse model, highlighting the importance of using physiologically relevant concentrations and in vivo validation [32].
- Shorten Exposure Time: The same study noted an inverse relationship between enzyme exposure time and cellular viability, suggesting that shorter, targeted treatment durations may mitigate toxicity [32].
Quantitative Data on Enzyme Efficacy
Table 1: Key Glycoside Hydrolases and Their Anti-Biofilm Activity
| Enzyme | Source | Target EPS Component | Key Biofilm Targets | Demonstrated Efficacy |
|---|---|---|---|---|
| Dispersin B | Aggregatibacter actinomycetemcomitans | Poly-N-acetylglucosamine (PNAG) [28] [29] | S. aureus, S. epidermidis, E. coli, Y. pestis [28] [26] | Detaches preformed biofilms; sensitizes biofilms to antibiotics & antiseptics [28] |
| α-Amylase | Bacillus sp., A. oryzae [32] | Glycogen-like polysaccharides [30] | Multi-drug resistant bacteria (e.g., Streptococcus mutans) [30] | Effective dispersal in vitro; cleared infections with meropenem in a mouse wound model [32] |
| Alginate Lyase | Various algae [32] | Alginate [30] [26] | Pseudomonas aeruginosa [30] [26] | Breaks down alginate in biofilm structure; high dispersal efficacy in vitro [26] [32] |
| Cellulase | Aspergillus niger [32] | Cellulose [30] | Cellulose-producing bacteria (e.g., P. aeruginosa, Salmonella enterica) [30] | Reduced biomass and CFU of P. aeruginosa biofilms; efficacy is pH-dependent [31] |
| DNase I | Bovine pancreas, recombinant | Extracellular DNA (eDNA) [30] | P. aeruginosa, S. aureus [30] [3] | Inhibits biofilm formation & destabilizes mature biofilms by degrading eDNA scaffold [30] [27] |
Table 2: Research Reagent Solutions for EPS Disruption Studies
| Reagent | Function in Research | Example Application |
|---|---|---|
| Dispersin B (Recombinant) | Hydrolyzes PNAG polysaccharide in biofilm matrix [28] [33] | Used to study dispersal of staphylococcal biofilms; coated on catheters for anti-biofilm surface [28] [29] |
| Proteinase K | Broad-spectrum protease that digests protein components of EPS [25] [30] | Effective for disrupting biofilms of S. aureus and P. aeruginosa; targets amyloid-like proteins such as curli [25] [30] |
| DNase I | Degrades extracellular DNA (eDNA) in the biofilm matrix [30] [27] | Added to in vitro biofilm assays to prevent maturation or disperse established biofilms reliant on eDNA [30] [26] |
| Glycoside Hydrolase Cocktails | Target multiple exopolysaccharides simultaneously for enhanced disruption [26] [32] | Screening of 16 GHs identified α-amylase, alginate lyase, and xylanase as highly effective for in vitro dispersal [32] |
| Chelators (e.g., EDTA) | Binds metal ions, disrupting ionic bonds that stabilize the EPS matrix [28] [27] | Used in combination with Dispersin B to synergistically enhance biofilm detachment [28] |
Standard Experimental Protocol: Enzymatic Dispersal of Pre-Formed Biofilms
This protocol outlines a standard method for assessing the efficacy of matrix-degrading enzymes against pre-formed bacterial biofilms in a 96-well microtiter plate format.
Materials:
- Bacterial strain of interest (e.g., Staphylococcus epidermidis RP62A for PNAG-positive biofilm)
- Appropriate growth medium (e.g., Tryptic Soy Broth with 1% glucose for enhanced biofilm formation)
- Sterile 96-well flat-bottom polystyrene microtiter plates
- Purified matrix-degrading enzyme(s) (e.g., Dispersin B, DNase I, Proteinase K) and corresponding buffer control
- Phosphate Buffered Saline (PBS), pH 7.4
- Fixative (e.g., 99% methanol)
- Stain (e.g., 0.1% crystal violet)
- Acetic acid (33% v/v)
- Microplate reader
Method:
- Biofilm Formation:
- Grow the bacterial strain to mid-log phase and dilute in fresh medium to ~10^6 CFU/mL.
- Dispense 200 µL of the bacterial suspension into selected wells of the 96-well plate. Include medium-only wells as negative controls.
- Incubate statically for 24-48 hours at the optimal growth temperature (e.g., 37°C for human pathogens) to allow for biofilm formation.
Enzyme Treatment:
- Gently remove the planktonic culture and rinse the biofilms twice with 200 µL of PBS to remove non-adherent cells.
- Prepare solutions of the test enzyme(s) in an appropriate buffer at the desired working concentration (e.g., 100 µg/mL Dispersin B in PBS).
- Add 200 µL of the enzyme solution or buffer control to the respective wells.
- Incubate the plate for 1-2 hours at 37°C.
Biofilm Quantification (Crystal Violet Staining):
- After incubation, carefully remove the enzyme solutions.
- Rinse the wells gently twice with PBS to remove detached cells.
- Fix the remaining adherent biofilm with 200 µL of 99% methanol for 15 minutes.
- Remove methanol, let the plate air dry, then stain the biofilms with 200 µL of 0.1% crystal violet for 15 minutes.
- Rinse the plate thoroughly under running tap water to remove excess stain.
- Elute the bound stain from the biofilms with 200 µL of 33% acetic acid.
- Transfer 100 µL of the eluent to a new microtiter plate and measure the absorbance at 570 nm using a microplate reader.
Data Analysis:
- Calculate the percentage of biofilm dispersal by comparing the average absorbance of enzyme-treated wells to the buffer-treated control wells.
% Dispersal = [1 - (Abs_enzyme / Abs_control)] * 100
Visualizing the Workflow and Mechanism
Diagram 1: Experimental workflow for enzymatic biofilm disruption.
Diagram 2: Mechanism of enzyme-enhanced antibiotic penetration.
Core Concepts: Biofilm Resistance and Nanoparticle Solutions
This section addresses fundamental questions about the biofilm barrier and how nanoparticles function to overcome it.
FAQ 1: Why are biofilms so resistant to conventional antibiotics? Biofilms demonstrate intrinsic resistance to antimicrobials, with tolerance levels up to 1000 times higher than their free-floating (planktonic) counterparts [34] [35] [19]. This resilience stems from multiple synergistic mechanisms:
- The Extracellular Polymeric Substance (EPS) Matrix: This physical barrier, composed of polysaccharides, proteins, and extracellular DNA (eDNA), hinders antibiotic penetration through binding and sequestration [3] [19]. For instance, positively charged aminoglycosides can bind to negatively charged eDNA, preventing deeper penetration [3].
- Metabolic Heterogeneity: Microenvironments within the biofilm create gradients of nutrients and oxygen, leading to zones of metabolically dormant or slow-growing cells (persisters) that are highly tolerant to antibiotics which typically target active cellular processes [35] [3].
- Enhanced Efflux Pump Activity: Bacteria in biofilms can up-regulate efflux pumps, actively expelling antibiotics that do manage to penetrate [36].
- Quorum Sensing (QS): This cell-to-cell communication system regulates biofilm development and the expression of virulence and resistance factors [36].
FAQ 2: How do silver, zinc oxide, and graphene oxide nanoparticles overcome biofilm resistance? These nanoparticles (NPs) employ multiple, simultaneous mechanisms of action that bypass traditional resistance pathways, making it difficult for bacteria to develop resistance [34] [35] [37].
Table 1: Mechanisms of Action for Different Nanoparticles
| Nanoparticle Type | Primary Anti-Biofilm Mechanisms | Key Advantages |
|---|---|---|
| Silver (AgNPs) | Generation of Reactive Oxygen Species (ROS), disruption of bacterial membranes and enzyme function, release of Ag⁺ ions that damage DNA [35]. | Broad-spectrum activity, can potentiate the effect of conventional antibiotics [35]. |
| Zinc Oxide (ZnONPs) | ROS generation, membrane disruption, and release of Zn²⁺ ions [35]. | Excellent biocompatibility, useful in coatings and formulations. |
| Graphene Oxide (GO) | Physical piercing of bacterial membranes, oxidative stress, and lipid peroxidation [37]. | Extremely high surface area for functionalization, unique mechanical strength [37]. |
The following diagram illustrates the multi-faceted attack strategies nanoparticles use to combat biofilms.
Experimental Protocols & Workflows
This section provides detailed methodologies for key experiments in developing and evaluating nanoparticle-based anti-biofilm strategies.
Protocol: Assessing Biofilm Penetration via Confocal Microscopy
Objective: To visualize and confirm the penetration of fluorescently-labeled nanoparticles into a mature biofilm.
Materials:
- Mature biofilm (e.g., P. aeruginosa or S. aureus grown in a flow cell or on a coverslip)
- Fluorescently-labeled nanoparticles (e.g., AgNPs tagged with FITC)
- Confocal laser scanning microscope (CLSM)
- Phosphate Buffered Saline (PBS)
- Mounting medium
Methodology:
- Biofilm Growth: Grow a mature biofilm (typically 48-72 hours) on a sterile, glass-bottom dish or coverslip using an appropriate growth medium under static or flow conditions.
- NP Incubation: Gently wash the mature biofilm with PBS to remove non-adherent cells. Incubate the biofilm with a sub-inhibitory concentration of the fluorescently-labeled nanoparticles in fresh medium or PBS for a predetermined time (e.g., 1-4 hours) at 37°C.
- Washing and Fixation: Carefully wash the biofilm three times with PBS to remove any unbound nanoparticles. Fix the biofilm using a suitable fixative (e.g., 4% paraformaldehyde for 30 minutes) if time-course analysis is required.
- Imaging: Mount the sample and visualize using a CLSM. Acquire Z-stack images from the top to the bottom of the biofilm.
- Analysis: Use image analysis software (e.g., ImageJ) to create 3D reconstructions and cross-sectional views of the Z-stacks. The presence of fluorescence signal throughout the depth of the biofilm, particularly in the basal layers, confirms successful penetration.
Protocol: Evaluating Synergistic Effects with Antibiotics
Objective: To determine if nanoparticles can restore the efficacy of a conventional antibiotic against a biofilm.
Materials:
- Standard antibiotic (e.g., Tobramycin, Ciprofloxacin)
- Nanoparticle suspension
- 96-well microtiter plates with pre-formed biofilms
- Crystal Violet stain or metabolic dye (e.g., Resazurin)
- Plate reader
Methodology:
- Biofilm Formation: Grow biofilms in a 96-well plate for 24-48 hours. Remove planktonic cells by gently inverting the plate and washing each well with PBS.
- Treatment: Treat the biofilms with:
- Antibiotic alone (at various sub-inhibitory concentrations)
- Nanoparticles alone (at a sub-inhibitory concentration)
- Combination of antibiotic and nanoparticles
- Untreated control (medium only)
- Incubation: Incubate the plate for a further 18-24 hours.
- Viability Assessment:
- Crystal Violet (Biomass): Stain the biofilm with 0.1% crystal violet, solubilize in ethanol-acetate, and measure absorbance at 595 nm.
- Resazurin (Metabolism): Add resazurin solution to wells, incubate for 1-2 hours, and measure fluorescence (Ex560/Em590). Metabolic activity correlates with live cells.
- Data Analysis: Calculate the percentage of biofilm reduction for each treatment compared to the untreated control. Synergy is confirmed when the combination treatment results in a significantly greater reduction in biofilm biomass or viability than the sum of the individual effects.
Troubleshooting Common Experimental Challenges
Issue 1: High Batch-to-Batch Variability in Nanoparticle Synthesis
- Problem: Inconsistent experimental results due to differences in NP size, shape, or surface chemistry between synthesis batches.
- Solution:
- Standardize Protocol: Meticulously control all synthesis parameters (temperature, reactant concentration, mixing speed, time).
- Rigorous Characterization: Perform comprehensive physicochemical characterization (see Table 2) on every new batch before biological testing. Do not rely on manufacturer specifications alone [38].
- Purification: Implement strict and consistent purification steps (e.g., dialysis, centrifugation) to remove unreacted precursors and synthesis by-products.
Issue 2: Nanoparticle Aggregation in Biological Media
- Problem: Nanoparticles aggregate when added to cell culture medium or physiological buffers, altering their effective size and bioavailability.
- Solution:
- Surface Functionalization: Coat nanoparticles with stabilizing agents like polyethylene glycol (PEG) or surfactants (e.g., PVA, PVP) to improve colloidal stability.
- Sonication: Briefly sonicate the nanoparticle suspension immediately before adding it to the biological medium.
- Characterize in Relevant Media: Always measure the hydrodynamic diameter and zeta potential of nanoparticles in the specific medium used for experiments, not just in water [38]. Dynamic Light Scattering (DLS) is suitable for this.
Issue 3: Endotoxin Contamination in Nanoparticle Preparations
- Problem: Inflammatory or cytotoxic effects are observed, which are actually caused by endotoxin (LPS) contamination rather than the nanoparticles themselves, leading to misleading conclusions about biocompatibility [38].
- Solution:
- Aseptic Technique: Perform all synthesis and purification steps under sterile conditions (e.g., in a biosafety cabinet, using depyrogenated glassware).
- Test Reagents: Screen all commercial starting materials and water for endotoxin.
- Use LAL Assay with Controls: Quantify endotoxin using the Limulus Amoebocyte Lysate (LAL) assay. Always perform Inhibition and Enhancement Controls (IEC) to rule out nanoparticle interference with the assay [38]. If interference occurs, switch to a different LAL format (e.g., from chromogenic to turbidimetric) or use a recombinant Factor C assay.
Table 2: Essential Techniques for Nanoparticle Characterization
| Technique | Parameter Measured | Utility in Biofilm Research | Key Considerations |
|---|---|---|---|
| Dynamic Light Scattering (DLS) | Hydrodynamic diameter, size distribution | Predicts diffusion and penetration capability into biofilm matrix. | Can be misled by aggregates; measure in biological media [39]. |
| Cryo-TEM | Size, morphology, internal structure | "Gold standard" for direct visualization of individual particles and structure. | Confirms DLS data; reveals non-spherical shapes and true size distribution [39]. |
| Zeta Potential | Surface charge | Predicts colloidal stability and interaction with negatively charged biofilm matrix. | High negative or positive zeta potential (>±30 mV) indicates good stability. |
| LAL Assay | Endotoxin contamination | Ensures biological responses are due to NPs, not contaminants. | Must include controls for interference [38]. |
The Scientist's Toolkit: Research Reagent Solutions
Table 3: Essential Materials for Anti-Biofilm Nanoparticle Research
| Reagent / Material | Function | Example in Anti-Biofilm Research |
|---|---|---|
| Silver Nitrate (AgNO₃) | Precursor for synthesizing Silver Nanoparticles (AgNPs) | Reduced to form AgNPs; concentration and reducing agent determine final size and shape. |
| Polyethylene Glycol (PEG) | Surface functionalization agent (PEGylation) | Coats nanoparticles to improve stability, reduce aggregation, and prolong circulation time. |
| FITC Isomer | Fluorescent labeling dye | Covalently linked to NPs to enable tracking and penetration studies via confocal microscopy. |
| Limulus Amoebocyte Lysate (LAL) | Detects and quantifies endotoxin | Critical quality control test to ensure nanoparticle preparations are free from pyrogenic contamination [38]. |
| Crystal Violet | Histological stain for biomass | Stains the polysaccharides and cells in a biofilm to quantify total biomass after treatment. |
| Resazurin Sodium Salt | Metabolic indicator (cell viability) | Used in alamarBlue assays; reduction by metabolically active cells produces a fluorescent signal, quantifying biofilm viability post-treatment. |
The following workflow diagram integrates these reagents and protocols into a logical research pathway for developing an anti-biofilm nanoparticle formulation.
FAQs: Understanding the Core Technologies
1. How do physical disruption methods enhance antibiotic efficacy against biofilms? Physical disruption methods, such as ultrasound and electrochemical treatments, compromise the structural integrity of the extracellular polymeric substance (EPS) that constitutes the biofilm matrix [40] [41]. This matrix acts as a primary barrier, severely limiting antibiotic penetration [12]. By breaking down this physical shield, these methods facilitate improved antibiotic diffusion to reach the embedded microbial cells, thereby overcoming a key mechanism of biofilm-mediated treatment failure [42] [19].
2. What are the primary mechanisms behind ultrasound-induced biofilm disruption? The primary mechanism is acoustic cavitation [40]. When ultrasound waves propagate through a liquid medium, they generate oscillating pressure fields. This leads to the formation, growth, and violent implosion of microscopic gas bubbles. The collapse of these bubbles produces localized yet intense shock waves and high-velocity microjets of liquid that mechanically shear and disrupt the EPS matrix and bacterial cell walls, leading to biofilm detachment and disintegration [40].
3. Can electrochemical methods prevent biofilm formation, or are they only for removal? Electrochemical strategies can serve a dual purpose. They can be used proactively to prevent biofilm formation by modifying surface properties (e.g., through antimicrobial coatings or electric fields that repel initial bacterial adhesion) [43] [44]. Reactively, they can be applied for biofilm removal by generating biocidal agents (e.g., hydrogen peroxide, reactive oxygen species) at the electrode surface or by facilitating the detachment of established biofilms through applied potentials [43] [44].
4. What are the critical parameters to optimize for effective ultrasonic biofilm disruption? Effective ultrasonic disruption depends on several interplaying parameters. Key among them are the frequency, power intensity, treatment duration, and the pulse mode (continuous vs. pulsed) [40]. Lower frequencies (e.g., 20-40 kHz) often promote more violent cavitation beneficial for disruption, while higher frequencies may be suited for different applications. It is critical to optimize these parameters for the specific biofilm and equipment, as over-intensification can lead to unwanted tissue damage or biofilm fragmentation without full eradication [40].
5. How do I choose between ultrasound and electrochemical methods for my specific biofilm model? The choice hinges on your experimental setup and biofilm characteristics. Ultrasound is highly effective for disrupting biofilms on surfaces and in suspension and can be integrated with drug delivery platforms [40] [42]. Electrochemical methods are particularly suited for biofilms forming on conductive surfaces or within systems where in-situ, real-time monitoring and control are desired [43] [44]. Consider the location of your biofilm, the nature of the substrate, and whether your goal is prevention, removal, or real-time monitoring.
Troubleshooting Guides
Common Ultrasound Experiment Challenges
| Problem | Potential Cause | Solution |
|---|---|---|
| Low Biofilm Disruption Efficacy | Sub-optimal acoustic parameters (frequency, power, duty cycle) [40]. | Systematically test a parameter matrix. Use a hydrophone to calibrate and map the acoustic field. Ensure the transducer is correctly coupled to the sample. |
| Biofilm maturity and density [40]. | Note that mature, dense biofilms are more resilient. Apply treatment at earlier formation stages or combine with enzymatic/chemical pre-treatment. | |
| Excessive Cell Lysis & Debris | Acoustic power or intensity too high [40]. | Reduce the power intensity or switch to a pulsed operation mode to allow for heat dissipation and reduce shear forces. |
| Inconsistent Results Between Runs | Poor positioning or coupling of the ultrasonic transducer. | Standardize the experimental geometry (distance, angle). Use coupling gel for non-immersion setups and ensure consistent sample volume. |
| No Apparent Effect | Transducer failure or inadequate power delivery. | Verify transducer functionality and amplifier settings. Check for air bubbles in the path that could scatter or reflect ultrasonic energy. |
Common Electrochemical Experiment Challenges
| Problem | Potential Cause | Solution |
|---|---|---|
| Poor Biofilm Removal/Inhibition | Incorrect applied potential or current density [44]. | Perform a voltammetric study to identify the relevant potential windows for biofilm detachment or bactericidal agent generation. |
| Electrode fouling or passivation. | Pre-treat electrodes (e.g., polishing, cleaning) and consider using electrode materials resistant to fouling, such as platinum or boron-doped diamond. | |
| High Background Noise in Monitoring | Non-specific binding or interfering species in the medium [43]. | Implement a control experiment with a blank (no biofilm) electrode. Use modified electrodes with selective membranes or coatings to improve specificity. |
| Irreproducible Biofilm Growth on Electrodes | Inconsistent surface properties or cleaning procedures [44]. | Establish a strict and validated electrode cleaning and sterilization protocol before each experiment. Characterize surface roughness and hydrophobicity. |
| Corrosion of Working Electrode | Applied potential exceeds the stability window of the electrode material in the electrolyte. | Choose an electrode material that is inert within the required potential range for your experiment (e.g., gold, glassy carbon). |
Table 1: Efficacy of Ultrasound-Responsive Nanodroplets (NDs) with Focused Ultrasound (FUS) Against Clinical Biofilm Isolates [42]
| Antimicrobial Loaded in NDs | Pathogen | Assay | Fold-Reduction in Required Concentration vs. Free Drug |
|---|---|---|---|
| Azithromycin (AZ-ND/FUS) | E. coli | Metabolic MIC | 13.45-fold |
| E. coli | MBC | 19.18-fold | |
| Besifloxacin (BF-ND/FUS) | E. coli | Metabolic MIC | 66.05-fold |
| E. coli | MBC | 15.72-fold | |
| Polymyxin B (PMB-ND/FUS) | S. aureus | MBC | 6.41-fold |
| Ruthenium Complex (Ru-ND/FUS) | S. aureus | Persister Eradication | 25.5-fold (avg.) |
Table 2: Impact of Electrochemical and Metal Ion Approaches on Biofilm Formation [44]
| Agent/Approach | Effect on Biofilm | Experimental Context & Key Parameter |
|---|---|---|
| Mg²⁺ ions | Increased attachment of P. fluorescens | Demonstrates the critical influence of electrolyte composition on bacterial adhesion. |
| Cu²⁺/Zn²⁺ ions | Inhibitory effect on growth of S. pyogenes and E. coli biofilms. | Effect was observed on growing, but not mature, biofilms. |
| Electrochemically deposited Ag | Effective inhibition of microbial proliferation. | Applied on stainless steel surfaces in potable water systems. |
Detailed Experimental Protocols
Protocol 1: Ultrasonic Disruption of Biofilms using Responsive Nanodroplets
This protocol outlines a method for synergistically disrupting biofilms and enhancing antimicrobial delivery using ultrasound-responsive nanodroplets, based on a 2025 study [42].
Research Reagent Solutions:
- Phospholipid-coated Nanodroplets: Synthesized from modified clinical contrast agents (e.g., Definity RT) for stability and ultrasound responsiveness [42].
- Antimicrobial Agents: Azithromycin, besifloxacin, polymyxin B, or ruthenium complexes for loading into nanodroplets [42].
- Therapeutic Focused Ultrasound (FUS) System: Capable of delivering specific frequencies and pressures.
Methodology:
- Nanodroplet Synthesis and Characterization: Prepare phospholipid-coated perfluorocarbon nanodroplets via sonication and extrusion. Load antimicrobials into the lipid shell or core at a concentration that maintains structural integrity (e.g., ≤40 mol%) [42]. Characterize the size (targeting 125-250 nm), polydispersity index, and concentration using dynamic light scattering and electro-impedance sensing.
- Biofilm Cultivation: Grow standardized biofilms of target pathogens (e.g., clinical isolates of MRSA or ESBL E. coli) on appropriate substrates for 24-48 hours to ensure maturity.
- Ultrasound Treatment Setup:
- Place the biofilm model in a custom-designed chamber compatible with the FUS transducer.
- Add the antimicrobial-loaded nanodroplets to the medium surrounding the biofilm.
- Position the FUS transducer for targeted application.
- Application of Focused Ultrasound: Apply ultrasound using a dual-pulse sequence [42]:
- Vaporization Pulse: A high peak negative pressure pulse to trigger the phase transition of nanodroplets into microbubbles.
- Delivery Pulse: A lower pressure pulse to drive the oscillating bubbles, disrupting the EPS and enhancing convective transport of the released antimicrobial.
- Post-Treatment Analysis:
- Assess biofilm viability using colony-forming unit counts, metabolic assays, or confocal microscopy with live/dead staining.
- Quantify the minimum biofilm eradication concentration and compare it to treatment with free, unencapsulated drugs.
Protocol 2: Electrochemical Monitoring of Biofilm Formation
This protocol describes the use of electrochemical impedance spectroscopy for the real-time, label-free monitoring of biofilm growth on electrode surfaces [43].
Research Reagent Solutions:
- Working Electrode: Gold, glassy carbon, or screen-printed carbon electrodes, thoroughly cleaned and characterized.
- Electrolyte: A suitable growth medium that supports biofilm formation and is compatible with electrochemical measurements.
- Potentiostat: An instrument capable of performing EIS and other electrochemical techniques.
Methodology:
- Electrode Preparation and Baseline Measurement: Clean the working electrode surface following a strict protocol. Place the electrode in the growth medium within an electrochemical cell. Perform an EIS scan over a wide frequency range to establish a baseline impedance spectrum.
- Inoculation and Continuous Monitoring: Inoculate the electrochemical cell with the planktonic culture of the target microorganism. To monitor biofilm formation in real-time, a low-amplitude AC voltage is continuously applied at a single, selected frequency, and the resulting impedance is tracked over time.
- Data Interpretation: As bacterial cells adhere and form a biofilm on the electrode surface, they act as an insulating layer, increasing the charge-transfer resistance. This change is detected as an increase in the measured impedance. The impedance trend can be correlated with the different stages of biofilm development: initial attachment, microcolony formation, and maturation.
- Validation: At the end of the experiment, validate the electrochemical data with standard methods like CFU counting or microscopy of the electrode surface.
Signaling Pathways and Workflow Visualizations
Diagram 1: Ultrasound-Nanodroplet Experimental Workflow
Diagram 2: Electrochemical Biofilm Control and Monitoring Strategies
Frequently Asked Questions (FAQs)
Q1: What is the core principle behind using biological interference to combat biofilms? Biological interference avoids direct bactericidal pressure, which can drive resistance. Instead, it targets the biofilm's organization and communication. Quorum Sensing Inhibitors (QSIs) disrupt the cell-to-cell communication (quorum sensing) that bacteria use to coordinate biofilm formation and virulence [45] [46]. Phage Therapy uses bacteriophages (viruses that infect bacteria) and their enzymes to physically degrade the biofilm matrix and lyse embedded bacterial cells [47] [48]. Both strategies aim to disassemble the biofilm's protective structure, thereby sensitizing the bacteria to conventional antibiotics.
Q2: Why are biofilms naturally resistant to antibiotics, and how does biological interference overcome this? The biofilm matrix, composed of extracellular polymeric substances (EPS), acts as a physical and chemical barrier that restricts antibiotic penetration [3]. Furthermore, biofilms contain metabolically dormant persister cells that are highly tolerant to antibiotics [49]. Biological interference overcomes this by:
- QSIs: Suppressing the production of the EPS matrix itself, making the biofilm more porous and permeable [45] [50].
- Phage Therapy: Utilizing phage-derived depolymerases to enzymatically break down key components of the EPS (e.g., polysaccharides, eDNA), physically disrupting the biofilm architecture [47].
Q3: Can QSIs and phage therapy be used together? Yes, and this combination is a key area of advanced research. The approaches can be highly synergistic. Phages can first break open the biofilm structure, allowing QSIs to penetrate more effectively and interrupt cell signaling. This dual disruption can then make the now-dispersed bacterial cells vastly more susceptible to low doses of traditional antibiotics [49].
Q4: What are the common sources of natural Quorum Sensing Inhibitors? Natural QSIs are primarily derived from:
- Plants: Phytochemicals like curcumin (from turmeric), cinnamaldehyde (from cinnamon), and quercetin [45] [49] [50].
- Microbes: Secondary metabolites produced by bacteria and fungi [50].
- Marine Organisms: Various bioactive compounds discovered in marine ecosystems [50].
Q5: What is a major safety consideration when selecting phages for therapy? It is critical to use obligately lytic phages and to screen them thoroughly via genome sequencing. Temperate phages can integrate their DNA into the host bacterium's genome, potentially transferring antibiotic resistance or virulence genes through horizontal gene transfer, which would worsen the infection [48].
Troubleshooting Guides
Guide 1: Poor Efficacy of Quorum Sensing Inhibitors (QSIs)
| Symptom | Possible Cause | Solution |
|---|---|---|
| Low reduction in biofilm biomass in assays. | QSI is unstable or has poor bioavailability. | Encapsulate the QSI in nanoparticle-based delivery systems (e.g., liposomes, polymer nanoparticles) to enhance its stability and penetration into the biofilm [51] [50]. |
| Virulence factor production is not sufficiently inhibited. | The QSI concentration is below the effective threshold. | Conduct a dose-response curve to determine the Minimum Inhibitory Concentration (MIC) and sub-MIC for virulence suppression. Use a fluorescent reporter strain (e.g., GFP under control of a QS promoter) to visually confirm QS inhibition [46]. |
| QSI works in vitro but not in a more complex model. | The QSI is being degraded by host enzymes or has poor tissue distribution. | Consider chemical modification of the QSI to improve its pharmacokinetic properties or use a combination therapy with a sub-inhibitory concentration of a relevant antibiotic [46] [50]. |
Guide 2: Phage Therapy Failure Against Mature Biofilms
| Symptom | Possible Cause | Solution |
|---|---|---|
| Phages fail to reduce biofilm viability. | Narrow host range; phage does not infect the specific strain. | Use a phage cocktail consisting of multiple phages with complementary host ranges instead of a single phage to cover a wider spectrum of bacterial strains and prevent rapid resistance [47] [48]. |
| Initial efficacy is lost, and biofilm regrows. | Emergence of phage-resistant bacterial mutants. | Apply phages in combination with antibiotics. The phages can break the biofilm, and antibiotics can clear the dispersed, phage-resistant cells, creating a synergistic effect known as Phage-Antibiotic Synergy (PAS) [47] [49]. |
| Inefficient penetration and diffusion of phages. | Dense biofilm matrix physically traps phage particles. | Utilize phages that express depolymerase enzymes which degrade the polysaccharide components of the biofilm matrix, creating channels for deeper phage penetration [47]. |
Guide 3: Issues with Quantifying Biofilm Disruption
| Symptom | Possible Cause | Solution |
|---|---|---|
| High variability in biomass staining (e.g., Crystal Violet). | Inconsistent biofilm growth or washing steps. | Standardize incubation times, nutrient media, and washing protocols. Use an automated plate washer for consistency. Include positive and negative controls on every plate. |
| Discrepancy between biomass reduction and viable cell counts. | Treatment is disrupting the matrix but not killing bacteria, leading to dispersal. | Always couple biomass assays (e.g., Crystal Violet) with viability assays (e.g., colony forming units (CFU) counts or metabolic assays like resazurin) to distinguish between biofilm disruption and bactericidal activity [52]. |
| Difficulty visualizing 3D biofilm architecture. | Limited resolution of standard microscopy. | Use Confocal Laser Scanning Microscopy (CLSM) with fluorescent stains (e.g., LIVE/DEAD BacLight, SYTO dyes) to generate high-resolution 3D images and quantify biovolume and spatial organization of live/dead cells within the biofilm [53] [3]. |
Experimental Protocols
Protocol 1: Assessing QSI Efficacy using a GFP Reporter Strain and Crystal Violet Assay
Principle: This protocol combines the quantification of QS signal inhibition (via GFP fluorescence) with the direct measurement of biofilm biomass.
Workflow Diagram: Quorum Sensing Inhibition Assay
Materials:
- Bacterial strain with GFP gene under control of a QS-dependent promoter (e.g., P. aeruginosa with lasI-gfp fusion).
- Test QSI compound (e.g., purified curcumin or cinnamaldehyde).
- Sterile 96-well flat-bottom microtiter plates.
- Positive control: Growth medium with DMSO (QSI solvent).
- Negative control: Sterile growth medium.
- Microplate reader capable of measuring fluorescence (485/520 nm) and absorbance (590 nm).
Procedure:
- Inoculation: Grow the reporter strain overnight. Dilute the culture to an OD600 of ~0.1 in fresh medium containing a sub-inhibitory concentration of the QSI.
- Biofilm Formation: Aliquot 200 µL of the inoculated medium into wells of a 96-well plate. Include positive and negative controls. Incubate statically for 24-48 hours at the appropriate temperature.
- QS Inhibition Measurement: Carefully transfer 100 µL of the supernatant from each well to a new plate. Measure the GFP fluorescence using a microplate reader. A significant reduction in fluorescence compared to the positive control indicates successful QS inhibition.
- Biofilm Biomass Measurement:
- Discard the remaining planktonic culture from the original plate.
- Wash the plate gently twice with phosphate-buffered saline (PBS) to remove non-adherent cells.
- Stain the adherent biofilms by adding 200 µL of a 0.1% (w/v) Crystal Violet solution to each well. Incubate for 15-20 minutes at room temperature.
- Wash the plate thoroughly 3-4 times with PBS until the rinsate is clear. Allow the plate to air dry.
- Elute the bound dye by adding 200 µL of 33% glacial acetic acid (or 95% ethanol) to each well. Incubate with shaking for 10-15 minutes.
- Quantify by transferring 125 µL of the eluent to a new plate and measuring the absorbance at 590 nm.
Protocol 2: Evaluating Phage-Antibiotic Synergy (PAS) Against Biofilms
Principle: This protocol tests whether a pre-treatment with bacteriophages can sensitize a mature biofilm to a subsequently applied antibiotic.
Workflow Diagram: Phage-Antibiotic Synergy Assay
Materials:
- Mature 24-hour biofilm of target pathogen.
- Purified lytic phage stock (high titer, e.g., 10^8 PFU/mL).
- Antibiotic of interest.
- Sterile PBS, growth medium.
- Equipment for sonication (e.g., water bath sonicator).
Procedure:
- Biofilm Formation: Grow a standardized biofilm in a 24-well or 96-well plate for 24 hours. Gently wash with PBS to remove planktonic cells.
- Phage Treatment: Add the phage suspension in a suitable buffer to the mature biofilm. For a MOI (Multiplicity of Infection) of 0.1 or 1, use a phage titer of 10^7 PFU/mL. Incubate for 4-6 hours.
- Wash: Remove the phage suspension and wash the biofilm gently with PBS to remove any unattached phages and lysed cellular debris.
- Antibiotic Challenge: Add fresh growth medium containing a sub-inhibitory concentration (e.g., 1/4 or 1/2 MIC) of the antibiotic to the phage-pre-treated biofilm and control wells (biofilm with antibiotic only, phage only, and no treatment).
- Incubation: Incubate the plate for an additional 18-24 hours.
- Viable Count:
- Remove the supernatant.
- Add 1 mL of PBS to each well and sonicate in a water bath sonicator for 5-10 minutes to disrupt the biofilm and dislodge cells.
- Perform serial dilutions of the disrupted biofilm suspension in PBS.
- Plate appropriate dilutions onto agar plates.
- Incubate and count Colony Forming Units (CFU).
- Analysis: Compare the log10 CFU reduction between the "phage + antibiotic" group and the "antibiotic only" or "phage only" groups. A reduction of >2 log10 in the combination group indicates significant synergy [47] [49].
Table 1: Efficacy of Selected Natural Quorum Sensing Inhibitors
| QSI Compound | Source | Target Bacteria | Key Effect on Biofilm | Experimental Model | Reference |
|---|---|---|---|---|---|
| Curcumin | Curcuma longa (Turmeric) | Vibrio parahaemolyticus | Inhibits biofilm formation, motility, and virulence factor production. | In vitro | [45] |
| Cinnamaldehyde | Cinnamon | Multidrug-resistant bacteria | Penetrates biofilm structures and compromises bacterial membrane integrity. | In vitro | [49] |
| Dispersin B (Enzyme) | Aggregatibacter actinomycetemcomitans | Staphylococcus spp. | Degrades polysaccharide component (PIA) of the biofilm matrix. | In vitro / Catheter model | [49] |
| 10-undecenoic acid | Synthetic / Natural Derivative | Bacillus subtilis, Pseudomonas aeruginosa | Inhibits AI-2 (LuxS) and AHL (LasI/LasR) based QS systems. | In vitro | [45] |
Table 2: Phage Therapy Efficacy Against Staphylococcal Biofilms
| Phage/Enzyme Type | Target Bacteria | Key Outcome | Synergy with Antibiotics | Reference |
|---|---|---|---|---|
| Endolysin LysSte134_1 | Staphylococcus aureus | Reduced CFU by 50-fold; activity enhanced by Zn²⁺ ions. | Not specified | [47] |
| Endolysins (HY-133, LysK, LysH5) | Staphylococcus aureus | Effective against surface-attached cells and cells embedded in biofilms. | Not specified | [47] |
| Phage-Antibiotic Combination | Staphylococcus aureus | Phages disrupt biofilm structure, sensitizing bacteria to antibiotics. | Yes, with traditional antibiotics | [47] [49] |
| Phage Cocktails | Staphylococcus aureus | Broader host range, limits the emergence of phage-resistant mutants. | Often used in synergistic approaches | [48] |
Research Reagent Solutions
Table 3: Essential Reagents for Biofilm Sensitization Research
| Reagent / Material | Function & Application | Key Considerations |
|---|---|---|
| Synthetic AHLs / AIPs | Pure, defined QS signal molecules used as positive controls in QS inhibition assays or to induce biofilm formation. | Ensure chemical purity and store as per manufacturer's instructions (often at -20°C). |
| Lytic Phage Cocktails | A mixture of multiple, genomically sequenced bacteriophages used to target specific bacterial pathogens and prevent resistance. | Must be purified and confirmed free of bacterial endotoxins and lysogenic genes. Titer must be determined prior to use. |
| Fluorescent Reporter Strains | Bacteria engineered with a QS-promoter fused to a fluorescent protein (e.g., GFP) for real-time, non-destructive monitoring of QS activity. | Monitor for genetic instability and loss of fluorescence. Use appropriate antibiotic selection to maintain the plasmid. |
| Depolymerase Enzymes | Recombinant enzymes (e.g., Dispersin B, DNase I) used to selectively degrade polysaccharides or eDNA in the biofilm matrix. | Determine the specific matrix component it targets. Optimize concentration and incubation time for maximum disruption. |
| Nanocarriers (e.g., Liposomes, Polymer NPs) | Delivery vehicles used to encapsulate QSIs or phages to improve their stability, bioavailability, and penetration into the deep layers of the biofilm. | Optimize for encapsulation efficiency and controlled release. Assess biocompatibility and lack of off-target effects. |
Frequently Asked Questions (FAQs)
Q1: What makes computational approaches necessary for anti-biofilm drug discovery? Traditional antibiotics are largely ineffective against biofilms, which can be up to 1000 times more resistant than their planktonic counterparts [11] [54]. Computational methods help overcome this by enabling the rapid screening of vast chemical libraries against specific biofilm targets, significantly accelerating the identification of promising candidates and reducing the costs associated with experimental screening alone [55] [54] [56].
Q2: What are the primary molecular targets for computational anti-biofilm strategies? Key targets include:
- Quorum Sensing (QS) Systems: Cell-cell communication systems that regulate biofilm development and virulence, such as the LasR system in Pseudomonas aeruginosa [55] [57].
- The Extracellular Polymeric Substance (EPS): The matrix that provides structural integrity and hinders antibiotic penetration [11] [58] [57].
- Intracellular Signaling Molecules: Secondary messengers like c-di-GMP, which positively regulates biofilm formation [11] [54].
Q3: My ML model has high accuracy on training data but performs poorly on new chemical data. What could be wrong? This is a classic sign of overfitting. Solutions include:
- Feature Selection: Employ techniques like Support Vector Regressor (SVR), Decision Tree (DT), or Perceptron-based selection to identify and use the most relevant molecular descriptors, reducing noise [56].
- Data Curation: Ensure your training dataset is sufficiently large and diverse. Utilize publicly available resources like the "aBiofilm" database for experimentally validated data [56].
- Algorithm Choice: Consider using Random Forest, which is often robust to overfitting, and ensure you are using rigorous cross-validation during training [55] [56].
Q4: How can I validate the binding predicted by my molecular docking results? In silico docking predictions should be considered hypothetical until confirmed.
- Molecular Dynamics (MD) Simulations: Run simulations (e.g., 100 ns or longer) to assess the stability of the ligand-protein complex over time. Stable root-mean-square deviation (RMSD) values and persistent hydrogen bonding or π-π stacking with key active site residues are good indicators of a valid prediction [55].
- MMPBSA Analysis: Use Molecular Mechanics Poisson-Boltzmann Surface Area calculations to estimate the free energy of binding, providing a quantitative measure of interaction strength [55].
Q5: What are the advantages of using peptides as anti-biofilm agents? Antimicrobial Peptides (AMPs) are attractive because they can target bacterial membranes via electrostatic interactions with negatively charged lipids and disrupt intracellular processes [59] [60]. Their multifaceted mechanism, which can include inhibition of adhesion, quorum sensing, and the stringent response, makes it difficult for bacteria to develop resistance [59] [61].
Troubleshooting Guides
Issue 1: Low Predictive Performance of Machine Learning Models
Problem: Your classifier or regression model for predicting anti-biofilm activity shows low accuracy or correlation coefficients.
| Possible Cause | Solution | Relevant Example |
|---|---|---|
| Inadequate Feature Set | Move beyond basic physicochemical properties. Incorporate features like dipeptide composition (DPC), amino acid composition (AAC), and sequence-order information for peptides [59] [61]. | A model predicting biofilm-inhibiting peptides achieved 97.19% accuracy by using a hybrid feature set including AAC, DPC, and sequence motifs [61]. |
| Imbalanced Dataset | If your "inactive" compounds vastly outnumber "active" ones, use a "Realistic Dataset" approach (e.g., 10:1 negative-to-positive ratio) during training to mimic real-world screening conditions [61]. | For a peptide predictor, a realistic dataset with 10x negative instances was used to build a robust model [61]. |
| Suboptimal Algorithm | Test multiple machine learning algorithms. Support Vector Machine (SVM) and Random Forest (RF) often deliver high performance for this task [55] [56] [59]. | A study screening LasR inhibitors found Random Forest outperformed other models with 98% accuracy [55]. Another server, "anti-Biofilm," uses SVM, RF, and MLP for regression-based IC50 prediction [56]. |
Issue 2: Unreliable Results from Virtual Screening
Problem: The top hits from your virtual screening campaign show no activity in subsequent experimental validation.
| Possible Cause | Solution | Relevant Example |
|---|---|---|
| Improper Drug-likeness Filtering | Apply filters like Lipinski's Rule of Five early in the screening pipeline to prioritize compounds with higher probability of becoming drugs [55]. | In a screen of 9000 phytochemicals, applying Lipinski's Rule of Five reduced 367 active candidates down to 155 potential drug-like candidates [55]. |
| Lack of Physiological Relevance in Docking | Ensure your docking protocol includes critical co-factors and uses a flexible binding site if possible. Always follow docking with Molecular Dynamics (MD) simulations. | The top LasR inhibitors from docking maintained stable interactions with key residues (e.g., via hydrogen bonds and π-π stacking) throughout MD simulations, confirming the docking predictions [55]. |
| Over-reliance on a Single Scoring Function | Use multiple scoring functions or a consensus approach to rank compounds, or employ machine learning-based scoring functions that can improve virtual screening performance [55]. | A study on SARS-CoV-2 demonstrated that a target-specific machine learning scoring function improved structure-based virtual screening performance [55]. |
Experimental Protocols & Workflows
Protocol 1: Machine Learning-Driven Screening for Novel Anti-biofilm Compounds
This protocol outlines the workflow for building a QSAR model to predict the half-maximal inhibitory concentration (pIC50) of chemicals against biofilms.
1. Data Collection and Curation
- Source: Extract experimentally validated anti-biofilm data from public resources like the "aBiofilm" database [56].
- Focus: Collect chemicals with reported IC50 or EC50 values.
- Preprocessing: Convert IC50 values to pIC50 (-log10(IC50)) for normalization. Remove duplicates and compounds with ambiguous data.
2. Molecular Featurization
- Calculate a set of molecular descriptors or fingerprints that numerically represent the chemical structures.
- Feature Selection: Apply feature selection algorithms (e.g., SVR, Decision Tree, Perceptron) to identify the most relevant descriptors and reduce dimensionality [56].
3. Model Training and Validation
- Algorithm Selection: Train models using multiple machine learning techniques, such as Support Vector Machine (SVM), Random Forest (RF), and Multilayer Perceptron (MLP) [56].
- Validation: Use k-fold cross-validation (e.g., 10-fold) on the training set. Hold back a separate, independent validation set for final performance testing.
- Performance Metrics: Use Pearson’s correlation coefficient (PCC) and Root Mean Square Error (RMSE) for regression models [56].
4. Web Server Implementation
- Deploy the best-performing model as a publicly accessible web server (e.g., "anti-Biofilm") for the community to screen new compounds [56].
The workflow for this protocol is summarized in the following diagram:
Protocol 2: Integrated Virtual Screening and Validation for a Specific Target (e.g., LasR)
This protocol details a structure-based approach to find inhibitors for a specific quorum-sensing target.
1. Machine Learning-Based Pre-screening
- Training: Train a binary classifier (e.g., Random Forest) using known active compounds and decoys to distinguish potential actives [55].
- Screening: Use the trained model to screen a large library (e.g., of phytochemicals) to predict and shortlist active compounds [55].
2. Drug-likeness Filtering
- Apply Lipinski's Rule of Five to the shortlisted compounds to focus on those with suitable pharmacokinetic properties [55].
3. Molecular Docking
- Preparation: Prepare the protein structure (e.g., LasR) by adding hydrogens and assigning charges.
- Docking: Dock the filtered compounds into the active site of the target.
- Analysis: Select top candidates based on binding energy scores and analysis of key interactions (e.g., hydrogen bonds with residues like TRY-56, ASP-73, and SER-129 in LasR) [55].
4. Molecular Dynamics (MD) Simulations
- Setup: Solvate the top ligand-protein complexes in a water box and add ions to neutralize the system.
- Production Run: Run MD simulations for at least 100 ns to evaluate the stability of the complex.
- Analysis:
- Calculate the Root Mean Square Deviation (RMSD) of the protein backbone and the ligand to assess stability.
- Use MMPBSA to calculate the binding free energy. A more negative value indicates stronger binding [55].
The workflow for this protocol is summarized in the following diagram:
The Scientist's Toolkit: Research Reagent Solutions
The following table details key resources for conducting computational research on anti-biofilm agents.
| Resource Name | Type | Primary Function | Relevance to Anti-Biofilm Research |
|---|---|---|---|
| aBiofilm Database [56] | Database | Repository of anti-biofilm agents. | Provides a curated source of experimentally validated chemicals, peptides, and other agents with IC50 data, essential for training ML models. |
| BindingDB [55] | Database | Database of measured binding affinities. | Useful for finding known protein-ligand interactions and building structure-based models. |
| BaAMPs [59] [61] | Database | Database of antimicrobial and anti-biofilm peptides. | A key resource for obtaining sequences of bioactive peptides to develop peptide-specific predictors. |
| "anti-Biofilm" Web Server [56] | Software Tool | Regression-based prediction of IC50 activity. | Allows researchers to input a chemical structure and predict its anti-biofilm activity in terms of pIC50. |
| "Biofin" / "BIPEP" Web Server [59] [61] | Software Tool | Prediction of biofilm inhibiting peptides. | Helps in identifying novel peptide sequences with potential anti-biofilm activity from their amino acid sequence. |
| Directory of Useful Decoys, Enhanced (DUD-E) [55] | Database | Library of annotated decoy molecules. | Used to generate negative datasets for training machine learning models to distinguish true actives from inactives. |
| LasR Protein Structure (PDB ID: e.g., 2UV0) [55] | Molecular Target | Quorum sensing receptor. | A common structural target for virtual screening campaigns aimed at disrupting P. aeruginosa biofilm formation. |
Supporting Diagrams
Biofilm Formation and Intervention Points
The following diagram illustrates the process of biofilm formation and key stages where computational approaches can identify interventions.
Synergy and Resistance: Optimizing Combinatorial and Sequential Treatment Regimens
Troubleshooting Guide: Frequently Asked Questions
FAQ 1: Why are conventional antibiotics often ineffective against biofilms? Conventional antibiotics are developed to target free-floating (planktonic) bacteria and face multiple barriers when confronting biofilms. The extracellular polymeric substance (EPS) matrix physically limits antibiotic penetration [12]. Furthermore, biofilms contain metabolically heterogeneous bacterial populations, including dormant persister cells that are highly tolerant to antibiotics [12] [26]. The minimum inhibitory concentration (MIC) required to affect a biofilm can be 100 to 800 times greater than that needed for planktonic cells [12].
FAQ 2: What is the core principle behind a "Disrupt-Before-Eradicating" strategy? This strategy involves a two-step sequential therapy. The first step uses a non-antibiotic dispersal agent to break down the protective biofilm matrix and release the embedded bacterial cells. The second step applies a conventional antibiotic to kill the newly vulnerable, dispersed planktonic cells. This approach bypasses the physical and physiological barriers of the biofilm [62].
FAQ 3: Which biofilm components do dispersal agents typically target? Dispersal agents are designed to degrade key structural components of the EPS, including:
- Exopolysaccharides (e.g., dPNAG, alginate): Targeted by glycoside hydrolases [26].
- Extracellular DNA (eDNA): Targeted by deoxyribonucleases (DNases) [12] [26].
- Proteins: Targeted by proteases [26].
- Quorum Sensing Signals: Disrupted by quorum sensing inhibitors (QSIs) to prevent cell-to-cell communication vital for biofilm maintenance [12] [62].
FAQ 4: We are using dispersal enzymes, but in-vivo results are poor. What could be wrong? Several factors could be at play. The enzyme may be inactivated by host proteases or the local environment (e.g., pH). Its size may limit diffusion deep into the biofilm. Furthermore, the enzyme might only target one EPS component, while the biofilm matrix is a complex mixture of polymers. Consider using enzyme cocktails or nanoparticle-based delivery to protect the agent and enhance penetration [63] [26].
FAQ 5: How can I quantitatively measure the synergy between a dispersal agent and an antibiotic? Synergy is typically demonstrated by comparing the log reduction in colony-forming units (CFU) between treatments. A synergistic combination will show a significantly greater reduction than the sum of the effects of the dispersal agent and antibiotic used alone. The data in the table below from recent studies provides examples of such quantitative measurements [62].
Quantitative Efficacy of Combination Therapies Against Biofilms
Table 1: Representative data showing the enhanced efficacy of dispersal agent and antibiotic combinations against various bacterial species. [62]
| Dispersal Agent | Antibiotic | Tested Species | Efficacy (CFU Reduction) | In vivo Model |
|---|---|---|---|---|
| Hamamelitannin analogue | Vancomycin | Staphylococcus aureus | 5.75-log (Combo) vs. ≤1-log (Agent) vs. 3.75-log (Abx) | Yes |
| Nitric Oxide (NO) | Tobramycin | Pseudomonas aeruginosa | 65% biomass reduction (Combo) vs. 50% (Agent) vs. <1% (Abx) | No |
| Quorum Sensing Inhibitor (C11) | Ciprofloxacin | Pseudomonas aeruginosa | 4-6-log (Combo) vs. <1-2-log (Agent) vs. 1-2-log (Abx) | No |
| Antimicrobial Peptide (G10KHc) | Tobramycin | Pseudomonas aeruginosa | 4-log (Combo) vs. <1-log (Agent) vs. <1-log (Abx) | No |
| Ambroxol | Vancomycin | Staphylococcus epidermidis | 7-log (Combo) vs. <1-log (Agent) vs. ~3-log (Abx) | Yes |
Experimental Protocols for Key "Disrupt-Before-Eradicating" Methodologies
Protocol 1: Evaluating Glycoside Hydrolase and Antibiotic Synergy
Objective: To determine the efficacy of Dispersin B (a glycoside hydrolase that cleaves dPNAG) in sensitizing Staphylococcus epidermidis biofilms to gentamicin.
Materials:
- Bacterial strain: S. epidermidis (e.g., ATCC 35984)
- Growth medium: Tryptic Soy Broth (TSB)
- Dispersal agent: Recombinant Dispersin B (100 µg/mL stock)
- Antibiotic: Gentamicin (10 mg/mL stock)
- 96-well polystyrene microtiter plates
- Phosphate Buffered Saline (PBS)
- Crystal Violet stain (0.1% w/v)
Methodology:
- Biofilm Formation: Grow S. epidermidis overnight in TSB. Dilute 1:100 in fresh TSB and aliquot 200 µL per well into a 96-well plate. Incubate statically for 24 hours at 37°C to allow biofilm formation.
- Treatment: Carefully aspirate the planktonic culture.
- Group 1 (Control): Add 200 µL PBS.
- Group 2 (Antibiotic Only): Add 200 µL of gentamicin (at 10x MIC).
- Group 3 (Dispersin B Only): Add 200 µL of Dispersin B (10 µg/mL).
- Group 4 (Sequential Therapy): First add 200 µL of Dispersin B (10 µg/mL) and incubate for 2 hours. Then aspirate and add 200 µL of gentamicin (10x MIC).
- Incubation: Incubate the plate for a further 18-24 hours at 37°C.
- Assessment:
- Biomass (Crystal Violet): Aspirate treatments, wash wells with PBS, and stain with 0.1% crystal violet for 15 minutes. Wash, solubilize with acetic acid (30%), and measure absorbance at 595 nm.
- Viability (CFU Count): In a parallel plate, after treatment, aspirate and sonicate wells in PBS for 5 minutes to dislodge biofilm. Serially dilute and plate on TSA to enumerate CFU/mL.
Protocol 2: Testing Nitric Oxide (NO)-Releasing Nanoparticles with Ciprofloxacin
Objective: To assess the biofilm-dispersing and antibiotic-sensitizing effect of NO-releasing nanoparticles on Pseudomonas aeruginosa PAO1 biofilms.
Materials:
- Bacterial strain: P. aeruginosa PAO1
- Growth medium: LB Broth
- Dispersal agent: Diazeniumdiolate-based NO-donor nanoparticles (e.g., PROLI/NO)
- Antibiotic: Ciprofloxacin (1 mg/mL stock)
- Confocal Laser Scanning Microscopy (CLSM) setup
- SYTO 9 and Propidium Iodide fluorescent stains
Methodology:
- Biofilm Formation: Grow biofilms in flow cells or on coverslips in a 6-well plate for 48-72 hours in LB medium.
- Treatment:
- Group 1: Untreated control (Buffer only).
- Group 2: Ciprofloxacin at 5x MIC for planktonic cells.
- Group 3: NO-nanoparticles (at a concentration known to release ~50-500 nM NO).
- Group 4: NO-nanoparticles for 1 hour, followed by ciprofloxacin for 4 hours.
- Analysis:
- Viability Staining: Use LIVE/DEAD BacLight viability kit (SYTO 9/PI). Incubate biofilms with stain for 15 mins in the dark.
- Confocal Microscopy: Image multiple random fields per sample using CLSM. Quantify biovolume and the ratio of live/dead cells using image analysis software (e.g., ImageJ/COMSTAT).
- CFU Enumeration: As described in Protocol 1.
Visualizing the Strategy: Pathways and Workflows
Diagram 1: Sequential Therapy Workflow. This diagram outlines the core two-step process of first disrupting the biofilm matrix before administering antibiotics to eradicate the dispersed cells.
Diagram 2: Enzyme Targeting of Biofilm Matrix. This chart shows how different classes of dispersal enzymes target specific structural components of the extracellular polymeric substance (EPS) to disrupt the biofilm.
The Scientist's Toolkit: Research Reagent Solutions
Table 2: Essential reagents and materials for developing and testing sequential anti-biofilm therapies. [62] [63] [26]
| Item | Function & Application | Key Consideration |
|---|---|---|
| Dispersin B | Glycoside hydrolase that degrades poly-N-acetylglucosamine (dPNAG), a key polysaccharide in staphylococcal biofilms. | Effective against biofilms from S. aureus, S. epidermidis, and E. coli. |
| Recombinant DNase I | Degrades extracellular DNA (eDNA) in the biofilm matrix, weakening structural integrity. | Particularly effective for disrupting biofilms of Pseudomonas aeruginosa and Candida albicans. |
| Nitric Oxide Donors (e.g., NONOates) | Induces biofilm dispersal by breaking down the matrix and triggering a transition from sessile to planktonic lifestyle. | Concentration is critical; low doses disperse, high doses can be bactericidal. |
| Quorum Sensing Inhibitors (QSIs) | Interfere with bacterial cell-to-cell communication (quorum sensing), preventing coordinated biofilm behavior. | Hamamelitannin and its analogues have shown synergy with antibiotics against S. aureus. |
| CRISPR-Cas9 Nanoparticles | Lipid or gold nanoparticles designed to deliver CRISPR-Cas9 components into bacterial cells to precisely disrupt antibiotic resistance or virulence genes. | A next-generation strategy; requires optimization for efficient delivery into biofilm populations [63]. |
| Cationic Antimicrobial Peptides (e.g., Melimine) | Disrupt the bacterial cell membrane; some also exhibit biofilm dispersal activity. | Can be used in combination with conventional antibiotics for a dual-mode attack [62]. |
Navigating Specificity and Toxicity Challenges of Novel Anti-biofilm Agents and Nanomaterials
Bacterial biofilms are structured communities of microbial cells encased in a self-produced extracellular polymeric substance (EPS) that enables them to adhere to surfaces and evade host immune responses [36]. This EPS matrix presents a formidable barrier to conventional antibiotics, making biofilm-associated infections a significant clinical challenge. The matrix acts as a physical barrier that restricts antibiotic penetration, promotes bacterial dormancy, and facilitates the transfer of drug-resistant genes [64] [36]. Consequently, bacteria within biofilms exhibit 10 to 1000-fold higher resistance to antimicrobial agents compared to their free-floating (planktonic) counterparts [34] [65] [36]. This review establishes a technical support framework to address the key experimental challenges in developing anti-biofilm nanotechnologies, focusing specifically on overcoming specificity and toxicity hurdles while enhancing penetration through the biofilm matrix.
Section 1: Understanding Biofilm Resistance Mechanisms
Frequently Asked Questions
Q1: Why are biofilms significantly more resistant to antibiotics than planktonic bacteria? Biofilms employ multiple concurrent resistance mechanisms that create a robust defensive system. The extracellular polymeric substance (EPS) matrix physically limits the diffusion and penetration of antimicrobial molecules [58] [36]. Additionally, the biofilm microenvironment promotes bacterial entry into dormant or slow-growing states where many antibiotics that target active cellular processes become ineffective [64] [36]. Biofilms also facilitate the horizontal transfer of drug-resistant genes among bacterial cells and contain enzymes that can degrade or modify antibiotics before they reach their cellular targets [64] [36].
Q2: What are the primary components of the biofilm matrix that create this penetration barrier? The biofilm matrix is a complex, highly hydrated mixture of extracellular polymeric substances (EPS) that typically includes exopolysaccharides, extracellular DNA (eDNA), proteins, and lipids [11] [65]. This matrix forms a structured, three-dimensional architecture that surrounds and protects the bacterial cells, with the EPS accounting for approximately 85% of the biofilm volume [65]. The matrix components create a negatively charged, hydrophobic environment that can trap and neutralize antimicrobial agents [64].
Q3: How do nanoparticles overcome the biofilm penetration barrier that limits conventional antibiotics? Nanoparticles leverage their small size and modifiable surface properties to penetrate the biofilm matrix more effectively than conventional antibiotics [34] [64]. Researchers can functionalize nanoparticle surfaces with specific ligands that target biofilm components or respond to the unique biofilm microenvironment (e.g., pH, enzymes) [64]. Certain nanoparticles, particularly metallic ones, can also generate reactive oxygen species (ROS) that directly damage the biofilm structure or disrupt quorum sensing signaling pathways that bacteria use to coordinate biofilm development [34] [36].
Key Mechanisms of Biofilm Resistance
Table 1: Primary mechanisms of antibiotic resistance in bacterial biofilms
| Resistance Mechanism | Description | Impact on Treatment |
|---|---|---|
| Physical Barrier | EPS matrix restricts antibiotic diffusion and penetration [58] | Prevents antimicrobials from reaching effective concentrations at the bacterial cell surface |
| Metabolic Heterogeneity | Gradients of oxygen, nutrients, and waste products create diverse microenvironments with subpopulations of slow-growing or dormant cells [11] [65] | Reduces efficacy of antibiotics that target actively growing cells |
| Enzymatic Inactivation | Biofilm matrix contains enzymes (e.g., β-lactamases) that degrade or modify antibiotics [64] [58] | Neutralizes antimicrobial activity before compounds reach cellular targets |
| Persister Cells | Subpopulation of dormant bacterial cells that exhibit extreme antibiotic tolerance [58] | Enables biofilm regeneration after antibiotic treatment is discontinued |
| Enhanced Genetic Exchange | Biofilm environment facilitates horizontal gene transfer of resistance genes [64] [36] | Promotes dissemination of resistance mechanisms within bacterial community |
Section 2: Quantitative Analysis of Anti-biofilm Nanomaterials
Troubleshooting Guide: Nanoparticle Penetration and Specificity
Problem: Nanoparticles aggregate before reaching the biofilm. Solution: Modify surface chemistry to enhance stability. Implement surface functionalization with polyethylene glycol (PEG) or similar polymers to reduce aggregation [66]. Use charged ligands (e.g., carboxylate, amine) to control electrostatic interactions [66]. For in vivo applications, pre-incubate nanoparticles with natural organic matter (NOM) or serum proteins to form a "corona" that improves stability and targeting [66].
Problem: Insufficient nanoparticle penetration into deep biofilm layers. Solution: Optimize nanoparticle size and surface characteristics. Research indicates that nanoparticles smaller than 50 nm demonstrate significantly better diffusion through dense biofilm matrices [66]. Adjust surface charge as negatively charged nanoparticles often exhibit superior penetration in certain biofilm types [66]. Incorporate biofilm-degrading enzymes (e.g., DNase, dispersin B) into nanocarriers to locally disrupt matrix components and enhance penetration [64] [36].
Problem: Lack of targeting specificity leads to off-target effects. Solution: Functionalize nanoparticles with targeting ligands. Employ biofilm-specific antibodies, lectins, or antimicrobial peptides (AMPs) to enhance binding to biofilm components [36]. Develop stimulus-responsive systems that activate specifically in the biofilm microenvironment (e.g., low pH, high enzyme concentration) [64]. Utilize quorum sensing inhibitors (e.g., furanones) to interfere with bacterial communication without inducing cytotoxicity [34] [58].
Comparative Efficacy of Anti-biofilm Nanomaterials
Table 2: Performance metrics of major nanoparticle classes against bacterial biofilms
| Nanomaterial Class | Key Anti-biofilm Mechanisms | Reported Efficacy (Biofilm Reduction) | Toxicity Concerns |
|---|---|---|---|
| Metal/Metal Oxide NPs (e.g., Ag, ZnO, TiO₂) | ROS generation, matrix degradation, membrane disruption [34] [65] | 3-4 log reduction in biofilm bacterial counts [34] | Dose-dependent cytotoxicity, oxidative tissue damage, environmental persistence [34] |
| Lipid-Based Nanoparticles (e.g., liposomes, niosomes) | Enhanced drug encapsulation and fusion with bacterial membranes [64] [65] | 2-3 log reduction when loaded with antimicrobials [64] | Low intrinsic toxicity, but rapid clearance by mononuclear phagocyte system [64] |
| Polymeric Nanoparticles & Dendrimers | Controlled drug release, surface functionalization, quorum sensing inhibition [64] [36] | 3-5 log reduction with targeted antimicrobial delivery [36] | Potential inflammatory responses to synthetic polymers, biodegradation concerns [64] |
| Antimicrobial Peptide (AMP) Nanocarriers | Membrane disruption, biofilm matrix penetration, downregulation of biofilm genes [36] | 4-6 log reduction (e.g., NZ2114-NPs) [36] | Proteolytic degradation, potential immunogenicity at high concentrations [36] |
Section 3: Experimental Protocols and Methodologies
Standardized Protocol: Evaluating Nanoparticle Penetration into Biofilms
Objective: Quantify the penetration efficiency and distribution of nanoparticles within established biofilms.
Materials and Reagents:
- Fluorescently-labeled nanoparticles (adjust size, charge, and surface functionality based on experimental design)
- Biofilm-forming bacterial strains (e.g., Pseudomonas aeruginosa, Staphylococcus aureus)
- Confocal laser scanning microscopy (CLSM) system with appropriate filters
- Image analysis software (e.g., ImageJ, COMSTAT)
- Microtiter plates or flow cell systems for biofilm growth
- Standard culture media appropriate for selected bacterial strains
Methodology:
- Biofilm Formation: Grow biofilms for 48-72 hours under optimal conditions for the selected bacterial strain. Use flow cell systems for more structured biofilms or static systems for high-throughput screening [11].
- Nanoparticle Exposure: Apply fluorescent nanoparticles at sub-inhibitory concentrations (determined via preliminary MIC assays) to mature biofilms. Include appropriate controls (untreated biofilms, free fluorescent dye).
- Incubation: Allow nanoparticle-biofilm interaction for predetermined time points (e.g., 1h, 4h, 24h) under conditions that maintain biofilm viability.
- Washing and Fixation: Gently wash biofilms with sterile saline or buffer to remove non-adherent nanoparticles. Fix with paraformaldehyde (4%) if necessary for preservation.
- Imaging and Analysis: Use CLSM to capture z-stack images through the biofilm depth. Employ image analysis software to quantify fluorescence intensity at different depths and calculate penetration coefficients [66].
- Viability Assessment: Combine with live/dead staining to correlate nanoparticle penetration with antibacterial efficacy.
Troubleshooting Notes:
- If nanoparticle aggregation occurs during exposure, consider sonication immediately before application or modify surface charge.
- For low signal-to-noise ratio in imaging, increase nanoparticle fluorescence intensity or extend exposure time while minimizing background autofluorescence.
- If penetration is limited to superficial layers, consider smaller nanoparticles (<50 nm) or matrix-disrupting agents [66].
Research Reagent Solutions
Table 3: Essential materials for anti-biofilm nanotechnology research
| Reagent/Category | Specific Examples | Function in Anti-biofilm Research |
|---|---|---|
| Nanoparticle Cores | Silver, gold, zinc oxide, titanium dioxide, selenium, silica [34] [65] | Provide structural foundation; some (e.g., silver, zinc oxide) possess intrinsic antimicrobial activity |
| Surface Modifiers | Polyethylene glycol (PEG), polyvinylpyrrolidone (PVP), peptides, polysaccharides [64] [66] | Enhance stability, reduce aggregation, improve bioavailability, and enable targeted delivery |
| Biofilm Detection Reagents | Crystal violet, SYTO stains, propidium iodide, concanavalin-A conjugates [11] | Visualize and quantify biofilm biomass, viability, and extracellular matrix components |
| Matrix Disruption Enzymes | DNase I, dispersin B, proteinase K, alginate lyase [64] [36] | Degrade specific EPS components to enhance nanoparticle penetration and antimicrobial efficacy |
| Quorum Sensing Inhibitors | Furanones, hamamelitannin, ambuic acid [34] [58] | Interfere with bacterial cell-to-cell communication to prevent biofilm maturation and virulence |
Section 4: Visualization of Anti-biofilm Strategies
Nanoparticle-Biofilm Interaction Pathways
Diagram 1: Anti-biofilm nanoparticle mechanism of action
Experimental Workflow for Anti-bioform Nanomaterial Development
Diagram 2: Anti-biofilm nanomaterial development workflow
Section 5: Advanced Technical Support
Frequently Asked Questions
Q4: How can I differentiate between biofilm-specific activity and general antibacterial effects in my nanoparticle system? Implement comprehensive controls including planktonic bacteria assays alongside biofilm models. Compare minimum inhibitory concentration (MIC) for planktonic cells versus minimum biofilm eradication concentration (MBEC) [11]. Assess impact on quorum sensing pathways using reporter strains and measure effects on biofilm-specific genes (e.g., ALS1, ALS3, EFG1, HWP1) that are known regulators of biofilm formation [36]. Evaluate matrix disruption independently of bacterial killing using EPS-specific staining and quantification methods.
Q5: What strategies can reduce the toxicity of metallic nanoparticles while maintaining anti-biofilm efficacy? Utilize surface modification with biocompatible polymers (e.g., PEG, chitosan) to create a protective layer that reduces direct cellular contact [34] [64]. Implement stimulus-responsive release mechanisms that activate nanoparticles specifically in the biofilm microenvironment (e.g., low pH, enzyme presence) [64]. Combine lower concentrations of metallic nanoparticles with conventional antibiotics or natural anti-biofilm agents to achieve synergistic effects while reducing overall nanoparticle load [34] [58]. Explore hybrid systems where metallic nanoparticles are encapsulated within polymeric shells for controlled release [64] [65].
Q6: How do I validate that my nanoparticle system truly penetrates the biofilm matrix rather than just adhering to the surface? Employ confocal laser scanning microscopy with z-stack imaging to visualize nanoparticle distribution throughout the biofilm depth [66]. Use multiple staining techniques to distinguish between surface-associated and internalized nanoparticles. Implement techniques like fluorescence recovery after photobleaching (FRAP) to measure diffusion coefficients within the biofilm matrix [66]. Consider using different fluorescent labels for nanoparticles and bacterial cells to precisely localize nanoparticle position relative to biofilm architecture.
Troubleshooting Guide: Addressing Toxicity and Specificity
Problem: Nanoparticles show high efficacy but also significant cytotoxicity against mammalian cells. Solution: Implement surface modification strategies to reduce non-specific interactions. Apply PEGylation or use polysaccharide coatings to create a stealth effect [64] [65]. Develop targeting ligands that specifically recognize bacterial cells or biofilm components rather than mammalian membranes [36]. Adjust nanoparticle composition to incorporate less toxic elements (e.g., transitioning from silver to zinc oxide in some applications) while maintaining anti-biofilm activity [34] [65].
Problem: Nanoparticles lose stability in biological fluids before reaching the biofilm. Solution: Pre-form a protein corona by incubating nanoparticles with serum proteins before application to improve stability in biological environments [66]. Increase surface charge magnitude to enhance electrostatic repulsion between nanoparticles. Incorporate stability-enhancing excipients (e.g., trehalose, sucrose) in nanoparticle formulations to protect against aggregation in physiological conditions [64].
Problem: Inconsistent results between different biofilm models. Solution: Standardize biofilm growth conditions and maturity assessment across experiments. Use multiple complementary models (static, flow cell, in vivo) to validate findings [11]. Characterize biofilm architecture and matrix composition for each model to understand how these variables affect nanoparticle performance. Include relevant controls that account for model-specific variations in biofilm physiology and susceptibility.
Within the broader research on overcoming the biofilm matrix barrier for antibiotic penetration, understanding the contribution of host-derived materials is crucial. Biofilms, structured microbial communities encased in an extracellular polymeric substance (EPS), are notorious for their role in persistent infections and antimicrobial resistance [16]. While the bacterial-produced matrix is well-studied, recent research highlights that host-derived DNA and proteins significantly augment biofilm resilience by enhancing structural integrity and creating a formidable barrier against antibiotics [19] [3]. These host components integrate into the EPS, a complex matrix of polysaccharides, proteins, extracellular DNA (eDNA), and lipids [67] [19], resulting in a composite biological barrier that is significantly more challenging to penetrate than one composed solely of bacterial factors.
The clinical implications are substantial. Infections involving a biofilm component are often chronic and highly recalcitrant to antibiotic therapy [3]. For example, in chronic wounds and cystic fibrosis lungs, host materials such as neutrophil extracellular traps (NETs), which are rich in DNA, and host proteins like fibrin, intertwine with the bacterial EPS [19] [3]. This integration poses a critical problem for drug development: standard antibiotics, developed against planktonic bacteria, fail to accumulate at effective concentrations at the site of infection. Therefore, dissecting the role of host-derived DNA and proteins is not merely an academic exercise but a necessary step in developing novel strategies to enhance antibiotic efficacy and overcome one of the most significant barriers in treating chronic infections.
Mechanisms of Host-Facilitated Biofilm Resilience
The Role of Host-Derived DNA
Host-derived DNA, primarily released from neutrophils through the formation of NETs, is a major contributor to the biofilm matrix's structural integrity and defensive capabilities [3]. The DNA strands form a dense, anionic network that integrates with bacterial EPS components.
- Physical Barrier Function: The mesh-like structure of DNA acts as a physical shield. Studies on P. aeruginosa biofilms in the cystic fibrosis lung have demonstrated that a combination of bacterial eDNA and host eDNA forms a physical barrier that protects the biofilm from antibiotics like tobramycin and from clearance by host immune cells [3].
- Electrostatic Binding of Antimicrobials: The negatively charged backbone of DNA electrostatically binds and traps positively charged aminoglycoside antibiotics [3]. This binding significantly slows the diffusion of the antibiotic through the biofilm, preventing it from reaching bactericidal concentrations in the deeper layers [3].
- Enhanced Structural Cohesion: Host eDNA facilitates interactions with other matrix components and bacterial cell surfaces, often mediated by DNA-binding proteins [67]. This cross-linking reinforces the entire biofilm architecture, making it more difficult to disrupt physically or chemically.
The Role of Host-Derived Proteins
Host proteins such as fibrin, fibrinogen, and other plasma proteins coat surfaces and are incorporated into the biofilm, influencing attachment, stability, and resistance.
- Scaffolding for Attachment: Proteins like fibrin provide a scaffold for bacterial adhesion. Staphylococcus aureus utilizes its fibrinogen-binding clumping factor A (ClfA) to bind to host fibrinogen and fibrin, which coats medical devices like catheters. This interaction is a critical first step in forming robust biofilms on these surfaces [3].
- Altered Penetration Dynamics: The proteinaceous layer can hinder the penetration of various antimicrobial agents through mechanisms such as molecular sieving, hydrophobic interactions, or by creating a denser matrix through which drugs must diffuse [12].
- Modulation of Host Immunity: The host protein layer can sometimes disguise the biofilm, reducing its immunogenicity. Furthermore, the biofilm matrix, fortified with host proteins, can act as a physical obstacle for immune cells like neutrophils and macrophages, preventing them from effectively phagocytosing the embedded bacteria [19].
Quantitative Data on Host-Factor Mediated Resistance
The integration of host components into the biofilm matrix leads to quantifiable increases in antimicrobial resistance. The table below summarizes key data from experimental studies.
Table 1: Quantitative Impact of Host-Derived Components on Biofilm Resistance
| Host Factor | Pathogen Model | Antimicrobial Challenge | Observed Resistance Effect | Citation |
|---|---|---|---|---|
| Host & Bacterial eDNA | P. aeruginosa | Tobramycin | Formation of a physical shield, greatly decreased susceptibility | [3] |
| Fibrin/Fibrinogen | S. aureus | Vancomycin, Rifampicin | Significantly more resistant biofilms formed on plasma-coated surfaces | [3] |
| Neutrophil Extracellular Traps (NETs) | P. aeruginosa | Tobramycin | NET layer hindered antibiotic access, greatly decreasing susceptibility | [3] |
| General EPS Matrix (incl. host factors) | Various (e.g., S. aureus, P. aeruginosa) | Multiple Antibiotics | Biofilm cells can be 10–1000 fold less susceptible than planktonic cells | [67] |
Table 2: Increased Antibiotic Dosage Requirements Against Biofilms
| Antibiotic Class | Typical MIC for Planktonic Cells | Required MIC for Biofilm Eradication (General) | Fold-Increase | |
|---|---|---|---|---|
| Various (e.g., β-lactams, Aminoglycosides) | 1x MIC | 100-800x MIC | 100 - 800 fold | [12] |
Experimental Protocols for Investigating Host Factors
To study these host factors, reproducible and reliable assays are essential. The following protocols are adapted from established methods for quantifying biofilm formation and dispersal, with modifications to incorporate host components.
Protocol 1: Assessing Biofilm Formation in the Presence of Host Components
Objective: To evaluate the ability of host-derived DNA or proteins to enhance or inhibit initial biofilm formation.
Materials:
- Mueller-Hinton Broth (MHB) or other suitable media [68]
- 24- or 96-well clear flat-bottom polystyrene plates [68]
- Host factors: e.g., purified human DNA (to simulate NETs), Fibrinogen (from human plasma), prepared in PBS or media.
- Test antimicrobial compound
- Phosphate-buffered saline (PBS, pH 7.4) [68]
- 0.1% Crystal violet solution [68]
- Modified biofilm dissolving solution (MBDS: 10% SDS in 80% Ethanol) [68]
- Plate reader capable of measuring OD at 570-600 nm [68]
Workflow: The experimental workflow for assessing biofilm formation in the presence of host components is as follows.
Procedure:
- Surface Pre-conditioning: Add a solution of the host factor (e.g., 100 µg/mL DNA, 1 mg/mL fibrinogen) to the wells of a microtiter plate. Incubate for 1-2 hours at the relevant temperature (e.g., 37°C) to allow coating. Remove the solution and let the wells air dry in a laminar flow cabinet [3].
- Biofilm Cultivation: Prepare a bacterial suspension in MHB at an OD600 of approximately 0.05 (~10^7 CFU/mL) [68]. Dispense the suspension into the pre-coated wells. Add the antimicrobial compound at the desired concentration. Include controls: medium-only, bacteria-only (no host factor), and host-factor-only.
- Incubation: Incubate the plates under static conditions for 24-48 hours at the appropriate temperature and atmosphere for the pathogen [68].
- Biofilm Quantification:
- Carefully remove the planktonic culture and rinse the wells twice gently with distilled water to remove non-adherent cells.
- Air-dry the plates for 15 minutes.
- Stain the adhered biofilm with 0.1% crystal violet for 10 minutes.
- Rinse away unbound dye thoroughly with water.
- Solubilize the bound crystal violet with MBDS.
- Transfer the solution to a new flat-bottom plate and measure the OD at 570-600 nm [68].
Protocol 2: Biofilm Dispersal Assay Against Mature Biofilms
Objective: To test the efficacy of biofilm-dispersing agents (e.g., DNase I, fibrinolytic agents) on pre-formed biofilms that include host factors.
Materials: (In addition to Protocol 1 materials)
- Dispersal agents: DNase I (e.g., 100 µg/mL in PBS), fibrinolytic agents (e.g., Plasmin, Nattokinase).
- PBS.
Procedure:
- Grow Biofilm: Form a mature biofilm over 24-48 hours in host-factor-coated plates as described in Protocol 1, steps 1-3.
- Treat with Dispersal Agent: Gently remove the spent media and add the dispersal agent (e.g., DNase I) in PBS or fresh media to the wells. PBS-only is used as a negative control [68] [3].
- Incubate: Incubate the plates for a suitable period (e.g., 2-24 hours) under optimal conditions for the agent's activity [3].
- Assess Dispersal:
- Option 1 (Biomass): Quantify the remaining biofilm using the crystal violet method as in Protocol 1.
- Option 2 (Viability): Use a metabolic assay like MTT or resazurin on the dispersed and remaining cells to assess viability.
- Option 3 (Microscopy): Use confocal laser scanning microscopy (CLSM) with live/dead staining to visualize biofilm architecture and bacterial viability before and after treatment [68].
The Scientist's Toolkit: Essential Research Reagents
Table 3: Key Reagents for Studying Host Factors in Biofilm Resilience
| Reagent / Material | Function in Experiment | Example Usage & Rationale |
|---|---|---|
| Purified Human DNA | Simulates the host eDNA component derived from NETs. | Added to biofilm cultures or used to pre-coat surfaces to study its role in antibiotic trapping and structural integrity [3]. |
| Fibrinogen / Fibrin | Simulates the host protein scaffold on indwelling devices. | Pre-coating well plates or coupons to study bacterial adhesion and biofilm formation under clinically relevant conditions [3]. |
| DNase I (e.g., from Bovine Pancreas) | Enzyme that degrades DNA. | Used in dispersal assays to disrupt the eDNA network within the biofilm, thereby increasing antibiotic penetration [19] [3]. |
| Fibrinolytic Agents (e.g., Plasmin) | Enzymes that break down fibrin. | Applied to disperse biofilms that rely on a fibrin scaffold, particularly those of S. aureus [3]. |
| Crystal Violet | A dye that binds to negatively surface-bound cells and polysaccharides. | Standard spectrophotometric method for quantifying total adhered biofilm biomass [68]. |
| Confocal Laser Scanning Microscope (CLSM) | High-resolution 3D imaging. | To visualize biofilm architecture, the distribution of host factors (via staining), and bacterial viability (e.g., using LIVE/DEAD stains) after treatments [68]. |
| 24-/96-well Polystyrene Plates | Platform for high-throughput biofilm cultivation. | The standard vessel for static biofilm assays, allowing for multiple replicates and conditions [68]. |
Troubleshooting Guides and FAQs
FAQ 1: Our biofilm dispersal results with DNase are highly variable. What could be the cause?
- Potential Cause: Inconsistent activity of the DNase enzyme due to improper storage, dilution, or the presence of inhibitors in the growth media (e.g., divalent cations).
- Solution:
- Prepare fresh DNase aliquots for each experiment and store them at recommended temperatures.
- Use the enzyme in a suitable buffer (as per manufacturer guidelines) rather than directly in complex growth media.
- Include a positive control (e.g., a known concentration of DNA with DNase) to verify enzyme activity in your experimental setup.
- Ensure that the biofilm maturation time is consistent, as the density and composition of the matrix can affect dispersal efficacy.
FAQ 2: We do not see a significant effect of host fibrinogen on biofilm formation in our model. Why?
- Potential Cause 1: The bacterial strain used may not possess the specific adhesins required to bind to the host protein.
- Solution: Verify the genotype of your strain for relevant adhesion genes (e.g., clfA for S. aureus). Consider using a positive control strain with known binding capability.
- Potential Cause 2: The surface coating was ineffective.
- Solution: Optimize the concentration of the host protein for coating and ensure the coating process (incubation time, temperature, absence of detergents) allows for proper adsorption to the polystyrene surface.
FAQ 3: How can we confirm that host-derived DNA is integrated into our in vitro biofilm model and is not just background from lysed cells?
- Solution: Use specific staining and microscopy.
- Incorporate a fluorescent dye that selectively binds to DNA (e.g., DAPI, SYTO dyes) during the CLSM sample preparation [68].
- Use immunofluorescence with antibodies specific for methylated CpG motifs, which are characteristic of mammalian DNA, to distinguish it from bacterial eDNA.
FAQ 4: The antibiotic tolerance in our host-factor-enhanced biofilm is lower than expected based on published data. How can we improve the model?
- Potential Cause: The biofilm may not be mature enough, or the ratio of host factor to bacterial EPS may be suboptimal.
- Solution:
- Extend the biofilm growth period to allow for a thicker, more structured mature biofilm to form.
- Titrate the concentration of the added host factor (DNA/protein) to find the optimal concentration that maximizes the barrier effect without completely inhibiting initial bacterial attachment.
- Consider using a flow-cell system instead of a static plate assay, as shear stress can promote the development of a more robust and clinically relevant biofilm structure.
Conceptual Framework and Path Forward
The following diagram illustrates the multi-faceted role of host-derived factors in contributing to biofilm-associated antibiotic treatment failure.
Conclusion and Future Perspectives: The integration of host-derived DNA and proteins into the biofilm matrix represents a critical, yet often overlooked, factor in the challenge of antibiotic penetration. Moving forward, research must focus on combination therapies that simultaneously target both bacterial and host components of the matrix. Promising strategies include the co-administration of antibiotics with matrix-disrupting agents like DNase I or fibrinolytic enzymes [19] [3], the development of novel drug delivery systems (e.g., nanoparticles) that can better navigate this complex barrier [14], and the engineering of anti-fouling surfaces that resist the deposition of host proteins which facilitate initial bacterial attachment. By deconstructing the host's contribution to biofilm resilience, we can pave the way for more effective therapeutic interventions against some of the most stubborn infections in modern medicine.
Strategies to Counteract Efflux Pump Upregulation and Prevent Resistant Mutant Selection
FAQs: Troubleshooting Efflux Pump-Related Experimental Challenges
FAQ 1: How can I confirm that reduced antibiotic susceptibility in my bacterial isolates is due to efflux pump activity?
Answer: A multi-step approach is recommended to confirm efflux pump activity.
- First, conduct a phenotypic assay: Use the Ethidium Bromide (EtBr) Agar Cartwheel Method. Prepare Mueller-Hinton Agar plates containing a sub-inhibitory concentration of EtBr (e.g., 0.5 µg/mL). Streak your test isolates and relevant control strains (efflux-positive and negative) radially from the center. After incubation, observe under UV light. Isolates with active efflux will show little or no fluorescence compared to controls, as EtBr is extruded from the cell.
- Second, perform an Efflux Pump Inhibitor (EPI) assay: Determine the Minimum Inhibitory Concentration (MIC) of the antibiotic of interest against your isolate, both in the presence and absence of a known EPI (e.g., Phe-Arg-β-naphthylamide (PAβN) at 20-50 µg/mL or Carbonyl cyanide m-chlorophenyl hydrazone (CCCP) at 10 µg/mL). A four-fold or greater decrease in the MIC in the presence of the EPI is a strong indicator of efflux-mediated resistance [69].
- Finally, validate with genetic analysis: Use quantitative RT-PCR to measure the expression levels of genes encoding key efflux pump components (e.g.,
adeB,acrB,mexB). Significant overexpression in the resistant isolate compared to a susceptible control confirms the phenotype at the genetic level [70] [69].
FAQ 2: Which efflux pump inhibitors are most effective for my in vitro assays, and how do I manage their toxicity?
Answer: The choice of EPI depends on the bacterial species and the efflux pump family being targeted. The table below summarizes options, including promising repurposed drugs and natural compounds.
Table 1: Selected Efflux Pump Inhibitors for Experimental Use
| Inhibitor | Type/Origin | Proposed Mechanism/Note | Reported Efficacy | Toxicity Consideration |
|---|---|---|---|---|
| PAβN | Synthetic Peptide | Broad-spectrum EPI for RND pumps in Gram-negative bacteria [69]. | Restores susceptibility to multiple antibiotic classes [69]. | Shows some toxicity, which has limited clinical development [71]. |
| Omeprazole | Repurposed Drug (Proton Pump Inhibitor) | Potential synergistic activity with imipenem; downregulates efflux pump gene expression [69]. | 2-6 fold decrease in imipenem MIC for CRAB strains [69]. | Well-tolerated human drug; favorable toxicity profile for research. |
| Flupentixol | Repurposed Drug (Antipsychotic) | Inhibits NorA efflux pump in S. aureus; synergizes with ciprofloxacin [71]. | Effective in a shigellosis mouse model, reducing inflammatory markers [71]. | Pre-existing pharmacokinetic and toxicity data available. |
| Cinnamomum verum oil | Natural Product | Acts as a synergistic adjuvant; mechanism may involve gene downregulation [69]. | Rejuvenated imipenem activity against 90% of tested CRAB strains [69]. | Generally considered safe; a promising natural alternative. |
To manage toxicity in assays:
- Use the lowest effective concentration. Start with a checkerboard assay to find the synergistic combination that allows for low EPI doses.
- For toxic inhibitors like CCCP, use them primarily for in vitro phenotypic confirmation and avoid them in animal studies. Repurposed drugs with known safety profiles, like omeprazole or flupentixol, are better candidates for downstream in vivo experiments [69] [71].
FAQ 3: My experimental evolution experiments consistently select for resistant mutants with efflux pump upregulation. How can I prevent this?
Answer: The selection of efflux-upregulated mutants is common because efflux pumps provide a broad, low-level resistance that acts as a gateway to higher-level resistance [70] [72]. To counteract this:
- Use Combination Therapy: Co-administer the primary antibiotic with an EPI from the start of the experiment. This applies selective pressure against bacteria that rely solely on efflux for survival, preventing their enrichment in the population [69] [71].
- Avoid Sub-inhibitory Antibiotic Concentrations: Sub-MIC levels of antibiotics can enrich for efflux pump overexpressors. Ensure dosing regimens in your experiments (e.g., in chemostats or animal models) maintain concentrations above the MIC for a sufficient duration.
- Target the Regulators: Research is focusing on targeting the regulatory pathways that control efflux pump expression (e.g., local repressors or two-component systems). While still experimental, disrupting this regulation could prevent upregulation without directly inhibiting the pump itself [73].
FAQ 4: How does the biofilm environment complicate the study of efflux pumps, and how can I account for it?
Answer: Biofilms introduce significant complexity. Efflux pump activity and expression are heterogenous within a biofilm; for example, pumps may be more active in surface-layer cells [12]. Furthermore, the biofilm matrix can limit EPI penetration, and the nutrient-gradient-induced slow growth of sub-populations (persisters) confers intrinsic tolerance independent of efflux [12] [3] [13].
To account for biofilms in your experimental design:
- Measure Gene Expression In Situ: When analyzing biofilm samples, use techniques like RT-qPCR on carefully harvested entire biofilms or spatial methods like RNA-FISH to account for heterogeneity. Do not rely on data from planktonic cultures.
- Test EPI Efficacy in Biofilm Models: An EPI that works well against planktonic cells may fail in a biofilm. Use established biofilm assays (e.g., Calgary Biofilm Device, MBEC assay) to test antibiotic-EPI combinations against biofilm-grown cells [12] [24].
- Consider Adjuvant Strategies: Since EPI penetration can be poor, combine them with matrix-disrupting agents. Enzymes such as glycoside hydrolases (which break down polysaccharides) or DNase I (which degrades extracellular DNA) can increase the penetration of both antibiotics and EPIs, leading to more effective biofilm eradication [3].
Experimental Protocols
Protocol 1: Checkerboard Broth Microdilution for Synergy Testing (EPI + Antibiotic)
This protocol is used to determine the synergistic effect between an antibiotic and an Efflux Pump Inhibitor (EPI) [69] [71].
Preparation:
- Prepare a bacterial suspension adjusted to a 0.5 McFarland standard, then diluted to achieve a final concentration of ~5 x 10^5 CFU/mL in the assay.
- Prepare two-fold serial dilutions of the antibiotic in Mueller-Hinton Broth (MHB) in a 96-well microtiter plate, along the vertical axis (rows).
- Similarly, prepare two-fold serial dilutions of the EPI in MHB along the horizontal axis (columns).
Inoculation:
- Add the prepared bacterial inoculum to all wells, resulting in a final volume of 100 µL per well. The final concentration of the antibiotic will vary across rows, and the EPI across columns.
- Include controls: growth control (bacteria + MHB), sterility control (MHB only), and antibiotic/EPI-only controls.
Incubation and Reading:
- Incub the plate at 37°C for 18-24 hours.
- The Minimum Inhibitory Concentration (MIC) of both compounds is determined visually or using a redox indicator like resazurin. The MIC is the lowest concentration with no visible growth or no color change (blue resazurin remains blue) [71].
Data Analysis:
- Calculate the Fractional Inhibitory Concentration (FIC) index.
- FIC index = (MIC of antibiotic in combination / MIC of antibiotic alone) + (MIC of EPI in combination / MIC of EPI alone).
- Synergy is defined as an FIC index of ≤ 0.5.
Protocol 2: Quantitative Real-Time PCR (RT-qPCR) for Efflux Pump Gene Expression
This protocol measures the relative expression of efflux pump genes in resistant versus susceptible isolates [69].
RNA Extraction:
- Grow bacterial cultures to the desired phase (e.g., mid-log phase). For biofilms, carefully scrape and harvest biomass.
- Stabilize the cells immediately using an RNA stabilization reagent.
- Extract total RNA using a commercial kit, including a DNase I digestion step to remove genomic DNA contamination.
cDNA Synthesis:
- Quantify the RNA concentration and quality.
- Use equal amounts of high-quality RNA (e.g., 1 µg) from each sample to synthesize cDNA using a reverse transcription kit with random hexamers.
qPCR Amplification:
- Design primers specific to your target efflux pump genes (e.g.,
adeB,acrB) and a stable reference gene (e.g.,rpoB,gyrB). - Prepare the qPCR reaction mix containing cDNA, primers, and SYBR Green master mix.
- Run the reaction in a real-time PCR cycler with the following typical conditions: initial denaturation (95°C for 2 min), followed by 40 cycles of denaturation (95°C for 15 sec) and annealing/extension (60°C for 1 min).
- Design primers specific to your target efflux pump genes (e.g.,
Data Analysis:
- Calculate the cycle threshold (Ct) values for the target and reference genes.
- Use the comparative 2^−ΔΔCt method to determine the relative fold change in gene expression in the test sample compared to the control (e.g., susceptible strain).
Research Reagent Solutions
Table 2: Essential Research Reagents for Efflux Pump Studies
| Reagent / Material | Function in Research | Specific Examples |
|---|---|---|
| Efflux Pump Inhibitors (EPIs) | To phenotypically confirm efflux activity and explore combination therapies to reverse resistance. | PAβN, CCCP, Omeprazole, Flupentixol, Cinnamomum verum oil [69] [71]. |
| Reporter Dyes | To visually assess efflux activity in phenotypic assays. | Ethidium Bromide (EtBr), Hoechst 33342, Resazurin (for viability/MIC) [69] [71]. |
| Molecular Biology Kits | To extract nucleic acids and synthesize cDNA for gene expression analysis. | Total RNA extraction kits, DNase I treatment kits, Reverse Transcription kits [69]. |
| qPCR Primers & Probes | To quantify the expression levels of efflux pump genes and reference housekeeping genes. | Primers for adeB, mexB, acrB, norA; and reference genes rpoB, gyrB [69]. |
| Biofilm Growth Equipment | To cultivate biofilms for studying efflux in a physiologically relevant, tolerant state. | Calgary Biofilm Device (MBEC Assay), flow cells, crystal violet for biomass staining [12] [3]. |
| Matrix-Disrupting Enzymes | To increase antimicrobial and EPI penetration in biofilms for improved efficacy. | Glycoside Hydrolases, DNase I, Dispersin B [3]. |
Visual Guide: Efflux Pump Regulation and Experimental Workflow
The following diagram illustrates the regulatory pathways of efflux pump expression and the key stages of an experimental workflow to develop countermeasures, situating this process within the context of biofilm-related research.
From Bench to Bedside: Validating Efficacy in Advanced Biofilm Models and Clinical Settings
FAQs on Model Selection and Application
Q1: What are the primary considerations when choosing between microtiter plates and flow cells for biofilm penetration studies?
A: The choice depends on your research objectives, as summarized in the table below.
| Feature | Microtiter Plates (Static Models) | Flow Cells (Advanced Models) |
|---|---|---|
| Throughput | High-throughput, suitable for screening [74] | Low-throughput, suited for detailed mechanistic studies |
| Fluid Dynamics | Static conditions, no shear stress [75] | Continuous flow, incorporates fluid shear stress [75] |
| Biofilm Structure | Often less mature, homogeneous structures | Promotes development of complex, in vivo-like heterogeneous structures [75] |
| Data Output | Endpoint biomass quantification (e.g., CV, fluorescence) [74] | Real-time, non-destructive monitoring (e.g., microscopy) |
| Cost & Complexity | Low cost, technically simple [74] | Higher cost, requires specialized equipment and setup |
| Best for | Initial anti-biofilm compound screening, AST [76] | Studying biofilm development, architecture, and penetration kinetics |
Q2: How does the choice of growth media impact the biological relevance of in vitro biofilm models in antibiotic penetration research?
A: The growth medium is a critical, yet often overlooked, factor. Standard lab media like Tryptic Soy Broth (TSB) or Luria-Bertani (LB) lack the physiological proteins and nutrients present in the human body, which can drastically alter biofilm formation and antibiotic efficacy [75]. For example, the presence of human serum components can influence bacterial metabolism and the composition of the Extracellular Polymeric Substance (EPS), directly affecting drug penetration and activity. To enhance relevance, consider supplementing standard media with relevant biological fluids (e.g., serum, mucin) or using specialized, biologically relevant media that more closely mimic the in vivo environment you are modeling [75].
Q3: In a microtiter plate assay, how can I independently quantify different bacterial species in a polymicrobial biofilm?
A: Traditional staining methods like crystal violet cannot distinguish between species. For high-throughput quantification in microtiter plates, the most effective strategy is to use bacterial strains that constitutively express different fluorescent or bioluminescent proteins (e.g., eGFP, E2-Crimson, lux) [74]. By measuring the fluorescence or luminescence signals specific to each tag, you can independently track and quantify the biomass of each species within the mixed biofilm over time, without the need for time-consuming plating on selective agar [74].
Troubleshooting Guides
Issue: High Variance in Biofilm Formation in Microtiter Plates
Problem: Biofilm growth across replicate wells is inconsistent, leading to high data variance and unreliable results.
Solutions:
- Protocol Standardization: Strictly standardize all steps, including inoculation density, incubation time, temperature, and washing techniques [74].
- Plate Coating: Pre-coat wells with physiologically relevant proteins (e.g., collagen, fibronectin) to provide a consistent surface for attachment, better mimicking host conditions [75].
- Staining Validation: If using viability stains like resazurin, ensure the standard curve for fluorescence vs. cell number is optimized for each specific bacterial species and growth medium used [74].
Issue: Poor Antibiotic Penetration in Flow Cell Models
Problem: Antibiotics fail to penetrate the dense biofilm matrix in flow cells, but you are unsure if it's due to physical barrier or enzymatic inactivation.
Solutions:
- Penetration Tracing: Use fluorescently tagged versions of the antibiotic (if available) and confocal microscopy to visually track its diffusion and localization within the biofilm in real-time.
- Matrix Disruption Test: Introduce a non-enzymatic matrix-disrupting agent (e.g., EDTA, which chelates cations essential for matrix stability) alongside the antibiotic [76]. If penetration and efficacy improve significantly, the EPS physical barrier is a major factor.
- Check for Enzymatic Degradation: Assess the stability of the antibiotic in the effluent from the flow cell. A loss of antibiotic activity in the effluent, compared to a fresh solution, suggests the biofilm may be producing inactivating enzymes (e.g., β-lactamases) [75].
Issue: Model Fails to Replicate In Vivo Antibiotic Tolerance
Problem: Bacteria that show high tolerance in an animal model or clinical infection are easily killed in your in vitro model.
Solutions:
- Review Media Bio-relevance: Transition from rich laboratory media to nutrient-limited, biologically relevant media that induces slower, more in vivo-like growth and biofilm phenotypes [75].
- Incorporate Host Components: Introduce relevant host factors such as human serum or immune cells (e.g., neutrophils) into your model. Biofilms can suppress immune cell function, a key mechanism of persistence not captured in bacteria-only models [75].
- Induce Persister Cells: Ensure your model includes conditions that generate metabolically dormant "persister" cells, often found in nutrient-deficient zones deep within biofilms [12]. This can be achieved through longer incubation times or nutrient starvation before antibiotic challenge.
The Scientist's Toolkit: Research Reagent Solutions
| Reagent/Material | Function in Experiment | Application Example |
|---|---|---|
| Cationic Europium-Cryptate-Diamine Probe | A small-molecule probe that electrostatically binds to anionic bacterial surfaces for highly sensitive, morphology-aware quantification [76]. | Used in microtiter plate AST assays to accurately determine MICs for antibiotics that cause bacterial filamentation or swelling, where metabolic assays fail [76]. |
| Fluorescent Protein Tags (eGFP, E2-Crimson) | Genetically encoded tags for species-specific labeling and tracking within polymicrobial communities [74]. | Enables independent, real-time quantification of P. aeruginosa (eGFP) and B. cenocepacia (E2-Crimson) in a dual-species biofilm within a microtiter plate [74]. |
| Resazurin Viability Stain | A metabolic dye that is reduced by live cells from non-fluorescent resazurin to fluorescent resorufin, indicating metabolic activity [74]. | Quantifies the population of metabolically active cells in a biofilm, providing a viability count distinct from total biomass stains like crystal violet [74]. |
| Two-Chamber Flow Cell | A device with a glass coverslip for high-resolution microscopy, allowing for continuous nutrient and antibiotic supply under controlled shear stress [75]. | Used for real-time, non-destructive confocal imaging of biofilm structure development and antibiotic penetration using fluorescent probes. |
| Biologically Relevant Media Supplements | Components like serum, mucin, or defined ion compositions that make growth conditions more physiologically relevant [75]. | Adding human serum to culture media to study its impact on biofilm formation, EPS composition, and subsequent antibiotic tolerance. |
Key Experimental Protocols
Protocol: Microtiter Plate AST with Surface-Area Quantification
This protocol enables rapid (≤5-hour) phenotypic Antimicrobial Susceptibility Testing (AST) that accurately accounts for antibiotic-induced morphological changes like filamentation [76].
Workflow:
Materials:
- Cation-adjusted Mueller-Hinton Broth (CAMHB)
- Polystyrene microtiter plates
- Eu-cryptate-diamine probe
- Time-Resolved Fluorescence (TRF) microplate reader
Detailed Steps:
- Inoculation: Prepare a bacterial suspension in CAMHB equivalent to a 0.5 McFarland standard (~1.5 × 10^8 CFU/mL) and further dilute it in CAMHB to a working concentration of ~5 × 10^5 CFU/mL [76].
- Plate Setup: Dispense 100 µL of the bacterial suspension into wells of a microtiter plate containing pre-diluted antibiotics in 100 µL CAMHB. Include a growth control (bacteria, no antibiotic) and a negative control (media only).
- Incubation: Incubate the plate for 4 hours at 37°C without shaking to allow biofilm formation and antibiotic interaction.
- Probe Binding: Following incubation, add the Eu-cryptate-diamine probe directly to each well. Incubate the plate for 30 minutes at room temperature to allow the cationic probe to bind electrostatically to bacterial surfaces.
- Washing: Carefully invert the plate to discard the liquid. Gently wash the wells 2-3 times with a buffer (e.g., PBS) to remove any unbound probe, ensuring the adhered biofilm is not disrupted.
- Signal Measurement: Read the signal using a TRF-compatible microplate reader. The TRF signal is proportional to the total bacterial surface area in the well.
- MIC Determination:
- For filament-inducing antibiotics (e.g., β-lactams), the Minimum Inhibitory Concentration (MIC) is the lowest concentration where the TRF signal is ≤ 2/3 of the growth control signal.
- For protoplast/swelling-inducing antibiotics, the MIC is the lowest concentration where the signal is ≤ 1/2 of the growth control [76].
Protocol: Establishing a Dual-Species Biofilm for Quantification
This protocol details how to grow and independently quantify a dual-species biofilm in a microtiter plate using constitutively tagged bacterial strains [74].
Workflow:
Materials:
- Bacterial strains constitutively expressing different fluorescent proteins (e.g., P. aeruginosa PAO1::eGFP and B. cenocepacia with pETS248-Tc-E2Crimson) [74]
- Appropriate selective antibiotics (e.g., Gentamicin, Tetracycline)
- Tryptic Soy Broth (TSB) or other suitable media
- Fluorescence microplate reader
Detailed Steps:
- Strain Preparation: Individually grow the tagged strains overnight in TSB with the appropriate antibiotics. The following day, subculture the bacteria to mid-log phase.
- Co-inoculation: Mix the two bacterial cultures in a 1:1 ratio (or other desired ratio) in fresh TSB without antibiotics. Dispense 200 µL of the mixed culture into the wells of a sterile microtiter plate.
- Biofilm Formation: Incubate the plate statically for 24-48 hours at the optimal temperatures for both species (e.g., 37°C for P. aeruginosa, 30°C for B. cenocepacia).
- Washing: After incubation, carefully invert the plate to pour off the medium. Gently wash the wells twice with phosphate-buffered saline (PBS) to remove non-adherent planktonic cells.
- Signal Measurement: Measure the fluorescence in each well using a microplate reader. For example, measure eGFP at Ex/Em ~488/510 nm and E2-Crimson at Ex/Em ~611/646 nm.
- Quantification: Prepare standard curves of fluorescence intensity versus CFU for each strain grown and measured separately under identical conditions. Use these curves to convert the fluorescence readings from the dual-species biofilm into the proportional biomass contributed by each species [74].
Integrating Experimental Data with Computational Predictions for ADMET and Efficacy Profiling
Frequently Asked Questions (FAQs)
FAQ 1: Why is integrating experimental and computational approaches particularly important for developing antibiofilm agents? Biofilms are structured communities of microbes encased in a protective extracellular matrix, which can make them 10 to 1000 times more tolerant to antibiotics than their free-floating (planktonic) counterparts [75]. This integration is crucial because:
- Bridging Scales: Computational models can predict molecular-level interactions, such as how a compound might bind to a quorum-sensing protein, while experiments validate these predictions in a biologically relevant context [77] [78].
- Efficiency: Using in silico screening (e.g., molecular docking, ADMET prediction) to prioritize the most promising compounds from a large library saves significant time and resources before moving to more complex in vitro biofilm assays [79].
- Mechanistic Insights: Computational methods provide a hypothesized mechanism of action, such as binding affinity to a specific target, which experiments can then confirm, for example, through gene expression analysis [80].
FAQ 2: My computational docking shows a strong binding affinity for a target, but the compound shows no antibiofilm activity in vitro. What could be wrong? This discrepancy is a common challenge. The issue may lie in one or more of the following areas:
- Compound Penetration: The biofilm's extracellular polymeric substance (EPS) may be physically preventing the compound from reaching its intended target at an effective concentration [75]. Your in silico model does not account for this physical barrier.
- Biological Relevance of the Target: The chosen protein target, while docked successfully, might not be the primary regulator of biofilm formation in your specific experimental conditions. Consider validating the target's role through genetic or biochemical assays.
- Compound Stability: The compound might be degraded or modified in the culture medium before it can act, an aspect not typically considered in simple docking studies.
- Cytotoxicity: The compound could be toxic to the bacterial cells at the concentrations tested, indirectly affecting biofilm formation in a way not related to the docked target.
FAQ 3: What are the key ADMET properties I should prioritize for antibiofilm agents intended for potential therapeutic use? While specific requirements depend on the application, favorable ADMET properties generally include:
- Absorption: Good predicted intestinal absorption for oral drugs.
- Distribution: Ability to reach the site of infection (e.g., skin for wound infections, lungs for pulmonary infections).
- Metabolism: Stability against rapid metabolic degradation to maintain efficacy.
- Excretion: Appropriate clearance rate to avoid accumulation.
- Toxicity: Low predicted cytotoxicity and genotoxicity [77] [81]. Lead compounds should exhibit a good balance of strong predicted efficacy and a favorable ADMET profile to be considered for further development [77].
FAQ 4: How can I improve the physiological relevance of my initial in vitro biofilm models? Traditional static in vitro models often fail to recapitulate the host environment [75]. You can enhance your model by:
- Incorporating Fluid Flow: Using flow cells or microfluidic systems to simulate shear stress, which influences biofilm architecture and physiology.
- Using Physiologically Relevant Media: Incorporating relevant host proteins (e.g., albumin, mucin) into your culture media, as these can significantly affect compound activity and biofilm formation [75].
- Exploring Advanced Models: Consider moving towards more complex ex vivo models or organ-on-a-chip technologies that better mimic the host microenvironment for more predictive results [75].
Troubleshooting Guides
Issue 1: High False Positive Rate in Computational Screening
Problem: Your virtual screen identifies hundreds of compounds with high predicted binding affinity, but a very low number show actual efficacy in subsequent in vitro biofilm inhibition assays.
| Possible Cause | Solution |
|---|---|
| Inadequate negative data in the training set of the statistical model, leading to poor discrimination between true binders and non-binders [79]. | Employ strategies like iterative negative data design or a two-layer Support Vector Machine (SVM) approach to refine your model and reduce false positives [79]. |
| Over-reliance on docking scores alone. A good score does not guarantee bioavailability, stability, or the ability to penetrate the biofilm matrix. | Integrate multiple computational filters. Use docking as an initial screen, then apply ADMET prediction and physicochemical property filters (e.g., related to biofilm penetration) to prioritize compounds with a higher probability of in vitro success [77]. |
| The molecular docking protocol may not account for critical protein flexibility or solvation effects. | Perform more advanced simulations, such as Molecular Dynamics (MD) simulations (e.g., 100 ns trajectories), to assess the stability of the compound-target complex and account for flexible receptor docking [77]. |
Issue 2: Discrepancy Between Planktonic MIC and Biofilm Inhibition
Problem: A compound shows a high Minimum Inhibitory Concentration (MIC) against planktonic cells (indicating low potency) but still demonstrates strong biofilm inhibition at much lower concentrations.
| Possible Cause | Solution |
|---|---|
| The compound operates via an anti-virulence mechanism (e.g., quorum-sensing inhibition, interference with adhesion) rather than by killing bacteria [77]. | This is a desired outcome for some drug discovery efforts. Conduct specific assays to confirm the mechanism, such as quorum-sensing inhibition assays, gene expression analysis (e.g., qRT-PCR of virulence genes), or morphological studies using Scanning Electron Microscopy (SEM) [80] [81]. |
| Reduced metabolic activity of biofilm-embedded cells makes them less susceptible to traditional bactericidal agents [75]. | Use the Minimum Biofilm Inhibitory Concentration (MBIC) assay as your primary efficacy metric for biofilm-active compounds, rather than the standard planktonic MIC [81]. The MBIC measures the lowest concentration that prevents biofilm formation, which is often different from the MIC. |
Issue 3: Inconsistent MBIC Assay Results
Problem: High variability in biofilm biomass measurements between replicates in the microtiter plate crystal violet assay.
| Possible Cause | Solution |
|---|---|
| Inconsistent biofilm growth due to uneven inoculation, temperature fluctuations, or improper handling of plates during washing steps. | Standardize your protocol meticulously. Ensure consistent incubation time and temperature. Use a multichannel pipette for washing steps, and carefully aspirate liquid from the same corner of each well to minimize disturbance of the adherent biofilm [77] [81]. |
| Inadequate staining or destaining. | Precisely control the incubation time for crystal violet staining and acetic acid destaining. Use a fresh crystal violet solution and ensure the acetic acid concentration is accurate (commonly 30-33%) for solubilizing the bound dye [77] [81]. |
| Poor plate reader calibration or dirty optics. | Regularly clean and calibrate your microplate reader. Include appropriate controls (positive, negative, and blank wells) in every experiment to normalize the data and identify technical issues. |
Experimental Protocols & Data Presentation
This protocol is used to determine the minimum concentration of a compound that inhibits biofilm formation.
- Inoculation: Dilute an overnight culture of bacteria (e.g., Staphylococcus aureus) in a nutrient-rich broth supplemented with a carbon source (e.g., Tryptic Soy Broth with 0.1-1% sucrose). Dispense the suspension into a 96-well flat-bottom microtiter plate.
- Compound Addition: Add the test compound at a range of concentrations (e.g., two-fold serial dilutions). Include a growth control (bacteria without compound) and a sterility control (broth only).
- Biofilm Growth: Incubate the plate statically at 37°C for 24-48 hours to allow biofilm formation on the well walls.
- Washing: Carefully remove the planktonic cells by inverting the plate and gently tapping out the liquid. Wash the adherent biofilms twice with 200 µL of phosphate-buffered saline (PBS) to remove non-adherent cells.
- Staining: Air-dry the plate and stain the biofilms with 0.1% crystal violet solution (200 µL per well) for 15 minutes.
- Destaining: Wash the plate thoroughly with water to remove excess stain. Solubilize the biofilm-bound crystal violet with 200 µL of 30% acetic acid.
- Measurement: Transfer the solubilized dye to a new microtiter plate (if necessary) and measure the optical density (OD) at 570 nm. The MBIC is defined as the lowest compound concentration that shows a significant reduction in OD compared to the growth control.
Quantitative Data from Exemplary Studies
Table 1: Minimum Inhibitory Concentration (MIC) and Minimum Biofilm Inhibitory Concentration (MBIC) Profiles. This table illustrates how antimicrobial efficacy can differ dramatically between planktonic and biofilm states. Data is adapted from recent literature [77] [81].
| Compound / Extract | Target Organism | MIC (Planktonic) | MBIC (Biofilm) | Key Insight |
|---|---|---|---|---|
| CAB-15 | S. aureus | 125 µg/mL | Not Specified | Compound shows general growth inhibition at a high concentration [77]. |
| CAB-29 | S. aureus | 125 µg/mL | Not Specified | Selective anti-staphylococcal activity, no effect on E. coli or C. albicans [77]. |
| Sida acuta Extract (SAE) | S. aureus | Not Specified | 300 µg/mL | Demonstrates specific antibiofilm activity (87% inhibition) at a concentration that may not kill planktonic cells [81]. |
| Quercetin | P. gingivalis | Not Specified | 1000 µg/mL | Exhibits dose-dependent biofilm inhibition and strong binding to a virulence factor (Kgp) in silico [80]. |
Table 2: Exemplary Computational Docking and ADMET Data. This table summarizes the key in silico parameters used to characterize potential lead compounds [77] [80] [81].
| Compound | Protein Target (PDB ID) | Docking Score (kcal/mol) | Key ADMET Prediction Highlights |
|---|---|---|---|
| Campesterol (from Sida acuta) | Not Specified | -7.2 | Promising pharmacokinetic properties, suggested as a possible candidate for therapeutic development [81]. |
| Quercetin | Lysine-specific Gingipain (Kgp) (4RBM) | -7.5 | Exhibits drug-like characteristics and a favorable pharmacokinetic profile [80]. |
| Library of 29 Compounds [77] | LasR (3IX3), Sortase A | Range of scores provided | ADMET properties (Absorption, Distribution, Metabolism, Excretion, Toxicity) were computed for lead compounds to assess drug-likeness. |
Workflow Visualization
Integrated Screening Workflow
The Scientist's Toolkit: Research Reagent Solutions
Table 3: Essential Materials for Antibiofilm and Computational Research.
| Category | Item | Function / Application |
|---|---|---|
| Biofilm Assays | Crystal Violet | A dye that stains cellular material and polysaccharides in the biofilm matrix, allowing for quantitative measurement of total biomass [77] [81]. |
| 96-well Microtiter Plates | The standard platform for high-throughput biofilm cultivation and staining assays [77]. | |
| Tryptic Soy Broth (TSB) with Sucrose | A common growth medium; the addition of sucrose enhances the production of exopolysaccharides in many bacteria, promoting robust biofilm formation [81]. | |
| Computational Software | Schrödinger Glide (XP), Desmond | Software suites used for molecular docking, induced-fit docking, and molecular dynamics simulations (e.g., 100 ns trajectories) to predict binding and complex stability [77]. |
| QikProp | A tool used for predicting and analyzing ADMET properties of small molecules to assess their drug-likeness [77]. | |
| Molecular Biology | qRT-PCR Reagents | Used to quantify changes in gene expression of virulence factors (e.g., kgp in P. gingivalis) after treatment with antibiofilm compounds [80]. |
| Imaging & Analysis | Scanning Electron Microscope (SEM) | Provides high-resolution images to visually confirm structural disruption and morphological changes in biofilms after treatment [81]. |
Comparative Analysis of Mono-therapy vs. Multi-modal Therapy Efficacy in Pre-clinical Models
Technical Support & Troubleshooting Guides
FAQ: Common Experimental Challenges in Biofilm Research
Q1: My antimicrobial treatment shows high efficacy in planktonic assays but fails against the same strain in a biofilm model. What could be the cause?
A: This is a classic symptom of biofilm-associated resistance. The extracellular polymeric substance (EPS) matrix acts as a barrier, inhibiting antibiotic penetration [49] [16]. Furthermore, biofilms contain metabolically heterogeneous cells, including dormant persister cells, which are highly tolerant to antibiotics that target active cellular processes [49]. To troubleshoot:
- Verify Biofilm Maturity: Ensure your biofilm model has been established for a sufficient duration to form a mature, structured biofilm with a robust EPS matrix.
- Assess Penetration: Use fluorescently tagged antibiotics or probes with confocal microscopy to visually confirm whether your therapeutic is penetrating the biofilm matrix.
- Combine Anti-Biofilm Agents: Incorporate agents specifically designed to disrupt the biofilm matrix, such as DNase I (degrades extracellular DNA) or Dispersin B (degrades polysaccharides), prior to antibiotic application [49].
Q2: I am observing high variability in treatment outcomes between replicates in my in vivo biofilm infection model. How can I improve consistency?
A: Variability in in vivo models often stems from inconsistent biofilm establishment or host immune response differences.
- Standardize Inoculum: Pre-establish the biofilm on an implant (e.g., catheter segment) in vitro before surgical implantation to ensure a consistent bacterial load [82] [16].
- Confirm Infection Burden: Use non-invasive imaging (e.g., bioluminescence imaging if using engineered strains) or sacrifice a subset of animals pre-treatment to confirm uniform infection levels.
- Control Host Factors: Use animals of the same age, sex, and genetic background, and standardize their housing conditions to minimize immunological variation.
Q3: A potential anti-biofilm compound is effective in vitro but shows toxicity in my pre-clinical animal models. What are my options?
A: Toxicity is a major hurdle in translational research. Consider these strategies:
- Reformulate for Targeted Delivery: Investigate nanoparticle-mediated delivery systems designed to release the compound specifically at the biofilm site, reducing systemic exposure and off-target toxicity [49].
- Explore Combination at Lower Doses: Test if the compound can be used at a lower, non-toxic dose when combined with conventional antibiotics, potentially achieving synergy [82] [49].
- Evaluate Alternative Agents: Consider other emerging anti-biofilm strategies with potentially better safety profiles, such as non-toxic quorum sensing inhibitors or probiotic-based approaches [49].
Troubleshooting Guide: Experimental Workflows
Problem: No significant difference observed between mono-therapy and multi-modal therapy groups.
- Potential Cause 1: The dosage of individual agents in the combination therapy is sub-therapeutic.
- Solution: Perform a dose-ranging study for each agent alone and in combination to identify synergistic concentrations [82].
- Potential Cause 2: The timing of administration for the combination therapy is not optimized.
- Solution: Test different sequences; for example, administer a biofilm-disrupting agent first, followed by an antibiotic after a delay to allow for matrix penetration [83].
- Potential Cause 3: The biofilm model used is not sufficiently robust to demonstrate the advantage of combination therapy.
- Solution: Characterize your biofilm model's matrix composition and antibiotic tolerance level to ensure it recapitulates the resilient nature of clinical biofilms [16].
Data Presentation: Efficacy Metrics
The following table synthesizes quantitative findings relevant to therapy efficacy against resilient infections, as demonstrated in clinical correlates and pre-clinical research.
| Therapy Model / Strategy | Pathogen / Model System | Key Efficacy Outcome | Reference / Context |
|---|---|---|---|
| Vancomycin Combination Therapy (VCT) | Post-neurosurgical CNS infections (Clinical cohort) | 90% clinical cure rate | [82] |
| Single-Drug Therapy (SDT) | Post-neurosurgical CNS infections (Clinical cohort) | 76% clinical cure rate | [82] |
| Phage-Antibiotic Synergy (PAS) | Multi-drug resistant (MDR) biofilms | Enhanced antibiotic penetration and bacterial lysis | [49] |
| Electrochemical Disruption | MDR biofilms | Destabilization of the extracellular polymeric matrix | [49] |
| Hypochlorous Acid Irrigation | Chronic wound biofilms | Mechanical removal of biofilm and disruption of protein matrix | [83] |
| Nanoparticle-mediated Delivery | MDR biofilms | Improved bioavailability and targeted delivery of antimicrobials | [49] |
Table 2: Analysis of Combination Therapy Components and Functions
| Therapeutic Component | Mechanism of Action | Primary Function in Multi-modal Therapy |
|---|---|---|
| Biofilm Matrix Disruptor (e.g., DNase I, Dispersin B) | Degrades structural components (eDNA, polysaccharides) of the EPS. | Breaches the physical barrier, allowing subsequent antimicrobials to penetrate. |
| Quorum Sensing Inhibitor | Interferes with bacterial communication, suppressing virulence and matrix production. | Attenuates biofilm formation and resilience without directly killing bacteria. |
| Conventional Antibiotic | Targets essential bacterial processes (e.g., cell wall synthesis, protein synthesis). | Eradicates susceptible bacteria that have been exposed by disruptors. |
| Antimicrobial Peptide (AMP) | Disrupts bacterial membranes and can target intracellular processes. | Kills persistent cells and is less susceptible to traditional resistance mechanisms. |
Experimental Protocols
Protocol: Pre-clinical Evaluation of Anti-biofilm Therapies in a Chronic Wound Model
Objective: To compare the efficacy of a standard antibiotic mono-therapy versus a multi-modal therapy in eradicating a methicillin-resistant Staphylococcus aureus (MRSA) biofilm in a murine wound model.
Materials:
- Animals: Specific pathogen-free mice (e.g., C57BL/6)
- Bacterial Strain: MRSA USA300 strain, optionally expressing luciferase for imaging.
- Therapeutics:
- Mono-therapy: Vancomycin (or a relevant antibiotic based on AST).
- Multi-modal therapy: Vancomycin + a matrix-disrupting agent (e.g., DNase I) + a topical hypochlorous acid solution (e.g., PureCleanse) [83].
- Equipment: IVIS Imaging System (if using bioluminescent strain), surgical tools, homogenizer.
Methodology:
- Wound Creation and Infection: Anesthetize mice and create a full-thickness excisional wound on the dorsal skin. Inoculate the wound with a standardized suspension of MRSA (e.g., 1x10^7 CFU) and cover with a transparent dressing.
- Biofilm Establishment: Allow the infection to progress for 48-72 hours to establish a mature biofilm. Confirm establishment via bioluminescent imaging or by sacrificing a subset of animals and quantifying adherent bacteria.
- Treatment Administration:
- Group 1 (Control): Receive vehicle/diluent only.
- Group 2 (Mono-therapy): Receive systemic vancomycin.
- Group 3 (Multi-modal): Receive:
- Treat animals for 5-7 days.
- Outcome Assessment:
- Bacterial Burden: Euthanize animals, excise the entire wound, homogenize, and plate serial dilutions for CFU enumeration.
- Biofilm Visualization: Process wound tissue for histological analysis (e.g., Gram stain, SEM) or confocal microscopy to visualize biofilm structure.
- Wound Healing: Measure wound closure area over time.
Protocol: In Vitro Assessment of Biofilm Penetration
Objective: To visually confirm the enhanced penetration of an antimicrobial agent when used in a multi-modal regimen.
Materials:
- Biofilm Model: 96-well plate or flow cell with established Pseudomonas aeruginosa or MRSA biofilm.
- Therapeutics: Fluorescently tagged antibiotic (e.g., vancomycin-FL), DNase I.
- Equipment: Confocal Laser Scanning Microscope (CLSM).
Methodology:
- Treatment:
- Group A: Treat biofilm with fluorescent vancomycin alone.
- Group B: Pre-treat biofilm with DNase I for 1 hour, then add fluorescent vancomycin.
- Imaging: After incubation, carefully wash the biofilm to remove non-associated antibiotic. Image using CLSM to create Z-stacks through the entire biofilm depth.
- Analysis: Compare the fluorescence intensity and distribution depth of the tagged antibiotic between the two groups. Multi-modal therapy (Group B) should show significantly deeper and more uniform penetration [49].
Mandatory Visualization
Biofilm Therapy Workflow
Mono vs Multi-modal Logic
The Scientist's Toolkit: Research Reagent Solutions
Table 3: Essential Materials for Biofilm Penetration Research
| Item | Function in Research | Specific Application Example |
|---|---|---|
| DNase I | Degrades extracellular DNA (eDNA), a major structural component of the biofilm matrix. | Weaken biofilm structure to enhance antibiotic penetration in combination therapy studies [49]. |
| Dispersin B | An enzyme that hydrolyzes poly-N-acetylglucosamine (PNAG), a key polysaccharide in staphylococcal biofilms. | Used to specifically target and disperse biofilms formed by S. aureus and other PNAG-producing species [49]. |
| Hypochlorous Acid (HOCl) Solution | A potent oxidizing agent that mechanically removes biofilms and disrupts the protein matrix. | Applied in wound models for physical debridement and as a first step in multi-modal treatment [83]. |
| Cationic Antimicrobial Peptides (AMPs) | Synthetic or natural peptides that disrupt bacterial membranes and can target dormant cells. | Investigated for their ability to kill persister cells within biofilms that are tolerant to conventional antibiotics [49]. |
| Fluorescently Tagged Antibiotics | Allow for visualization and quantification of antibiotic distribution within a biofilm. | Used in confocal microscopy protocols to directly assess and compare penetration depth of therapies [49]. |
| Bacteriophages | Viruses that infect and lyse specific bacteria, often capable of penetrating biofilms. | Employed in Phage-Antibiotic Synergy (PAS) strategies to lyse biofilm structures and sensitize bacteria [49]. |
Organoids are three-dimensional (3D) tissue analogues derived from adult stem cells or pluripotent stem cells through in vitro 3D culture. They are not composed of a single cell type but instead originate from stem cells with progenitor properties that undergo proliferation and differentiation, self-assembling into multicellular structures that mimic the morphology, structure, and function of their corresponding in vivo organs [84]. In the context of infectious disease research, particularly concerning bacterial biofilms, organoid technology provides a powerful platform to study host-pathogen interactions and test antimicrobial efficacy against biofilm-associated infections.
Biofilms are groups of microorganisms that stick together and form a protective extracellular polymeric substance (EPS) matrix, making them extremely difficult to eliminate with standard antibiotics [19]. These biofilms demonstrate major physiological changes compared to their planktonic counterparts and are associated with many different types of infections which can have severe impacts on patients [3]. The minimum inhibitory concentration (MIC) for a biofilm can be between 100-800 times greater than the MIC for planktonic cells, creating significant challenges for treatment [12].
The integration of organoid models into biofilm research represents a cutting-edge approach to bridging the translational gap between in vitro studies and clinical applications. These models enable researchers to investigate antibiotic penetration through biofilm barriers in a more physiologically relevant context that better mimics human tissues and organs.
Troubleshooting Guides for Organoid-Biofilm Experiments
Common Challenges and Solutions in Organoid Culture
Table 1: Troubleshooting Guide for Organoid Experiments in Biofilm Research
| Problem | Possible Cause | Solution |
|---|---|---|
| Low viability of organoids | Cryopreservation damage; Limited nutrient diffusion | Cryopreserve at passage 2-5 (P2-P5); Maintain size under 500μm [84] |
| Contamination in clinical samples | Non-sterile collection; Tissue exposure | Soak tissues in PBS with 3-5% antibiotics for 5-10 min; Add 1% antibiotics to all reagents [84] |
| Fibroblast overgrowth | Contamination with non-target cells | Use repeated pre-plating; Apply fibroblast depletion kits [84] |
| Black particles/debris in culture | Cellular fragments or debris | Digest organoids into single cells and wash; Flush interior with culture medium [84] |
| Insufficient tumor organoid yield | Small starting tissue material | Limit passaging to 2-3 generations (max 5); Use 384-well plates or microfluidic devices to reduce assay volume [84] |
| Abnormal growth patterns | Contamination by fast-growing cells; Medium composition changes | Perform histological staining; Check for genetic mutations via sequencing [84] |
| Inconsistent drug response | Loss of 3D architecture | Maintain Matrigel embedding during drug testing; Preserve structural integrity [84] |
Biofilm-Related Experimental Challenges
Table 2: Biofilm-Specific Experimental Challenges and Solutions
| Challenge | Impact on Research | Recommended Solutions |
|---|---|---|
| Biofilm matrix barrier | Reduces antibiotic penetration by 100-800x MIC [12] | Use matrix-disrupting enzymes (glycoside hydrolases, DNase); Combine with conventional antibiotics [3] [19] |
| Metabolic heterogeneity | Creates persister cells and antibiotic tolerance [12] | Target nutrient-deficient zones; Use combination therapies |
| Limited drug diffusion | Traps antibiotics in extracellular matrix [12] | Employ efflux pump inhibitors; Increase drug concentration duration |
| Polymicrobial biofilms | Enhanced resistance through interspecies cooperation [3] | Develop broad-spectrum approaches; Target shared virulence factors |
| Biofilm detection difficulties | Delayed diagnosis and treatment [19] | Implement advanced diagnostics (biosensors, molecular methods); Use early detection protocols |
Frequently Asked Questions (FAQs)
Organoid Culture Fundamentals
Q: What are the optimal size limits for organoids in biofilm penetration studies? A: Organoids should ideally be maintained under 500 μm in diameter as they lack vascular and fluid circulation systems. In larger organoids, cells in the core are deprived of sufficient oxygen and nutrients due to limited diffusion, leading to increased cell death in the central regions [84].
Q: Can cryopreserved tissues be used for organoid culture in biofilm research? A: Cryopreservation is generally not recommended due to significant viability loss. However, if tissues are stored at -80°C, the optimal window for organoid culture is within 6 weeks. For tissues preserved in liquid nitrogen, longer storage is possible, but culturing within 6 months is advised for best results [84].
Q: How much tumor tissue is required for tumor organoid culture in drug penetration studies? A: For surgical specimens, tumor tissue should be larger than 2-3 peas. For core needle biopsies, at least 2-3 biopsy cores are recommended. For endoscopic biopsies, a minimum of 6 tissue fragments should be collected [84].
Q: What are the passage limits for organoids in long-term biofilm studies? A: Most organoids can be passaged up to 10 times (>6 months) in vitro. Culture medium formulation plays a role—conditioned media often support longer-term expansion than fully defined synthetic media. However, due to potential phenotypic drift during passaging, extensive expansion is not recommended, with literature suggesting limiting passaging to 2-3 generations (maximum 5) [84].
Biofilm-Specific Methodological Questions
Q: What are the key mechanisms of antimicrobial resistance in biofilms that organoid models can help study? A: Organoid models can help investigate multiple resistance mechanisms including: (1) restricted antibiotic penetration due to EPS matrix, (2) metabolic heterogeneity creating dormant persister cells, (3) efflux pump upregulation, (4) genetic adaptations via horizontal gene transfer, and (5) quorum sensing-mediated resistance regulation [3] [12] [19].
Q: How can we enhance antibiotic penetration through biofilm matrices in organoid models? A: Promising strategies include: (1) using EPS-degrading enzymes (DNases, glycoside hydrolases), (2) efflux pump inhibitors, (3) quorum sensing inhibitors, (4) nanoparticle-based drug delivery systems, and (5) combination therapies that disrupt matrix integrity [11] [19].
Q: What are the advantages of organoid models over traditional 2D models for biofilm research? A: Organoids provide: (1) 3D architecture that mimics in vivo tissue organization, (2) better representation of cellular heterogeneity, (3) physiologically relevant cell-cell and cell-matrix interactions, (4) more accurate drug penetration barriers, and (5) improved prediction of clinical responses [85] [86].
Q: How can we simulate immune responses to biofilms in organoid models? A: Advanced co-culture systems allow integration of immune components through: (1) innate immune microenvironment models that retain native immune cells, (2) reconstituted immune microenvironment models adding specific immune cell types, and (3) microfluidic systems that enable controlled immune cell recruitment and interaction studies [86].
Key Signaling Pathways and Workflows
Organoid Development Signaling Pathways
Biofilm Development and Antibiotic Resistance Workflow
Research Reagent Solutions for Organoid-Biofilm Studies
Table 3: Essential Research Reagents for Organoid-Biofilm Experiments
| Reagent Category | Specific Examples | Function in Research | Application Notes |
|---|---|---|---|
| Extracellular Matrices | Matrigel, synthetic hydrogels, dECM, recombinant protein-based gels [84] | Provides 3D scaffold for organoid growth and biofilm formation | Matrigel shows batch variability; synthetic alternatives improve reproducibility |
| Stem Cell Maintenance | Y27632 (ROCK inhibitor), B27, N2 supplements [84] [86] | Supports pluripotency and viability of stem cell-derived organoids | Essential for long-term organoid culture and expansion |
| Differentiation Factors | Wnt3a, Noggin, FGF-4, Activin A, HGF [84] [86] | Directs lineage-specific differentiation of organoids | Tissue-specific combinations required for different organoid types |
| Biofilm Disruption Agents | DNase, glycoside hydrolases, quorum sensing inhibitors [3] [19] | Degrades EPS matrix to enhance antibiotic penetration | Often used in combination with conventional antibiotics |
| Antibiotic Testing | Tobramycin, vancomycin, rifampicin [3] [12] | Evaluates efficacy against biofilm-protected bacteria | MIC for biofilms typically 100-800x higher than for planktonic cells |
| Detection and Viability | Calcein-AM, ATP-based assays, crystal violet [84] [87] | Quantifies viable cells and biofilm biomass | Calcein-AM stains live organoids; ATP assays measure metabolic activity |
Advanced Experimental Protocols
Organoid-Biofilm Co-culture Protocol for Antibiotic Penetration Studies
Materials Required:
- Matrigel or synthetic hydrogel matrix
- Organoid culture medium with appropriate growth factors
- Bacterial strain of interest (e.g., Pseudomonas aeruginosa, Staphylococcus aureus)
- Antibiotics for testing
- Cell culture plates (24-well or 96-well format)
- Calcein-AM for viability staining
Procedure:
- Organoid Preparation: Harvest and dissociate organoids to approximately 100-200 μm fragments using enzymatic digestion [84].
- Matrix Embedding: Resuspend organoids in Matrigel (50% v/v) and plate in pre-warmed culture plates. Solidify at 37°C for 20-30 minutes.
- Biofilm Establishment: Add bacterial suspension (10^6-10^7 CFU/mL) to organoid cultures and incubate for 24-48 hours to allow biofilm formation.
- Antibiotic Treatment: Apply test antibiotics at clinically relevant concentrations, including concentrations 100-800x MIC for planktonic cells [12].
- Viability Assessment: After treatment period (typically 24-72 hours), assess organoid and bacterial viability using:
- Calcein-AM staining for viable organoids (0.2 μmol/L, 37°C for 60 min)
- ATP-based assays for metabolic activity
- Colony forming unit counts for bacterial viability
- Penetration Analysis: Use fluorescently-labeled antibiotics or analytical methods (HPLC, MS) to quantify antibiotic penetration through biofilm matrix.
Troubleshooting Notes:
- For thick biofilms, consider pre-treatment with matrix-disrupting enzymes (DNase, glycoside hydrolases) to enhance antibiotic penetration [3].
- Include controls for organoid-only and biofilm-only conditions to distinguish cell-type-specific effects.
- Maintain appropriate size control (<500 μm) to prevent central necrosis in organoids [84].
Microfluidic Organoid-Biofilm Model Setup
Advanced Workflow Diagram:
This system enables real-time monitoring of biofilm-organoid interactions and antibiotic penetration under flow conditions that better mimic in vivo environments [86] [87]. The constant nutrient flow prevents stagnation and supports more physiological responses in both organoids and biofilms.
The integration of organoid models with biofilm research represents a promising frontier in overcoming the challenge of antibiotic penetration through biofilm matrices. By providing more physiologically relevant experimental systems, these advanced models bridge the critical gap between traditional in vitro studies and clinical applications. The troubleshooting guides and FAQs presented here address common practical challenges researchers face when implementing these complex models.
Future developments in this field will likely focus on enhancing model complexity through the incorporation of immune components, vascularization, and multi-tissue interfaces. Additionally, technological advancements in microfluidics, real-time imaging, and high-throughput screening will further improve the predictive power of organoid-biofilm platforms. As these models continue to evolve, they hold significant potential for accelerating the development of effective therapies against biofilm-associated infections that remain a major clinical challenge.
Conclusion
Overcoming the biofilm matrix barrier necessitates a paradigm shift from conventional antibiotic development to innovative, multidisciplinary strategies. The key takeaway is that no single approach is sufficient; success lies in synergistic, multi-stage interventions that sequentially disrupt the matrix, penetrate the core, and eradicate dormant cells. Future directions must focus on refining combinatorial therapies that integrate enzymatic disruptors, nanoparticle carriers, and physical methods, guided by AI and robust, biologically relevant validation models. Ultimately, translating these advanced strategies from the lab to the clinic is imperative to effectively treat chronic infections and mitigate the global crisis of antimicrobial resistance.
References
- 1. The EPS Matrix: The “House of Biofilm Cells” - PMC [https://pmc.ncbi.nlm.nih.gov/articles/PMC2168682/]
- 2. Extracellular polymeric substance [https://en.wikipedia.org/wiki/Extracellular_polymeric_substance]
- 3. Mechanisms of antimicrobial resistance in biofilms [https://www.nature.com/articles/s44259-024-00046-3]
- 4. The extracellular matrix protects Pseudomonas aeruginosa ... [https://pmc.ncbi.nlm.nih.gov/articles/PMC4045617/]
- 5. Strategies for combating antibiotic resistance in bacterial ... [https://www.frontiersin.org/journals/cellular-and-infection-microbiology/articles/10.3389/fcimb.2024.1352273/full]
- 6. Penetration barrier contributes to bacterial biofilm- ... [https://pubmed.ncbi.nlm.nih.gov/27402781/]
- 7. PLOS Pathogens - Research journals [https://journals.plos.org/plospathogens/article?id=10.1371/journal.ppat.1002623]
- 8. Accurate quantitation of antibiotic penetration through ... [https://www.sciencedirect.com/science/article/pii/S2590207525000644]
- 9. Constituent of extracellular polymeric substances (EPS ... [https://bmcmicrobiol.biomedcentral.com/articles/10.1186/s12866-025-04034-z]
- 10. Pf bacteriophages hinder sputum antibiotic diffusion via ... [https://pmc.ncbi.nlm.nih.gov/articles/PMC11141622/]
- 11. Strategies for combating bacterial biofilms: A focus on anti ... [https://pmc.ncbi.nlm.nih.gov/articles/PMC5955472/]
- 12. Strategies for combating antibiotic resistance in bacterial ... [https://pmc.ncbi.nlm.nih.gov/articles/PMC10846525/]
- 13. The Role of Bacterial Biofilms in Antimicrobial Resistance [https://asm.org/articles/2023/march/the-role-of-bacterial-biofilms-in-antimicrobial-re]
- 14. overcoming biofilm barriers to combat chronic infections [https://pubmed.ncbi.nlm.nih.gov/40597263/]
- 15. A novel tetrahedral framework nucleic acid-based antibiotic ... [https://jnanobiotechnology.biomedcentral.com/articles/10.1186/s12951-025-03553-1]
- 16. Biofilms: structure, resistance mechanism, emerging control ... [https://pubs.rsc.org/en/content/articlehtml/2025/pm/d5pm00094g]
- 17. Metabolic aspects of bacterial persisters - PMC [https://pmc.ncbi.nlm.nih.gov/articles/PMC4205924/]
- 18. Biofilms: Understanding the structure and contribution ... [https://www.sciencedirect.com/science/article/pii/S2590097823000095]
- 19. Biofilm Resilience: Molecular Mechanisms Driving Antibiotic ... [https://pmc.ncbi.nlm.nih.gov/articles/PMC11852148/]
- 20. Horizontal Gene Transfer of Antibiotic Resistance Genes in ... [https://pmc.ncbi.nlm.nih.gov/articles/PMC9952180/]
- 21. Biofilms as Promoters of Bacterial Antibiotic Resistance ... [https://www.mdpi.com/2079-6382/10/1/3]
- 22. Biofilms preserve the transmissibility of a multi-drug ... [https://www.nature.com/articles/s41522-022-00357-1]
- 23. Antibiotics versus biofilm: an emerging battleground in ... [https://aricjournal.biomedcentral.com/articles/10.1186/s13756-019-0533-3]
- 24. Innovative Strategies to Overcome Biofilm Resistance - PMC [https://pmc.ncbi.nlm.nih.gov/articles/PMC3591221/]
- 25. Extracellular matrix-degrading enzymes as a biofilm control ... [https://pmc.ncbi.nlm.nih.gov/articles/PMC10533455/]
- 26. Strategy to combat biofilms: a focus on biofilm dispersal ... [https://www.nature.com/articles/s41522-023-00427-y]
- 27. Innovative Strategies Toward the Disassembly of the EPS ... [https://www.frontiersin.org/journals/microbiology/articles/10.3389/fmicb.2020.00952/full]
- 28. Aggregatibacter actinomycetemcomitans Dispersin B [https://pmc.ncbi.nlm.nih.gov/articles/PMC11357414/]
- 29. Dispersin B [https://en.wikipedia.org/wiki/Dispersin_B]
- 30. Microbial enzymes as powerful natural anti-biofilm candidates [https://pmc.ncbi.nlm.nih.gov/articles/PMC11664836/]
- 31. Microbial enzymes as powerful natural anti-biofilm candidates [https://microbialcellfactories.biomedcentral.com/articles/10.1186/s12934-024-02610-y]
- 32. Efficacy and safety of biofilm dispersal by glycoside ... [https://www.sciencedirect.com/science/article/pii/S2590207521000198]
- 33. Expression of Biofilm-Degrading Enzymes in Plants and ... [https://www.frontiersin.org/journals/bioengineering-and-biotechnology/articles/10.3389/fbioe.2021.708150/full]
- 34. Nanoparticles targeting biofilms: A new era in combating ... [https://www.sciencedirect.com/science/article/pii/S2590097825000370]
- 35. Nanomaterial-Based Strategies to Combat Antibiotic Resistance [https://pmc.ncbi.nlm.nih.gov/articles/PMC11852044/]
- 36. Advancing Nanotechnology: Targeting Biofilm-Forming ... [https://pmc.ncbi.nlm.nih.gov/articles/PMC11876546/]
- 37. Anti-bacterial activity of graphene oxide as a new weapon ... [https://www.sciencedirect.com/science/article/abs/pii/S0928493116308268]
- 38. Common Pitfalls in Nanotechnology: Lessons Learned ... [https://pmc.ncbi.nlm.nih.gov/articles/PMC3499664/]
- 39. Comparing Analytical Techniques for Nanoparticle ... [https://www.nanoimagingservices.com/about/blog/visualizing-nanomedicines-understanding-your-nanoparticle-formulations]
- 40. Ultrasonic strategies for mitigating microbial adhesion and ... [https://www.frontiersin.org/journals/microbiology/articles/10.3389/fmicb.2025.1558035/full]
- 41. Promising Therapeutic Strategies Against Microbial Biofilm ... [https://www.frontiersin.org/journals/cellular-and-infection-microbiology/articles/10.3389/fcimb.2020.00359/full]
- 42. Repurposing antimicrobials with ultrasound-triggered ... [https://pmc.ncbi.nlm.nih.gov/articles/PMC11962098/]
- 43. Microbial biofilm monitoring by electrochemical ... [https://www.sciencedirect.com/science/article/abs/pii/S0165993620303630]
- 44. Electrochemical Control of Biofilm Formation and ... [https://www.mdpi.com/2076-3417/12/13/6320]
- 45. Quorum sensing systems in biofilm formation and the ... [https://www.sciencedirect.com/science/article/abs/pii/S0963996925019611]
- 46. Mechanisms of Inhibition of Quorum Sensing as an ... [https://pmc.ncbi.nlm.nih.gov/articles/PMC9143355/]
- 47. Efficacy of phage therapy in controlling staphylococcal biofilms [https://pmc.ncbi.nlm.nih.gov/articles/PMC12239385/]
- 48. Phage Therapy: A Different Approach to Fight Bacterial ... [https://pmc.ncbi.nlm.nih.gov/articles/PMC9550173/]
- 49. Biofilms and multidrug resistance: an emerging crisis and the ... [https://pmc.ncbi.nlm.nih.gov/articles/PMC12237878/]
- 50. Natural product-based inhibitors of quorum sensing: A novel ... [https://pmc.ncbi.nlm.nih.gov/articles/PMC12242448/]
- 51. Recent Nanotechnologies to Overcome the Bacterial ... [https://pubmed.ncbi.nlm.nih.gov/36470671/]
- 52. Microbial biofilm: formation, architecture, antibiotic resistance ... [https://pmc.ncbi.nlm.nih.gov/articles/PMC8578483/]
- 53. Biofilm Image Gallery: Explore Biofilm Visuals | NBIC [https://biofilms.ac.uk/biofilm-image-gallery/]
- 54. An Overview of Biological and Computational Methods for ... [https://pmc.ncbi.nlm.nih.gov/articles/PMC8076610/]
- 55. Identification of potential anti-biofilm agents targeting LasR ... [https://www.nature.com/articles/s41598-025-29151-7]
- 56. Anti-Biofilm: Machine Learning Assisted Prediction of IC50 ... [https://www.sciencedirect.com/science/article/abs/pii/S0022283623001821]
- 57. Recent Strategies to Combat Biofilms Using Antimicrobial ... [https://pmc.ncbi.nlm.nih.gov/articles/PMC8955104/]
- 58. Natural Anti-biofilm Agents: Strategies to Control ... [https://www.frontiersin.org/journals/microbiology/articles/10.3389/fmicb.2020.566325/full]
- 59. Integration of Machine Learning and Structural Analysis for ... [https://brieflands.com/journals/ijpr/articles/138704]
- 60. PA-Win2: In Silico-Based Discovery of a Novel Peptide with ... [https://www.mdpi.com/2079-6382/13/12/1113]
- 61. Prediction of Biofilm Inhibiting Peptides: An In silico Approach [https://www.frontiersin.org/journals/microbiology/articles/10.3389/fmicb.2016.00949/full]
- 62. Combination Therapies for Biofilm Inhibition and Eradication [https://pmc.ncbi.nlm.nih.gov/articles/PMC8915430/]
- 63. integrating CRISPR/Cas9 and nanoparticles against biofilm ... [https://pmc.ncbi.nlm.nih.gov/articles/PMC12366227/]
- 64. Nanomaterial-enabled anti-biofilm strategies - RSC Publishing [https://pubs.rsc.org/en/content/articlehtml/2025/nr/d4nr04774e]
- 65. Recent advances in nanotechnology for eradicating bacterial ... [https://pmc.ncbi.nlm.nih.gov/articles/PMC8899562/]
- 66. When nanoparticles meet biofilms—interactions guiding ... [https://www.frontiersin.org/journals/microbiology/articles/10.3389/fmicb.2015.00591/full]
- 67. Biofilms as Promoters of Bacterial Antibiotic Resistance ... [https://pmc.ncbi.nlm.nih.gov/articles/PMC7822488/]
- 68. A Guideline for Assessment and Characterization of ... [https://pmc.ncbi.nlm.nih.gov/articles/PMC10632153/]
- 69. Regulation of overexpressed efflux pump encoding genes ... [https://pmc.ncbi.nlm.nih.gov/articles/PMC10851603/]
- 70. Role of bacterial efflux pumps in antibiotic resistance ... [https://pmc.ncbi.nlm.nih.gov/articles/PMC10268834/]
- 71. Evaluating the ciprofloxacin potentiation efficacy of ... [https://www.nature.com/articles/s41598-025-24167-5]
- 72. Efflux-linked accelerated evolution of antibiotic resistance ... [https://www.sciencedirect.com/science/article/pii/S1097276522010243]
- 73. Efflux pump-mediated resistance to new beta lactam ... [https://www.nature.com/articles/s43856-024-00591-y]
- 74. A High-Throughput Microtiter Plate Screening Assay to ... [https://pmc.ncbi.nlm.nih.gov/articles/PMC10536743/]
- 75. In vitro and ex vivo systems at the forefront of infection ... [https://pmc.ncbi.nlm.nih.gov/articles/PMC7172914/]
- 76. Microplate-based surface area assay for rapid phenotypic ... [https://www.nature.com/articles/s41598-018-35916-0]
- 77. Integrative experimental and computational dataset for ... [https://pmc.ncbi.nlm.nih.gov/articles/PMC12446609/]
- 78. Combining Experimental Data and Computational Methods for ... [https://pmc.ncbi.nlm.nih.gov/articles/PMC7594097/]
- 79. Integrating Statistical Predictions and Experimental ... [https://journals.plos.org/ploscompbiol/article?id=10.1371/journal.pcbi.1000397]
- 80. Validation through in vitro assays, molecular docking, and ... [https://www.sciencedirect.com/science/article/pii/S1572100025008038]
- 81. Antibacterial, antibiofilm efficacy and molecular docking ... [https://link.springer.com/article/10.1007/s42452-024-06305-2]
- 82. a retrospective cohort study - PMC - PubMed Central [https://pmc.ncbi.nlm.nih.gov/articles/PMC12046949/]
- 83. Answering 4 Big Questions on Biofilms - Biomiq [https://biomiq.health/blogs/blog/answering-4-big-questions-on-biofilms?srsltid=AfmBOooHpvF86H8KunCC8js-u1R4rCjVJmWNaj62ddzBVq4XvO3gzEmQ]
- 84. Organoid Experiments: 40 FAQs You Need to Know - Yeasen [https://www.yeasenbio.com/blogs/organoid/organoid-experiments-40-faqs-you-need-to-know]
- 85. Trends and challenges in organoid modeling and expansion ... [https://pmc.ncbi.nlm.nih.gov/articles/PMC11608026/]
- 86. Breakthroughs and challenges of organoid models for ... [https://www.nature.com/articles/s41420-025-02505-w]
- 87. How to study biofilms: technological advancements in ... [https://www.frontiersin.org/journals/cellular-and-infection-microbiology/articles/10.3389/fcimb.2023.1335389/full]