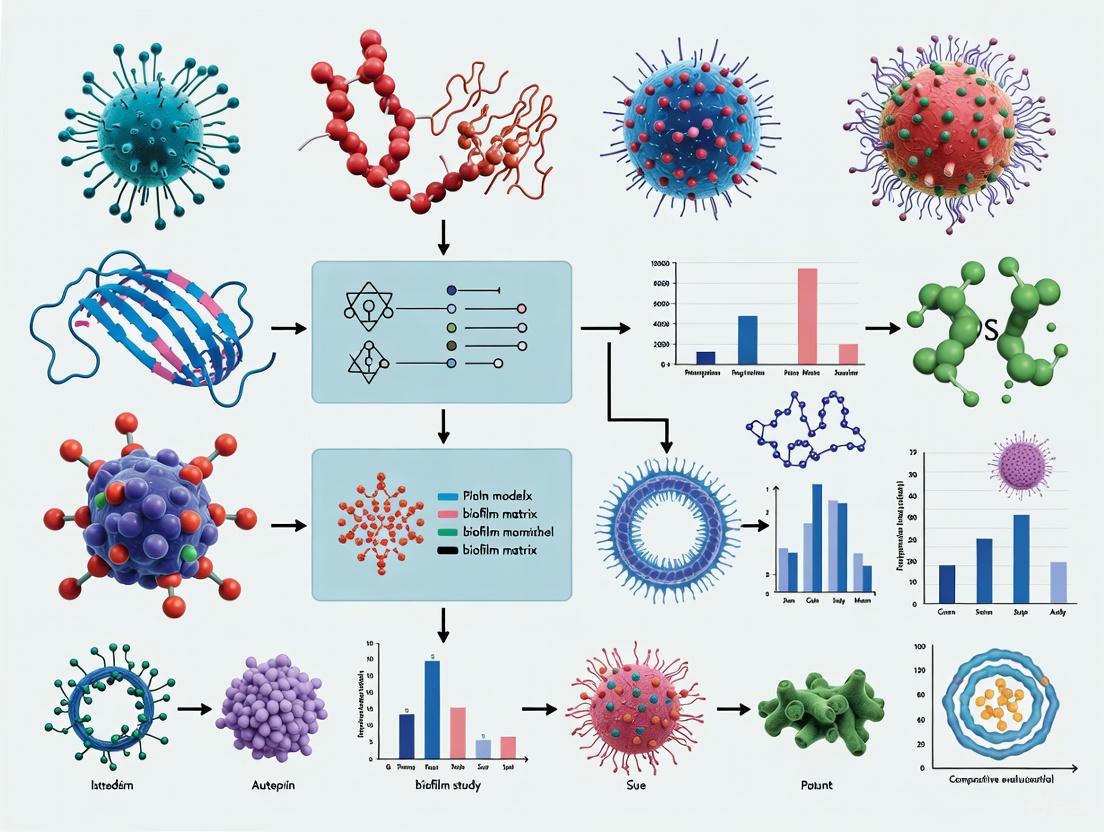
Comparative Evaluation of Biofilm Research Models: From Foundational Concepts to Translational Applications
This article provides a comprehensive comparative evaluation of contemporary biofilm matrix research models, addressing the critical needs of researchers, scientists, and drug development professionals.
Comparative Evaluation of Biofilm Research Models: From Foundational Concepts to Translational Applications
Abstract
This article provides a comprehensive comparative evaluation of contemporary biofilm matrix research models, addressing the critical needs of researchers, scientists, and drug development professionals. It systematically explores foundational biofilm architecture and formation mechanisms, examines diverse methodological approaches from simple phenotypic assays to complex computational models, troubleshoots common translational challenges in bridging laboratory findings with clinical and industrial applications, and validates methods through direct performance comparisons across recent studies. By synthesizing current evidence and emerging trends, this review serves as a strategic guide for selecting appropriate biofilm models based on research objectives, ultimately aiming to enhance the predictive validity and translational impact of biofilm research across biomedical and clinical contexts.
Understanding Biofilm Matrix Architecture and Developmental Biology
Biofilms are structured communities of microbial cells enclosed in a self-produced extracellular polymeric substance (EPS) matrix and adherent to either biotic or abiotic surfaces [1]. This matrix is not merely a physical scaffold; it is a dynamic, functional component of the biofilm that determines the immediate conditions of life for the embedded cells [2]. The EPS matrix accounts for over 90% of the biofilm dry mass, with microbial cells constituting less than 10% [3] [1]. This matrix provides critical protection against environmental stresses, including antimicrobial agents, pH fluctuations, and desiccation [4] [1].
The biofilm matrix is a complex assemblage of biopolymers, primarily consisting of exopolysaccharides, proteins, and extracellular DNA (eDNA), along with lipids, RNA, and other biomolecules [3] [5] [4]. The relative abundance and composition of these components vary significantly depending on the microbial species, environmental conditions, biofilm age, and growth substrate [3] [4]. This variable composition directly influences the structural integrity, mechanical stability, and functional properties of biofilms, making understanding the matrix crucial for both combating harmful biofilms and harnessing beneficial ones [3].
This review provides a comparative evaluation of the major biofilm matrix components, supported by experimental data from current research models. We objectively analyze the distinct roles of exopolysaccharides, proteins, and eDNA, present quantitative data on their contributions, and detail the methodological approaches used in their study.
Comparative Analysis of Major Matrix Components
The extracellular polymeric substance matrix forms the architectural foundation of biofilms. The composition and interactions between its primary components dictate the physico-chemical properties of the biofilm community. The table below provides a systematic comparison of these core constituents.
Table 1: Comparative Analysis of Major Biofilm Matrix Components
| Matrix Component | Primary Functions | Representative Examples | Experimental Disruption Methods | Impact on Mechanical Properties |
|---|---|---|---|---|
| Exopolysaccharides | Structural scaffolding, cell-cell adhesion, water retention, protection from desiccation [4] [1] | PIA/PNAG (S. aureus, S. epidermidis), Alginate, Pel, Psl (P. aeruginosa), Cellulose [6] [1] | Periodic acid, Dispersin B [3] | Confers rigidity and structural integrity; degradation leads to biofilm collapse [3] |
| Proteins | Enzymatic activity, structural support, cell-surface adhesion, virulence [4] [1] | Extracellular enzymes, amyloid fibrils (curli), surface adhesins (MSCRAMMs) [6] [2] [1] | Proteinase K, Trypsin [3] | Enhances stability and adhesion; protease treatment reduces cohesion and adhesion [3] |
| Extracellular DNA (eDNA) | Structural integrity, cell-cell connectivity, cation chelation, genetic information exchange [5] [7] [2] | Genomic DNA (often fragmented), plasmid DNA [5] | DNase I [3] [5] [7] | Critical for cohesion and stability; DNase treatment disrupts biofilm architecture and reduces strength [3] [7] |
| Other Components | Cross-linking, matrix stabilization [3] | Divalent cations (Ca²⁺, Mg²⁺), lipids, membrane vesicles [3] [2] | Chelating agents (e.g., EDTA) [3] | Strengthens matrix via ion bridging; chelation reduces mechanical stability [3] |
Exopolysaccharides: The Structural Framework
Exopolysaccharides are fundamental to the initial establishment and three-dimensional architecture of biofilms. They can be homopolysaccharides (like cellulose) or heteropolysaccharides (like alginate) and may carry positive or negative charges that influence their physical properties and interactions [1]. For instance, the poly-β(1-6)-N-acetylglucosamine (PNAG/PIA) in Staphylococcus biofilms is polycationic and crucial for intercellular adhesion [6] [1]. In Pseudomonas aeruginosa, the polysaccharides Pel and Psl are essential for maintaining biofilm structure and cellular adhesion [1]. The experimental disruption of these components, using agents like Dispersin B which degrades PNAG, leads to significant biofilm dissolution, confirming their foundational role [3].
Proteins: Functional and Structural Multitaskers
Proteins within the EPS matrix serve diverse roles, from structural support to enzymatic activity. Structural proteins, such as the amyloid-like curli fibers in E. coli and other bacteria, significantly contribute to biofilm strength and stability [2]. Extracellular enzymes retained in the matrix act as an "external digestive system," breaking down complex polymers for nutrient acquisition [1]. Furthermore, surface proteins like microbial surface components recognizing adhesive matrix molecules (MSCRAMMs) in S. aureus facilitate attachment to host tissues and abiotic surfaces [6]. Treatment with proteases such as proteinase K and trypsin has been demonstrated to weaken biofilm cohesive strength, underscoring the protein's role in matrix stability [3].
Extracellular DNA (eDNA): The Underestimated Scaffold
The critical role of eDNA in biofilm structure has been increasingly recognized. Initially considered a mere remnant of lysed cells, eDNA is now established as a crucial structural component [5] [2]. In P. aeruginosa and Clostridioides difficile biofilms, eDNA forms filamentous, grid-like networks that connect bacterial cells and provide architectural integrity [7] [2]. The source of eDNA is often genomic DNA released through cell lysis, though it can undergo fragmentation or other modifications that alter its functional properties compared to intracellular DNA [5]. The degradation of eDNA with DNase I is a highly effective method to disrupt biofilms, demonstrating its non-redundant structural role [3] [5] [7].
Quantitative Data on Component Effects on Biofilm Mechanics
The mechanical stability of biofilms, including properties such as cohesive strength and viscoelasticity, is directly determined by the composition of the EPS matrix. Research systematically applying EPS-targeting agents provides quantitative insights into the contribution of each component. The following table summarizes experimental data from a study that treated Staphylococcus epidermidis biofilms with specific degrading agents and measured the resulting changes in cohesive strength [3].
Table 2: Quantitative Effects of EPS-Modifying Agents on Biofilm Cohesive Strength
| Treatment Agent | Target EPS Component | Optimum Concentration | Reduction in Cohesive Strength | Key Experimental Findings |
|---|---|---|---|---|
| Proteinase K | Proteins | 100 mg/L | 65% | Significant loss of structural integrity; reduced adhesion and biofilm biomass |
| Trypsin | Proteins | 100 mg/L | 58% | Weakened biofilm mechanical stability and increased susceptibility to removal |
| DNase I | eDNA | 100 mg/L | 47% | Disruption of biofilm architecture and reduction in overall biofilm stability |
| Periodic Acid | Polysaccharides | 10 mg/L | 62% | Effective degradation of polysaccharide matrix, leading to biofilm dissolution |
| Dispersin B | Polysaccharides (PNAG) | 50 mg/L | 55% | Loss of intercellular adhesion and structural collapse |
| Sodium Metaperiodate | Polysaccharides | 100 mg/L | 70% | Most effective treatment; severe degradation of biofilm cohesive strength |
The data reveal that targeting polysaccharides, particularly with sodium metaperiodate, resulted in the most substantial reduction (up to 70%) in cohesive strength [3]. Protease treatments also caused significant weakening (58-65% reduction), highlighting the importance of proteinaceous elements in structural integrity. While DNase I treatment was effective, its comparatively lower impact suggests that in this model, eDNA may play a supplementary or synergistic role rather than a primary structural one [3]. Furthermore, the study noted that divalent cations (Ca²⁺ and Mg²⁺) could enhance biofilm strength by forming ion bridges between anionic EPS components, an effect that can be reversed with chelating agents [3].
Experimental Models and Methodologies for Biofilm Research
The selection of an appropriate laboratory model is critical for studying biofilm formation, structure, and response to treatments. These models range from simple static systems to complex flow-based reactors, each with distinct advantages and limitations that influence their applicability to specific research questions.
Table 3: Comparison of Laboratory Models for Biofilm Studies
| Biofilm Model | Key Features | Experimental Outputs | Advantages | Limitations |
|---|---|---|---|---|
| Static Models (e.g., 96-well microtiter plates) | Biofilms grown under quiescent conditions without shear forces [3] [8] | Biofilm biomass (crystal violet staining), viability (CFU counting), composition analysis [8] | High-throughput, simple, quick, cost-effective [3] [8] | Does not mimic fluid shear forces in natural environments; limited imaging capabilities [3] |
| Flow-Cell Models (e.g., CDC Biofilm Reactor, Calgary Biofilm Device) | Biofilms grown under continuous flow, generating uniform shear stress [3] [8] | Biofilm architecture (CLSM), mechanical properties (AFM), chemical composition (FTIR) [3] | Reproduces key environmental parameters (shear stress); allows for real-time, non-destructive imaging; highly reproducible [3] [8] | More complex setup, requires larger volumes of media and reagents, less amenable to high-throughput screening [3] |
| Modern & Emerging Models | Incorporation of synthetic biology, additive manufacturing, and organoid cultures [8] | Simulation of host-pathogen interactions, testing on medically relevant substrates | Potential to more closely simulate real-life scenarios and complex microenvironments [8] | Often in development stages; can be low-throughput and require specialized expertise [8] |
The choice of model significantly influences experimental outcomes. For instance, well-plate biofilms are grown under quiescent conditions that do not accurately represent the shear forces present in many real-world environments like water pipes [3]. In contrast, the CDC biofilm reactor, used in the study generating the data in Table 2, creates a constant shear force that promotes the development of biofilms with a more relevant architecture and mechanical robustness [3]. The Calgary Biofilm Device (CBD) is another standardized platform that allows for high-throughput screening of antimicrobial susceptibility against biofilm populations [8].
Key Analytical Techniques
Advanced analytical techniques are employed to characterize the chemical, physical, and mechanical properties of biofilms:
- Confocal Laser Scanning Microscopy (CLSM): Enables non-invasive, three-dimensional imaging of live biofilms, often using fluorescent stains to visualize different EPS components and cellular distributions [3] [7].
- Atomic Force Microscopy (AFM): Used to probe the nanoscale mechanical properties of biofilms, such as elasticity (modulus) and cohesive strength, by measuring force-deformation relationships [3].
- Fourier-Transform Infrared Spectroscopy (FTIR): Provides information on the chemical composition and functional groups present in the EPS matrix, allowing for the detection of changes induced by chemical treatments [3].
Detailed Experimental Protocols for Matrix Analysis
Protocol 1: Assessing the Structural Role of eDNA Using DNase I
This protocol is adapted from studies investigating the role of eDNA in Clostridioides difficile and Staphylococcus aureus biofilms [5] [7].
Objective: To evaluate the structural contribution of eDNA to biofilm integrity by enzymatic degradation. Materials:
- Mature biofilms (e.g., 48-72 hour cultures)
- DNase I solution (e.g., 100 mg/L in appropriate buffer [3])
- Suitable buffer control (without enzyme)
- Inactivation solution (e.g., EDTA)
- Crystal violet stain or viability assay reagents
- Confocal microscopy equipment with DNA-binding fluorescent dyes (e.g., SYTOX Green)
Methodology:
- Biofilm Growth: Grow biofilms to maturity using an appropriate model (e.g., flow-cell reactor or static plate) [3] [7].
- Treatment Application: Gently overlay the biofilm with DNase I solution. Incubate at the enzyme's optimal temperature (typically 37°C) for a predetermined time (e.g., 1-2 hours). Include a control treated with buffer only [7].
- Enzyme Inactivation: After incubation, remove the enzyme solution and add inactivation solution to stop the reaction.
- Analysis:
- Biomass Quantification: Quantify remaining biofilm biomass using crystal violet staining and elution, measuring absorbance at 570-600 nm [8] [7].
- Structural Analysis (CLSM): For biofilms grown on imaging-compatible surfaces, stain with a DNA-binding dye and a cell viability stain. Image using CLSM to visualize the disruption of the eDNA network and changes in biofilm architecture in 3D [7].
- Mechanical Testing (AFM): Use AFM in force spectroscopy mode to measure the cohesive strength or elastic modulus of treated versus untreated biofilms [3].
Protocol 2: Identifying eDNA-Binding Proteins via Southwestern Blotting
This protocol is based on a study that identified novel eDNA-binding lipoproteins in Staphylococcus aureus [6].
Objective: To discover and characterize bacterial proteins that interact with eDNA in the biofilm matrix. Materials:
- Biofilm cell lysates or extracellular protein extracts
- Nitrocellulose or PVDF membrane
- Herring sperm DNA or other source of DNA for blocking and probing
- Purified genomic DNA for probe preparation (can be labeled with digoxigenin or biotin)
- Standard Western blotting apparatus and reagents
- Antibodies for detection (e.g., anti-digoxigenin) or other detection system
- Mass spectrometry equipment for protein identification
Methodology:
- Protein Separation: Separate proteins from biofilm extracts by SDS-PAGE.
- Membrane Transfer: Transfer the separated proteins from the gel to a membrane.
- Renaturation: Incubate the membrane in a series of buffers with decreasing concentrations of denaturant (e.g., guanidine hydrochloride) to allow proteins to refold into their native conformation.
- Blocking: Block the membrane with a solution containing non-specific DNA (e.g., herring sperm DNA) and protein blockers (e.g., BSA) to prevent non-specific binding.
- Probing: Incubate the membrane with a labeled DNA probe (e.g., digoxigenin-labeled genomic DNA) to allow specific protein-DNA interactions to occur.
- Detection: Wash the membrane to remove unbound probe and detect bound DNA using appropriate methods (e.g., enzyme-conjugated anti-digoxigenin antibody and chemiluminescence).
- Identification: Excise the positive bands from a parallel, non-probed gel and identify the proteins using mass spectrometry [6].
Diagram 1: Southwestern Blotting Workflow for eDNA-Binding Protein Identification. This diagram outlines the key steps for identifying proteins that interact with extracellular DNA in the biofilm matrix, culminating in protein identification via mass spectrometry [6].
The Scientist's Toolkit: Key Research Reagents and Materials
The following table catalogues essential reagents and materials used in the featured experiments for analyzing biofilm matrix composition, along with their specific functions.
Table 4: Essential Research Reagents for Biofilm Matrix Analysis
| Reagent/Material | Function in Biofilm Research | Example Application |
|---|---|---|
| DNase I | Enzymatic degradation of extracellular DNA (eDNA) [3] [5] | Disrupts eDNA scaffold to assess its structural role; reduces biofilm cohesion [3] [7] |
| Proteinase K & Trypsin | Protease enzymes that hydrolyze peptide bonds in proteins [3] | Targets proteinaceous components of EPS; weakens biofilm structural integrity and adhesion [3] |
| Periodic Acid & Dispersin B | Targets polysaccharide components of the EPS matrix [3] | Degrades exopolysaccharides like PNAG, leading to loss of structural stability [3] |
| Crystal Violet | Triphenylmethane dye that stains cells and polysaccharides [8] | Standard staining method for semi-quantitative assessment of total biofilm biomass [8] [7] |
| SYTOX Green/Other Nucleic Acid Stains | Fluorescent dyes that bind to nucleic acids [7] | Visualization of eDNA distribution and network structures within biofilms using CLSM [7] |
| Atomic Force Microscope (AFM) | Instrument for nanoscale topographical imaging and mechanical property measurement [3] | Measures cohesive strength, elasticity, and adhesive forces of biofilms via micro-cantilever methods [3] |
| Confocal Laser Scanning Microscope (CLSM) | High-resolution 3D optical imaging [3] [7] | Non-destructive visualization of biofilm architecture, EPS component localization, and live/dead cell distribution [3] [7] |
| CDC Biofilm Reactor | Standardized system for growing biofilms under constant shear stress [3] | Produces uniform, reproducible biofilms that mimic natural and industrial conditions for testing [3] |
Signaling Pathways and Regulatory Networks in Matrix Assembly
The production of EPS components is not constitutive; it is tightly regulated by complex sensory systems that respond to environmental cues. Key regulatory mechanisms include quorum sensing (QS), which senses cell population density, and the intracellular second messenger bis-(3'-5')-cyclic dimeric guanosine monophosphate (c-di-GMP). The diagram below illustrates a generalized regulatory network influencing EPS production in a model bacterium like Pseudomonas aeruginosa.
Diagram 2: Regulatory Network of Biofilm Matrix Production. This diagram shows how environmental signals integrate through systems like quorum sensing and c-di-GMP to regulate the expression of genes responsible for producing key matrix components, including exopolysaccharides, proteins, and eDNA [5] [6] [1]. The release of eDNA is often controlled by regulating autolysins (like AtlA in S. aureus) and nucleases (like Nuc) [5] [6].
The structural composition of the biofilm matrix, dominated by exopolysaccharides, proteins, and eDNA, is a primary determinant of the emergent properties of biofilm communities, including their profound resistance to antimicrobials and mechanical resilience. Quantitative studies demonstrate that targeted enzymatic disruption of any single component can significantly compromise biofilm integrity, with polysaccharide degradation often causing the most substantial loss of cohesive strength [3].
The choice of research model—from simple static plates to advanced flow-cell systems—critically influences the architecture and composition of the studied biofilms and, consequently, the experimental findings [3] [8]. A comprehensive understanding of the synergistic interactions between EPS components, their regulated production, and their spatial organization within the matrix is essential for developing effective strategies to control detrimental biofilms in industrial and clinical settings or to optimize beneficial biofilms in biotechnology and environmental applications. Future research leveraging modern models and omics technologies will continue to unravel the complexity of this dynamic "house of cells."
The five-stage biofilm lifecycle model provides a foundational framework for understanding the development and resilience of structured microbial communities. This guide offers a comparative evaluation of this model, detailing the regulatory mechanisms, physiological transitions, and experimental methodologies essential for biofilm research. We present consolidated quantitative data, standardized experimental protocols, and key reagent solutions to support the development of anti-biofilm strategies, aiming to equip researchers with the tools necessary to investigate and target these complex biological systems effectively.
The five-stage biofilm lifecycle model describes a sequential, highly regulated process through which free-swimming (planktonic) bacteria transition into structured, surface-associated communities, culminating in their active dispersal [9] [10]. This model, extensively studied in organisms like Pseudomonas aeruginosa, outlines a journey from initial surface contact to the formation of a mature, matrix-encased biofilm that exhibits dramatically increased tolerance to antimicrobials and host defenses [9] [11]. Understanding this cycle is critical, as biofilms are implicated in over 80% of microbial infections and represent a principal challenge in 21st-century healthcare due to their innate resistance to treatment [10] [12].
While the classic model provides a valuable heuristic tool, it is primarily based on in vitro studies under controlled conditions. Recent research has expanded this view, showing that biofilms can also exist as non-surface-attached aggregates in clinical settings, such as in the viscous airway mucus of cystic fibrosis patients [9]. Despite these variations, the aggregation of bacteria into a matrix-encased community remains the central hallmark, and the five-stage model continues to be a vital reference point for comparing biofilm physiology across diverse microenvironments [9].
Comparative Analysis of the Five-Stage Lifecycle
The following table summarizes the key characteristics, regulatory mechanisms, and phenotypic markers for each stage of the biofilm lifecycle. This data provides a basis for comparing bacterial behavior and resistance profiles at different developmental points.
Table 1: Comparative Analysis of the Five Biofilm Lifecycle Stages
| Lifecycle Stage | Key Characteristics | Primary Regulatory Mechanisms/Structures | Phenotypic Markers & Experimental Observations |
|---|---|---|---|
| 1. Reversible Attachment | • Weak, transient adhesion to preconditioned surfaces [13] [14]• Mediated by physical forces (van der Waals, electrostatic) [13]• Affected by surface properties (roughness promotes adhesion) [13] | • Flagella [10]• Pili (e.g., type IV pili) [10]• Cell surface adhesins [10] | • Cells can be easily removed by shear stress [14]• Observation of intermittent contact under flow cells [10] |
| 2. Irreversible Attachment | • Permanent adhesion cemented by bacterial secretions [13] [12]• Formation of a monolayer of cells [15]• Production of extracellular polymeric substances (EPS) begins [14] | • Secretion of EPS (polysaccharides, proteins, eDNA) [14]• Polymer bridging and depletion aggregation [9] | • Cells resist removal by shear forces [14]• Detection of initial EPS components (e.g., eDNA, polysaccharides) [14] |
| 3. Maturation I | • Clonal growth into microcolonies [9] [10]• Development of a 3D structure [14]• Initiation of cell-cell communication [14] | • Active microbial growth and division [9] [13]• Early quorum sensing signaling [15] | • Formation of distinct cellular clusters visible via microscopy [9]• Evidence of metabolic heterogeneity [9] |
| 4. Maturation II | • Complex, mushroom-shaped or pillar-like structures [9] [10]• Formation of fluid-filled channels [10]• High degree of metabolic and physiological heterogeneity [9] | • Established quorum sensing (e.g., AHLs in Gram-negative bacteria) [15]• C-di-GMP signaling promoting matrix production [15]• Nutrient and oxygen gradients within the biofilm [13] | • Biofilms exhibit 10-1000x increased antibiotic tolerance [10]• Presence of persister cells [10]• Distinct architectural features (e.g., channels, voids) [10] |
| 5. Dispersion | • Active, enzymatic liberation of single cells or small aggregates [10]• Return to planktonic lifestyle [14]• Facilitates colonization of new niches [10] | • Production of matrix-degrading enzymes (e.g., glycosidases, nucleases, proteases) [10]• Environmental cues (e.g., nutrient starvation, oxygen tension) [10]• Downregulation of adhesion factors [10] | • Observation of central voids and eroded biofilm structures [10]• Release of planktonic cells into the effluent [14] [10] |
Key Regulatory Pathways
The progression through the biofilm lifecycle is governed by complex regulatory networks. The following diagram illustrates the core signaling pathways that control the transition between the planktonic state and the key stages of biofilm development.
Experimental Models and Methodologies for Biofilm Research
A variety of in vitro models are employed to study biofilm formation and evaluate anti-biofilm strategies. The choice of model system significantly influences the structural characteristics and experimental outcomes of the biofilm under investigation.
Table 2: Comparison of Common In Vitro Biofilm Models
| Model Type | Description | Key Applications | Advantages | Limitations |
|---|---|---|---|---|
| Static Microtiter Plate assays | Biofilms form on the walls and bottoms of multi-well plates under non-flow conditions [9]. | • High-throughput screening of biofilm inhibitors [9]• Initial assessment of biofilm formation capacity [9] | • Simple, low-cost, and reproducible [9]• Requires minimal equipment [9] | • Does not simulate fluid shear forces [9]• Can yield unstructured, flat biofilms [9] |
| Flow Cell Systems | Biofilms grow under a continuous flow of medium on a coverslip, allowing real-time microscopy [9] [10]. | • Studying biofilm architecture and development dynamics [9] [10]• Investigating spatiotemporal gene expression [10] | • Generates complex 3D structures (e.g., mushrooms, pillars) [10]• Allows non-destructive, live imaging [10] | • Lower throughput [9]• More complex setup and operation [9] |
| Calgary Biofilm Device (CBD) | Uses a peg lid that fits into a microtiter plate; biofilms form on pegs under gentle agitation [9]. | • Determining antibiotic susceptibility (MBEC) [9]• Studying biofilms of diverse pathogens [9] | • Generates highly reproducible and uniform biofilms [9]• Medium-throughput for antimicrobial testing [9] | • Limited ability for real-time imaging [9] |
| Advanced 3D In Vitro Models | Co-cultures of relevant human cells (e.g., fibroblasts, keratinocytes) and bacteria on biomaterials to mimic tissue interfaces [16]. | • Investigating host-pathogen interactions in implant-associated infections [16]• Testing novel implant materials [16] | • Includes physiological cell-to-cell contacts [16]• Uses human cells, improving clinical relevance [16] | • Technically challenging and costly [16]• Not yet standardized or widely adopted [16] |
Standardized Protocol: Biofilm Formation and Analysis in a Flow Cell System
This protocol is adapted from methodologies used to establish the classic five-stage model and is suitable for the detailed study of biofilm architecture and dispersal events [9] [10].
Methodology:
- Inoculum Preparation: Grow the bacterial strain of interest (e.g., P. aeruginosa PAO1) to mid-logarithmic phase in a suitable broth. Centrifuge and wash the cells, then resuspend in a defined, dilute medium to an optical density (OD600) of 0.05 - 0.1 [10].
- System Assembly and Sterilization: Assemble the flow cell system according to the manufacturer's instructions, typically involving a glass coverslip as the substratum. Sterilize the entire flow system, including tubing and medium reservoir, by pumping a sterilizing solution (e.g., 0.5% sodium hypochlorite) through it, followed by copious sterile water and finally the defined medium [9].
- Initial Attachment Phase: Stop the medium flow and carefully inject the prepared bacterial inoculum into the flow cell channel. Allow the cells to settle and attach to the surface for a period of 1-2 hours without flow [10].
- Biofilm Development: Re-initiate a continuous, low-shear flow of the defined medium (e.g., 0.2 mm/sec velocity). This washes away non-adhered cells and provides fresh nutrients for the development of the attached biofilm over 3-7 days [9] [10].
- Staining and Microscopy: At desired time points, introduce fluorescent stains into the flow system. Common stains include:
- SYTO dyes: For labeling nucleic acids and quantifying total biomass.
- Concanavalin A conjugated with a fluorophore (e.g., Tetramethylrhodamine): For specific staining of polysaccharides in the EPS matrix [9].
- Propidium Iodide: For identifying dead cells or extracellular DNA (eDNA).
- After staining, visualize the biofilm using Confocal Laser Scanning Microscopy (CLSM) to capture high-resolution Z-stacks of the 3D structure [10] [12].
- Image and Data Analysis: Use image analysis software (e.g., ImageJ with BiofilmQ or COMSTAT plugins) to quantify parameters such as biovolume (µm³/µm²), average thickness (µm), substratum coverage (%), and surface area to biovolume ratio from the CLSM Z-stacks [9].
The workflow for this protocol is summarized below.
The Scientist's Toolkit: Essential Research Reagents
The following table catalogs key reagents and their specific functions in biofilm matrix research, providing a quick reference for experimental design.
Table 3: Key Research Reagent Solutions for Biofilm Studies
| Reagent / Material | Function / Application in Biofilm Research |
|---|---|
| SYTO 9 / SYTO 60 | Nucleic acid binding dyes for fluorescent labeling of live and dead bacterial cells within the biofilm, enabling quantification of total biomass via confocal microscopy [12]. |
| Concanavalin A (ConA) Tetramethylrhodamine | A lectin that specifically binds to α-mannopyranosyl and α-glucopyranosyl residues in polysaccharides; used to stain the polysaccharide component of the EPS matrix [9]. |
| Propidium Iodide (PI) | A red-fluorescent dye that is generally excluded by intact cell membranes. It is used to stain dead cells or, critically, to label extracellular DNA (eDNA), a major structural component of many biofilms [14]. |
| Proteinase K | A broad-spectrum serine protease. Used in experimental protocols to enzymatically degrade protein components within the biofilm matrix, testing their structural importance and contributing to dispersal strategies [10]. |
| DNase I | An enzyme that degrades DNA. Applied to dissect the functional role of eDNA in biofilm integrity, adhesion, and resistance, often leading to biofilm disruption [14] [10]. |
| Dispersin B | A glycoside hydrolase produced by Aggregatibacter actinomycetemcomitans that specifically degrades poly-N-acetylglucosamine (PNAG), a key polysaccharide in the matrix of staphylococci and other bacteria [10]. |
| Flow Cells with glass or PVC substrata | The foundational hardware for growing biofilms under defined shear stress, enabling the formation of architecturally complex structures and real-time, non-destructive imaging [9] [10]. |
The five-stage biofilm lifecycle model remains an indispensable framework for comparative research, providing a structured understanding of how bacterial communities develop and evade control measures. The experimental data and methodologies consolidated in this guide highlight the model's utility in deciphering the complex signaling and structural changes that characterize biofilm-mediated resistance. As the field moves toward more sophisticated 3D and organotypic models, the principles outlined by this lifecycle will continue to inform the development of targeted anti-biofilm therapies, such as those inducing dispersion or preventing initial attachment, ultimately aiming to overcome the significant challenge posed by chronic biofilm-associated infections.
The ESKAPE pathogens (Enterococcus faecium, Staphylococcus aureus, Klebsiella pneumoniae, Acinetobacter baumannii, Pseudomonas aeruginosa, and Enterobacter species) represent a critical group of opportunistic bacteria renowned for their ability to evade antibiotic action, primarily through biofilm formation. These pathogens are responsible for the majority of nosocomial infections worldwide and are a primary focus of antimicrobial resistance research. Within this group, P. aeruginosa and S. aureus have emerged as preeminent model organisms for studying biofilm development, structure, and recalcitrance. This guide provides a comparative analysis of these key model organisms, detailing their unique biofilm matrices, regulatory mechanisms, and experimental applications to inform model selection for specific research objectives.
Table 1: Key Characteristics of ESKAPE Pathogens in Biofilm Research
| Pathogen | Gram Stain | Primary Biofilm Matrix Components | Notable Biofilm Traits | Prevalence of Strong Biofilm Formers |
|---|---|---|---|---|
| Pseudomonas aeruginosa | Negative | Alginate, Psl, Pel polysaccharides, eDNA, proteins [17] | High intrinsic tolerance, metabolic stratification, strong in vitro models [18] [17] | Common [19] |
| Staphylococcus aureus | Positive | PIA/PNAG, proteins, eDNA [20] | Strong adhesion, associated with medical device infections [20] | Common [19] |
| Klebsiella pneumoniae | Negative | Capsular polysaccharides, cellulose [19] | Strong biofilm formation correlated with resistance [19] [21] | Very High [19] [21] |
| Acinetobacter baumannii | Negative | Proteinaceous, pili [20] | Strong environmental persistence [19] [22] | Very High [19] [21] |
| Enterococcus faecium | Positive | Esp surface protein [20] | Often forms weaker biofilms [19] | Low [19] |
Table 2: Comparative Antimicrobial Resistance in Biofilm States
| Pathogen | Exemplary Resistance/Tolerance in Biofilms | Multi-Drug Resistance (MDR) Rate | Notable Resistance Mechanisms in Biofilms |
|---|---|---|---|
| P. aeruginosa | Tolerance to tobramycin (bound by alginate); induced β-lactamase production [18] [17] | Relatively lower among Gram-negatives in the group [19] | Matrix-based antibiotic sequestration; metabolic dormancy; inducible adaptive colistin tolerance [18] [17] |
| S. aureus | Methicillin resistance (MRSA) via mecA gene [19] [21] | ~10% (Bangladesh study) [19] | Extracellular matrix barrier; persister cells [20] |
| K. pneumoniae | High resistance to carbapenems, cephalosporins; colistin resistance up to 42.9% [19] [21] | Prevalent [19] | Carbapenemase & Metallo-β-lactamase production; strong correlation between biofilm strength and resistance [19] [21] |
| A. baumannii | Elevated resistance to carbapenems, cephalosporins [19] [21] | Prevalent [19] | Carbapenemase production; environmental persistence on surfaces [19] [22] |
| E. faecium | Vancomycin resistance (vanB gene) [19] [21] | ~90% (Bangladesh study) [19] | Not specified in search results |
Model Organism Deep Dive:Pseudomonas aeruginosaandStaphylococcus aureus
1Pseudomonas aeruginosa: The Versatile Benchmark
P. aeruginosa serves as a cornerstone model in biofilm research due to its exceptionally well-characterized and versatile biofilm-forming capabilities. Its utility spans fundamental studies of biofilm development to applied research on chronic infections.
Biofilm Architecture and Matrix Composition: The biofilm matrix of P. aeruginosa is a complex and dynamic structure. Its composition is strain-dependent and can include the exopolysaccharides alginate, Psl, and Pel, which provide structural integrity and mediate surface attachment [17]. Beyond polysaccharides, the matrix incorporates various proteins (e.g., adhesins like CdrA, and amyloid fibers), extracellular DNA (eDNA), and even rhamnolipids, which are involved in structuring microcolonies [17]. This diverse matrix acts as a barrier that can bind to certain antibiotics, such as the aminoglycoside tobramycin, significantly reducing drug penetration and efficacy [18].
Regulatory Networks: The biofilm life cycle is tightly regulated by several key systems:
- c-di-GMP Signaling: High intracellular levels of this second messenger promote the production of matrix components and the transition to biofilm living, while low levels favor biofilm dispersal and a planktonic lifestyle [17].
- Quorum Sensing (QS): The interconnected Las, Rhl, and PQS QS systems coordinate gene expression in a cell-density-dependent manner, regulating the production of virulence factors and matrix components like eDNA and rhamnolipids [17].
- Two-Component Systems: Systems like GacA/GacS integrate environmental signals to regulate biofilm formation, often intersecting with c-di-GMP signaling pathways [17].
Distinctive Research Applications:
- Metabolic Gradients and Tolerance: P. aeruginosa biofilms exhibit a gradient of metabolic activity. Surface-located cells are metabolically active, while cells in the biofilm center enter a dormant state due to nutrient and oxygen limitations. This dormancy renders them highly tolerant to most conventional antibiotics [18]. This model is ideal for studying metabolite diffusion, hypoxia, and persister cell formation.
- Synergistic Antibiotic Therapy: Research using P. aeruginosa flow-cell models revealed that while ciprofloxacin kills the metabolically active surface cells and colistin kills the dormant center, a combination of both antibiotics is required to eradicate the entire biofilm structure [18]. This finding is critical for designing effective treatment strategies for chronic infections.
2Staphylococcus aureus: A Gram-Positive Paradigm
As a Gram-positive pathogen, S. aureus provides a critical counterpoint to P. aeruginosa, with distinct biofilm matrix composition and regulatory mechanisms.
Biofilm Architecture and Matrix Composition: The hallmark of the S. aureus biofilm matrix is the polysaccharide intercellular adhesin (PIA), also known as poly-N-acetylglucosamine (PNAG) [20]. PIA is crucial for cell-cell adhesion and biofilm accumulation. The matrix is also rich in proteins (e.g., biofilm-associated protein, Bap) and extracellular DNA (eDNA), which provide structural stability and resilience [20].
Research Applications and Polymicrobial Interactions:
- Medical Device-Associated Infections: S. aureus is a leading cause of biofilm-related infections on indwelling medical devices such as catheters and implants, making it a premier model for studying foreign body-associated biofilms [20].
- Polymicrobial Biofilm Dynamics: S. aureus is frequently co-isolated with P. aeruginosa in chronic wounds and cystic fibrosis lungs. Research into their interactions reveals a primarily antagonistic relationship in mixed biofilms. P. aeruginosa often outcompetes S. aureus by producing antimicrobial compounds like 2-n-heptyl-4-hydroxyquinoline-N-oxide (HQNO) and secreted proteases, leading to a significant reduction in S. aureus biofilm biomass [23]. This makes the pair an excellent model for studying interspecies competition and communication.
Experimental Protocols and Methodologies
Standardized protocols are essential for generating reproducible and comparable data in biofilm research. Below are detailed methodologies for key assays cited in the literature.
Microtiter Plate Biofilm Formation Assay
This is a cornerstone method for the quantitative assessment of biofilm formation capacity [19] [21].
Workflow:
- Inoculation: Dilute an overnight bacterial culture to a standardized optical density (e.g., 0.1 OD~600~). Dispense 200 µL aliquots into the wells of a sterile 96-well flat-bottom polystyrene microtiter plate. Include negative control wells containing sterile growth medium only.
- Incubation: Incubate the plate under static conditions at the optimal growth temperature (e.g., 37°C for human pathogens) for 24-48 hours.
- Staining and Washing: Carefully remove the planktonic cells and growth medium by inverting and shaking the plate. Wash the adherent biofilms gently twice with phosphate-buffered saline (PBS) to remove loosely attached cells. Fix the biofilms with 99% methanol for 15 minutes, then air dry. Stain the fixed biofilms with 0.1% (w/v) crystal violet solution for 15-20 minutes.
- Destaining and Quantification: Rinse the stained plate thoroughly under running tap water and air dry. Add 200 µL of 33% (v/v) glacial acetic acid or 95% ethanol to destain the wells and solubilize the crystal violet. Transfer the solubilized dye to a new microtiter plate and measure the optical density at 570 nm (OD~570~) using a microplate reader.
Figure 1: Microtiter Plate Biofilm Assay Workflow.
Assessment of Polymicrobial Biofilm Interactions
Studying multi-species biofilms requires methods to quantify and visualize interspecies dynamics [23].
Workflow for Competitive Biofilm Assays:
- Co-culture Setup: Prepare monocultures of S. aureus and P. aeruginosa. For the polymicrobial assay, mix the two cultures in a 1:1 ratio in fresh medium and inoculate into the wells of a microtiter plate. Include control wells with each species alone.
- Biofilm Growth and Quantification: Incubate and process the plate as described in section 3.1. The total biofilm biomass in co-culture wells is quantified and compared to the biomass in monoculture wells to determine the net interactive effect (e.g., antagonism or synergy).
- Species-Specific Quantification (CFU Counting): After incubation, disrupt the biofilm by sonication or vigorous pipetting. Serially dilute the suspension and plate on both non-selective and selective agars (e.g., Mannitol Salt Agar for S. aureus and Cetrimide Agar for P. aeruginosa). Count the colony-forming units (CFUs) after incubation to determine the proportional contribution of each species to the total biofilm.
- Visualization via Microscopy: Grow biofilms on suitable surfaces (e.g., glass coverslips). For Scanning Electron Microscopy (SEM), fix samples with glutaraldehyde, dehydrate through an ethanol series, and critical-point dry before sputter-coating and imaging. For Confocal Laser Scanning Microscopy (CLSM), use live/dead stains or species-specific fluorescent tags (e.g., GFP/RFP) to visualize the 3D structure and spatial distribution of each species within the mixed biofilm.
Emerging Anti-Biofilm Therapeutic Strategies
The recalcitrance of biofilms to conventional antibiotics has spurred the development of novel therapeutic approaches, many of which have been pioneered using P. aeruginosa and S. aureus models.
Table 3: Emerging Anti-Biofilm Strategies and Their Mechanisms
| Therapeutic Strategy | Mode of Action | Model Pathogens for Proof-of-Concept |
|---|---|---|
| Nanoparticles (e.g., Silver, Gold) [20] [24] | Penetrate EPS matrix; disrupt cell membranes; generate reactive oxygen species (ROS); inhibit QS [20]. | P. aeruginosa, S. aureus, A. baumannii [20] [24] |
| Bacteriophage Therapy | Lyse bacterial cells directly; produce depolymerase enzymes that degrade EPS matrix [18]. | P. aeruginosa [18] |
| Quorum Sensing Inhibitors (QSIs) | Block bacterial cell-to-cell communication, reducing virulence and biofilm formation without causing growth pressure [24]. | ESKAPE pathogens [24] |
| Probiotics & Their Metabolites | Competitive exclusion; production of organic acids, bacteriocins, and biosurfactants that inhibit pathogens or disrupt their biofilms [25]. | P. aeruginosa, S. aureus, K. pneumoniae [25] |
| Enzymatic Matrix Disruption (e.g., DNase I) [24] | Degrade key structural components of the biofilm matrix (e.g., extracellular DNA) [24]. | P. aeruginosa, S. aureus [24] |
| Hyperbaric Oxygen | "Wake up" dormant cells in the biofilm center, making them susceptible to antibiotics [18]. | P. aeruginosa [18] |
| Combination Therapy (e.g., Colistin + Ciprofloxacin) | Target multiple bacterial subpopulations (dormant and active) simultaneously for synergistic killing [18]. | P. aeruginosa [18] |
Figure 2: Novel Anti-biofilm Strategies and Their Targets.
The Scientist's Toolkit: Essential Research Reagent Solutions
Table 4: Key Reagents and Materials for Biofilm Research
| Reagent/Material | Function in Biofilm Research | Exemplary Application |
|---|---|---|
| Polystyrene Microtiter Plates | Provides a standardized, high-throughput surface for biofilm growth and quantification [19] [21]. | Microtiter plate biofilm formation assay [19]. |
| Crystal Violet Stain | A basic dye that binds negatively to charged surface molecules and the biofilm matrix, enabling colorimetric quantification of total adhered biomass [23]. | Staining and quantifying total biofilm biomass [23]. |
| Selective Culture Media (e.g., Cetrimide Agar, MSA) | Allows for the selective growth and differentiation of specific bacterial species from a polymicrobial culture [23]. | Determining CFUs of individual species in mixed-species biofilms [23]. |
| Confocal Laser Scanning Microscope (CLSM) | Enables non-destructive, high-resolution 3D imaging of biofilm architecture, often using fluorescent tags or stains [23]. | Visualizing the spatial structure and organization of live/dead cells in a biofilm [23]. |
| Cell-Free Conditioned Media (CFCM) | Contains metabolites, signaling molecules, and enzymes secreted by a bacterium; used to study interspecies interactions [23]. | Assessing the effect of P. aeruginosa secreted factors on S. aureus biofilm formation [23]. |
| Lactic Acid Bacteria (LAB) Probiotics | Used as a biological tool to investigate competitive exclusion and production of anti-biofilm metabolites [25]. | Evaluating growth inhibition and disruption of pre-formed ESKAPE pathogen biofilms [25]. |
Quorum Sensing and Cell-Cell Communication in Biofilm Community Behavior
Quorum Sensing (QS) represents a fundamental form of bacterial communication that enables population-density-dependent coordination of gene expression, playing a pivotal role in biofilm development and functionality. This sophisticated chemical signaling system allows bacterial cells to collectively regulate behaviors that would be ineffective if performed individually, including the production of public goods, secretion of virulence factors, and formation of complex multicellular communities [26] [15]. Biofilms, which are structured microbial communities encased within a self-produced extracellular polymeric substance (EPS), rely heavily on QS mechanisms to progress through developmental stages from initial attachment to maturation and eventual dispersal [27] [15]. The biofilm matrix provides structural integrity and environmental protection while creating an environment where local cell densities can reach sufficient levels to activate QS circuits, establishing a critical feedback loop that reinforces community behaviors and enhances survival under adverse conditions [28] [27].
The significance of QS in biofilm biology extends across medical, environmental, and industrial contexts. In clinical settings, QS-regulated biofilms contribute significantly to antimicrobial resistance in device-associated infections and chronic conditions such as cystic fibrosis pneumonia and diabetic foot ulcers [29] [27]. Pathogens like Pseudomonas aeruginosa, Staphylococcus aureus, and uropathogenic Escherichia coli (UPEC) employ sophisticated QS networks to coordinate virulence factor production and enhance biofilm resilience, making these infections notoriously difficult to eradicate [29] [30]. Conversely, beneficial biofilms, such as those formed by vaginal Lactobacillus species or environmental communities used in wastewater treatment, utilize QS to maintain protective functions and ecosystem stability [31] [32]. Understanding the intricate relationship between QS and biofilm community behavior provides not only fundamental insights into microbial sociology but also unveils potential therapeutic targets for controlling harmful biofilms while preserving beneficial ones.
Comparative Analysis of Research Models in Biofilm Matrix Studies
Methodological Approaches for Investigating Biofilm Formation and Quantification
The study of biofilm development and QS requires specialized methodologies that capture both structural complexity and chemical signaling dynamics. Traditional techniques have provided foundational knowledge, while advanced technologies now enable unprecedented resolution and analytical depth. The crystal violet staining assay represents a cornerstone method for quantifying total biofilm biomass through colorimetric measurement of dye bound to cells and matrix components [27]. Though cost-effective and suitable for high-throughput screening, this approach cannot distinguish viable from non-viable cells and provides limited structural information [27]. Colony-forming unit (CFU) enumeration offers assessment of culturable bacteria but may underestimate true viability due to biofilm-associated metabolic dormancy [27]. The Congo red agar method serves as a qualitative screen for extracellular polysaccharide production, revealing matrix-producing strains through characteristic colony morphology, though it lacks quantitative precision [27].
Advanced imaging technologies have dramatically enhanced our capacity to characterize biofilm architecture and cellular organization. Confocal laser scanning microscopy provides three-dimensional visualization of hydrated biofilms when combined with fluorescent staining, though it may alter native biofilm properties [27]. Scanning electron microscopy (SEM) offers high-resolution surface imaging but requires sample dehydration and metallic coating, potentially introducing structural artifacts [27] [33]. Most recently, large-area automated atomic force microscopy (AFM) has emerged as a powerful tool capable of capturing nanoscale topological features over millimeter-scale areas, enabling visualization of individual cells, flagellar structures, and EPS components without extensive sample preparation [33]. This automated AFM approach, enhanced by machine learning algorithms for image stitching and analysis, has revealed previously obscured spatial heterogeneities and patterned cellular arrangements such as the honeycomb structures observed in Pantoea sp. YR343 biofilms [33].
For QS investigation, gas chromatography-mass spectrometry (GC-MS) enables sensitive detection and quantification of signaling molecules like acyl-homoserine lactones (AHLs) extracted from biofilm supernatants [32]. Transcriptomic analyses through RNA-sequencing (RNA-seq) provide comprehensive profiles of gene expression changes during biofilm development, with recent computational advances such as Python-based scorecard tools helping researchers identify significant expression patterns across multiple experimental conditions [34]. These complementary methodologies collectively enable researchers to correlate structural biofilm development with the underlying QS regulatory networks that govern community behavior.
Comparison of Experimental Models for Quorum Sensing and Biofilm Research
Table 1: Comparative analysis of model systems for quorum sensing and biofilm research
| Model System | Key Characteristics | QS Systems Present | Applications | Advantages | Limitations |
|---|---|---|---|---|---|
| Pseudomonas aeruginosa | Gram-negative opportunistic pathogen | Las, Rhl, Pqs, Iqs [30] | Medical biofilm research, antimicrobial testing [30] | Well-characterized hierarchical QS network, clinical relevance [30] | Complex regulation, adaptive mutations (e.g., lasR) [30] |
| Escherichia coli (UPEC) | Gram-negative uropathogen | AI-2, AI-3 [26] | Urinary tract infection studies, virulence factor analysis [29] | Genetic tractability, clinical importance in UTIs [29] | Strain variability, less specialized QS systems |
| Staphylococcus aureus | Gram-positive pathogen | AIP-based system [26] | Medical device infections, antibiotic resistance studies [34] | Peptide-based QS mechanism, high clinical prevalence | Different signaling mechanism from Gram-negative models |
| Lactobacillus species | Gram-positive commensal | Oligopeptide-based, potential AHL production [32] | Probiotic research, vaginal microbiome studies [32] | Beneficial biofilm model, host-microbe interactions | Limited AHL production in some species (e.g., L. gasseri) [32] |
| Pantoea sp. YR343 | Gram-negative plant-associated | Not fully characterized | Biofilm architecture studies, plant-microbe interactions [33] | Distinctive honeycomb biofilm pattern, plant growth-promoting properties [33] | Less characterized QS systems |
Quantitative Comparison of Biofilm Formation and Quorum Sensing Molecules
Table 2: Experimental data comparison across different bacterial species and conditions
| Bacterial Species/Strain | Biofilm Formation Measurement | QS Molecule Detected | Experimental Conditions | Key Findings |
|---|---|---|---|---|
| Uropathogenic E. coli (UPEC) [29] | 72.22% of isolates (n=180) formed biofilms vs. 16.66% commensal isolates | fimH gene (98.33% of isolates) | Clinical isolates from UTI patients; tissue culture plate method | Biofilm-forming UPEC showed 128-fold reduction in ciprofloxacin susceptibility compared to commensal strains |
| Commensal E. coli [29] | 16.66% formed biofilms | Not specified | Intestinal isolates from healthy individuals | Significantly lower biofilm formation compared to UPEC pathogens |
| Lactobacillus crispatus [32] | High quantity biofilm | AHLs detected | Microfermenter system, 48h growth, MRS broth | Produces AHL QS molecules alongside expected oligopeptide signals |
| Lactobacillus jensenii [32] | High quantity biofilm | AHLs detected | Microfermenter system, 48h growth, MRS broth | Similar AHL production to L. crispatus |
| Lactobacillus gasseri [32] | Lower quantity biofilm | No AHLs detected | Microfermenter system, 48h growth, MRS broth | Relies solely on oligopeptide-based QS without AHL production |
| Pantoea sp. YR343 [33] | Honeycomb pattern formation, cells ~2μm length, flagella 20-50nm height | Not characterized | PFOTS-treated glass surfaces, 6-8h incubation | Flagellar coordination observed in early attachment and biofilm assembly |
Quorum Sensing Signaling Pathways and Mechanisms
Molecular Foundations of Bacterial Communication Systems
Quorum sensing mechanisms vary significantly between bacterial groups but share common fundamental principles. In Gram-negative bacteria, QS typically employs acyl-homoserine lactones (AHLs) as signaling molecules, which diffuse across cell membranes and bind intracellular transcriptional regulators of the LuxR family when sufficient concentration thresholds are reached [26]. These AHL-receptor complexes then activate expression of target genes, including those for AHL synthesis, creating a positive feedback loop that results in density-dependent gene regulation [26]. The marine bacterium Aliivibrio fischeri provided the foundational model for this mechanism with its LuxI/LuxR system controlling bioluminescence, establishing the paradigm for AHL-based communication [26].
In contrast, Gram-positive bacteria typically utilize processed oligopeptides (autoinducing peptides, AIPs) as QS signals that are detected by membrane-associated two-component systems rather than intracellular receptors [26]. These systems involve sensor kinase proteins that autophosphorylate upon AIP binding, then transfer phosphate groups to response regulator proteins that modulate target gene expression [26]. Staphylococcus aureus employs such a system in its agr (accessory gene regulator) pathway, which coordinates virulence factor production and biofilm development [26]. Beyond these canonical systems, certain signaling molecules facilitate cross-species communication, most notably autoinducer-2 (AI-2) synthesized via the LuxS pathway, which is recognized as a universal signal for interspecies communication [26]. Additionally, Escherichia coli utilizes autoinducer-3 (AI-3) for interkingdom signaling, demonstrating the evolutionary sophistication of bacterial communication networks [26].
Integrated Quorum Sensing Network inPseudomonas aeruginosa
Pseudomonas aeruginosa possesses one of the most sophisticated and hierarchically organized QS networks, making it a paradigm for complex bacterial communication. The core circuitry consists of three interconnected systems (Las, Rhl, and Pqs) that operate in a coordinated cascade to regulate hundreds of genes involved in virulence, secondary metabolism, and biofilm development [30]. The Las system, positioned at the top of this hierarchy, utilizes N-(3-oxododecanoyl)-L-homoserine lactone (3-oxo-C12-HSL) as its signal molecule, which binds to the transcriptional activator LasR to control expression of virulence factors and components of the Rhl system [30]. The Rhl system employs N-butyryl-L-homoserine lactone (C4-HSL) as its signal, with the C4-HSL-RhlR complex activating genes for rhamnolipid production, pyocyanin synthesis, and additional virulence factors [30].
The third major system, Pqs, utilizes 2-heptyl-3-hydroxy-4(1H)-quinolone (PQS) as its signal molecule, which binds to PqsR to activate genes involved in pyocyanin production and also influences the Rhl system [30]. More recently, a fourth system termed "integrated quorum sensing" (Iqs) has been identified, which connects the central Las system with phosphate stress response and downstream Pqs and Rhl systems [30]. The Iqs system produces 2-(2-hydroxyphenyl)-thiazole-4-carbaldehyde (IQS) as its signaling molecule and appears to provide a backup communication channel when the primary Las system is compromised, as frequently occurs in clinical isolates from chronic infections [30]. This sophisticated, multi-layered regulatory architecture enables P. aeruginosa to maintain precise control over collective behaviors despite environmental fluctuations or selective pressures, contributing significantly to its success as an opportunistic pathogen.
Diagram Title: P. aeruginosa Integrated Quorum Sensing Network
Experimental Protocols for Key Methodologies
Microfermenter Biofilm Growth and AHL Extraction Protocol
The microfermenter system provides a controlled environment for studying biofilm development under conditions that more closely mimic natural habitats than static cultures. For Lactobacillus species biofilm analysis, the following protocol has been established [32]:
Biofilm Growth Phase:
- Preparation: Autoclave microfermenter components including glass spatula, connectors, and Tygon tubes. Prepare 200 mL of de Mann, Ragosa, and Sharpe (MRS) broth and autoclave.
- Inoculation: Scrape frozen stock bacteria of Lactobacillus species (e.g., L. crispatus CIP 103603, L. jensenii CIP 69.17T, L. gasseri CIP 102991T) and inoculate into 5 mL MRS broth. Grow for 24 hours at 37°C with 5% CO₂.
- Standardization: Centrifuge culture at 3,200 rpm for 15 minutes, discard supernatant, and resuspend pellet in fresh MRS broth. Adjust to optical density 0.02 (approximately 10⁴-10⁵ cells/mL).
- Assembly: Add 50 mL MRS media to sterile non-bubbling reactor, inoculate with 1 mL standardized culture, and insert sterile glass spatula. Incubate for 3 hours at room temperature.
- System Operation: Transfer reactor to heated water tank (37°C) and pressurize system with air (0.04 bar) to establish flow. Run microfermenter for 48 hours.
Biofilm Collection and AHL Extraction:
- Biofilm Harvesting: Remove glass spatula with attached biofilm and place in sterile measuring cylinder with 50 mL MRS broth. Vortex briefly to dislodge biofilm.
- Sample Processing: Centrifuge media from reactor at 3,200 rpm for 15 minutes at room temperature. Retain supernatant for AHL analysis.
- AHL Extraction: Combine 15 mL supernatant with equal volume ethyl acetate (99.5%) in glass test tube. Vortex for 10 seconds and allow phases to separate. Transfer organic phase to beaker and repeat extraction. Combine organic portions and evaporate overnight in fume hood.
- Sample Preparation: Resuspend residue in 1,000 μL acetonitrile and store at -20°C until GC-MS analysis.
GC-MS Analysis of AHLs:
- Utilize standards including C4-HL, C6-HL, C8-HL, C10-HL, and C12-HL for quantification.
- Employ appropriate GC-MS parameters for separation and detection of AHL compounds.
- Compare retention times and mass spectra of samples against standards to identify and quantify AHL production [32].
Tissue Culture Plate Method for Biofilm Quantification
The tissue culture plate (TCP) method represents the gold standard for phenotypic detection of biofilm formation and provides quantitative data on bacterial adherence capacity [29]:
Biofilm Growth and Fixation:
- Inoculate trypticase soy broth with 2% glucose using colonies from fresh agar plates. Incubate for 24 hours at 37°C under stationary conditions.
- Dilute broth culture 1:100 with fresh medium. Add 200 μL diluted culture to individual wells of sterile 96-well flat-bottomed tissue culture plate. Include control wells with medium only.
- Incubate plate for 24 hours at 37°C to allow biofilm formation.
- After incubation, gently remove contents by tapping plate. Wash wells four times with 200 μL phosphate-buffered saline (PBS, pH 7.2) to remove non-adherent planktonic bacteria.
Biofilm Staining and Quantification:
- Fix adherent biofilms with sodium acetate (2%) for 10 minutes.
- Stain with crystal violet (0.1% w/v) for 1 minute. Rinse excess stain with deionized water and air dry plates.
- Measure optical density of stained adherent bacteria using micro-ELISA auto reader at 570 nm wavelength (OD₅₇₀).
- Interpret results: OD values represent bacterial adherence index, with higher values indicating stronger biofilm formation capacity [29].
Classification Criteria:
- Establish cut-off values (ODc) based on negative control wells: OD ≤ ODc = non-biofilm producer, ODc < OD ≤ 2×ODc = weak biofilm producer, 2×ODc < OD ≤ 4×ODc = moderate biofilm producer, 4×ODc < OD = strong biofilm producer.
Large-Area Automated AFM for Biofilm Imaging
Advanced atomic force microscopy techniques enable nanoscale characterization of biofilm topography and cellular organization across millimeter-scale areas [33]:
Sample Preparation:
- Grow Pantoea sp. YR343 in appropriate liquid growth medium.
- Place PFOTS-treated glass coverslips in petri dish and inoculate with bacterial culture.
- At designated time points (e.g., 30 minutes, 6-8 hours), remove coverslips and gently rinse to remove unattached cells.
- Air dry samples before AFM imaging.
Automated AFM Imaging:
- Utilize large-area AFM system with automated scanning capabilities.
- Implement machine learning algorithms for optimal region selection and scanning parameter optimization.
- Acquire multiple high-resolution images across millimeter-scale areas with minimal overlap.
- Apply image stitching algorithms to create seamless composite images.
Data Analysis:
- Use machine learning-based segmentation for automated cell detection and classification.
- Extract parameters including cell count, confluency, cell shape, and orientation.
- Analyze spatial distribution patterns and identify distinctive organizational features such as honeycomb structures.
- Correlate topological features with functional properties and developmental stages [33].
Diagram Title: Comprehensive Biofilm Research Workflow
The Scientist's Toolkit: Essential Research Reagents and Materials
Table 3: Essential research reagents and materials for quorum sensing and biofilm studies
| Category | Specific Reagents/Materials | Application/Function | Examples from Literature |
|---|---|---|---|
| Growth Media & Supplements | de Mann, Ragosa, and Sharpe (MRS) broth | Lactobacillus culture and biofilm growth [32] | Used for vaginal Lactobacillus species biofilm studies [32] |
| Trypticase soy broth with 2% glucose | Enhanced biofilm formation in tissue culture plate method [29] | UPEC biofilm quantification studies [29] | |
| Congo red agar with supplements | Qualitative assessment of EPS production [27] | Differentiation of matrix-producing and non-producing strains [27] | |
| Staining & Detection Reagents | Crystal violet (0.1% w/v) | Total biofilm biomass staining [29] [27] | Standard method for biofilm quantification in TCP and tube methods [29] |
| Acyl-homoserine lactone standards (C4-HL to C12-HL) | GC-MS quantification of QS molecules [32] | Detection of AHL production in Lactobacillus species [32] | |
| Ethyl acetate (99.5%) | Organic solvent for AHL extraction [32] | Extraction of AHLs from biofilm supernatants prior to GC-MS [32] | |
| Surface Materials | PFOTS-treated glass coverslips | Hydrophobic surface for bacterial attachment studies [33] | Pantoea sp. YR343 biofilm assembly analysis via AFM [33] |
| Polystyrene tissue culture plates | Standard substrate for biofilm quantification [29] | High-throughput screening of biofilm formation capacity [29] | |
| Glass spatula for microfermenter | Biofilm substrate in flow systems [32] | Lactobacillus biofilm growth under controlled conditions [32] | |
| Specialized Equipment | Microfermenter system with flow control | Biofilm growth under physiologically relevant shear forces [32] | Simulation of natural environments for Lactobacillus biofilms [32] |
| Automated atomic force microscope | Nanoscale topological imaging of biofilm structure [33] | Visualization of individual cells, flagella, and EPS matrix [33] | |
| Gas chromatography-mass spectrometer | Sensitive detection and quantification of QS molecules [32] | Identification of AHL production in bacterial supernatants [32] |
The comparative analysis of research models and methodologies presented in this guide underscores the sophisticated interplay between quorum sensing systems and biofilm community behavior across diverse bacterial species. The experimental data reveals that pathogenic organisms like UPEC and P. aeruginosa deploy complex, often hierarchical QS networks to coordinate virulence and enhance biofilm resilience, while commensal species such as vaginal Lactobacillus utilize complementary signaling strategies to maintain protective biofilms [29] [30] [32]. The methodological advances in biofilm research, particularly the development of large-area automated AFM and sophisticated transcriptomic analysis tools, have enabled unprecedented resolution in characterizing both structural and regulatory dimensions of microbial communities [34] [33].
These insights carry significant implications for therapeutic development, suggesting that targeting quorum sensing mechanisms rather than bacterial viability may represent a promising strategy for combating biofilm-associated infections without promoting antibiotic resistance [28] [27]. The documented efficacy of natural quorum sensing inhibitors like curcumin against Vibrio species demonstrates the potential of this approach [28]. Furthermore, the emerging understanding of beneficial biofilms and their signaling mechanisms opens avenues for probiotic enhancement and microbiome engineering applications [32]. As research continues to unravel the complexities of bacterial communication, particularly through multi-scale modeling and single-cell analysis techniques, our capacity to manipulate biofilm communities for clinical, environmental, and industrial benefit will undoubtedly advance, potentially heralding a new era in microbial management strategies grounded in ecological principles rather than simply eradication.
Biofilms, structured communities of microorganisms encased in an extracellular polymeric substance (EPS), represent a significant challenge across medical, industrial, and environmental fields. Their formation is not a random process but a carefully orchestrated sequence influenced profoundly by environmental conditions. Understanding the comparative impact of surface properties, nutrient availability, and flow dynamics is crucial for developing effective biofilm control strategies. This guide provides a systematic comparison of how these factors govern biofilm development, architecture, and resilience, drawing upon recent experimental data and advanced research models. The assessment is framed within a broader thesis on evaluating biofilm matrix research models, providing researchers with actionable insights for experimental design and interpretation.
Comparative Analysis of Key Environmental Factors
Surface Properties: The Foundation for Colonization
Surface characteristics serve as the primary interface determining initial bacterial attachment and subsequent biofilm development. The physicochemical properties of a surface, including its hydrophobicity, roughness, and chemical composition, directly regulate the kinetics of microbial colonization [35].
Microplastic Case Study: Research on microplastics provides a compelling model for understanding surface-driven colonization. Their inherently hydrophobic surfaces rapidly adsorb dissolved organic matter from the environment, forming a conditioning film that facilitates the initial, reversible attachment of pioneer bacteria [35]. This process highlights a universal principle: surface hydrophobicity is a critical driver for the first stage of biofilm formation.
Medical Device Implications: Studies on reusable medical devices, particularly those made of stainless steel, underscore the practical implications of surface properties. The residual soil and surface imperfections on processed devices can create niches that shield initial colonizers, thereby compromising disinfection protocols and promoting resilient biofilm communities [36]. The material's surface finish directly influences the efficacy of standard cleaning regimens.
Nutrient Availability: The Architect of Biofilm Structure and Function
Nutrient abundance is a pivotal environmental factor that modulates biofilm formation, microbial synergy, and stress tolerance. The concentration of available nutrients dictates not only the biomass but also the structural integrity and defensive capabilities of the biofilm matrix.
Table 1: Comparative Impact of Nutrient Abundance on Biofilm Properties
| Biofilm Property | High Nutrient Conditions (e.g., TSB) | Low Nutrient Conditions (e.g., 1/10 TSB) | Experimental Model |
|---|---|---|---|
| Total Biomass | Significantly higher [37] | Reduced [37] | Polystyrene surfaces, multispecies |
| Exopolysaccharide (EPS) Content | Significantly higher [37] | Reduced [37] | Polystyrene surfaces, multispecies |
| Sanitizer Tolerance | Significantly higher survival [37] | Reduced tolerance [37] | Sodium hypochlorite challenge |
| Synergistic Interactions | Strong in multispecies consortia [37] | Weaker or conditional [37] | P. fluorescens, S. aureus, L. monocytogenes |
| Phenotypic Adaptation | - | Metabolic reprogramming, sporulation [38] | Bacillus cereus in dairy models |
The data in Table 1 reveals a consistent trend: nutrient-rich environments foster more robust and resilient biofilms. A key finding is the conditional synergy observed in multispecies biofilms; high nutrient availability promotes cooperative interactions, leading to significantly enhanced biomass, exopolysaccharide production, and sanitizer tolerance compared to single-species arrangements [37]. For instance, Listeria monocytogenes survival after sanitizer treatment jumped from 2.3 log CFU/cm² in a single-species biofilm to 5.3 log CFU/cm² in a multispecies consortium under high nutrients [37].
Under nutrient starvation, bacteria enact sophisticated survival strategies. Studies on Bacillus cereus in dairy-model systems demonstrate that nutrient limitation triggers a phenotypic shift, reducing planktonic growth but concurrently enhancing sporulation and biofilm formation as protective measures [38]. This adaptive response is coordinated by metabolic reprogramming, downregulating energy-intensive pathways like fatty acid biosynthesis while upregulating sporulation and stress response proteins [38].
Flow Conditions: The Mechanical Sculptor of Biofilms
Fluid flow imposes mechanical forces that profoundly influence biofilm morphology, internal structure, and ecological function. The hydrodynamic environment determines how biofilms expand, their physical properties, and their ability to colonize new areas.
Morphological Plasticity: Under fluid flow, biofilms can form not only surface-attached mats but also suspended filamentous structures known as streamers [39]. These streamers are tethered to surfaces and extend into the bulk flow, often causing catastrophic clogging in medical devices and industrial systems [39].
Stress-Hardening Behavior: Recent research has uncovered that biofilm streamers exhibit a unique stress-hardening behavior. Their differential elastic modulus and effective viscosity increase linearly with the external hydrodynamic stress applied to them [39]. This means that the higher the flow-induced stress, the stiffer and more viscous the biofilm becomes, enhancing its mechanical resilience. This behavior is conserved across various bacterial species and is primarily governed by the extracellular DNA (eDNA) in the matrix, which acts as a structural backbone [39]. Extracellular RNA (eRNA) further modulates this network by promoting the formation of complex eDNA structures [39].
Wrinkling Dynamics: The interplay of adhesion, friction, and nutrient availability under flow regulates the biofilm's wrinkling behavior—a buckling instability from internal compressive stresses [40]. Computational models predict that with constant nutrient supply and high friction, wrinkles initiate at the biofilm center where stresses are highest. In contrast, under low nutrients or low friction, nutrient depletion halts central growth, shifting wrinkle initiation to the nutrient-rich outer edge [40]. This transition has been experimentally validated in E. coli biofilms [40].
Table 2: Comparative Effects of Flow Conditions on Biofilm Streamers (P. aeruginosa PA14)
| Flow Condition (Laminar Regime) | Streamer Length (L) | Streamer Radius near Pillar (R) | Key Mechanical Property |
|---|---|---|---|
| Lower Flow Velocity | Longer [39] | Smaller [39] | Lower baseline stiffness |
| Higher Flow Velocity | Shorter [39] | Larger [39] | Stress-hardening; increased stiffness and viscosity [39] |
Experimental Models and Methodologies for Biofilm Research
Advancing biofilm research relies on the use of sophisticated models that accurately simulate the complex interplay of environmental factors.
Standardized Biofilm Reactor Models
For evaluating surface colonization and sanitizer efficacy under controlled flow and nutrient conditions, two standardized models are prominent:
- Drip Flow Reactor (DFR): This model is characterized by an initial batch phase for biofilm establishment, followed by a continuous flow phase for development. It is designed to simulate low-shear environments [36].
- CDC Biofilm Reactor (CDC-BR): This model utilizes a batch phase followed by a continuous phase under constant agitation, creating higher shear conditions compared to the DFR [36].
Comparative Experimental Workflow: A direct comparison of these models for growing Pseudomonas aeruginosa biofilms on stainless steel coupons revealed critical differences. The CDC-BR produced biofilms with significantly higher cell densities, while the DFR generated biofilms with greater total organic carbon and protein content, indicating a denser extracellular matrix under low-shear conditions [36]. This highlights that the choice of reactor model directly influences the final architecture and composition of the test biofilm.
Advanced 3D In Vitro and Computational Models
To bridge the gap between simple 2D models and complex in vivo systems, the field is increasingly adopting advanced 3D models.
Organotypic 3D Models: These systems aim to closely mimic the in vivo situation by co-culturing relevant human cells (e.g., fibroblasts, keratinocytes, immune cells) with bacteria in the presence of implant materials [16]. For instance, dental implant models use fibroblasts and keratinocytes challenged with Gram-positive bacteria to study peri-implantitis [16]. These models allow for the investigation of multifaceted host-pathogen-implant interactions under physiologically relevant conditions.
Lattice-Network Computational Models: These models simulate biofilm morphogenesis by representing the biofilm as a two-dimensional elastic network interacting with a rigid substrate [40]. Growth is driven by local nutrient availability following Monod kinetics, and the model independently controls parameters like friction and adhesion. This allows researchers to disentangle the individual and combined contributions of physical forces and nutrient gradients to the wrinkling and delamination behavior of biofilms, offering insights that are challenging to obtain experimentally [40].
The Scientist's Toolkit: Key Research Reagents and Materials
The following toolkit compiles essential reagents and materials critical for investigating environmental factors in biofilm formation, as derived from the cited experimental studies.
Table 3: Essential Research Reagents and Materials for Biofilm Studies
| Reagent/Material | Function in Biofilm Research | Example Application |
|---|---|---|
| Tranexamic Acid (TXA) | Anti-biofilm agent; reduces extracellular proteins, polysaccharides, and eDNA [41]. | Treatment of S. aureus biofilms; 10 mg/mL concentration shown to reduce matrix components by ≥90% [41]. |
| Extracellular Matrix Stains | Fluorescent labeling of specific biofilm matrix components for quantification [41]. | Sypro Ruby (proteins), ConA-Alexa fluor 633 (α-polysaccharides), PI (DNA), TOTO-1 (eDNA) in CLSM [41]. |
| DNase I / RNase | Enzymatic degradation of extracellular nucleic acids to probe structural role [39]. | Testing mechanical integrity of eDNA-dependent biofilm streamers in P. aeruginosa [39]. |
| Stainless Steel Coupons (#4 finish) | Standardized substrate for biofilm growth on medical device materials [36]. | P. aeruginosa biofilm formation in DFR and CDC-BR models [36]. |
| Microfluidic Platforms | Precise control of hydrodynamic conditions for in situ analysis [39]. | Studying viscoelasticity and stress-hardening of biofilm streamers under laminar flow [39]. |
| Scorecard Python Library | Bioinformatics tool for analyzing heterogeneous transcriptomic data across conditions [34]. | Identifying patterns of gene regulation in bacterial biofilms exposed to antibiotics or nutrient stress [34]. |
The comparative evaluation of environmental factors unequivocally demonstrates that surface properties, nutrient availability, and flow conditions are not isolated drivers but are deeply interconnected in shaping biofilm biology. Surface characteristics dictate the initial attachment, nutrient abundance governs the metabolic activity and structural investment of the community, and flow conditions mechanically sculpt the final architecture and defensive capabilities. The emergence of sophisticated 3D organotypic and computational models provides researchers with unprecedented tools to dissect this complexity. Choosing the appropriate model—from standardized reactors for biocide testing to advanced 3D or computational systems for mechanistic studies—is paramount for generating clinically and environmentally relevant insights. Future research leveraging these comparative frameworks will be essential for developing next-generation strategies to combat biofilm-associated challenges.
Experimental and Computational Models for Biofilm Investigation
In the field of microbiology, biofilms are recognized as a primary mode of bacterial growth, conferring significant resistance to antimicrobial agents and environmental stresses. The phenotypic detection of biofilm-forming capacity is therefore a critical first step in both clinical diagnostics and basic research. Among the plethora of methods available, the Tissue Culture Plate (TCP) method, the Tube Method (TM), and the Congo Red Agar (CRA) method are widely used for their simplicity and cost-effectiveness [42] [43]. These assays detect the fundamental characteristic of biofilm-forming bacteria: the ability to adhere to abiotic surfaces and produce extracellular polymeric substances (EPS). This guide provides a comparative evaluation of these three foundational techniques, offering objective performance data and detailed protocols to inform researchers in their experimental design.
Methodological Principles and Protocols
Tissue Culture Plate (TCP) Method
- Principle: This quantitative assay, often called the microtiter plate assay, measures the ability of bacteria to adhere to the wells of a polystyrene plate. After incubation and washing, the adhered biofilm biomass is stained and quantified spectrophotometrically [42] [44].
- Detailed Protocol (Adapted from [44]):
- Inoculation: Dilute a stationary-phase bacterial culture 1:100 in an appropriate broth (e.g., Tryptic Soy Broth with 0.25% glucose). Pipette 100-200 µL of the diluted culture into the wells of a sterile, non-tissue-culture-treated 96-well microtiter plate. Include uninoculated broth wells as blanks.
- Incubation: Cover the plate and incubate under optimal conditions for the desired time (e.g., 18-24 hours at 37°C).
- Washing: After incubation, invert the plate to discard the planktonic cells. Submerge the plate in a water bath and vigorously shake out the liquid to wash away non-adherent bacteria. Repeat this wash step.
- Fixation and Staining: Air-dry the inverted plate. Add 125 µL of a 0.1% (w/v) crystal violet (CV) solution to each well and stain for 10-15 minutes at room temperature.
- Destaining: Shake out the CV solution and wash the plate as in step 3 to remove unbound dye. Tap the plate dry on paper towels.
- Elution and Quantification: Add 200 µL of a solubilizing solvent (e.g., 30% acetic acid, 95% ethanol, or 100% DMSO, depending on the organism) to each well. Incubate for 10-15 minutes to dissolve the stain. Transfer 125 µL of the eluted dye to a new, optically clear plate and measure the Optical Density (OD) at 500-600 nm [44].
The workflow for this method is standardized as follows:
Tube Method (TM)
- Principle: A semi-quantitative macroscopic assay where biofilms form on the inner wall of a glass or plastic tube. The biofilm is visualized after CV staining, and its intensity is scored visually [43].
- Detailed Protocol:
- Inoculation: Inoculate 2-5 mL of broth medium in a sterile test tube with the test bacterium. An uninoculated tube serves as a negative control.
- Incubation: Incubate statically for 18-24 hours or longer at the appropriate temperature.
- Washing and Staining: Carefully pour out the planktonic culture. Rinse the tube gently with water or phosphate-buffered saline (PBS) to remove loose cells. Add a sufficient volume of 0.1% CV to cover the inner surface of the tube. Let it stand for 10-15 minutes.
- Destaining: Pour out the stain and rinse the tube thoroughly with water until the control tube appears clear.
- Visual Assessment: Air-dry the tube. The formation of a visible biofilm layer, indicated by a violet film adhering to the wall and/or bottom of the tube, is scored as positive. The amount of biofilm can be graded (e.g., 0: absent, 1+: weak, 2+: moderate, 3+: strong) based on the intensity and extent of the stain.
Congo Red Agar (CRA) Method
- Principle: This qualitative method is based on the production of extracellular slime substances, which bind to the Congo red dye. Slime-producing colonies incorporate the dye, resulting in a characteristic black coloration with a dry, crystalline consistency, while non-producing colonies remain pink or red [43] [45].
- Detailed Protocol (Based on [43] [45]):
- Medium Preparation: Prepare Brain Heart Infusion (BHI) agar or another suitable base. Autoclave and cool to approximately 55°C. Add filter-sterilized solutions of Congo red (0.08% final concentration) and sucrose (typically 0.8-5% final concentration). Pour into Petri dishes.
- Inoculation: Spot-inoculate the test strains onto the surface of the CRA plate. Include known positive and negative control strains.
- Incubation: Incubate the plates aerobically at 37°C for 24 hours, and then further at room temperature for an additional 24-48 hours to allow for full color development.
- Interpretation: Examine the colony morphology and color. Black, crystalline colonies are interpreted as strong slime/biofilm producers. Pinkish-red, smooth colonies are non-producers. Some strains may exhibit darkening without a crystalline texture, which can be interpreted as weak or intermediate production.
Comparative Performance Analysis
The table below synthesizes the core attributes of the three methods, providing a direct comparison for researchers.
Table 1: Core characteristics of the three phenotypic biofilm detection methods.
| Feature | Tissue Culture Plate (TCP) | Tube Method (TM) | Congo Red Agar (CRA) |
|---|---|---|---|
| Throughput | High (96-well format) [42] [44] | Low (individual tubes) | Medium (multiple spots per plate) |
| Quantification | Quantitative (Spectrophotometric OD) [42] | Semi-quantitative (Visual scoring) [43] | Qualitative (Visual interpretation of color) [43] |
| Result Objectivity | High | Low to Moderate | Low to Moderate |
| Ease of Execution | Moderate (multiple steps) | Simple | Simple |
| Cost | Low (basic reagents) [42] | Very Low | Low |
| Time to Result | 24-48 hours | 24-48 hours | 48-72 hours [46] |
| Primary Readout | Adhered biomass [47] | Adhered biofilm layer | Slime/exopolysaccharide production [43] |
Experimental Data and Diagnostic Performance
When these methods are compared against molecular techniques (e.g., detection of icaAD genes), their diagnostic sensitivity and specificity can be evaluated. A study on Staphylococcus aureus mastitis isolates revealed critical performance differences [43].
Table 2: Diagnostic performance of TCP and CRA methods against PCR detection of icaAD genes as a gold standard [43].
| Method | Sensitivity | Specificity | Positive Predictive Value (PPV) | Negative Predictive Value (NPV) |
|---|---|---|---|---|
| TCP Method | 100% | 25% | Data not specified | Data not specified |
| CRA Method | 88.9% | 100% | Data not specified | Data not specified |
This data indicates that the TCP method is highly sensitive but may lack specificity, as it can stain non-viable cells and other adhered anionic materials [47]. Conversely, the CRA method is highly specific for slime production but may miss some biofilm-forming strains, resulting in slightly lower sensitivity [43].
Furthermore, media composition can dramatically alter the outcome of these assays. Research has shown that growth media affect biofilm architecture and, consequently, the staining patterns obtained with CV and metabolic dyes, underscoring the need for optimized and consistent growth conditions [47].
The Researcher's Toolkit: Essential Reagents and Materials
Successful execution of these assays requires a standard set of laboratory reagents. The following table lists the key materials and their functions.
Table 3: Essential research reagents and materials for phenotypic biofilm assays.
| Reagent/Material | Function | Application in Assays |
|---|---|---|
| Polystyrene Microtiter Plate | Provides a standardized abiotic surface for bacterial attachment. | Tissue Culture Plate (TCP) [42] [44] |
| Glass or Plastic Test Tubes | Surface for biofilm formation in a macroscopic format. | Tube Method (TM) [43] |
| Congo Red Agar (CRA) | Solid medium containing Congo red dye and a sugar (e.g., sucrose) to induce and visualize slime production. | Congo Red Agar (CRA) [43] [45] |
| Crystal Violet (CV) | A basic dye that binds negatively charged molecules (proteins, polysaccharides) in the biofilm matrix, staining the total biomass. | TCP, TM [42] [43] |
| Acetic Acid / Ethanol / DMSO | Solvents used to elute the bound crystal violet dye from the biofilm for spectrophotometric quantification. | TCP [44] |
| Spectrophotometer (Microplate Reader) | Instrument to measure the optical density of the solubilized crystal violet, providing a quantitative measure of biofilm biomass. | TCP [42] [44] |
The choice among the Tissue Culture Plate, Tube, and Congo Red Agar assays depends heavily on the research objective. The following decision pathway can guide researchers in selecting the most appropriate method:
In summary, the Tissue Culture Plate method is the tool of choice for high-throughput, quantitative screening. The Congo Red Agar method offers high specificity for detecting exopolysaccharide production. The Tube method remains a valuable, simple technique for initial confirmation of biofilm formation in a small number of samples. A comprehensive research strategy may often employ a combination of these methods to leverage their respective strengths and provide a more robust phenotypic profile of bacterial isolates.
This guide provides a comparative evaluation of advanced microscopy techniques essential for biofilm matrix research, focusing on scanning electron microscopy (SEM), confocal laser scanning microscopy (CLSM), and the emerging dual-staining method. We present objective performance data and detailed experimental protocols to aid researchers in selecting the appropriate methodology for their specific applications in drug development and microbiological research.
Table 1: Comparative Performance of Biofilm Analysis Techniques
| Technique | Resolution | Imaging Capability | Key Measurable Outputs | Biofilm Removal Efficacy (Sample Data) | Cost & Accessibility |
|---|---|---|---|---|---|
| Scanning Electron Microscopy (SEM) | High (nanometer scale) | 2D surface imaging | High-resolution surface topography, smear layer removal scores [48] | Smear layer removal: 5% NaOCl+17% EDTA (1.33 score) vs. Odne Clean w/saline (4.47 score) [48] | High cost, requires specialized training [49] [50] |
| Confocal Laser Scanning Microscopy (CLSM) | Sub-micron | 3D non-invasive live imaging | Biovolume, average thickness, live/dead cell ratio, surface coverage [51] [52] | Biofilm removal: Odne Clean w/saline (98%) vs. ultrasonic activation (54%) [48] | High cost, complex operation [49] [50] |
| Novel Dual-Staining (Maneval's + Congo Red) | ~200 nm (light microscope) | 2D differentiation of cells vs. matrix | Visual differentiation of bacterial cells (magenta-red) and biofilm matrix (blue) [49] [50] | Strong agreement with microtiter plate assay (gold standard) [49] | Low cost, minimal equipment, highly accessible [49] [50] |
Detailed Experimental Protocols
Protocol for Confocal Laser Scanning Microscopy (CLSM) with Viability Staining
CLSM enables 3D visualization of biofilm architecture and quantitative analysis of cell viability [51] [52].
- Biofilm Preparation: Develop biofilms on appropriate substrates (e.g., glass cover slips, silicone tubes) placed in 24-well microplates. Incubate for 24-72 hours at 37°C under relevant conditions [53] [52].
- Staining: After incubation, rinse samples twice with 1X phosphate-buffered saline (PBS) and air-dry. Stain using a LIVE/DEAD BacLight Bacterial Viability Kit (or equivalent): use a 1:1 mixture of SYTO 9 and propidium iodide (PI). For example, stain with 3µL of the dye mixture per 1mL of bacterial suspension (or apply directly to the biofilm) and incubate at 37°C for 15-30 minutes in the dark [53] [52].
- Imaging and Analysis: View stained biofilms using a CLSM system (e.g., Zeiss LSM7 DUO, Leica Stellaris 5). SYTO 9 is excited at 488 nm and PI at 561 nm [53] [52]. Use software like COMSTAT, BiofilmQ, or ImageJ for quantitative analysis of parameters like biovolume, average thickness, and live/dead cell ratio [51] [52]. Automated image analysis protocols can reduce human error and improve reproducibility [51].
Protocol for Scanning Electron Microscopy (SEM) Analysis
SEM provides high-resolution, detailed images of biofilm surface morphology [48] [54].
- Biofilm Preparation and Fixation: Grow biofilms on desired substrates. After rinsing with PBS, fix the samples with 2.5% glutaraldehyde in 0.1M PBS for 2 hours at 4°C to preserve structure [49] [53].
- Dehydration: Dehydrate the fixed biofilm samples through a graded ethanol series (e.g., 30%, 50%, 80%, 90%, and 100%), spending about 10-15 minutes at each concentration. This step removes water and prepares the sample for the SEM vacuum chamber [49] [54].
- Drying and Coating: Critical point dry the samples to prevent structural collapse. Subsequently, sputter-coat the samples with a thin layer of gold or another conductive material to prevent charging under the electron beam [49] [53].
- Imaging and Analysis: Visualize the samples using a field-emission SEM (e.g., Hitachi SU-70, Carl Zeiss Gemini 560). Smear layer and debris removal can be evaluated using specific scoring criteria from published literature [48].
Protocol for Novel Dual-Staining with Maneval's Stain
This cost-effective method visually differentiates bacterial cells from the surrounding extracellular polymeric substance (EPS) matrix using a standard light microscope [49] [50].
- Biofilm Preparation: Prepare a microbial culture diluted to a 0.5 McFarland standard in nutrient broth. Submerge a sterilized glass slide in the broth within a Petri dish and incubate undisturbed at 37°C for 3 days to allow biofilm formation [50].
- Rinsing and Fixation: Gently rinse the slide by dipping it in distilled water for 5 seconds to remove non-adhered cells. Fix the biofilm by immersing the slide in 4% formaldehyde for 15-30 minutes at room temperature, then air-dry completely [50].
- Dual-Staining Process:
- Congo Red Staining: Apply 1% Congo red stain to cover the biofilm, then remove excess stain by tilting the slide. Air-dry the slide for 5-10 minutes. Do not wash after this step [50].
- Maneval's Staining: Apply Maneval's stain to fully cover the biofilm and incubate for 10 minutes at room temperature. Remove excess stain and air-dry for 5 minutes [50].
- Visualization and Interpretation: Observe the stained biofilm under a light microscope using a 100x oil immersion objective. Bacterial cells appear magenta-red, while the surrounding biofilm matrix (EPS) stains blue. This allows for clear differentiation and assessment of biofilm structure development [49] [50].
Biofilm Analysis Technique Selection
The Scientist's Toolkit: Key Research Reagent Solutions
Table 2: Essential Materials and Reagents for Biofilm Analysis
| Item | Function/Application | Example Use in Protocol |
|---|---|---|
| SYTO 9 & Propidium Iodide | Fluorescent viability stains for CLSM; SYTO 9 labels all cells (green), PI labels dead cells (red) with damaged membranes [51]. | Differentiating live/dead bacterial populations in a 3D biofilm structure [53] [52]. |
| Maneval's Stain | A cost-effective stain used in the dual-staining method to color bacterial cells magenta-red and the EPS matrix blue [49] [50]. | Visualizing and differentiating biofilm components under a standard light microscope [50]. |
| Congo Red Stain | A dye used in dual-staining that binds to hydrophobic regions of polysaccharides in the biofilm matrix [50]. | Initial staining step in the dual-staining protocol, which shifts to blue after Maneval's application [50]. |
| Glutaraldehyde | A cross-linking fixative that preserves the intricate structure of biofilms for SEM analysis [49] [53]. | Fixing biofilm architecture prior to dehydration and SEM imaging [53]. |
| Crystal Violet (CV) | A simple stain that binds to cells and EPS, used for total biofilm biomass quantification [55] [54] [53]. | Assessing overall biofilm formation and detachment after treatment protocols [53]. |
Biofilms are multidimensional communities of microorganisms embedded within a self-produced extracellular polymeric substance (EPS) matrix, acting as a protective network [56]. The study of bacterial biofilm development has received significant interest due to their role in infectious diseases and industrial applications [56]. Mathematical modeling and computer simulations have emerged as powerful tools for understanding and controlling biofilms, allowing for detailed analysis of the underlying mechanisms of biofilm formation and dispersion while enabling the simulation of various scenarios and interventions [57]. Unlike traditional experimental methods, mathematical models integrate experimental data with mathematical theories, providing a more holistic and accurate understanding of biofilm dynamics, including processes like quorum sensing (QS) and EPS synthesis [57].
This guide provides a comparative evaluation of the predominant modeling frameworks used in biofilm research, assessing their capabilities, applications, and limitations for researchers and drug development professionals. We objectively compare the performance of agent-based, continuum, and hybrid approaches, supported by experimental data and implementation protocols.
Comparative Analysis of Modeling Frameworks
Table 1: Comparison of Primary Biofilm Modeling Approaches
| Model Type | Core Principles | Typical Applications | Key Advantages | Major Limitations |
|---|---|---|---|---|
| Agent-Based Models (Individual-Based) | Treats individual bacteria as discrete agents with specific rules for growth, division, and interaction [58]. | Simulating early microcolony development [58], studying the impact of mechanical forces on structure [58]. | Captures individual cell heterogeneity and stochasticity;直观地展示出群落结构涌现。 | Computationally intensive for large-scale biofilms; Relies on accurate parameterization of interaction rules [58]. |
| Continuum Models | Represents biofilm components (cells, EPS) as continuous densities governed by partial differential equations (PDEs) [59]. | Predicting bulk biomass growth [59], nutrient transport [59], and reaction to antimicrobials [57]. | Computationally efficient for large-scale systems; Well-suited for studying nutrient and chemical gradients [59]. | Oversimplifies biofilm structure; Does not capture individual cell-level events [59]. |
| Hybrid Models | Combines discrete agent-based elements for cells with continuum descriptions for diffusive substrates [59]. | Multiscale problems where both individual cell behavior and population-level dynamics are important [59]. | Balances computational efficiency with individual-level detail; More biologically realistic for many scenarios. | Increased model complexity; Can be challenging to implement and validate [59]. |
Table 2: Quantitative Performance Metrics of Different Models
| Model | Spatial Scale | Temporal Scale | Computational Demand | Key Predictions/Outputs |
|---|---|---|---|---|
| Hertzian ABM [58] | Microns (single cells) | Hours to days | Medium to High | Microcolony structural density, cell orientation patterns. |
| Nutrient-Dependent Continuum [59] | Millimetres (bulk biofilm) | Days | Low to Medium | Total biomass, persister cell fractions, nutrient concentration profiles. |
| Reaction-Diffusion [57] | Microns to millimetres | Hours to days | Low | Antimicrobial penetration, efficacy of removal strategies. |
Experimental Protocols for Model Validation
Protocol for Validating Structural Predictions of Agent-Based Models
Objective: To validate the structural properties (e.g., biovolume, substratum coverage) predicted by agent-based models (ABMs) against experimental data from confocal microscopy [51].
- Biofilm Cultivation: Grow biofilms in a controlled flow-cell system or on relevant substrates (e.g., polystyrene, coated surfaces) for 24-48 hours under defined nutrient conditions [60].
- Fluorescent Staining: Stain the biofilm with an appropriate fluorescent viability stain, such as the FilmTracer LIVE/DEAD Biofilm Viability Kit (SYTO 9 and propidium iodide) [51]. Alternative metabolic stains like CTC (5-cyano-2,3-ditolyl-tetrazolium chloride) can be used for active cells [60].
- Image Acquisition: Acquire 3D image stacks of the biofilm using a Confocal Laser Scanning Microscope (CLSM). Set the z-step to 2 μm, and use a 60× oil immersion objective with a numerical aperture of 1.4 for high resolution [60].
- Automated Image Analysis: Process the CLSM micrographs using an open-source tool like the "Biofilm Viability Checker" [51] or "bioImageL" [60].
- Using bioImageL: Input the image scale (e.g., 0.42 μm/pixel). Select a noise-reducing factor (NRF), which applies a standard deviation sigma in a scalar averaging filter. The threshold is then determined automatically using Otsu's method [60].
- The software segments the images to calculate parameters like biovolume (μm³), mean thickness (μm), and substratum coverage (%) [60].
- Data Comparison: Compare the experimentally measured structural parameters with those generated by the ABM simulations to validate the model's accuracy [58].
Protocol for Validating Nutrient-Dependent Phenotypic Switching Models
Objective: To validate model predictions of phenotypical shifts (e.g., to persister cells) under nutrient limitation [59].
- Controlled Biofilm Growth: Grow biofilms in continuous-flow reactors with defined media. Systematically vary the concentration of a limiting nutrient (e.g., carbon or nitrogen source) [59].
- Stress Induction and Sampling: At designated time points, expose biofilms to a high concentration of a relevant antibiotic (e.g., ciprofloxacin for Gram-negative bacteria) for a defined period to kill metabolically active cells. Subsequently, homogenize the biofilm and plate serial dilutions to enumerate the surviving persistent cells [59].
- Fluorescence In Situ Hybridization (FISH): Alternatively, use FISH with strain-specific probes to quantify the spatial distribution of different phenotypic states within the biofilm architecture [61].
- Model Calibration: Input the experimental nutrient conditions into the continuum model, which couples nutrient transport with the dynamics of proliferative bacteria, persisters, and dead cells. The model should incorporate switching rates between proliferative and persister states based on local nutrient concentration thresholds [59].
- Output Comparison: Compare the model's predictions for the proportion and spatial location of persister cells against the experimental CFU counts and FISH data [59].
Visualization of Modeling Workflows
Agent-Based Model Simulation Workflow
The following diagram illustrates the typical workflow for simulating biofilm growth using an agent-based modeling approach.
Continuum Model Simulation Workflow
The following diagram outlines the core structure of a nutrient-dependent continuum model for biofilm growth.
The Scientist's Toolkit: Essential Research Reagents and Materials
Table 3: Key Research Reagent Solutions for Biofilm Experimentation
| Reagent/Material | Function in Biofilm Research | Example Application in Model Validation |
|---|---|---|
| Flow-Cell System [60] | Provides a controlled environment for growing biofilms under shear stress, mimicking natural and clinical conditions. | Culturing standardized, reproducible biofilms for confocal imaging and analysis [60]. |
| CLSM (Confocal Laser Scanning Microscope) [60] [51] | Enables high-resolution, non-invasive 3D visualization of biofilm architecture and spatial organization. | Acquiring z-stack images for quantifying biovolume, substratum coverage, and live/dead distribution [60] [51]. |
| Fluorescent Viability Stains (e.g., SYTO 9, Propidium Iodide) [51] | Differentiates between cells with intact (live) and compromised (dead) membranes based on membrane integrity. | Assessing biofilm viability and quantifying the effect of antimicrobial treatments in validation experiments [51]. |
| Metabolic Activity Probes (e.g., CTC) [60] | Indicates metabolically active cells via reduction of the compound to a fluorescent formazan precipitate. | Segmenting and quantifying the actively respiring subpopulation within a heterogeneous biofilm [60]. |
| Image Analysis Software (e.g., bioImage_L, Biofilm Viability Checker) [60] [51] | Automates the quantification of structural parameters from CLSM micrographs, reducing human error and subjectivity. | Objectively measuring biovolume, mean thickness, and surface coverage for direct comparison with model outputs [60] [51]. |
The comparative analysis presented in this guide demonstrates that the selection of a biofilm modeling approach is fundamentally dictated by the research question and the scale of interest. Agent-Based Models excel at investigating the impact of individual cell interactions and mechanical forces on early biofilm structure [58]. In contrast, Continuum models are powerful tools for predicting bulk biomass growth and simulating the response of biofilms to environmental cues like nutrient limitation and antimicrobial agents on a larger scale [57] [59]. The emerging trend of hybrid multiscale models and the integration of machine learning for generating synthetic training data [62] represent the next frontier in biofilm modeling, promising to enhance predictive power and bridge the gap between individual cell behavior and population-level dynamics. A rigorous, iterative process of model validation against robust experimental data, as outlined in the protocols above, remains paramount for advancing the field and developing effective anti-biofilm strategies.
Biofilms, structured communities of microorganisms encased in an extracellular polymeric substance (EPS), represent a significant challenge in both industrial settings and clinical medicine [8]. Their inherent resistance to antimicrobial agents and host immune responses necessitates robust research models for developing effective countermeasures [63] [64]. The comparative evaluation of biofilm matrix research models is critical for advancing our understanding and treatment of biofilm-associated conditions. This guide provides a detailed comparison between two cornerstone approaches: the standardized CDC Biofilm Reactor, widely used for industrial and environmental testing, and the more clinically-relevant wound infection systems designed to mimic host-pathogen interactions in chronic wounds [65] [66] [67].
The CDC Biofilm Reactor offers a highly controlled, reproducible system for growing consistent biofilms on various surfaces, making it particularly valuable for standardizing disinfectant efficacy testing [66] [68]. In contrast, wound infection models range from simple in vitro systems to complex bioengineered platforms that incorporate host elements, aiming to recapitulate the pathological environment of non-healing wounds where biofilms impede the healing process [65] [67]. Understanding the capabilities, applications, and limitations of each model is essential for researchers and drug development professionals to select the appropriate system for their specific research questions.
CDC Biofilm Reactor
The CDC Biofilm Reactor is a standardized continuous-flow system used to grow reproducible and high-biomass biofilms for antimicrobial efficacy testing [66] [68]. Its fundamental principle involves creating constant hydrodynamic conditions and nutrient supply to support biofilm formation on various material coupons positioned within the reactor. This model is particularly recognized for its application in industrial and environmental microbiology, especially for evaluating disinfectants and anti-biofilm products on hard, non-porous surfaces [68]. The American Society for Testing and Materials (ASTM) has formalized methods such as ASTM E3161 (for biofilm growth) and ASTM E2871 (for efficacy testing) that utilize this reactor, which the U.S. Environmental Protection Agency (EPA) recommends for supporting public health claims against biofilms [68].
Wound Infection Systems
Wound infection biofilm models are designed to mimic the complex microenvironment of chronic wounds, such as diabetic foot ulcers and pressure injuries [65] [67]. Unlike the CDC reactor, these systems prioritize clinical relevance by replicating key aspects of the wound bed, including the 3D architecture of host tissues, the polymicrobial communities commonly found in wounds, and the host-pathogen interactions that define the infection state [67] [64]. A primary goal of these models is to create biofilms that grow in clusters within a matrix, rather than merely on a surface, to better resemble the in vivo situation observed in chronic wounds [65]. These models are essential tools for developing successful antibiofilm strategies and testing antimicrobial wound dressings [65] [63].
Table 1: Core Characteristics and Applications of Biofilm Models
| Feature | CDC Biofilm Reactor | Wound Infection Systems |
|---|---|---|
| Primary Principle | Constant flow and mixing under controlled hydrodynamic conditions [66]. | Simulation of the wound bed's 3D structure and polymicrobial, host-factors environment [65] [67]. |
| Key Applications | Standardized efficacy testing of disinfectants and antimicrobials; material research [66] [68]. | Development and testing of topical treatments, wound dressings, and antibiofilm strategies [65] [67]. |
| Model Output | High-biomass biofilm on material coupons for robust, reproducible log-reduction calculations [68]. | Biofilms growing in 3D clusters within a matrix, suitable for assessing treatment efficacy in a clinically relevant context [65]. |
| Regulatory Endorsement | EPA-recognized for public health claims against biofilm on hard, non-porous surfaces [68]. | No single standardized model, but actively developed for translational clinical research [65] [67]. |
Experimental Protocols and Methodologies
CDC Biofilm Reactor Protocol
The protocol for the CDC Biofilm Reactor is well-standardized, as outlined in ASTM E3161 and EPA MLB SOP MB-19 [66] [68]. The process begins with the preparation of the reactor, which is equipped with rods holding coupons of the material to be studied. A pure culture of a specific bacterium, such as Pseudomonas aeruginosa (ATCC 15442) or Staphylococcus aureus (ATCC 6538), is introduced into the reactor during a 24-hour batch phase, allowing for initial attachment [66]. Following this, the reactor switches to a continuous flow of a dilute nutrient medium (e.g., 100 mg/L Tryptic Soy Broth) for an additional 24 hours to promote the development of a mature biofilm under controlled shear stress [66]. After incubation, coupons are aseptically removed. The efficacy of an antimicrobial agent is then tested against the biofilm-grown coupons using the Single Tube Method (ASTM E2871), which involves exposing the coupon to the treatment, neutralizing the agent, and then recovering and quantifying viable bacteria to determine log reduction [68].
3D Chronic Wound Biofilm Model Protocol
A representative protocol for a polymicrobial 3D chronic wound biofilm model involves several key steps [65]. First, bacterial suspensions of relevant species (e.g., S. aureus, E. coli, and A. baumannii for a multispecies model, or P. aeruginosa for a monospecies model) are prepared and adjusted to a standardized optical density. A matrix is created by dissolving bacteriological agar (1.5%) and gelatin (1%) in a nutrient-rich medium. This agar/gelatin mixture is autoclaved, liquefied in a water bath, and then cooled to 43°C. The bacterial suspension is added to the molten matrix, and the mixture is vigorously shaken to incorporate air bubbles, which helps create a three-dimensional environment. Subsequently, 3 mL of this inoculated matrix is transferred into each well of a 12-well plate and cooled at 4°C to accelerate solidification. The models are then incubated for 48 hours at 37°C with 5% CO₂ to allow for the formation of a mature biofilm growing in clusters within the 3D matrix, simulating the in vivo chronic wound environment [65].
Diagram 1: A comparison of experimental workflows for the CDC Biofilm Reactor and a 3D wound infection model.
Comparative Performance and Experimental Data
Quantitative Efficacy Data
The two models are designed for different testing objectives, which is reflected in their performance metrics and data output. The CDC Reactor is geared toward generating precise, reproducible log-reduction values for regulatory submission, while wound models are used to detect relative differences in efficacy between treatments in a more complex, clinically-relevant setting.
Table 2: Comparison of Model Performance and Output Data
| Performance Aspect | CDC Biofilm Reactor | Wound Infection Systems |
|---|---|---|
| Typical Baseline Density | P. aeruginosa: 8.0-9.5 log10(CFU/coupon)S. aureus: 7.5-9.0 log10(CFU/coupon) [68]. | Data is model-specific; models are validated by demonstrating mature biofilm formation in clusters and differential response to treatments [65]. |
| Efficacy Benchmark | A minimum mean 6-log10 reduction in viable bacteria per coupon for EPA claims [68]. | Detects statistically significant differences in microbial load between treated and untreated groups or between different antimicrobial dressings [65]. |
| Sample Reproducibility | High, due to standardized conditions and coupons; low variability is a key feature [66] [68]. | Designed to be convenient with low variability, though inherently more variable than monospecies reactor models due to biological complexity [65]. |
| Key Quantitative Output | Log10 reduction in Colony Forming Units (CFU) [68]. | Log10 reduction in CFU, microscopic analysis of biofilm structure, and other culture-independent metrics [65]. |
Application-Specific Performance
In a study using a 3D wound model, treatment with polihexanide (PHMB) and silver-containing wound dressings demonstrated the model's ability to detect clear differences in the efficacy of these antimicrobial substances [65]. The model was able to distinguish the performance of various commercial dressings after a 24-hour incubation period on the mature biofilm, proving its suitability for screening anti-biofilm strategies for chronic wound treatment [65].
For the CDC Reactor, a study on UV LED inactivation of P. aeruginosa biofilms grown on various plumbing materials demonstrated its utility in industrial application research. The reactor produced robust biofilms that showed material-dependent log reduction values (from 0.851 to 2.05 CFU/cm²) after UV exposure, highlighting how material properties impact disinfection efficacy [66].
The Scientist's Toolkit: Key Research Reagents and Materials
The following table details essential materials and their functions for the featured biofilm models, providing a practical resource for laboratory setup.
Table 3: Essential Research Reagents and Materials for Featured Models
| Item | Function / Relevance | Application in Model |
|---|---|---|
| CDC Biofilm Reactor (CBR 90-1) | Core device providing controlled hydrodynamic conditions and coupon holders for consistent biofilm growth [66]. | Fundamental to the method. |
| Material Coupons | Surfaces (e.g., Polytetrafluoroethylene, Stainless Steel, Polycarbonate) representing real-world materials for biofilm growth and testing [66] [68]. | Placed inside the reactor; the substrate for biofilm. |
| Tryptic Soy Broth (TSB) | A nutrient-rich growth medium used to support robust bacterial growth and biofilm formation [66]. | Used in the batch and continuous flow phases of the reactor. |
| ASTM E2871 Neutralizer | A chemical solution (specific to the antimicrobial tested) used to halt the action of the disinfectant at the end of the contact time without harming the bacteria [68]. | Critical for accurate quantification of surviving cells after treatment. |
| Bacteriological Agar & Gelatin | Form a semi-solid 3D matrix that supports the development of biofilm clusters, mimicking the tissue environment of a wound [65]. | The scaffold for the 3D wound biofilm model. |
| Columbia Agar Plates | A general-purpose growth medium used for the cultivation and enumeration of a wide variety of fastidious microorganisms [65]. | Used for preparing initial bacterial suspensions and for viable cell counting after treatment. |
| 12-Well Cell Culture Plate | A standard multi-well plate that provides the vessel for solidifying and incubating the 3D biofilm model [65]. | The container for the 3D wound model during incubation and treatment. |
The choice between the CDC Biofilm Reactor and wound infection systems is not a matter of superiority, but of alignment with research goals. The CDC Biofilm Reactor is the definitive model for standardized efficacy testing and generating data for regulatory approval of disinfectants and antimicrobial surfaces intended for industrial and environmental applications [66] [68]. Its strength lies in its reproducibility, high biomass yield, and direct regulatory recognition.
In contrast, wound infection systems are specialized tools for translational and preclinical research. Their value is in modeling the clinical pathology of chronic wound biofilms, including polymicrobial interactions and growth within a 3D matrix [65] [67] [64]. These models are indispensable for screening the next generation of antimicrobial wound dressings and topical therapies under conditions that more faithfully represent the therapeutic challenge. Researchers must weigh the need for standardization against the requirement for clinical relevance when selecting the optimal model for their investigative aims.
High-Throughput Screening Models for Anti-biofilm Compound Discovery
Biofilms are complex, structured communities of microorganisms embedded in a self-produced extracellular polymeric matrix that demonstrate remarkable resistance to antimicrobial agents and host immune responses [27] [69]. This resilience makes biofilm-associated infections particularly challenging in clinical and industrial settings, contributing to chronic infections, medical device failures, and significant economic losses [70]. High-throughput screening (HTS) platforms have emerged as indispensable tools for discovering novel compounds that can inhibit biofilm formation or disrupt mature biofilms, thereby addressing a critical unmet need in antimicrobial therapy [71] [72] [73].
This guide provides a comparative evaluation of established and emerging HTS models used in anti-biofilm compound discovery. By objectively analyzing the performance characteristics, experimental protocols, and practical applications of each system, we aim to equip researchers with the necessary information to select appropriate screening platforms for their specific investigative contexts, ultimately accelerating the development of effective anti-biofilm therapeutics.
Comparative Analysis of HTS Platforms
The selection of an appropriate HTS platform significantly influences screening outcomes and translational potential. The table below compares the key performance characteristics of major biofilm screening systems.
Table 1: Performance Comparison of Biofilm HTS Platforms
| Screening Platform | Throughput Capacity | Key Measurable Parameters | Representative Hit Rates | Z-Factor (Robustness Metric) | Translational Application |
|---|---|---|---|---|---|
| 96-Well Microtiter Plate (Static) | High (3386 compounds screened) [71] | Planktonic growth inhibition, biofilm biomass (crystal violet), metabolic activity (resazurin) [71] [72] | 5.7% (excellent activity vs. planktonic); 0.14% (excellent activity vs. biofilm formation) [71] | 0.675 (range: 0.500-0.843) [71] | Drug repurposing, initial compound libraries screening [71] |
| Glass Bead Reactor | Medium-High (50 beads per run) [74] | Colony-forming units (CFUs)/mm², antibiotic susceptibility [74] | Significant bioburden reduction with antibiotics (e.g., tobramycin p=0.035 for P. aeruginosa) [74] | Not explicitly reported | Translation between in vitro and in vivo models, wound contaminant simulation [74] |
| CDC Biofilm Reactor | Low-Medium (24 coupons per run) [74] | CFUs/mm², antibiotic tolerance under shear stress [74] | Smaller differences in antibiotic response compared to bead reactor [74] | Widely validated but not explicitly reported for cited study | Standardized biofilm testing, antimicrobial efficacy under dynamic conditions [74] |
| Salmonella HTS (Static, 96-well) | High (1120 extracts screened) [72] | Total biomass (crystal violet), metabolic activity (resazurin), dispersal of preformed biofilm [72] | Identification of patulin as a potent antimicrobial against planktonic and biofilm cells [72] | Not explicitly reported | Natural product screening, detection of multiple activity types [72] |
Experimental Protocols for Key HTS Assays
96-Well Microtiter Plate Biofilm Screening
The 96-well microtiter plate platform represents one of the most widely implemented HTS approaches for anti-biofilm compound discovery due to its scalability, reproducibility, and compatibility with automated screening systems [71].
Protocol for Drug Repurposing Library Screening [71]:
- Bacterial Strain Preparation: Utilize relevant biofilm-forming strains (e.g., MRSA from cystic fibrosis patients). Grow overnight cultures in appropriate media and dilute to standardized optical density.
- Compound Library Preparation: Prepare compounds from repurposing libraries (e.g., Drug Repurposing Compound Library, MedChem Express) at working concentrations (e.g., 0.1 mM in DMSO).
- Inoculation and Incubation: Dispense 90 μL of bacterial inoculum into each well of 96-well plates prefilled with 10 μL of test compounds. Include controls: growth control (bacteria + DMSO), negative control (media only), and positive inhibition controls.
- Planktonic Growth Assessment: After incubation (e.g., 24h, 37°C), measure optical density (OD) spectrophotometrically to determine growth inhibition relative to untreated controls.
- Biofilm Biomass Quantification:
- Carefully remove planktonic cells and wash adherent biofilms gently with phosphate-buffered saline (PBS).
- Fix biofilms with absolute methanol or ethanol for 15 minutes.
- Stain with 0.1% crystal violet solution for 20 minutes.
- Wash excess stain and solubilize bound crystal violet with 33% acetic acid.
- Measure OD at 570-600 nm to quantify total biofilm biomass.
- Validation of Hits: Confirm efficacy of primary hits (e.g., those showing ≥90% inhibition) by cell viable count enumeration.
Quality Control Measures [71]:
- Calculate Z-factor to validate assay robustness: Z-factor = 1 - (3×(σp + σn)/|μp - μn|), where σp and σn are standard deviations of positive and negative controls, and μp and μn are their means. Z-factor >0.5 indicates excellent assay quality.
- Maintain coefficient of variation <10% and signal-to-background ratio >10-fold.
The glass bead reactor system provides a unique platform that bridges conventional in vitro screening and in vivo models, particularly relevant for simulating wound contamination scenarios.
Protocol for Biofilm Growth and Compound Screening:
- Reactor Setup: Place fifty 4mm diameter roughened borosilicate glass beads into a custom-machined stainless steel insert within a 100mm × 50mm Pyrex crystallizing dish.
- Inoculation and Dynamic Growth: Add bacterial inoculum (e.g., Staphylococcus aureus ATCC 6538, Pseudomonas aeruginosa ATCC 27853) in brain heart infusion (BHI) broth. Incubate at 37°C with low-shear rotation (40 rpm) for 24-48 hours.
- Compound Treatment: Transfer biofilms-grown beads to separate wells containing serial dilutions of test antibiotics or compounds in cation-adjusted Mueller Hinton broth (CAMHB).
- Biofilm Removal and Quantification:
- After treatment, transfer each bead to a microcentrifuge tube with 1mL PBS.
- Sonicate beads (e.g., 10-15 minutes) and vortex (1-2 minutes) to dislodge biofilms.
- Perform serial dilutions and plate on tryptic soy agar for CFU enumeration after 24h incubation at 37°C.
- Data Analysis: Calculate CFU/mm² and compare treatment groups to untreated controls to determine anti-biofilm efficacy.
The CDC Biofilm Reactor represents a gold standard for generating robust, reproducible biofilms under dynamic flow conditions that better simulate natural biofilm environments.
Standardized Operating Procedure:
- Reactor Assembly: Mount 24 borosilicate glass coupons (or other relevant substrates) in polypropylene reactor arms. Autoclave before use.
- Inoculation and Batch Phase: Aseptically add bacterial inoculum to sterile growth medium in reactor vessel. Operate in batch mode (no flow) for initial attachment phase (e.g., 2h, 37°C, 125-130 rpm stirring).
- Continuous Flow Phase: Connect reactor to medium reservoir via peristaltic pump. Initiate continuous flow of fresh medium (e.g., 8mL/min) for 48 hours to promote mature biofilm development under shear stress.
- Coupon Harvesting and Treatment: Aseptically remove coupons from reactor arms and transfer to well plates containing test compounds. Incubate for specified treatment duration.
- Biofilm Removal and Analysis: Vortex or sonicate coupons in neutralizing solution or PBS. Perform serial dilutions and plate for CFU enumeration.
Signaling Pathways in Biofilm Regulation
Biofilm development is tightly regulated through complex signaling networks that represent promising targets for therapeutic intervention. The diagram below illustrates the key regulatory pathways and potential intervention points.
Figure 1: Regulatory pathways controlling biofilm formation and dispersal. Key intervention points for anti-biofilm compounds include c-di-GMP signaling, quorum sensing systems, and matrix degradation enzymes [75] [76].
High-Throughput Screening Workflow
A systematic approach to HTS ensures efficient identification and validation of potential anti-biofilm compounds. The following diagram outlines a comprehensive screening workflow.
Figure 2: High-throughput screening workflow for anti-biofilm compound discovery, from initial screening to mechanism of action studies [71] [72] [73].
Essential Research Reagent Solutions
Successful implementation of HTS platforms requires specific reagents and materials optimized for biofilm research. The table below details key solutions and their applications.
Table 2: Essential Research Reagents for Biofilm HTS
| Reagent/Material | Function | Application Examples |
|---|---|---|
| Crystal Violet | Stains total biofilm biomass (cells and matrix) | Quantification of biofilm formation inhibition and preformed biofilm disruption in 96-well plates [71] [72] [27] |
| Resazurin | Metabolic activity indicator (blue→pink conversion) | Assessment of viable bacteria within biofilms; distinguishes bactericidal vs. bacteriostatic effects [72] |
| Drug Repurposing Compound Library | Collection of approved drugs with known safety profiles | Identification of novel anti-biofilm applications for existing therapeutics; accelerated development path [71] |
| Natural Product Extracts | Complex mixtures from microbial, plant, or marine sources | Discovery of novel chemical scaffolds with anti-biofilm activity; diverse chemical space exploration [72] |
| Roughened Glass Beads | High-surface-area substrate for biofilm growth | Bridge between in vitro and in vivo testing; simulation of wound contaminant debris [74] |
| CDC Biofilm Reactor Coupons | Standardized substrates for biofilm growth under shear | Reproducible generation of mature biofilms under physiologically relevant flow conditions [74] |
| Cation-Adjusted Mueller Hinton Broth | Standardized medium for antibiotic susceptibility testing | Evaluation of antibiotic efficacy against biofilm-grown bacteria; comparison to CLSI standards [74] |
| Dispersin B & DNase I | Matrix-degrading enzymes | Biofilm disruption by targeting specific matrix components (poly-N-acetylglucosamine, extracellular DNA) [69] |
High-throughput screening models represent powerful tools in the ongoing battle against biofilm-associated infections, which remain a significant clinical challenge worldwide. The comparative analysis presented in this guide demonstrates that each HTS platform offers distinct advantages: 96-well microtiter systems provide unparalleled throughput for initial compound screening, while specialized reactors like the glass bead and CDC Biofilm Reactor systems generate more physiologically relevant biofilms for secondary validation.
The integration of robust quality control metrics (such as Z-factor calculation), standardized experimental protocols, and appropriate reagent selection ensures reliable and reproducible screening outcomes. Furthermore, understanding the underlying regulatory pathways governing biofilm development enables more targeted therapeutic approaches. As the field advances, the combination of traditional HTS methods with emerging technologies—including artificial intelligence, nanomaterials, and CRISPR-based systems—promises to accelerate the discovery of novel anti-biofilm compounds that can effectively address the global challenge of antimicrobial resistance [70] [69].
Addressing Translational Gaps and Methodological Limitations
Microbial biofilms represent a critical global issue, impacting health, food security, water systems, and industrial processes with an estimated economic cost of $5 trillion USD annually [77]. Despite significant advances in understanding biofilm biology, a substantial gap persists between academic research and industrial application, hindering the development of effective anti-biofilm strategies. The multifactorial nature of biofilm development and drug tolerance imposes great challenges for conventional antimicrobials, indicating the need for multi-targeted or combinatorial therapies [78]. This translational gap arises from complex physical and biological properties with multiple microbial genetic and molecular factors, frequently involving multi-species interactions that complicate therapeutic development [78].
The Biofilm Research-Industrial Engagement Framework (BRIEF) emerges as a strategic response to these challenges, providing a two-dimensional system for classifying biofilm technologies according to their level of scientific insight and industrial utility [77]. This framework serves as a crucial bridge between industrial practices and academic research, addressing the urgent need for biofilm research to notice and react to industrially relevant issues to achieve transferable outputs [77]. By evaluating technologies along these complementary dimensions, BRIEF enables researchers and industry professionals to identify promising candidates for further development and investment, potentially accelerating the translation of biofilm research into practical solutions across healthcare, food safety, water security, and industrial processes.
Understanding the BRIEF Framework
Core Dimensions and Structure
The BRIEF framework organizes biofilm technologies along two primary dimensions: scientific insight and industrial utility. The scientific insight axis assesses the depth of understanding of the underlying biofilm system, ranging from empirical observations to mechanistic explanations of biofilm behavior at molecular, cellular, and community levels [77]. The industrial utility dimension evaluates how well technologies align with current industrial practices, accounting for factors such as scalability, cost-effectiveness, regulatory compliance, and integration into existing workflows [77] [79].
This two-dimensional approach creates a strategic landscape where technologies can be positioned according to their translational potential. The framework specifically aims to predict how biofilm technologies can evolve through Technology Readiness Levels (TRLs) by identifying those with optimal characteristics for successful translation [79]. Technologies scoring high on both dimensions typically represent the most promising candidates for near-term implementation, while those with high scientific insight but lower industrial utility may require further adaptation or demonstration to bridge the gap to application.
Strategic Application Across Sectors
The BRIEF framework evidences its utility through case studies across multiple sectors, including healthcare, food and agriculture, and wastewater treatment [77]. In healthcare, for instance, the framework helps evaluate antibiofilm strategies against the stringent regulatory requirements and clinical practicalities of medical settings. For food and agricultural applications, BRIEF assesses technologies against different imperatives such as food safety regulations, shelf-life considerations, and scalability for industrial processing. In wastewater management, the framework positions technologies according to their compatibility with existing infrastructure and cost-effectiveness at scale [77].
The framework operates within the broader context of the National Biofilms Innovation Centre's (NBIC) four strategic pillars: Prevent, Detect, Manage, and Engineer [79]. This integrated approach allows for comprehensive intervention strategies against problematic biofilms while harnessing beneficial biofilms for applications such as wastewater treatment, energy production, and industrial biocatalysis [79].
Comparative Analysis of Biofilm Research Models
Model Classification and Characteristics
Biofilm research employs diverse models that vary significantly in their complexity, physiological relevance, and translational potential. These can be broadly categorized into static models, flow-cell systems, and advanced 3D models that better mimic in vivo conditions [8]. Each category offers distinct advantages and limitations for specific research applications, with implications for their positioning within the BRIEF framework.
Static models, particularly 96-well microtiter plates, represent the most accessible and high-throughput approach for initial biofilm screening [8]. These systems operate without fluid flow, allowing biofilm formation on plastic surfaces during incubation periods. Biofilm quantification typically employs methods such as crystal violet staining for total biomass or colony counting for viable cells, though these approaches cannot distinguish between viable cells and matrix components [8]. While static models score high on industrial utility for their simplicity and scalability, they generally offer lower scientific insight due to their limited physiological relevance.
Flow-cell models introduce hydrodynamic conditions that better mimic natural environments where biofilms commonly form [8]. These systems include chemostats, drip flow reactors, rotating biofilm reactors, constant-depth film fermenters, and the modified Robbins device [8]. The Calgary Biofilm Device (CBD) represents a particularly valuable flow-cell model that provides a superior platform for minimum inhibitory concentration (MIC) studies against biofilms, forming structured communities on pegs that can be directly exposed to antimicrobial agents [8]. These systems typically offer enhanced scientific insight while maintaining reasonable industrial utility through standardized protocols.
Advanced 3D models have emerged to bridge the gap between conventional 2D models and in vivo experiments, offering physiological cell-to-cell contacts and more realistic microenvironments for studying host-pathogen interactions [16]. These include scaffold-based systems using hydrogels or rigid scaffolds, transwell systems with semipermeable membranes, and organotypic models that closely mimic native tissues [16]. Such models demonstrate high scientific insight but often present challenges for industrial utility due to their complexity, cost, and standardization requirements.
Quantitative Comparison of Model Systems
Table 1: Technical comparison of biofilm research models
| Model Type | Throughput | Physiological Relevance | Key Applications | Technical Complexity | Data Output |
|---|---|---|---|---|---|
| Static (96-well) | High | Low | Initial screening, antimicrobial efficacy | Low | Biomass quantification, viability counts |
| Flow-cell (CBD) | Medium | Medium | MIC determination, biofilm architecture | Medium | Structured communities, susceptibility testing |
| Advanced 3D | Low | High | Host-pathogen interactions, tissue integration | High | Spatial organization, cellular responses |
| In vivo animal | Very Low | Very High | Therapeutic validation, host response | Very High | Clinical relevance, systemic effects |
Table 2: BRIEF framework positioning of biofilm models
| Model System | Scientific Insight Score | Industrial Utility Score | Translational Potential | Primary Sector Application |
|---|---|---|---|---|
| Static Models | Low-Medium | High | Near-term | Broad sector applicability |
| Flow-cell Systems | Medium-High | Medium | Medium-term | Healthcare, industrial settings |
| Advanced 3D Models | High | Low-Medium | Long-term | Medical devices, clinical applications |
| In vivo Models | Very High | Very Low | Regulatory requirement | Pharmaceutical development |
Experimental Protocols for Key Biofilm Models
Standardized Static Model Protocol
The microtiter plate biofilm model represents a foundational method for high-throughput biofilm assessment [8]. The protocol begins with preparation of planktonic cultures adjusted to the desired concentration, typically OD600 ≈ 0.1, corresponding to approximately 10^8 CFU/mL for most bacterial species. Aliquots of 100-200 μL are transferred to polystyrene 96-well plates, followed by incubation under optimal growth conditions for 24-48 hours. Temperature, atmospheric conditions, and medium composition should reflect the specific research questions and microbial species under investigation.
Following incubation, non-adherent cells are removed by gentle rinsing with phosphate-buffered saline (PBS) or physiological saline. The remaining adherent biofilm can be quantified using multiple approaches. Crystal violet staining (0.1% w/v) applied for 15-30 minutes enables total biomass assessment after solvent elution and spectrophotometric measurement at 570-600 nm [8]. For viability assessment, biofilms can be disaggregated by sonication or scraping followed by serial dilution and plating on appropriate agar media for colony-forming unit (CFU) enumeration. Alternative approaches include metabolic assays such as resazurin reduction or ATP quantification for complementary data on biofilm activity.
Flow-Cell Model with Confocal Imaging
The flow-cell biofilm model provides superior architectural information and enables real-time observation of biofilm development [80]. The system typically consists of a flow chamber mounted on a microscope slide, connected via tubing to a medium reservoir and waste container, with a peristaltic pump controlling flow rates between 0.1-0.5 mL/min to generate relevant shear forces [80]. Inoculation occurs by injecting a stationary-phase bacterial suspension (OD600 ≈ 0.1) into the stopped flow system and allowing initial attachment during a 1-2 hour incubation period without flow.
Following initial attachment, medium flow is initiated to promote biofilm development under controlled hydrodynamic conditions. For time-lapse imaging, confocal laser scanning microscopy (CLSM) with appropriate fluorescent tags or stains enables non-invasive optical sectioning of hydrated biofilms [80]. Optimal experimental design must balance temporal resolution with phototoxicity concerns, typically acquiring images at 15-30 minute intervals for 4-24 hours. Image analysis quantifies parameters such as biofilm thickness, biovolume, surface coverage, and structural complexity using software like COMSTAT, ImageJ, or proprietary packages [80].
Statistical considerations from analysis of 16 independent CLSM experiments reveal that variability differs substantially between growth phases (lag vs. exponential) and changes as a function of treatment efficacy [80]. This informed recommendations for optimal experimental designs, including appropriate numbers of independent experiments, fields of view, and frame capture rates to achieve statistical confidence while maintaining data quality.
Emerging Technologies and Innovative Approaches
Advanced Detection and Engineering Strategies
Recent advances in biofilm research include innovative detection technologies that provide unprecedented resolution of biofilm properties and dynamics. Resonant hyperspectral imaging enables real-time monitoring of bacterial attachment and microcolony formation, capturing the underside of biofilms with exceptional clarity during early development stages [79]. Similarly, ratiometric fluorescent pH-sensitive nanosensors permit visualization of pH changes within biofilm microenvironments, revealing metabolic activity and microniche formation with high spatial and temporal resolution [79].
For mechanical characterization, multiple particle tracking (MPT) employs nanoparticles of varying charge and size to quantify diffusion and viscoelastic properties within the biofilm matrix [79]. This approach offers valuable insights into how antibiotic treatments alter the physical properties of antimicrobial-resistant bacterial biofilms, serving as a pre-clinical screening tool for new antibiofilm strategies [79]. These advanced detection methods significantly enhance scientific insight but often face challenges in industrial utility due to specialized equipment requirements and operational complexity.
Engineering approaches increasingly focus on beneficial biofilm applications, particularly in environmental biotechnology. Microbial electrosynthesis (MES) harnesses biofilms for sustainable conversion of CO2 to valuable organic chemicals at the cathodes of bio-electrochemical systems [79]. Optimization strategies manipulating applied potential and inorganic carbon sources demonstrate enhanced efficiency by affecting biofilm development and microbial composition, highlighting the potential for engineered biofilms in carbon capture and utilization [79].
Therapeutic Innovations and Translational Approaches
Novel therapeutic strategies are evolving to address the unique challenges posed by biofilm-associated infections. Drug delivery systems represent a promising approach to overcome biofilm resistance mechanisms, with nanocarriers designed to respond to biofilm-specific microenvironments [81]. Charge-reversible delivery systems maintain negative charge in physiological environments for circulatory stability but switch to positive charge in the slightly acidic biofilm interior to promote penetration [81]. Similarly, dual corona polymer vesicles incorporating antimicrobial peptides and poly(ethylene oxide) chains exhibit enhanced penetration into biofilm interiors while maintaining protein-repelling properties [81].
Bacteriophage therapy continues to advance with innovative adaptation strategies to enhance efficacy against biofilm populations. Directed evolution of phages in biofilm environments rather than planktonic cultures produces mutants with improved recognition of heterogeneous populations within biofilms [82]. For instance, biofilm-adapted Pseudomonas phage mutants demonstrate enhanced control of biofilms in vitro under conditions mimicking the cystic fibrosis lung environment, attributed to mutations in tail fiber and baseplate genes that improve adsorption and enable recognition of truncated lipopolysaccharide variants [82].
Alternative antimicrobial sources include antimicrobial peptides derived from under-explored microbiomes, such as those from the rumen microbiome showing effectiveness against Pseudomonas aeruginosa biofilms with low cytotoxicity [79]. Similarly, phage components like endolysins demonstrate efficacy against Gardnerella vaginalis in both single-species and polymicrobial biofilms without affecting commensal flora or driving resistance emergence [79].
The Scientist's Toolkit: Essential Research Reagents and Materials
Table 3: Key research reagents and materials for biofilm research
| Reagent/Material | Function | Application Examples | Considerations |
|---|---|---|---|
| Crystal Violet (0.1%) | Total biomass staining | Microtiter plate assays, biofilm quantification | Does not distinguish viable cells |
| Resazurin Solution | Metabolic activity indicator | Viability assessment, biofilm activity | Complementary to CFU counting |
| Live/Dead Staining Kits | Cell viability differentiation | CLSM imaging, treatment efficacy | Photobleaching concerns |
| Polystyrene Microplates | Biofilm growth surface | High-throughput screening, antimicrobial testing | Surface properties affect attachment |
| Flow Cell Chambers | Controlled hydrodynamic growth | Biofilm architecture analysis, real-time imaging | Custom configurations possible |
| Synthetic Sputum Medium | In vivo-like conditions | Pathogen biofilm studies, antibiotic testing | Enhances clinical relevance |
| Mucin-Coated Surfaces | Mucosal surface mimicry | Host-pathogen interaction studies | Concentration-dependent effects |
| Enzyme-Based Matrix Dispersants | EPS disruption | Matrix role studies, combination therapies | Species-specific efficacy |
The BRIEF framework provides an essential structure for navigating the complex landscape from fundamental biofilm research to practical application, addressing the critical translational gap that has long hindered antibiofilm strategy development. As biofilm research continues to evolve, emerging technologies including big data integration and machine learning promise to significantly enhance analytical capabilities and foster innovation [31]. Similarly, advanced 3D models that better recapitulate native tissue environments offer unprecedented opportunities to study host-pathogen interactions and test novel therapeutic approaches while reducing reliance on animal models [16].
Future advances will likely depend on interdisciplinary approaches that integrate knowledge from materials science, engineering, microbiology, and clinical practice. The identification of 78 priority questions through computational analysis of input from the international biofilm research community highlights key focus areas, including biofilm control and disruption, resistance mechanisms, model system standardization, polymicrobial interactions, clinical diagnostics, and matrix biology [83]. Addressing these questions through collaborative efforts that engage stakeholders across academia and industry will be essential for realizing the full potential of biofilm research to address global challenges in health, environment, and industry.
Successful translation will require continued development of frameworks like BRIEF that explicitly bridge the research-industrial divide, fostering dialogue and collaboration between these complementary domains. By strategically positioning technologies according to both scientific insight and industrial utility, the biofilm research community can more effectively allocate resources toward the most promising approaches for preventing, detecting, managing, and engineering biofilms to address pressing societal needs.
Microorganisms exist primarily in two distinct phenotypic states: the free-floating, planktonic form and the surface-attached, sessile form known as a biofilm [84] [85]. This duality presents a fundamental challenge for microbiological testing, as microbial behavior, metabolic activity, and resistance mechanisms differ dramatically between these states [85]. While traditional antimicrobial susceptibility testing (AST) has largely been optimized for planktonic cells, approximately 80% of bacterial infections in the human body are associated with biofilms [86]. This discrepancy highlights a critical translational gap between conventional laboratory practices and clinical reality, particularly for implant-associated infections, chronic wounds, and persistent foodborne contamination [87] [85] [88].
The standardization of testing protocols is further complicated by the intrinsic characteristics of sessile communities. Biofilms are structured microbial communities encased in a self-produced extracellular polymeric substance (EPS) matrix composed of polysaccharides, proteins, and extracellular DNA [84] [85]. This matrix creates a diffusion barrier, promotes nutrient gradients, and facilitates the development of metabolically heterogeneous subpopulations, including dormant "persister" cells [8]. These features collectively contribute to enhanced tolerance to antimicrobial agents and the host immune response, rendering therapies developed against planktonic cells often ineffective against biofilm-associated infections [85] [89].
This guide systematically compares the experimental models, metabolic profiles, and resistance mechanisms relevant to planktonic and sessile microbial testing. By objectively evaluating the methodologies and challenges inherent to both systems, we aim to provide researchers with a framework for developing more predictive and clinically relevant testing protocols.
Experimental Models for Planktonic and Sessile Studies
Established Laboratory Models
Research models designed to study planktonic and sessile cells vary significantly in their complexity, scalability, and clinical relevance. The choice of model system profoundly influences the experimental outcomes and their translational potential.
Table 1: Comparison of Common Biofilm Models Used in Research
| Model Type | Key Features | Applications | Advantages | Limitations |
|---|---|---|---|---|
| Static Models (e.g., 96-well microtiter plates) [8] | Biofilms form on polystyrene surfaces under non-flow conditions; biomass often quantified by crystal violet staining. | Initial biofilm screening, antimicrobial susceptibility testing. | High-throughput, simple, cost-effective, reproducible. | Does not simulate fluid shear forces; may not form complex 3D architecture. |
| Flow-Cell Models [8] | Continuous flow of nutrients over surface; can be coupled with microscopy for real-time observation. | Study of biofilm structure, development, and disintegration. | Allows for real-time monitoring; forms more natural, mature biofilms. | Lower throughput, more complex setup, requires specialized equipment. |
| Drip Flow Reactor (DFR) [36] | Biofilms grow on surfaces under low-shear conditions with continuous nutrient supply. | Studying biofilms on surfaces like medical device materials. | Simulates low-shear environments; good for surface-associated studies. | Protocol optimization needed for different materials [36]. |
| CDC Biofilm Reactor (CDC-BR) [36] | High shear force model where biofilms grow on coupons suspended in a stirred batch reactor. | Evaluating disinfectant efficacy on mature biofilms. | Highly reproducible, generates uniform, high-level biofilms. | High shear may not represent all clinical environments [36]. |
| Calgary Biofilm Device (CBD) [8] | Uses a peg lid immersed in media; creates multiple identical biofilms for AST. | Determining the Minimum Biofilm Eradication Concentration (MBEC). | Standardizes biofilm production for high-throughput AST. | Peg geometry may influence biofilm structure. |
| Animal Models (e.g., subcutaneous mesh, tibial pin) [89] | Implants coated with or inoculated by bioluminescent bacteria are surgically placed in animals. | In vivo study of host-pathogen interactions and therapeutic efficacy. | Includes host immune system factors; permits longitudinal monitoring via BLI. | Expensive, ethically constrained, high technical skill required. |
Model Selection and Workflow
The selection of an appropriate model should be guided by the specific research question. For instance, the DFR and CDC-BR models have been successfully used to establish reproducible biofilms on reusable stainless steel medical device materials, providing an upper limit of contamination from which cleaning and disinfection can be assessed [36]. Furthermore, the subcutaneous mesh implant model in mice has demonstrated superior performance for longitudinal studies of biofilm infections using bioluminescent imaging, showing consistent signal for over 35 days and a strong correlation with bacterial counts [89].
The following diagram illustrates a generalized experimental workflow for developing and analyzing biofilms in comparison to planktonic cultures, integrating common models and endpoints.
Metabolic and Molecular Divergence Between States
Differential Metabolic Pathways
Advanced metabolomic and transcriptomic analyses have revealed profound physiological differences between planktonic and sessile cells. A comparative metabolomic study on Salmonella Enteritidis presumptively identified 121 metabolites that were differentially regulated between the two states [84]. Pathway enrichment analysis pinpointed significant alterations in 11 key metabolic pathways.
Table 2: Key Metabolic Differences Between Planktonic and Sessile Cells
| Metabolic Characteristic | Planktonic Cells | Sessile (Biofilm) Cells |
|---|---|---|
| Representative Metabolites | Proline, phenylalanine, putrescine, cadaverine [84] | Lysine, adenosine, purines, pyrimidines, citrate [84] |
| Primary Metabolic Functions | Precursors for essential metabolites, stress adaptation, growth, and cell stability [84] | Maintaining cellular homeostasis, stress response, metabolic regulation [84] |
| Key Upregulated Pathways | Purine and pyrimidine metabolism, Arginine and proline metabolism, Vitamin B6 metabolism [84] | |
| Transcriptomic Response to Stress | General stress response mechanisms [86] | Upregulation of flagellar assembly, chemotaxis, fructose/mannose metabolism, and Phosphotransferase System (PTS) [86] |
Mechanisms of Antimicrobial Resistance
The resistance of biofilms to antimicrobials is multifactorial, not stemming from a single mechanism but from a combination of collective traits [85]:
- Physical Barrier Role of EPS: The extracellular matrix acts as a diffusion barrier, hindering the penetration of antimicrobial agents and immune cells [85].
- Metabolic Heterogeneity: Gradients of nutrients, oxygen, and waste products within the biofilm create diverse microenvironments. This leads to zones of slow-growing or dormant cells (persisters) that are highly tolerant to conventional antibiotics which typically target rapidly dividing cells [8].
- Altered Microenvironment: The metabolic activity of cells in the biofilm can create a localized acidic or hypoxic environment that reduces the efficacy of some antibiotics [85].
- Activation of Stress Responses: Sessile cells exhibit a distinct transcriptional profile, including upregulated stress response pathways that enhance their overall resilience [86]. For instance, under nutritional stress, biofilm cells of Listeria monocytogenes significantly upregulate genes related to flagellar assembly and nutrient transport systems like the PTS, optimizing survival under scarcity [86].
The following diagram synthesizes the key metabolic and resistance mechanisms that differentiate biofilm cells from their planktonic counterparts, based on omics studies.
Methodological Protocols and Technical Challenges
Cultivation and Sample Preparation
Planktonic Culture Protocol [84]:
- Inoculation: Standardized overnight culture is used to inoculate fresh liquid medium (e.g., M63 for Salmonella) to a concentration of ~5 × 10^6 CFU/mL.
- Growth: Incubation is carried out for a short duration (e.g., 3 hours) at 37°C with vigorous shaking (200 rpm) to maintain aerobic conditions and prevent cell settling.
- Harvesting: Cells are harvested during the exponential growth phase by centrifugation (e.g., 4000 × g for 10 min at 4°C) and washed to remove media components.
Sessile (Biofilm) Culture Protocol [84] [36]:
- Surface Preparation: Biofilms are formed on relevant abiotic surfaces (e.g., glass coupons, stainless steel chips, polypropylene mesh) or in microtiter plates.
- Inoculation & Maturation: Surfaces are inoculated with a standardized cell suspension and incubated for an extended period (e.g., 24-48 hours) at the desired temperature without shaking to allow for attachment and matrix production.
- Harvesting: Non-adherent cells are removed by rigorous washing. Biofilm-associated cells are then detached from the surface mechanically (e.g., scraping, vortexing with beads) or via sonication [87]. Sonication applies low-frequency ultrasound energy to dislodge sessile bacteria from the implant surface, and the resulting fluid is cultured to quantify viable bacteria [87].
The Sonication Method for Implant-Associated Biofilms
Sonication has become a critical method for diagnosing implant-associated infections. The process involves [87]:
- Implant Removal: The explanted device (e.g., prosthetic joint, cardiac device) is placed aseptically into a sterile container.
- Sonication: The container is filled with a sterile fluid (e.g., Ringer's solution) and subjected to sonication in a water bath. Common parameters include sonication for 1-5 minutes at a power of 0.22 ± 0.04 W/cm².
- Concentration & Culture: The sonication fluid is optionally centrifuged to concentrate the bacteria, then cultured on solid and liquid media. A diagnostic cut-off (e.g., >5 Colony-Forming Units (CFUs) per mL for prosthetic joint infections) is used to differentiate infection from contamination [87]. This method has demonstrated higher sensitivity than traditional periprosthetic tissue culture, particularly in patients who have received antimicrobial therapy [87].
Challenges in Antimicrobial Susceptibility Testing (AST) for Biofilms
Standard AST protocols face significant challenges when applied to biofilms and natural products [90]:
- Lack of Specific Guidelines: AST guidelines from CLSI and EUCAST are optimized for hydrophilic antibiotics, while many bioactive plant-derived compounds (e.g., polyphenols) are lipophilic. This necessitates method adjustments, compromising standardization [90].
- Absence of Breakpoints: Interpretation criteria (breakpoints) for susceptibility to natural compounds are not established. Studies use varying MIC cut-offs (e.g., <100 µg/mL for pure compounds is considered significant), making cross-study comparisons difficult [90].
- Solvent Interference: Solvents like ethanol or DMSO used to dissolve plant extracts can themselves inhibit bacterial growth or protect bacteria from antimicrobials, complicating result interpretation [90].
- Inoculum Size: The bacterial inoculum size is a critical variable, with larger inocula and longer incubation times leading to higher MICs, underscoring the need for strict standardization [90].
Essential Research Reagent Solutions
The following toolkit details key reagents and materials essential for conducting standardized comparative studies of planktonic and sessile cells.
Table 3: Research Reagent Solutions for Microbial State Studies
| Reagent/Material | Function/Application | Specific Examples & Notes |
|---|---|---|
| Standardized Growth Media | Supports reproducible growth of planktonic and biofilm cultures. | M63 medium [84]; Tryptic Soy Broth (TSB) [36]; Meat Experimental System (MES) for foodborne pathogens [91]. |
| Surface Substrates | Provides surface for biofilm attachment, mimicking environmental conditions. | Glass coupons [84]; Stainless steel coupons (316 series) [36]; Polypropylene surgical mesh [89]; Polystyrene microtiter plates [8]. |
| Detachment Agents | Liberates sessile cells from biofilm matrix for quantification and analysis. | Sonication devices (e.g., 0.22 W/cm² for 5 min) [87]; Chemical solvents for metabolite extraction (50% cold methanol, 50% acetonitrile) [84]. |
| Viability Stains & Molecular Kits | Differentiates live/dead cells and enables 'omics' analyses. | Crystal violet for total biofilm biomass [8]; RNA/DNA extraction kits for transcriptomics [86]; Proteomics reagents for LC-MS analysis [84] [91]. |
| Reference Bacterial Strains | Ensures experimental consistency and enables quality control. | Strains from recognized collections (e.g., ATCC 13076, NCTC 12900) with known genotype and phenotype [84] [90] [91]. |
The stark physiological contrast between planktonic and sessile microbial lifestyles necessitates a fundamental shift in how we design and standardize microbiological testing protocols. Relying on planktonic-based AST and diagnostic methods, which form the backbone of many current standards, is insufficient for managing the pervasive challenge of biofilm-associated infections and contaminations [88]. The translation of biofilm research from the lab to the clinic and industry is hampered by this disconnect, a gap that the Biofilm Research-Industrial Engagement Framework (BRIEF) seeks to address [88].
Future progress hinges on the widespread adoption of standardized, biofilm-specific models and methods that accurately reflect the in vivo conditions and constraints. This includes the implementation of validated biofilm reactors for efficacy testing, the development of consensus AST guidelines for sessile cells, and the integration of advanced omics technologies to unravel the complex biology of biofilms. By embracing these more relevant and predictive testing paradigms, researchers and drug development professionals can accelerate the discovery of novel anti-biofilm strategies and diagnostics, ultimately improving outcomes in healthcare, food safety, and industrial biotechnology.
Within the field of biofilm matrix research, the accurate sampling and recovery of microbial communities from surfaces is a critical prerequisite for meaningful analysis. Biofilms, structured communities of microorganisms encased in an extracellular polymeric substance (EPS), exhibit significant resistance to removal from surfaces, posing a substantial challenge for researchers and industrial professionals alike [92] [8]. The efficacy of the initial sampling method directly influences the reliability of subsequent microbiological and physicochemical characterizations, making the selection of an appropriate technique a fundamental consideration in experimental design [92]. This guide provides a comparative evaluation of four prominent sampling methods—swabbing, scraping, sonication, and sonic brushing—framed within the broader context of optimizing biofilm research models for drug development and scientific discovery.
The complexity of biofilm architecture, reinforced by a matrix of polysaccharides, proteins, and extracellular DNA, necessitates robust dislodgement techniques that can overcome strong cell-cell and cell-substrate interactions [92] [93]. Inadequate sampling can lead to biased data, underestimation of microbial load, and misrepresentation of the community structure, ultimately compromising the validity of research outcomes [92]. Therefore, a detailed understanding of the relative performance, applications, and limitations of available sampling methods is essential for advancing comparative evaluation in biofilm research.
Key Biofilm Sampling Methods and Experimental Protocols
- Swabbing: This conventional technique involves physically rubbing a sterile swab (often cotton or foam) across a surface to collect microorganisms. Its efficacy is limited for robust biofilms, as bacteria can remain trapped within the EPS matrix, leading to low recovery rates [92] [94]. It is simple and convenient but may not adequately detach the entire biofilm [92].
- Scraping: A more rigorous mechanical method that uses a spatula or similar tool to manually dislodge the biofilm from the substrate. This approach can generate high recovery yields comparable to standard methods like ultrasonication [92] [95].
- Sonication (Ultrasonication): This standard method employs high-frequency sound waves (e.g., 40-45 kHz) in an ultrasonic water bath to create cavitation bubbles that disrupt the biofilm structure and detach sessile cells from surfaces, including crevices [92]. It is often used as a benchmark in comparative studies due to its high and reproducible recovery rates [92] [95].
- Sonic Brushing: This technique incorporates both physical brushing motion and fluid dynamics generated by sonic vibrations to dislodge biofilms. Inspired by sonic toothbrushes, it can effectively remove biofilm from surfaces, though its efficiency in releasing cells into suspension for analysis may be inferior to other methods [92].
Detailed Experimental Protocol for Method Comparison
The following representative protocol, adapted from a standardized comparative study, outlines the procedure for evaluating the sampling efficiency of different methods on biofilms grown in a CDC Biofilm Reactor (CBR) [92] [96].
1. Biofilm Formation: * Strain and Culture: An overnight culture of Pseudomonas azotoformans PFl1A (or other relevant biofilm-forming strain) is prepared in Tryptic Soy Broth (TSB) or a relevant growth medium like sterile skim milk, incubated at 30°C with shaking [92]. * CDC Biofilm Reactor (CBR): The reactor is charged with 340 mL of inoculated medium and operated with stainless-steel coupons (e.g., 316 grade, 76 mm × 15 mm) as the substrate [92] [95]. * Growth Conditions: The system is initially run in batch mode for 24 hours at 30°C and 130 rpm. It is then switched to continuous mode, with fresh medium fed at a flow rate of 11.3 mL/min for an additional 24 hours [92].
2. Pre-Sampling Preparation: * Rinsing: Before harvesting, each coupon is rinsed three times by immersion in Phosphate-Buffered Saline (PBS) to remove loosely attached planktonic cells [92].
3. Sampling Procedures: * Ultrasonication (Standard Method): The coupon is vortexed in PBS for 30 seconds, then sonicated in an ultrasonic water bath (e.g., 40 kHz, 110 W) for 30 seconds. This cycle is repeated three times to dislodge bacteria and achieve a homogeneous cell suspension [92]. * Swabbing: The surface is rubbed thoroughly with a sterile swab (e.g., 6-inch cotton swab) soaked in PBS. The swab tip is then detached into a tube containing PBS, which is subsequently vortexed and sonicated as described above [92] [96]. * Scraping: Biofilm is manually dislodged from the coupon surface using a sterile spatula [92] [95]. * Sonic Brushing: A sonic toothbrush is used to brush the coupon surface, leveraging both physical contact and fluid dynamics for biofilm removal [92].
4. Analysis of Sampling Efficiency: * Cell Enumeration: The resulting suspensions from each method are serially diluted and plated on appropriate agar. After incubation, colonies are counted to determine the total viable count, typically expressed as Log CFU/cm² [92]. * Microscopy: Scanning Electron Microscopy (SEM) is used to visually assess the removal efficacy and the condition of the surface post-sampling [92].
Comparative Performance Data
The quantitative and qualitative data below provide a consolidated overview of the relative performance of each sampling method, directly informing selection for research applications.
Table 1: Quantitative Comparison of Sampling Method Efficiency on TSB-grown Biofilms
| Sampling Method | Mean Total Viable Count (Log CFU/cm²) | Statistical Significance (vs. Ultrasonication) |
|---|---|---|
| Ultrasonication | 8.74 ± 0.02 | Benchmark [92] |
| Scraping | 8.65 ± 0.06 | Not Significant [92] |
| Sonic Brushing | 8.60 ± 0.00 | Significantly Lower (p < 0.05) [92] |
| Swabbing | 8.57 ± 0.10 | Significantly Lower (p < 0.05) [92] |
Table 2: Qualitative Assessment of Biofilm Sampling Methods
| Sampling Method | Ease of Use | Efficacy on Robust Biofilms | Cell Release into Suspension | Practicality for Industrial Equipment |
|---|---|---|---|---|
| Ultrasonication | Low (Requires lab equipment) | High | High | Low [92] |
| Scraping | Medium | High | High | Medium |
| Sonic Brushing | Medium | Effective removal observed [92] | Lower than ultrasonication [92] | Potentially High |
| Swabbing | High | Low | Low | High |
Workflow and Logical Relationships
The following diagram illustrates the logical sequence and key decision points for comparing biofilm sampling methods, from initial setup to final analysis.
The Scientist's Toolkit: Essential Research Reagents and Materials
Successful execution of biofilm sampling studies requires specific reagents and equipment. The following table details key materials and their functions within the experimental workflow.
Table 3: Essential Research Reagents and Materials for Biofilm Sampling Studies
| Item | Function/Application | Example from Literature |
|---|---|---|
| CDC Biofilm Reactor (CBR) | Dynamic system for growing reproducible, mature biofilms under controlled shear stress [92] [95]. | CBR 90 (BioSurface Technologies Corp.) [92] |
| Stainless Steel Coupons | Common substrate mimicking industrial surfaces; provides a standardized surface for biofilm growth [92]. | 316 grade, 76 mm × 15 mm slides [92] |
| Tryptic Soy Broth (TSB) | A general-purpose nutrient-rich growth medium for cultivating a wide range of bacteria, including Pseudomonas [92]. | Bacto TSB (BD Canada) [92] |
| Phosphate-Buffered Saline (PBS) | An isotonic solution for rinsing coupons to remove planktonic cells and for suspending sampled biofilms without damaging cells [92]. | 137 mM NaCl, 2.7 mM KCl, 8 mM Na2HPO4, 2 mM KH2PO4 [92] |
| Ultrasonic Water Bath | Applies high-frequency sound waves for sonication-based biofilm detachment; considered a standard for comparison [92]. | Branson CPX2800H (40 kHz, 110 W) [92] |
| Sonic Toothbrush | Device for sonic brushing method, combining physical abrasion with fluid shear stress for biofilm removal [92]. | N/A (Commercial device) [92] |
The comparative data presented in this guide underscore that the choice of biofilm sampling method significantly impacts the recovery efficiency and, consequently, the analytical results. While ultrasonication remains the laboratory benchmark for its high and reproducible cell recovery, its practicality for in-situ use on industrial equipment is limited [92]. Scraping offers a robust mechanical alternative with statistically comparable recovery rates, making it a viable option in many research contexts [92] [95].
Conversely, conventional swabbing, despite its simplicity and widespread use, demonstrates significantly lower efficacy for recovering well-established biofilms and should be applied with caution when quantitative accuracy is critical [92] [97]. Sonic brushing effectively removes biofilm from surfaces, as confirmed by microscopy, but may not guarantee superior cell release into suspension compared to ultrasonication or scraping [92].
Emerging hybrid technologies, such as the sonicating synthetic sponge which combines physical wiping with in-situ sonication, show promise as practical alternatives for industrial settings, achieving dislodgment efficacy on par with standard ultrasonication methods [92]. For researchers designing studies within the framework of biofilm matrix research, aligning the sampling method with the specific research question—whether it requires maximum cell recovery for omics analyses or a practical approach for environmental monitoring—is paramount for generating reliable and meaningful data.
Reconciling Simplified Laboratory Models with Complex In Vivo Biofilm Environments
Biofilms, structured communities of microorganisms encased in an extracellular polymeric substance (EPS), represent a significant challenge in both clinical medicine and industrial settings [85]. Researchers face a fundamental paradox: how to reconcile the controlled, simplified conditions of laboratory models with the immense complexity of in vivo biofilm environments [88] [98]. This reconciliation is critical because biofilms grown in vivo are generally much smaller and lack the characteristic architecture seen in in vitro models, often consisting of smaller aggregates of cells (5–200 µm in diameter) rather than large, structured biofilms [98]. Furthermore, the EPS of in vivo biofilms integrates host-derived materials such as fibrin, collagen, and host nucleic acids, creating a composite structure rarely replicated in laboratory settings [98]. The translational failure of many anti-biofilm strategies highlights the urgency of bridging this gap, as biofilms are implicated in over 80% of chronic wounds and 65-80% of all human infections [85] [99]. This guide provides a comprehensive comparison of biofilm research models, evaluating their performance characteristics, experimental applications, and capacity to mimic real-world biofilm environments.
Comparative Analysis of Biofilm Research Models
Model Classification and Fundamental Characteristics
Biofilm models can be broadly categorized into three distinct groups based on their structural and functional complexity [99]. Static models (e.g., microtiter plates, colony biofilms) operate with limited nutrient replenishment and no fluid dynamics, making them suitable for high-throughput screening but physiologically simplistic [99] [8]. Dynamic models (e.g., flow cells, CDC biofilm reactors, drip flow reactors) introduce fluid shear forces and continuous nutrient exchange, better mimicking natural and clinical environments where flow conditions influence biofilm structure and function [99]. In vivo models (e.g., mammalian tissue infection models, foreign-body infection models) incorporate the full complexity of host-pathogen interactions, including immune responses and host-derived matrix components, but present significant ethical, technical, and financial challenges [98].
Table 1: Classification and Characteristics of Fundamental Biofilm Models
| Model Type | Key Examples | Operational Principle | Advantages | Limitations |
|---|---|---|---|---|
| Static Models | 96-well microtiter plates, Colony biofilms [99] [8] | Limited nutrient replenishment, no fluid dynamics [99] | Simple, cost-effective, high-throughput screening, amenable to genetic tests [99] [8] | Does not mimic physiological flow conditions, limited physiological relevance [88] |
| Dynamic Models | Flow cells, CDC biofilm reactors, Drip flow reactors, Modified Robbins device [99] | Continuous nutrient flow, controlled shear forces [99] | Enables real-time observation, mimics natural/clinical flow conditions, controls environmental parameters [99] | Requires specialized equipment, technical expertise, less suited for high-throughput analysis [99] |
| In Vivo Models | Mammalian tissue infection models, Foreign-body infection models [98] | Incorporates host environment and immune responses [98] | Provides full host-pathogen complexity, clinically relevant microenvironments [98] | Ethical concerns, high cost, host variability, technical complexity, requires high inoculum [98] |
Quantitative Performance Comparison Across Model Systems
The translational utility of biofilm models can be evaluated through their resistance profiles against antimicrobial agents, a key characteristic of clinical biofilms. Comparative studies have demonstrated significant disparities between planktonic assays still used in industrial standards and biofilm-specific models [88] [100]. For instance, while planktonic bacteria are typically reduced within minutes upon exposure to antiseptics like octenidine hydrochloride (OCT) and sodium hypochlorite (NaOCl), biofilm models show little to no immediate reaction, with OCT requiring 48 hours to significantly erode the biofilm matrix and reduce bacterial load [100]. This resistance differential highlights the critical importance of selecting appropriate models for antimicrobial testing.
Table 2: Quantitative Performance Comparison of Biofilm Models Against Antimicrobial Challenges
| Model System | Test Organism | Response to Sodium Hypochlorite | Response to Octenidine Hydrochloride | Time to Significant Effect | Key Findings |
|---|---|---|---|---|---|
| Planktonic Culture [100] | S. aureus, P. aeruginosa | Rapid reduction within minutes [100] | Rapid reduction within minutes [100] | Minutes [100] | Standard antimicrobial tests use planktonic cells, which have little relevance to sessile microbes [88] |
| 3D Human Plasma Biofilm Model (lhBIOM) [100] | S. aureus, P. aeruginosa | Little to no reaction [100] | Matrix erosion and significant bacterial reduction [100] | 48 hours [100] | Reality-reflecting model showing characteristic biofilm resistance patterns [100] |
| Sheep Blood Biofilm Model (sbBIOM) [100] | S. aureus, P. aeruginosa | Little to no reaction [100] | Matrix erosion and significant bacterial reduction [100] | 48 hours [100] | Ethically acceptable alternative with performance comparable to human blood-based models [100] |
| In Vivo Wound Biofilms [85] [98] | Polymicrobial communities | Limited efficacy due to host components in matrix [98] | Variable efficacy based on penetration depth [85] | Days to weeks [85] | Host-derived matrix components enhance protection; small aggregates (5-200 µm) dominate [98] |
Experimental Protocols for Key Biofilm Models
Standardized Microtiter Plate Biofilm Assay
The 96-well microtiter plate assay represents one of the most widely used static models for biofilm research due to its simplicity and adaptability to high-throughput screening [99] [8]. The protocol begins with preparing planktonic cultures of the test microorganisms, adjusted to a standardized concentration (typically OD₆₀₀ ≈ 0.1). Add 200 µL of this bacterial suspension to each well of a sterile polystyrene 96-well microtiter plate. Incubate the plate under optimal growth conditions for the specific microorganisms (typically 24-48 hours at 37°C). Following incubation, carefully remove the planktonic cells by inverting the plate and gently washing each well with phosphate-buffered saline (PBS) to remove non-adherent bacteria. The remaining surface-attached biofilms can then be quantified through various methods, with crystal violet staining being the most common [8]. For this, add 0.1% crystal violet solution to each well and incubate for 10-15 minutes. Remove the unbound dye and wash gently with PBS. Destain with 200 µL of 95% ethanol or acetic acid (33%) for 10 minutes, then measure the optical density at 570 nm using a plate reader [8]. This protocol provides a quantitative measure of total biofilm biomass, although it does not distinguish between viable cells and matrix components.
Flow Cell Biofilm Model for Real-Time Analysis
Flow cell systems offer dynamic conditions that more closely mimic natural and clinical environments where biofilms experience fluid shear forces [99]. The basic protocol involves assembling a sterile flow cell apparatus typically consisting of a glass channel mounted on a microscope slide with inlet and outlet ports connected to a medium reservoir and waste container. Inoculate the flow chamber with a bacterial suspension (OD₆₀₀ ≈ 0.1) and allow cells to attach for 1-2 hours without flow. Initiate medium flow using a peristaltic pump at a controlled rate (typically 0.1-0.5 mm/s) to create a mild shear stress that promotes biofilm development while removing planktonic cells. The system is maintained at constant temperature throughout the experiment (usually 37°C for human pathogens). Biofilm development can be monitored in real-time using confocal laser scanning microscopy (CLSM) with appropriate fluorescent tags [99] [80]. For structural analysis, image acquisition typically involves collecting z-stacks at multiple random positions within the flow cell at desired time intervals. These images can then be analyzed using computational software such as COMSTAT or ImageJ plugins to quantify parameters like biofilm thickness, biovolume, surface coverage, and roughness coefficient [80]. This protocol enables non-destructive, longitudinal analysis of biofilm architecture and dynamics under conditions that more closely approximate in vivo environments.
In Vivo Wound Biofilm Model
Mammalian wound models represent the highest complexity level for biofilm research, incorporating host-pathogen interactions [98]. The protocol begins with anesthetizing the animal (typically a pig or mouse) and creating a standardized full-thickness wound. For pig models, which are considered ideal due to their dermal similarity to humans, wounds are typically 2-3 cm in diameter. Inoculate the wound bed with a bacterial suspension (approximately 10⁶-10⁸ CFU) of the test organism(s). Cover the wound with a semi-occlusive dressing to maintain a moist environment and prevent contamination. Allow biofilms to develop for 3-7 days, with regular monitoring of clinical signs of infection. For biofilm analysis, euthanize the animal and excise the wound tissue using aseptic technique. Process the tissue for various analytical methods: (1) For histological examination, fix tissue in formalin, embed in paraffin, section, and stain with hematoxylin and eosin or specific bacterial stains (e.g., Gram stain) to visualize biofilm distribution and host tissue response [98]; (2) For bacterial quantification, homogenize tissue samples in PBS and plate serial dilutions on appropriate agar media for colony counting; (3) For advanced imaging, fix tissue in paraformaldehyde and analyze using CLSM or SEM to examine biofilm architecture [85] [98]. This protocol provides the most clinically relevant data but requires significant resources and ethical considerations.
Visualization of Model Selection and Workflow
Biofilm Model Selection Pathway
Integrated Experimental Workflow for Biofilm Analysis
Essential Research Reagent Solutions for Biofilm Studies
The selection of appropriate reagents and materials is crucial for generating reproducible, clinically relevant biofilm data. The following table details essential solutions and their specific functions in biofilm research protocols.
Table 3: Essential Research Reagent Solutions for Biofilm Studies
| Reagent/Material | Composition/Specifications | Primary Function | Application Notes |
|---|---|---|---|
| Crystal Violet Solution [8] | 0.1% crystal violet in aqueous solution | Total biofilm biomass quantification through staining of cells and polysaccharides [8] | Does not distinguish viable cells; destain with ethanol or acetic acid for measurement [8] |
| Extracellular Matrix Components [98] | Host-derived proteins (fibrin, collagen), polysaccharides, eDNA | Mimics in vivo biofilm matrix composition in advanced models [98] | Critical for creating clinically relevant models; host components significantly alter antibiotic penetration [98] |
| Artificial Wound Media [100] | Human/sheep plasma, blood components, supplemental nutrients | Creates 3D biofilm models mimicking wound environment [100] | Human plasma models (lhBIOM) and sheep blood models (sbBIOM) show comparable resistance profiles [100] |
| Fluorescent Tags & Probes [80] [98] | GFP-conjugated antibodies, SYTO stains, lectin binding tags | Enables visualization of biofilm architecture, composition, and viability via CLSM [80] [98] | Essential for real-time, non-destructive analysis of biofilm dynamics in flow cells and in vivo models [80] |
| Continuous Flow Media [99] | Nutrient broths with controlled carbon/nitrogen sources | Maintains biofilm growth under dynamic conditions in flow cells and reactors [99] | Composition significantly influences biofilm structure; must be matched to research question and microbial species [99] |
The reconciliation of simplified laboratory models with complex in vivo biofilm environments requires a strategic, tiered approach that acknowledges the specific strengths and limitations of each model system [88]. No single model can fully recapitulate the complexity of clinical biofilms, but through the thoughtful integration of multiple model systems, researchers can generate clinically predictive data while maintaining experimental feasibility. The emerging framework suggests utilizing high-throughput static models for initial screening, progressing to dynamic systems for mechanistic studies, and reserving complex in vivo models for final validation of the most promising interventions [88] [98]. This integrated approach, coupled with continued refinement of standardized biofilm models that incorporate critical host factors, represents the most promising path forward for overcoming the translational challenges that have long plagued biofilm research [88] [100]. As the field advances, the development of increasingly sophisticated 3D microenvironments that better mimic host conditions will further narrow the gap between laboratory models and clinical reality, accelerating the development of effective anti-biofilm strategies.
Optimizing Biofilm Recovery and Detection in Clinical and Industrial Specimens
Biofilms, structured microbial communities encased in a self-produced extracellular polymeric substance (EPS) matrix, represent a significant challenge across clinical and industrial settings. These complex aggregates demonstrate remarkable resilience, contributing to approximately 65% of human microbial infections and 80% of chronic illnesses, creating an urgent need for optimized detection and recovery methodologies [101]. The inherent resistance mechanisms of biofilms, including restricted antimicrobial penetration, metabolic heterogeneity, and genetic adaptations, enable them to withstand conventional therapeutic interventions and disinfection protocols [101]. This comprehensive guide objectively compares current biofilm research models, detection technologies, and experimental methodologies to assist researchers, scientists, and drug development professionals in selecting appropriate tools for their specific applications. The comparative evaluation presented herein focuses on performance metrics, technical specifications, and practical implementation considerations across diverse research contexts, from clinical diagnostics to industrial biofilm monitoring.
Biofilm Formation and Clinical Significance
The biofilm lifecycle begins with initial attachment of planktonic cells to surfaces, followed by irreversible adhesion, microcolony formation, and maturation into complex three-dimensional structures encased within the protective EPS matrix [101]. This matrix consists of polysaccharides, proteins, extracellular DNA (eDNA), and lipids that provide structural integrity and confer protection against environmental stressors, antimicrobial agents, and host immune responses [101]. The maturation process involves regulated physiological processes and cellular structure changes, culminating in organized communities capable of coordinated behaviors such as quorum sensing [101].
In clinical contexts, biofilms play a pivotal role in healthcare-associated infections (HAIs), contributing significantly to morbidity, mortality, and economic burden. The World Health Organization estimates that 7% of patients in high-income countries and 15% in low- and middle-income countries acquire at least one HAI during hospital stays, with biofilms implicated in approximately 80% of chronic infections [101]. Biofilm-forming pathogens such as Staphylococcus aureus, Pseudomonas aeruginosa, and Acinetobacter baumannii exhibit resistance to antibiotics that can be up to 1000 times greater than their planktonic counterparts [101]. This enhanced resistance extends infection duration, increases recurrence likelihood, and complicates treatment strategies, particularly in device-associated infections involving catheters, implants, and prosthetic joints [101].
Table 1: Clinical Significance of Biofilms in Healthcare-Associated Infections
| Infection Type | Key Pathogens | Biofilm-Related Challenges | Clinical Impact |
|---|---|---|---|
| Chronic Wounds | P. aeruginosa, S. aureus | Hindered healing, chronic inflammation, physical barrier to antibiotics | Diabetic foot ulcers, venous leg ulcers |
| Medical Device-Associated | Coagulase-negative staphylococci, S. aureus | Device colonization, antibiotic resistance | Catheters, implants, prosthetic joints |
| Dental Plaque | Oral streptococci, Porphyromonas gingivalis | Tooth decay, gum disease, peri-implantitis | Dental caries, periodontitis |
| Cystic Fibrosis Lung Infections | P. aeruginosa, Burkholderia cepacia | Antibiotic penetration barriers, chronic inflammation | Persistent lung infections, decline in function |
| Surgical Site Infections | Multiple species including MRSA | Recurrent infections, treatment failure | Increased morbidity, prolonged hospitalization |
Comparative Analysis of Biofilm Research Models
Standardized In Vitro Models for Medical Device Materials
Research models for studying biofilm formation on medical device materials have been standardized to enable reproducible investigation of biofilm development and eradication strategies. The Drip Flow Reactor (DFR) and Centers for Disease Control and Prevention Biofilm Reactor (CDC-BR) represent two widely utilized systems for generating biofilms on relevant surfaces such as stainless steel medical components [36]. These models employ distinct operational parameters that significantly impact biofilm development characteristics and experimental outcomes.
The DFR model operates with an initial 6-hour batch phase for biofilm establishment followed by a 48-hour continuous flow phase for maturation [36]. In contrast, the CDC-BR utilizes a 24-hour batch phase followed by a 24-hour continuous phase [36]. Comparative studies have demonstrated that the DFR system produces biofilms with significantly higher bacterial densities (approximately 7.5 log CFU/coupon) compared to the CDC-BR (approximately 6.5 log CFU/coupon) on stainless steel surfaces [36]. Similarly, protein content measurements indicate higher biomass accumulation in DFR-grown biofilms (approximately 250 μg/coupon) versus CDC-BR biofilms (approximately 150 μg/coupon) [36]. These quantitative differences highlight the importance of model selection based on research objectives, whether investigating high-burden contamination scenarios or moderate biofilm formation.
Table 2: Comparison of Standardized Biofilm Reactor Models
| Parameter | Drip Flow Reactor (DFR) | CDC Biofilm Reactor (CDC-BR) |
|---|---|---|
| Initial Batch Phase | 6 hours | 24 hours |
| Continuous Phase | 48 hours | 24 hours |
| Typical Bacterial Density | ~7.5 log CFU/coupon | ~6.5 log CFU/coupon |
| Protein Content | ~250 μg/coupon | ~150 μg/coupon |
| Total Organic Carbon | ~400 μg/coupon | ~250 μg/coupon |
| Application Strengths | High-burden contamination studies | Moderate biofilm formation research |
| Standard Reference | ASTM E2647-20 | ASTM E2562-22 |
Advanced 3D In Vitro Models for Implant-Associated Infections
Advanced three-dimensional (3D) in vitro models have emerged to bridge the gap between conventional 2D cultures and complex in vivo environments, particularly for investigating implant-associated infections. These sophisticated systems better replicate the physiological conditions surrounding medical implants by incorporating relevant cell types, biomaterials, and bacterial strains in architecturally complex arrangements [16]. The development of these models addresses critical limitations of traditional 2D systems, including inadequate cell-to-cell contacts, unphysiological cell morphology, and insufficient representation of host-pathogen-implant interactions [16].
Current 3D models for implant-associated infection research primarily focus on two applications: organotypic models that mimic the in vivo environment, and biomaterial testing platforms for evaluating novel implant materials [16]. Dental implant models typically incorporate fibroblasts and keratinocytes, while orthopedic implant models utilize stem cells and fibroblast-like cells [16]. One advanced system co-cultures fibroblasts with THP-1 derived macrophages to model immune cell involvement in infection responses [16]. These models have been challenged with various Gram-positive and Gram-negative bacterial species relevant to specific implant types, enabling detailed investigation of biofilm formation on biomaterial surfaces under conditions that more closely resemble the clinical scenario [16]. The capacity to incorporate human cells and manipulate specific variables positions 3D models as valuable tools for elucidating pathogenesis mechanisms at cellular and molecular levels while reducing reliance on animal experiments through the 3R Principle (Replacement, Reduction, and Refinement) [16].
Biofilm Model Evolution from 2D to 3D Systems
Detection Technologies for Bacterial Biofilms
Near-Infrared Spectroscopy for Biofilm Detection
Near-infrared (NIR) spectroscopy has emerged as a powerful analytical technique for rapid, non-destructive detection and differentiation of bacterial biofilms across diverse settings. This technology leverages the interaction between near-infrared light (350-2500 nm wavelength) and molecular bonds within biofilm components to generate characteristic spectral fingerprints [102]. The implementation of NIR spectroscopy represents a significant advancement over conventional detection methods, offering capabilities for real-time monitoring without extensive sample preparation or destructive processing [102].
The effectiveness of NIR spectroscopy for biofilm detection has been demonstrated through rigorous validation studies assessing its ability to differentiate biofilms formed by different bacterial species. Research has shown classification accuracy of 80.00% for discriminating among biofilms produced by Staphylococcus epidermidis, Staphylococcus aureus, Enterococcus faecium, Salmonella Typhimurium, Escherichia coli, Listeria monocytogenes, and Lactiplantibacillus plantarum [102]. Furthermore, the technology achieved 93.75% accuracy in specifically identifying S. aureus biofilms on glass surfaces, highlighting its potential for targeted detection in both clinical and industrial environments [102]. The methodological approach incorporates advanced spectral data processing techniques, including Standard Normal Variate (SNV) and Savitzky-Golay filters, to correct systematic variations and eliminate random noise, followed by principal component analysis (PCA) for dimensionality reduction and Random Forest (RF) discriminant analysis for classification [102].
Comparative Performance of Detection Methodologies
Various detection methodologies offer distinct advantages and limitations for biofilm analysis across different applications. Conventional approaches include ATP swabbing, contact plating, and specific dyes for visual identification, which provide basic information about microbial presence and viability [102]. More advanced techniques such as Fourier Transform Infrared (FTIR) spectroscopy and Raman spectroscopy deliver detailed chemical profiles of biofilm matrix composition and macrocomponents [102]. NIR spectroscopy distinguishes itself through deeper material penetration compared to FTIR and freedom from fluorescence limitations that can affect Raman spectroscopy, making it particularly suitable for analyzing biofilms on diverse surfaces and within complex matrices [102].
Table 3: Comparison of Biofilm Detection Technologies
| Detection Method | Detection Principle | Accuracy/Sensitivity | Advantages | Limitations |
|---|---|---|---|---|
| NIR Spectroscopy | Molecular bond vibration analysis | 80-93.75% (species differentiation) | Non-destructive, real-time capability, minimal sample preparation | Requires reference databases, specialized equipment |
| ATP Swabbing | Adenosine triphosphate measurement | Semi-quantitative viability assessment | Rapid results, ease of use | Does not differentiate biofilm vs. planktonic cells |
| Contact Plating | Culturalbility on solid media | Viable cell enumeration | Established methodology, species identification | Time-consuming (24-48 hours), detects only culturable organisms |
| FTIR Spectroscopy | Molecular vibrational transitions | High chemical specificity | Detailed chemical composition analysis | Limited penetration depth, sample preparation often required |
| Raman Spectroscopy | Inelastic light scattering | High spatial resolution | Single-cell capability, minimal water interference | Fluorescence interference in complex samples |
NIR Spectroscopy Biofilm Detection Workflow
Experimental Protocols for Biofilm Research
Standardized Protocol for Drip Flow Reactor (DFR) Operation
The Drip Flow Reactor (DFR) provides a controlled environment for generating established biofilms on various substrate materials, particularly relevant for medical device research. The following protocol outlines the standardized procedure based on ASTM E2647-20 with modifications for medical device materials [36]:
Coupon Preparation: Rectangular stainless steel coupons (7.5 cm × 2.5 cm, 1.2 mm thick, 316 grade with brush finish #4) are sterilized by autoclaving at 121°C for 15 minutes [36].
Inoculum Preparation: Pseudomonas aeruginosa ATCC 15442 is streaked on tryptic soy agar (TSA) and incubated at 37°C for 24 hours. A single colony is inoculated into 50 mL of tryptic soy broth (TSB; 3 g/L concentration) and grown at 37°C with shaking (150 rpm) to mid-exponential phase [36].
Reactor Assembly and Inoculation: The DFR is assembled with sterile stainless steel coupons as substratum. Each channel is inoculated with bacterial suspension at a concentration of approximately 10^7 CFU/mL and operated in batch mode for 6 hours to allow initial attachment [36].
Continuous Flow Operation: Following the batch phase, continuous nutrient flow (1:100 dilution of TSB) is initiated at a rate of 375 μL/min and maintained for 48 hours to support biofilm development [36].
Biofilm Harvest and Analysis: After 48 hours, coupons are aseptically removed and processed for analysis. Biofilm quantification includes:
- Viable cell counting via serial dilution and plating on TSA
- Protein content measurement using bicinchoninic acid (BCA) assay
- Total organic carbon (TOC) analysis for biomass assessment [36]
Enhanced Diagnostic Protocol for Abscess Specimens
Optimized diagnostic protocols significantly improve pathogen detection efficacy in clinical abscess specimens. A comprehensive approach combining multiple methodologies has demonstrated a 20.1 percentage point improvement in positivity rates compared to conventional methods, achieving an overall detection rate of 81.9% [103]. The enhanced protocol includes:
Sample Collection and Transport: Abscess specimens are collected aseptically and transported to the laboratory under anaerobic conditions to preserve fastidious microorganisms [103].
Gram-Stain Microscopy: Direct smears are prepared for Gram staining to provide immediate information about bacterial morphology, abundance, and inflammatory cell presence [103].
Aerobic and Anaerobic Culture: Specimens are inoculated onto:
- Blood agar incubated aerobically and anaerobically
- Chocolate agar incubated in 5% CO2
- Selective media (MacConkey, kanamycin-vancomycin laked blood agar)
- Anaerobic broth supplementation for enriched recovery [103]
Blood Culture Bottle Enrichment: Parallel inoculation into blood culture bottles enhances detection of fastidious and slow-growing organisms [103].
Acid-Fast Bacilli Staining: Ziehl-Neelsen staining is performed for detection of mycobacterial infections, particularly in immunocompromised patients or specific clinical presentations [103].
Incubation and Identification: Cultures are incubated for appropriate durations (aerobic: 24-48 hours, anaerobic: 5-7 days, mycobacterial: up to 8 weeks) with subsequent identification of isolates using MALDI-TOF mass spectrometry or biochemical tests [103].
The Scientist's Toolkit: Essential Research Reagents and Materials
Table 4: Essential Research Reagents and Materials for Biofilm Research
| Reagent/Material | Specifications | Application Function | Experimental Context |
|---|---|---|---|
| Tryptic Soy Broth (TSB) | 3 g/L concentration, with 0.25% glucose supplementation | Biofilm growth medium providing essential nutrients | Drip Flow Reactor operations, CDC Biofilm Reactor studies [36] |
| Stainless Steel Coupons | 316 grade, brush finish #4, 7.5 cm × 2.5 cm × 1.2 mm | Medical device material substrate for biofilm formation | Represents reusable surgical instruments and medical devices [36] |
| Polystyrene Microtiter Plates | 8-well configuration, sterile | High-throughput screening of biofilm formation | Interspecies biofilm studies, antimicrobial susceptibility testing [102] |
| Blood Culture Bottles | Commercial aerobic/anaerobic systems | Pathogen enrichment from clinical specimens | Enhanced detection of fastidious organisms in abscess specimens [103] |
| NIR Spectrophotometer | LabSpec 4 Standard-Res, 350-2500 nm range | Spectral signature acquisition of biofilms | Non-destructive biofilm detection and differentiation [102] |
| Spectralon Reference | Highly reflective Lambertian surface | Device calibration for spectral measurements | Ensures accuracy in NIR spectroscopic analysis [102] |
| Anaerobic Culture Media | Kanamycin-vancomycin laked blood agar | Selective isolation of anaerobic bacteria | Recovery of fastidious anaerobes from polymicrobial infections [103] |
The comparative evaluation of biofilm recovery and detection methodologies presented in this guide demonstrates significant advancements in both clinical and industrial contexts. Standardized models like the Drip Flow Reactor and CDC Biofilm Reactor provide reproducible platforms for investigating biofilm formation on medical device materials, with the DFR generating higher biomass suitable for high-burden contamination studies [36]. Enhanced diagnostic protocols combining multiple detection methodologies have substantially improved pathogen recovery from clinical specimens, achieving a 20.1 percentage point increase in detection rates compared to conventional methods [103]. Emerging technologies such as NIR spectroscopy offer non-destructive, rapid detection capabilities with demonstrated accuracy exceeding 90% for specific applications [102]. The continued refinement of 3D models bridges critical gaps between simple 2D systems and complex in vivo environments, enabling more physiologically relevant investigation of host-pathogen-implant interactions [16]. These optimized approaches collectively advance our capacity to detect, analyze, and combat biofilm-associated challenges across diverse settings, ultimately contributing to improved clinical outcomes and enhanced industrial safety.
Performance Assessment and Cross-Method Validation Studies
The accurate detection of biofilm formation is a critical component in microbiological research, particularly in the study of persistent infections and antimicrobial resistance. Biofilms, which are structured communities of microorganisms encapsulated within a self-produced extracellular polymeric substance (EPS), exhibit significantly heightened resistance to antibiotics and host immune responses compared to their planktonic counterparts [13]. This resistance makes biofilm-associated infections particularly challenging to treat in clinical settings. The evaluation of biofilm-forming capacity relies on various phenotypic methods, each with distinct advantages, limitations, and performance characteristics [42] [56].
The tissue culture plate (TCP) method is widely regarded as the gold standard for biofilm detection due to its quantitative nature and reliability [104] [105]. However, its requirement for specialized equipment and relatively complex protocol can limit its application in resource-constrained settings or high-throughput screening environments. This has led to the continued use and evaluation of simpler phenotypic methods such as the tube adherence method (TM) and Congo red agar (CRA) method, which offer practical advantages in terms of cost, technical simplicity, and turnaround time [106] [105].
This comparative analysis systematically evaluates the sensitivity, specificity, and practical utility of these biofilm detection methods, providing researchers with evidence-based guidance for method selection based on specific experimental requirements and laboratory capabilities. The findings are particularly relevant for studies involving clinical isolates of pathogenic bacteria, where accurate biofilm detection can significantly influence treatment strategies and patient outcomes.
Methodological Protocols for Biofilm Detection
Tissue Culture Plate (TCP) Method
The TCP method, also known as the microtiter plate assay, serves as the quantitative gold standard for biofilm detection [104] [105]. The standard protocol begins with preparing a bacterial suspension in trypticase soy broth supplemented with 1% glucose, adjusted to 0.5 McFarland standard (approximately 1.5 × 10⁸ CFU/mL) [105]. This suspension is then diluted 1:100 in fresh broth, and 200 μL aliquots are transferred into wells of a sterile 96-well flat-bottom polystyrene microtiter plate. The plate is sealed and incubated aerobically at 37°C for 24 hours [107].
Following incubation, the plate contents are carefully aspirated to remove non-adherent planktonic cells. Each well is washed three to four times with phosphate-buffered saline (PBS, pH 7.2) to remove loosely attached bacteria. The remaining adherent biofilms are fixed with 2% sodium acetate for 30 minutes [104]. After fixation and subsequent washing, biofilms are stained with 0.1% crystal violet solution for 10-15 minutes [105]. Excess stain is removed by thorough washing with distilled water, and the plate is air-dried inverted at room temperature [107].
The bound crystal violet stain is solubilized by adding 200 μL of 30% acetic acid to each well and incubating for 30 minutes [105]. The optical density (OD) of each well is then measured at 570 nm using a micro-ELISA reader. The cut-off OD (ODc) is determined as three standard deviations above the mean OD of the negative control (sterile broth) [105]. Based on the OD values, isolates are classified as non-biofilm producers (OD ≤ ODc), weak biofilm producers (ODc < OD ≤ 2×ODc), moderate biofilm producers (2×ODc < OD ≤ 4×ODc), or strong biofilm producers (OD > 4×ODc) [105]. All assays should be performed in triplicate to ensure reproducibility.
Tube Method (TM)
The tube adherence method provides a qualitative approach for detecting biofilm formation [106] [105]. The protocol involves inoculating test isolates into polystyrene tubes containing 5 mL of tryptic soy broth supplemented with 1% glucose, with the turbidity adjusted to 0.5 McFarland standard [105]. The inoculated tubes are incubated statically at 37°C for 18-24 hours [106].
After incubation, the tube contents are carefully aspirated with a pipette, and the tubes are washed three times with PBS (pH 7.2) to remove non-adherent cells [105]. The adherent biofilms are stained with 0.1% crystal violet solution for 15 minutes. Excess stain is decanted, and tubes are washed again with distilled water. Tubes are dried inverted at room temperature and examined macroscopically for the presence of a visible film lining the inner wall of the tube [106]. The formation of a visible stained layer indicates biofilm production, while the absence of such a layer indicates no biofilm production [105]. The exclusive presence of a ring at the liquid-air interface is not considered a positive result [106].
Congo Red Agar (CRA) Method
The Congo red agar method is a qualitative screening technique that detects biofilm formation based on colony morphology and color development [106] [105]. The method utilizes specially prepared Congo red agar plates, which typically contain brain heart infusion broth, sucrose, Congo red dye, and agar [105]. Some protocols use modified Congo red agar (MCRA) with different compositions to enhance sensitivity [104].
Test isolates are streaked onto CRA plates and incubated aerobically at 37°C for 24-48 hours [106]. Some protocols extend the incubation period up to 96 hours to observe color stability [105]. After incubation, colony morphology and color are examined. Biofilm-producing strains typically form black colonies with a dry, crystalline consistency, while non-biofilm producers develop pink or red colonies [105]. Some studies report that black pigmentation on CRA may decline with extended incubation, while modified CRA (MCRA) maintains more stable black pigmentation over time [105].
Comparative Performance Analysis
Sensitivity and Specificity Profiles
Multiple studies have systematically compared the diagnostic performance of these phenotypic methods against the TCP reference standard. The following table summarizes the comparative sensitivity and specificity data across different bacterial species and study conditions:
Table 1: Comparative sensitivity and specificity of phenotypic biofilm detection methods
| Method | Sensitivity Range (%) | Specificity Range (%) | Positive Predictive Value (PPV) (%) | Negative Predictive Value (NPV) (%) | Reference Study |
|---|---|---|---|---|---|
| Tube Method (TM) | 72.7-90.8 | 46.2-70.1 | 82.2 | 22.7-46.2 | [104] [105] |
| Congo Red Agar (CRA) | 65.1-81.8 | 40-61.5 | 87.0 | 46.2 | [104] [105] |
| Modified CRA (MCRA) | 65.1 | 40 | - | - | [105] |
The tissue culture plate method consistently demonstrates the highest detection rates across studies. In an analysis of uropathogenic E. coli (UPEC) isolates, TCP detected biofilm production in 72.22% of clinical isolates compared to only 16.66% in commensal isolates [107]. Similarly, in catheter-associated uropathogens, TCP detected biofilms in 88.6% of catheter isolates and 78.6% of urine isolates [104].
Methodological Limitations and Advantages
Each method presents distinct advantages and limitations that influence their suitability for different research contexts:
Table 2: Advantages and limitations of different biofilm detection methods
| Method | Key Advantages | Major Limitations |
|---|---|---|
| Tissue Culture Plate (TCP) | Quantitative results, high sensitivity and specificity, suitable for high-throughput screening, considered gold standard | Labor-intensive, requires specialized equipment (ELISA reader), time-consuming protocol [42] [105] |
| Tube Method (TM) | Simple protocol, low cost, no specialized equipment needed, excellent sensitivity | Qualitative results only, subjective interpretation, moderate specificity [106] [105] |
| Congo Red Agar (CRA) | Straightforward implementation, simultaneous testing of multiple isolates, minimal equipment requirements | Variable specificity, potential for subjective interpretation, color stability issues over time [105] |
The microtiter plate assay, while highly effective, has limitations including the inability to develop mature biofilms due to lack of continuous nutrient supply and potential loss of biofilm during washing steps [42]. Additionally, the crystal violet staining method does not distinguish between living and dead cells, potentially leading to overestimation of viable biofilm biomass [42] [108].
Research Reagent Solutions
The following table outlines essential reagents and materials required for implementing these biofilm detection methods, along with their specific functions in the experimental protocols:
Table 3: Essential research reagents for biofilm detection methods
| Reagent/Material | Function/Application | Method Utilization |
|---|---|---|
| Polystyrene 96-well microtiter plates | Provides surface for biofilm attachment and growth | TCP [107] [105] |
| Crystal violet (0.1% w/v) | Stains biofilm matrix and adherent cells | TCP, TM [107] [105] |
| Trypticase soy broth with 1% glucose | Growth medium promoting biofilm formation | TCP, TM [107] [105] |
| Congo red agar plates | Differential medium for biofilm detection based on colony color | CRA [106] [105] |
| Phosphate buffered saline (PBS, pH 7.2) | Washing buffer to remove non-adherent cells | TCP, TM [107] [105] |
| Sodium acetate (2%) | Fixative for biofilm stabilization before staining | TCP [107] |
| Acetic acid (30%) | Solubilizes crystal violet for spectrophotometric reading | TCP [105] |
Method Selection Workflow
The following diagram illustrates a systematic approach for selecting appropriate biofilm detection methods based on research objectives and laboratory capabilities:
Discussion and Research Implications
The comparative analysis of biofilm detection methods reveals a clear trade-off between methodological rigor and practical feasibility. The tissue culture plate method remains the unequivocal gold standard for research requiring quantitative data and high detection sensitivity [104] [105]. However, the tube method presents a compelling alternative for initial screening or resource-limited settings, demonstrating excellent sensitivity (up to 90.8%) despite its qualitative nature [105].
Recent advances in biofilm research methodologies have highlighted the importance of selecting detection methods that align with specific research objectives. For instance, in studies evaluating antibiofilm agents with different mechanisms of action, the use of multiple complementary detection methods is recommended to avoid method-specific artifacts [108]. Crystal violet staining, while useful for biomass quantification, may yield misleading results when testing polysaccharide-degrading agents that reduce biofilm mass without necessarily killing embedded cells [108].
The integration of these phenotypic methods with molecular techniques for detecting biofilm-associated genes (such as the icaADBC operon in staphylococci) can provide a more comprehensive understanding of biofilm formation capacity in clinical isolates [106]. This combined approach is particularly valuable in studies investigating correlation between genotypic and phenotypic expression of biofilm-related virulence factors.
Future methodological developments in biofilm research will likely incorporate advanced imaging techniques, automated analysis systems, and potentially machine learning approaches to enhance detection accuracy and throughput [31]. However, the phenotypic methods discussed in this analysis will continue to serve as fundamental tools in both clinical and research microbiology laboratories, providing accessible and cost-effective means for detecting this clinically significant microbial phenotype.
This comparative sensitivity analysis demonstrates that while the tissue culture plate method offers superior performance for quantitative biofilm research, simpler phenotypic methods retain significant utility in specific contexts. The tube method provides the best balance of sensitivity and practicality for routine screening, particularly in resource-constrained settings. Congo red agar methods, while less specific, enable efficient processing of multiple isolates simultaneously. Method selection should be guided by research objectives, required precision, and available laboratory resources. For comprehensive biofilm analysis, particularly in clinical isolates with significant therapeutic implications, a combined approach utilizing TCP as a reference standard with supplementary simpler methods offers an optimal strategy for accurate detection and characterization of biofilm-forming pathogens.
Correlation Between Biofilm Formation and Antimicrobial Resistance Profiles
The management of bacterial infections poses a significant challenge to global health, primarily due to the escalating threat of antimicrobial resistance (AMR). A key factor contributing to this challenge is the ability of many bacteria to form biofilms, which are structured communities of microorganisms embedded in a self-produced extracellular polymeric substance (EPS) matrix [109] [8]. Biofilms exhibit a remarkable capacity to adhere to both biotic and abiotic surfaces, such as human tissues and medical devices, leading to persistent infections that are notoriously difficult to eradicate [109] [110].
Understanding the relationship between biofilm formation and antimicrobial resistance profiles is crucial for developing effective treatment strategies. While it is widely acknowledged that biofilm-embedded bacteria demonstrate increased tolerance to antimicrobial agents compared to their planktonic (free-floating) counterparts, the specific correlation between the quantitative capacity of a bacterial strain to form biofilm and its resistance profile is complex and not fully elucidated [111] [112]. Some studies suggest that biofilms act as a physical barrier and create a unique physiological environment, conferring resistance. Conversely, other research indicates that this relationship may be inverse, with strong biofilm formers sometimes displaying greater phenotypic susceptibility to certain antibiotics [112] [113]. This guide provides a comparative evaluation of this relationship across different bacterial pathogens and research models, offering a framework for scientists and drug development professionals to contextualize their findings.
Comparative Analysis of Biofilm Formation and Resistance in Major Pathogens
The interplay between biofilm-forming capability and antimicrobial resistance varies significantly across different bacterial species and strains. The following table synthesizes data from recent clinical studies to illustrate these disparities.
Table 1: Comparative Biofilm Formation and Antimicrobial Resistance in Clinical Isolates
| Pathogen | Sample Source | Prevalence of Biofilm Formers | Key Resistance Profile | Correlation Observation | Study Reference |
|---|---|---|---|---|---|
| ESKAPE Pathogens (Collective) | Clinical isolates (Wound, urine, blood, etc.) | 88.5% of isolates formed biofilms; 15.8% were strong producers [19]. | Elevated MDR in E. faecium (90%) & A. baumannii; high carbapenem resistance in K. pneumoniae (45.71%) [19]. | A significant correlation was found between biofilm formation and resistance to carbapenems, cephalosporins, and piperacillin/tazobactam (p < 0.05) [19]. | [19] |
| Uropathogenic E. coli (UPEC) | Urinary Tract Infections | 31% strong, 29% moderate, 32% weak biofilm producers [112]. | 90% MDR/XDR; 63% resistant to SXT; 53% resistant to CIP [112]. | An inverse correlation was observed; isolates with lower resistance often formed stronger biofilms [112]. | [112] |
| Uropathogens (Community vs. Hospital) | Urinary Tract Infections | Biofilm production was higher in nosocomial (35%) vs. community (29%) isolates [113]. | Overall resistance was higher in hospital (30%) than community (22%) Gram-negative isolates [113]. | An inverse correlation between biofilm production and antibiotic resistance was reported [113]. | [113] |
The data reveals that the relationship is not universal. In the case of ESKAPE pathogens, a positive correlation with specific antibiotic classes was identified [19]. In contrast, studies on uropathogens, particularly UPEC, have consistently noted an inverse relationship, suggesting that susceptible isolates may rely on biofilms as a primary survival strategy, potentially because maintaining genetic resistance mechanisms imposes a fitness cost that compromises biofilm-forming ability [112] [113].
Essential Experimental Models for Biofilm Research
A critical step in comparative studies is the selection of an appropriate and reproducible biofilm model. The choice of model significantly influences the assessment of biofilm formation and its subsequent challenge with antimicrobial agents.
Table 2: Common Laboratory Models for Biofilm Studies
| Model Type | Key Features | Common Assays | Advantages | Limitations |
|---|---|---|---|---|
| Static Models | Biofilms form under non-flow conditions [8]. | Microtiter plate (e.g., 96-well) with Crystal Violet (CV) staining or viability dyes (e.g., resazurin) [112] [113]. | High-throughput, simple, low-cost, and excellent for screening [8]. | Does not simulate fluid shear forces; potential for oxygen/nutrient gradients; CV stains total biomass (live+dead+matrix) [111] [8]. |
| Flow-Cell Models | Continuous flow of fresh medium mimics in vivo conditions like urinary catheters [8]. | Confocal Laser Scanning Microscopy (CLSM) with fluorescent stains [41] [8]. | Allows real-time, non-destructive visualization of 3D biofilm structure and development [8]. | Low-throughput, specialized equipment required, more complex operation [8]. |
| Calgary Biofilm Device (CBD) | Utilizes a peg lid to generate standardized, replicate biofilms in a 96-well format [8]. | Determination of Minimum Biofilm Eradication Concentration (MBEC) [8]. | Generates multiple uniform biofilms for robust susceptibility testing; bridges static and dynamic models [8]. | Peg geometry can influence biofilm structure [8]. |
Standardized Protocol: Microtiter Plate Biofilm Formation Assay
The microtiter plate assay is a foundational method for quantifying biofilm formation [112] [113]. Below is a detailed, standardized protocol.
Principle: Bacterial adhesion and biofilm formation on polystyrene wells are quantified using a stain that binds to cells and matrix components. Workflow Diagram:
Materials:
- 96-well flat-bottom polystyrene microtiter plate
- Tryptic Soy Broth (TSB) or other appropriate culture medium
- Phosphate Buffered Saline (PBS), pH 7.4
- Absolute Methanol
- Crystal Violet solution (0.1% w/v)
- Acetic acid (33% v/v) or 95% ethanol for dye solubilization
- Microplate reader
Procedure:
- Inoculation: Prepare a bacterial suspension adjusted to approximately 10^6 CFU/mL in a growth medium like TSB. Pipette 100-200 µL of this suspension into the wells of the microtiter plate. Include negative control wells containing sterile medium only [112] [113].
- Incubation and Growth: Incub the plate under static conditions for 24-48 hours at the organism's optimal growth temperature (e.g., 37°C for human pathogens).
- Planktonic Cell Removal: After incubation, carefully invert the plate to discard the contents. Gently wash the adhered biofilms twice with 200-300 µL of PBS to remove non-adherent planktonic cells. The plate can be tapped gently on absorbent paper to remove residual liquid [112].
- Biofilm Fixation: Add 200 µL of absolute methanol to each well and incubate for 15-20 minutes at room temperature to fix the biofilm.
- Drying: Discard the methanol and allow the plate to air-dry completely.
- Staining: Add 150-200 µL of 0.1% Crystal Violet solution to each well and stain for 15-30 minutes at room temperature.
- Washing: Remove the stain and rinse the plate thoroughly under running tap water until the control wells appear clear. Air-dry the plate.
- Solubilization: Add 200 µL of 33% acetic acid or 95% ethanol to each well to solubilize the dye bound to the biofilm. Incubate for 10-30 minutes with gentle shaking.
- Quantification: Transfer 125 µL of the solubilized dye from each well to a new microtiter plate (or measure directly if the plate is compatible). Measure the optical density (OD) at 570-595 nm using a microplate reader.
Classification: The biofilm-forming capacity is classified based on the OD. A common method calculates the Biofilm Index (BI) = ODsample - ODnegative control. Isolates can be categorized as: non-biofilm producer, weak, moderate, or strong based on cutoff values derived from the negative control [112].
Advanced Techniques for Biofilm Matrix Characterization
To move beyond total biomass quantification, advanced techniques like Confocal Laser Scanning Microscopy (CLSM) provide insights into the spatial organization and composition of the biofilm matrix.
Advanced Protocol: CLSM for Biofilm Component Analysis
This protocol, adapted from a study on Staphylococcus aureus, details how to quantify different components of the biofilm matrix using specific fluorescent stains [41].
Principle: Specific fluorescent dyes bind to key biofilm matrix components (e.g., polysaccharides, proteins, DNA), allowing for their quantification and spatial visualization via CLSM. Workflow Diagram:
Materials:
- Poly-L-lysine coated glass slides
- Confocal Laser Scanning Microscope (CLSM)
- Fluorescent Staining Reagents:
- Sypro Ruby: Binds to extracellular proteins [41].
- Concanavalin A (ConA) conjugated with Alexa Fluor 633: Labels α-extracellular polysaccharides [41].
- Griffonia Simplicifolia Lectin II (GS-II) conjugated with Alexa Fluor 488: Identifies α or β-N-acetylglucosamine polysaccharides [41].
- Propidium Iodide (PI): Labels bacterial DNA [41].
- TOTO-1: Binds to extracellular DNA (eDNA) [41].
- Fixative: 4% formaldehyde solution.
- Permeabilization agent: 0.5% Triton-X 100.
- Phosphate Buffered Saline (PBS)
Procedure:
- Biofilm Growth: Inoculate a bacterial suspension (e.g., 10^8 CFU/mL) into wells containing the poly-L-lysine coated glass slides. Incubate under agitation for 24 hours at 37°C to promote adhesion and biofilm formation [41].
- Treatment (if applicable): Wash the slides with PBS and treat with the antimicrobial agent or control (e.g., sterile water) for a defined period (e.g., 24 hours).
- Fixation and Permeabilization: Wash the slides with PBS and treat with a solution of 0.5% Triton-X 100 and 4% formaldehyde to disrupt and fix the biofilms, respectively [41].
- Staining: Apply the different fluorescent staining reagents to the biofilms according to the manufacturer's recommendations for application time and concentration [41].
- Imaging: Examine the stained biofilm samples using a CLSM. The biofilm depth should be measured at intervals (e.g., 4 µm) along the z-axis [41].
- Image Analysis: Process the obtained images using software like FIJI (ImageJ). The density of biofilm components is calculated as the percentage of the occupied area by each fluorescent signal [41].
The Scientist's Toolkit: Essential Research Reagents
The following table lists key reagents and their functions for studying biofilms and their resistance profiles, as evidenced in the cited research.
Table 3: Key Research Reagent Solutions for Biofilm and AMR Studies
| Reagent / Solution | Function / Application | Example Use Case |
|---|---|---|
| Crystal Violet (0.1%) | Total biofilm biomass staining. Binds to cells and polysaccharides in the extracellular matrix [112] [113]. | Quantitative microtiter plate assay for initial biofilm screening and classification [112]. |
| Fluorescent Stains (e.g., Sypro Ruby, ConA, PI) | Specific labeling of biofilm matrix components (proteins, polysaccharides, DNA) for advanced quantification [41]. | Confocal microscopy analysis to dissect the composition and 3D architecture of biofilms [41]. |
| Tranexamic Acid (TXA) | An antifibrinolytic agent with demonstrated anti-biofilm properties against some species [41]. | Used as an experimental treatment to assess reduction in biofilm components (e.g., in S. aureus) [41]. |
| Poly-L-lysine | A synthetic polymer that coats surfaces, enhancing their positivity and promoting bacterial adhesion [41]. | Coating glass slides to ensure consistent and robust biofilm formation for microscopy studies [41]. |
| Modified Carbapenem Inactivation Method (mCIM) reagents | Phenotypic detection of carbapenemase production in Gram-negative isolates [19]. | Differentiating resistance mechanisms within collections of carbapenem-resistant pathogens [19]. |
The correlation between biofilm formation and antimicrobial resistance is a complex and context-dependent phenomenon. Evidence from clinical isolates demonstrates that it can be positive, inverse, or non-existent, influenced by factors such as bacterial species, genetic lineage, and the specific antibiotic class being tested [19] [111] [112]. A critical insight for researchers and clinicians is that a high capacity for biofilm formation does not automatically equate to broad-spectrum antimicrobial resistance in the classical genetic sense; instead, biofilms represent a distinct, phenotypic form of tolerance [112] [110].
Future research must leverage standardized experimental models and advanced compositional analyses to dissect the specific molecular mechanisms driving this relationship. The integration of novel therapeutic strategies, such as biofilm-disrupting agents like tranexamic acid [41], with conventional antibiotics, presents a promising avenue for overcoming biofilm-associated treatment failures. A nuanced, pathogen-specific, and mechanism-based understanding is paramount for guiding successful drug development and therapeutic interventions against these resilient microbial communities.
Catheter-associated urinary tract infections (CAUTIs) represent a significant burden in healthcare settings, notorious for leading to prolonged hospital stays, increased treatment costs, and higher morbidity rates [114]. A primary factor complicating the effective management of CAUTIs is the remarkable capacity of the involved pathogens to form complex biofilm structures on catheter surfaces. These biofilms, encased in a self-produced extracellular polymeric substance (EPS) matrix, act as a robust physical and biological barrier, enhancing resistance to conventional antibiotics and host immune responses [104] [13]. This resistance landscape is further complicated by the emergence of multidrug-resistant organisms (MDROs), making the choice of empirical antibiotic therapy increasingly challenging [114].
Therefore, the accurate and timely identification of causative pathogens and a precise understanding of their antibiotic susceptibility profiles are paramount for initiating effective, targeted treatment. This guide provides a comprehensive comparative analysis of contemporary methods used in the identification of CAUTI pathogens and the detection of biofilm formation. It objectively evaluates the performance of conventional microbiological techniques against advanced technological platforms, supported by recent experimental data. The aim is to offer researchers, clinical scientists, and drug development professionals a clear overview of the available "toolkit" for CAUTI research, facilitating informed decisions in both clinical practice and investigative studies.
Comparative Analysis of CAUTI Pathogen Distribution and Resistance
Understanding the epidemiological profile of common CAUTI pathogens and their inherent resistance patterns is the first step in method validation. The microbial ecology in CAUTIs differs notably from that of non-catheter-associated UTIs, influencing both clinical outcomes and laboratory approaches.
Table 1: Common Pathogens in CAUTI and Their Associated Resistance Profiles
| Pathogen | Prevalence Notes | Key Resistance Patterns |
|---|---|---|
| Escherichia coli | A leading pathogen in both community and hospital settings [115]. | Higher resistance rates in inpatient vs. outpatient isolates [115]. |
| Klebsiella pneumoniae | A predominant organism, especially in CAUTIs [114]. | Often associated with ESBL production and multidrug resistance [114]. |
| Pseudomonas aeruginosa | More frequently isolated in CAUTIs than in non-catheter UTIs [114]. | Intrinsically resistant to many drug classes; a classic biofilm former. |
| Enterococcus spp. | Common in ICU settings; high prevalence in some studies [116]. | Shows high resistance to fluoroquinolones; VRE is a concern. |
| Candida spp. | Predominant in fungal CAUTIs, especially in ICU patients [116]. | Resistance to fluconazole is increasingly reported. |
Clinical data from a study in Western Romania highlighted that CAUTI patients had a significantly longer mean hospital stay (13.9 days) compared to non-catheter UTI patients (11.7 days) [114]. This underscores the heightened clinical complexity associated with these infections. Furthermore, the same study found that diabetic status was correlated with higher inflammatory markers (CRP) and increased ICU admissions, indicating that patient comorbidities can exacerbate the risk and severity of CAUTIs [114].
Comparative Evaluation of Biofilm Detection Methods
Biofilm formation is a critical virulence determinant for CAUTI pathogens. Detecting biofilm production is not routine in all clinical laboratories, but it is essential for understanding the persistence of infections. Several phenotypic methods are available, each with varying degrees of reliability, complexity, and applicability.
Table 2: Comparison of Phenotypic Methods for Biofilm Detection
| Method | Principle | Reported Performance | Advantages | Disadvantages |
|---|---|---|---|---|
| Tissue Culture Plate (TCP) | Quantifies biofilm via optical density (OD) after crystal violet staining [104] [107]. | High sensitivity; considered the gold standard [104] [107]. | Quantitative, highly sensitive, and reliable. | Labor-intensive, time-consuming, requires specialized equipment [104]. |
| Congo Red Agar (CRA) | Differentiates biofilm producers based on colony color on a specific medium [104]. | Sensitivity: 81.8%, Specificity: 61.5% (catheter isolates) [104]. | Simple, low-cost, suitable for initial screening. | Lower specificity, qualitative or semi-quantitative. |
| Tube Method (TM) | Assesses biofilm as a visible film lining the test tube [104]. | Sensitivity: 72.7%, Specificity: 46.2% (catheter isolates) [104]. | Very simple and inexpensive to perform. | Subjective interpretation, low specificity, not quantitative. |
A cross-sectional study from Syria provided a direct comparison of these methods, establishing the TCP as the reference standard. The study reported that the Microplate assay detected biofilm in 88.6% of catheter isolates and 78.6% of urine isolates, confirming the high prevalence of biofilm formation among CAUTI pathogens [104]. The study also concluded that strong biofilm formers exhibited significantly higher levels of antimicrobial resistance, reinforcing the critical link between biofilm formation and treatment failure [104].
Detailed Experimental Protocol: Tissue Culture Plate Method
The following protocol, adapted from multiple studies, outlines the standard procedure for the quantitative assessment of biofilm formation using the TCP method [104] [107].
- Preparation of Inoculum: From a fresh agar plate, inoculate the test organism into a tube containing 10 mL of Trypticase Soy Broth (TSB) supplemented with 1% glucose. Incubate the broth at 37°C for 24 hours under stationary conditions.
- Dilution: Dilute the incubated broth 1:100 with fresh, sterile TSB supplemented with 1% glucose.
- Inoculation of Microtiter Plate: Dispense 200 µL of the diluted bacterial suspension into individual wells of a sterile, flat-bottomed 96-well polystyrene tissue culture plate. Include control wells containing sterile broth only to check for non-specific binding and contamination.
- Incubation: Cover the plate with its lid or Parafilm and incubate at 37°C for 24 hours.
- Washing: After incubation, gently tap the plate to remove the contents of the wells. Wash each well four times with 200 µL of phosphate-buffered saline (PBS, pH 7.2) to remove all non-adherent, planktonic cells.
- Fixation: Add 200 µL of 2% sodium acetate to each well to fix the adherent biofilms. Allow it to stand for 30 minutes.
- Staining: Remove the fixative and stain the biofilms by adding 200 µL of a 0.1% (w/v) crystal violet solution to each well. Let it stand for 15-20 minutes.
- Destaining/Washing: Gently tip out the crystal violet and rinse the plate thoroughly under running tap water. Invert the plate on absorbent paper and allow it to dry completely.
- Elution and Quantification: Add 200 µL of 95% ethanol or acetic acid to each well to solubilize the dye bound to the biofilm. Measure the optical density (OD) of each well at a wavelength of 570 nm using a microtiter plate reader.
- Interpretation: The OD value is used as an index of biofilm formation. Isolates are typically classified as non-biofilm producers, weak, moderate, or strong biofilm producers based on comparison to the OD of the control well and established cut-off values.
Comparative Evaluation of Pathogen Identification Techniques
Rapid and accurate identification of the causative agent is crucial for managing CAUTIs. While conventional biochemical methods have been the mainstay for decades, advanced technologies like MALDI-TOF MS are revolutionizing clinical microbiology.
Table 3: Comparison of Pathogen Identification Methods
| Method | Technology Principle | Performance Data | Turnaround Time |
|---|---|---|---|
| Conventional Biochemical Tests | Phenotypic profiling based on metabolic reactions [116]. | Basis for comparison; may have limited accuracy for rare species. | 24-48 hours after pure culture isolation. |
| MALDI-TOF MS (Matrix-Assisted Laser Desorption/Ionization Time-of-Flight Mass Spectrometry) | Analyzes unique protein fingerprints (ribosomal proteins) of microorganisms [116]. | Strong agreement with conventional methods (κ=0.787). Misclassification rate: 7.7% (mainly Enterococcus/Candida) [116]. | Minutes to hours after pure culture isolation. |
A study conducted in an ICU setting, which analyzed 780 catheterized urine samples, found that MALDI-TOF MS demonstrated excellent accuracy for pathogen identification [116]. The most common pathogens identified were Candida species (56.4%), Enterococcus (17.9%), and Escherichia coli (12.2%) [116]. The high prevalence of Candida and Enterococcus in this ICU cohort highlights how the patient population can influence pathogen distribution. The speed and reliability of MALDI-TOF MS make it an invaluable tool for enhancing diagnostic workflows, despite a slight risk of misidentification among certain genera.
Detailed Experimental Protocol: MALDI-TOF MS Identification
The standard workflow for microbial identification using MALDI-TOF MS is as follows [116]:
- Sample Preparation: A single bacterial or fungal colony from a pure culture plate is smeared directly onto a target steel plate.
- Overlaying Matrix: The smear is immediately overlaid with 1-2 µL of a saturated matrix solution (usually α-cyano-4-hydroxycinnamic acid) and allowed to dry at room temperature.
- Insertion into Instrument: The target plate is loaded into the MALDI-TOF MS instrument.
- Mass Spectrometry Analysis: The sample is irradiated with a laser, causing the ionization of molecules. The time-of-flight of the ionized particles, primarily highly abundant ribosomal proteins, is measured, generating a unique mass spectral fingerprint for the microorganism.
- Spectral Comparison: The obtained mass spectrum is compared against a comprehensive database of reference spectra stored in the instrument's software.
- Identification: The software provides an identification result with a confidence score. A high score indicates reliable identification to the species level.
The Scientist's Toolkit: Essential Research Reagents and Materials
Successful research in CAUTI pathogenesis and method validation relies on a suite of specific reagents and materials. The table below details key components used in the experiments cited throughout this guide.
Table 4: Essential Research Reagents and Materials for CAUTI Studies
| Item | Specific Example | Primary Function in CAUTI Research |
|---|---|---|
| Culture Media | Trypticase Soy Broth (TSB) with 1% glucose [104] [107] | Enhances biofilm formation for phenotypic detection assays. |
| Culture Media | Cysteine Lactose Electrolyte-Deficient (CLED) Agar [104] | Supports the growth of uropathogens while preventing Proteus swarming. |
| Staining Reagents | Crystal Violet (0.1% w/v) [104] [107] | Stains the extracellular polymeric matrix of biofilms for visualization and quantification. |
| Staining Reagents | Congo Red Agar [104] | Differential medium for preliminary screening of biofilm production. |
| Laboratory Equipment | 96-well Flat-Bottom Polystyrene Tissue Culture Plate [104] [107] | Provides a standardized surface for quantitative biofilm assays. |
| Laboratory Equipment | Microtiter Plate Reader (ELISA reader) [107] | Precisely measures optical density for quantifying biofilm mass. |
| Chemical Reagents | Phosphate-Buffered Saline (PBS), pH 7.2 [107] | Used for washing steps to remove non-adherent planktonic cells. |
| Chemical Reagents | Sodium Acetate (2%) [107] | Acts as a fixative to stabilize formed biofilms prior to staining. |
| Identification System | MALDI-TOF MS Instrumentation & Database [116] | Enables rapid, high-throughput microbial identification based on protein signatures. |
The comparative data presented in this guide underscores a clear trajectory in CAUTI diagnostics and research: while conventional phenotypic methods for biofilm detection and biochemical identification remain foundational, they are increasingly being supplemented or replaced by more robust, rapid, and quantitative technologies.
The Tissue Culture Plate method stands out as the most reliable technique for validating biofilm formation in a research context, despite its operational complexity. For routine pathogen identification, MALDI-TOF MS has proven to be a transformative tool, demonstrating strong agreement with conventional methods while drastically reducing turnaround time [116]. The integration of these validated methods into research and clinical practice is critical for advancing our understanding of CAUTI pathogenesis. It directly facilitates the development of targeted therapeutic strategies and effective antimicrobial stewardship programs, which are essential in an era of escalating antibiotic resistance [114] [117].
Biofilms, defined as structured communities of microorganisms embedded within a self-produced extracellular polymeric substance (EPS), constitute a significant challenge across clinical, industrial, and research settings [55]. These complex assemblages are notoriously resistant to antibiotics and host immune responses, contributing to persistent infections and material contamination [55] [49]. The global economic burden of biofilm management is staggering, with recent estimates exceeding $5 trillion annually across various industries [118]. Within healthcare specifically, biofilms are implicated in over 80% of human microbial infections, with catheter-associated urinary tract infections (CAUTIs) and chronic wounds representing prominent examples [55] [118]. The accurate detection of biofilms therefore represents a critical frontier in microbial pathogenesis and therapeutic development.
The fundamental challenge in biofilm research lies in navigating the inherent trade-off between methodological precision and accessibility. Advanced techniques like scanning electron microscopy (SEM) and confocal laser scanning microscopy (CLSM) offer high-resolution visualization but require substantial financial investment, specialized training, and complex sample preparation [49] [50]. Conversely, conventional staining methods like crystal violet and Congo red provide cost-effective and accessible alternatives but lack the ability to differentiate cellular components from the surrounding matrix [49]. This comparative guide objectively evaluates current biofilm detection methodologies through the dual lenses of analytical precision and practical accessibility, providing researchers with a structured framework for method selection based on specific experimental requirements and resource constraints.
Comparative Performance Analysis of Biofilm Detection Methods
The evaluation of biofilm detection methods requires a multidimensional approach, considering not only sensitivity and specificity but also cost, time investment, and equipment requirements. The table below provides a quantitative comparison of commonly employed techniques based on recent experimental findings.
Table 1: Comprehensive Comparison of Biofilm Detection Method Performance Characteristics
| Detection Method | Sensitivity | Specificity | Cost | Time | Equipment Needs | Key Applications |
|---|---|---|---|---|---|---|
| Tissue Culture Plate (TCP) | 88.6% (catheter isolates) [55] | Used as reference [55] | Medium | 24-48 hours [119] | Spectrophotometer, incubator [55] | Quantitative screening, antibiotic susceptibility testing [55] |
| Congo Red Agar (CRA) | 40-81.8% [55] [119] | 35-61.5% [55] [119] | Low | 24-48 hours [119] | Standard incubator [119] | Initial phenotypic screening, low-resource settings [55] |
| Tube Method (TM) | 60-72.7% [55] [119] | 45-46.2% [55] [119] | Low | 24-48 hours [119] | Basic laboratory equipment [119] | Qualitative assessment, teaching laboratories [119] |
| Fluorescence Imaging | 84% [118] [120] | Not specified | High | Minutes (point-of-care) [118] | Dedicated imaging device [118] | Clinical wound assessment, biofilm localization [118] |
| Dual-Staining (Maneval's) | Comparable to TCP [49] | Comparable to TCP [49] | Very Low | 30-45 minutes [50] | Light microscope [49] | Matrix differentiation, resource-limited settings [49] |
| Scanning Electron Microscopy (SEM) | Considered gold standard [118] | Considered gold standard [118] | Very High | Days (sample processing) [49] | Specialized electron microscope [49] | Ultra-structural analysis, research validation [118] |
The performance disparities between methods highlight the critical precision-accessibility tradeoff. While the Tissue Culture Plate (TCP) method demonstrates superior sensitivity for catheter isolates (88.6%) and is widely considered the reference standard for quantitative assessment, it requires approximately 24-48 hours for completion and access to a spectrophotometer [55] [119]. In contrast, the recently developed dual-staining method using Maneval's stain completes analysis within 30-45 minutes and differentiates bacterial cells from the EPS matrix using a standard light microscope, offering a unique balance of speed, accessibility, and functional differentiation [49] [50].
Clinical applications demand particular methodological considerations. For chronic wound management, fluorescence imaging demonstrates superior sensitivity (84%) compared to clinical signs assessment (44%) or biofilm blotting (24%), enabling real-time localization of bacterial loads at the point-of-care [118] [120]. This capability is clinically significant as it provides immediate, actionable information to guide debridement and targeted antimicrobial therapy [118].
Experimental Protocols for Key Biofilm Detection Methods
Tissue Culture Plate Method (Quantitative Reference Standard)
The TCP method serves as the gold standard for quantitative biofilm assessment due to its robust reproducibility and reliable quantification capabilities [55] [119]. The experimental workflow proceeds as follows:
Table 2: Reagent Solutions for TCP Method
| Reagent | Composition/Preparation | Function |
|---|---|---|
| Trypticase Soy Broth with 1% Glucose | TSB supplemented with 1% w/v glucose | Provides nutrient-rich medium for biofilm growth |
| Phosphate Buffered Saline (PBS) | 0.1 M phosphate buffer, pH 7.4 | Gently removes non-adherent planktonic cells |
| Crystal Violet Stain | 0.1% w/v aqueous solution | Binds to protein and polysaccharides in biofilm matrix |
| Sodium Acetate | 2% w/v solution | Fixes biofilm to well surface |
First, freshly cultured bacterial isolates are inoculated into 10 mL of trypticase soy broth supplemented with 1% glucose and incubated at 37°C for 24 hours [55]. The cultures are then diluted 1:100 with fresh medium, and 200 µL aliquots are dispensed into individual wells of a sterile 96-well flat-bottom polystyrene tissue culture plate [55]. The plate is covered with Parafilm and incubated at 37°C for 24 hours to allow biofilm formation [55]. After incubation, the plate contents are gently shaken out to remove planktonic cells, and each well is washed three to four times with sterile distilled water to remove loosely associated bacteria [55]. The washed plates are then inverted to dry. Biofilms are fixed by adding 200 µL of 2% sodium acetate for 30 minutes, followed by another washing cycle [55]. Staining is performed with 200 µL of 0.1% crystal violet for 15 minutes, after which the plate is washed again and inverted to dry [55]. Quantitative analysis is performed by measuring the optical densities of the stained biofilms using a micro-ELISA autoreader at a wavelength of 570 nm [119]. The experiment should be performed in triplicate and repeated three times for statistical reliability [119].
Dual-Staining Method with Maneval's Stain (Cost-Effective Alternative)
The dual-staining method represents a significant advancement in accessible biofilm visualization, enabling differentiation between bacterial cells and the extracellular matrix using basic laboratory equipment [49] [50]. The protocol proceeds as follows:
First, microbial cultures are adjusted to the 0.5 McFarland standard and diluted 1:100 using sterilized nutrient broth [50]. A sterilized glass slide is placed in a 90 × 15 mm polystyrene Petri dish and completely submerged in the diluted culture broth [50]. For polymicrobial biofilm formation, equal volumes of different microbial suspensions can be combined [49]. The setup is incubated at 37°C in undisturbed conditions for three days to promote robust biofilm formation [50]. After incubation, the slide is gently rinsed by dipping it in distilled water for 5 seconds to remove unadhered microbial cells, taking care to avoid excessive force that might disrupt the biofilm structure [50]. The biofilm is fixed by immersing the slide in 4% formaldehyde for 15-30 minutes at room temperature, followed by complete air-drying for 5-10 minutes [50]. Extended drying periods should be avoided to prevent crack formation in the biofilm structure [50]. The fixed biofilm is then stained with 1% Congo red stain, ensuring even coverage, with excess stain removed by gently tilting the slide [50]. The slide is air-dried for 5-10 minutes without washing [50]. Maneval's stain is then applied to completely cover the biofilm and incubated for 10 minutes at room temperature [50]. After incubation, excess stain is removed by tilting the slide, followed by air-drying for 5 minutes [50]. The stained biofilm is finally observed under a light microscope using 100× oil immersion, with representative images captured for documentation and analysis [50].
Emerging Techniques: Spectroscopic and Fluorescence-Based Detection
Advanced spectroscopic methods represent the cutting edge of biofilm detection technology, offering non-destructive, real-time monitoring capabilities. Near-infrared (NIR) spectroscopy has demonstrated significant potential for rapid biofilm characterization, achieving 80-93.75% classification accuracy for various bacterial species on food-contact surfaces [102]. The methodology involves spectral data acquisition using a portable analytical spectral device like the LabSpec 4 Standard-Res, which boasts a spectral resolution of 3 nm in the visible and near-infrared range [102]. To enhance data quality, acquired spectral signatures are processed with Standard Normal Variate (SNV) and Savitzky-Golay filters to correct systematic variations and eliminate random noise [102]. Subsequent principal component analysis (PCA) reduces data dimensionality, followed by Random Forest discriminant statistical analysis to accurately classify biofilm types [102].
UV laser-induced fluorescence (UV-LIF) represents another promising approach that leverages the autofluorescence of intrinsic fluorophores within microorganisms, including amino acids (tryptophan), NADH, and flavins [121]. Recent technological innovations have incorporated LED-based light sources, offering advantages in power consumption, cost-effectiveness, and compact size compared to conventional laser systems [121]. Experimental validation with Staphylococcus epidermidis biofilms has demonstrated detection capability reaching 7.1 × 10³ CFU/cm² after 5 hours of growth, prior to visual detectability [121]. This sensitivity profile enables early-stage intervention, which is crucial for preventing mature biofilm establishment in both clinical and industrial contexts.
Methodological Selection Framework for Research Applications
The optimal selection of biofilm detection methodology depends primarily on research objectives, resource availability, and required throughput. The following decision framework provides guidance for method selection based on common research scenarios:
For antibiotic susceptibility testing and biofilm-related resistance profiling, the Tissue Culture Plate method remains the preferred approach due to its quantitative nature and established correlation with antimicrobial resistance patterns [55]. Research has demonstrated that biofilm-producing organisms exhibit significantly higher resistance profiles compared to their planktonic counterparts, with biofilm-producing gram-positive organisms showing 87% resistance to ampicillin versus 77% in non-biofilm producers, and similar patterns observed in gram-negative isolates [119].
For rapid clinical assessment in wound care settings, fluorescence imaging offers superior sensitivity (84%) compared to conventional assessment of clinical signs (44%) and enables real-time localization of bacterial loads at the bedside [118]. This capability is particularly valuable for guiding targeted debridement and optimizing antimicrobial therapy in chronic wound management [118].
For resource-limited settings or high-throughput screening applications, the dual-staining method with Maneval's stain provides an optimal balance of cost-effectiveness and functional differentiation, enabling clear visualization of the blue polysaccharide matrix surrounding magenta-red bacterial cells [49] [50]. This method requires only basic laboratory equipment (light microscope) and can be completed within 30-45 minutes, making it particularly suitable for laboratories with budget constraints [50].
Essential Research Reagent Solutions for Biofilm Studies
The reliability and reproducibility of biofilm research depend critically on consistent reagent quality and appropriate application. The following table details essential research reagents and their specific functions in biofilm detection methodologies.
Table 3: Essential Research Reagents for Biofilm Detection and Analysis
| Reagent Solution | Composition/Preparation | Primary Function | Application Methods |
|---|---|---|---|
| Maneval's Stain | 0.05g fuchsin, 3.0g ferric chloride, 5mL acetic acid, 3.9mL phenol, 95mL distilled water [50] | Differentiates bacterial cells (magenta-red) from EPS matrix (blue) [49] | Dual-staining method [50] |
| Congo Red Solution | 1% w/v aqueous solution [50] | Binds to hydrophobic regions of polysaccharides via hydrogen bonds [50] | CRA method, dual-staining [50] [119] |
| Crystal Violet | 0.1% w/v aqueous solution [55] | Stains protein and polysaccharide components of biofilm matrix [55] | TCP method, tube method [55] [119] |
| Trypticase Soy Broth with 1% Glucose | TSB supplemented with 1% w/v glucose [55] | Nutrient-rich medium enhancing biofilm formation [55] | TCP method, biofilm growth [55] |
| Formaldehyde (4%) | 4% v/v in distilled water or PBS [50] | Cross-links and fixes biofilm structure while preserving architecture [50] | Sample preparation for staining, SEM [50] |
The critical innovation of the dual-staining approach lies in the sequential application and chemical interaction between Congo red and Maneval's stain. Congo red initially interacts with the hydrophobic regions of polysaccharides through hydrogen bonds, staining them red [50]. Subsequent application of Maneval's stain creates an acidic environment that causes protonation of the azo group in Congo red, shifting the color to blue [50]. Simultaneously, the acid fuchsin component of Maneval's stain binds to negatively charged bacterial surfaces, creating magenta-red coloration [50]. This differential staining mechanism enables clear visualization of the complex biofilm architecture without requiring advanced microscopic equipment.
The comparative analysis of biofilm detection methodologies reveals that method selection must be driven by specific research questions and practical constraints. While advanced techniques like SEM and CLSM provide unparalleled structural resolution, their implementation requires substantial financial investment and technical expertise [49]. Conversely, conventional methods like the Tube method and Congo red agar offer accessibility but lack differentiation capabilities and demonstrate variable sensitivity (40-72.7%) and specificity (35-61.5%) [55] [119].
The emerging paradigm in biofilm research emphasizes strategic methodological integration, combining accessible screening techniques with confirmatory advanced analysis. The dual-staining method using Maneval's stain represents a significant advancement in cost-effective biofilm visualization, offering matrix differentiation capabilities approaching those of more sophisticated methods [49] [50]. Similarly, technological innovations in spectroscopic and fluorescence-based detection are progressively bridging the gap between precision and accessibility, enabling real-time monitoring capabilities for both industrial and clinical applications [102] [121].
Future directions in biofilm detection methodology will likely focus on enhancing the quantitative aspects of accessible techniques while reducing the cost and complexity of high-resolution approaches. The continuing refinement of these methodologies remains fundamental to advancing our understanding of biofilm pathogenesis and developing effective anti-biofilm therapeutic strategies across clinical and industrial domains.
Inter-laboratory Reproducibility and Standardization Initiatives in Biofilm Research
Biofilm research faces a significant challenge: the lack of reproducibility across different laboratories has become a considerable concern within the scientific community [122]. This reproducibility crisis stems from multiple factors, including selective or incomplete reporting of experiments and the absence of robust, standardized methods [122]. The issue is particularly pressing because biofilms are now recognized as the default bacterial lifestyle, with profound implications across medicine, industry, and environmental science [123]. Microtiter plate-based methods, among the most widely used tools in biofilm research, exemplify this challenge—while they are inexpensive, easy to use, and adaptable for high-throughput screening, results obtained with these methods have historically been difficult to reproduce consistently across laboratories [122] [124].
Recognizing these challenges, the biofilm research community has initiated concerted efforts to develop standardized protocols, minimum information guidelines, and interlaboratory studies (ring trials) to establish reproducible methods [125]. These initiatives aim to transform biofilm research by creating common foundations that enable reliable comparison of results across different research groups and laboratories. Standardization not only addresses the reproducibility crisis but also drives innovation by providing a validated framework for testing new anti-biofilm strategies and making credible product claims [125]. This comparative guide examines the current state of inter-laboratory reproducibility and standardization initiatives, providing researchers with objective data to select appropriate models and methods for their specific biofilm research applications.
Comparative Analysis of Biofilm Research Models and Their Reproducibility
Quantitative Reproducibility Metrics Across Assessment Methods
Interlaboratory studies provide crucial quantitative data on the reproducibility of different biofilm assessment methods. A comprehensive ring trial evaluated three common microtiter plate-based biofilm quantification methods across five laboratories, measuring reproducibility through the reproducibility standard deviation (SR) on a log10 scale [122] [124].
Table 1: Reproducibility of Microtiter Plate Biofilm Assessment Methods in Control Experiments
| Assessment Method | Reproducibility SD (SR) | Key Characteristics | Best Application Context |
|---|---|---|---|
| Crystal Violet | 0.44 | Measures stained biomass; requires plate reader calibration | Basic biofilm formation assessment |
| Resazurin | 0.53 | Assesses metabolic activity; requires fluorescence calibration | Metabolic activity screening |
| Plate Counts | 0.92 | Quantifies viable cells; more variable but directly measures viability | Antimicrobial efficacy testing |
In treatment experiments evaluating sodium hypochlorite efficacy against Staphylococcus aureus biofilms, plate counts demonstrated the best responsiveness to different efficacy levels and the best reproducibility with respect to responsiveness (Slope/SR = 1.02), making it the most reliable method for antimicrobial efficacy testing despite its higher variability in control experiments [122].
Standardized Biofilm Reactor Models in Research
Beyond microtiter plates, several biofilm reactor models have undergone standardization efforts and interlaboratory validation:
Table 2: Standardized Biofilm Reactor Models and Reproducibility Characteristics
| Reactor Model | Standard Reference | Key Applications | Reproducibility Evidence |
|---|---|---|---|
| Drip Flow Reactor (DFR) | ASTM E2647-20 | Studying biofilms on surfaces under low shear stress; medical device materials | Protocol optimization enables reproducible biofilm formation [36] |
| CDC Biofilm Reactor (CDC-BR) | ASTM E2562-22 | Generating high cell density biofilms for antimicrobial testing | Established standard method with demonstrated reproducibility [36] |
| MBEC Assay | Not specified | High-throughput antimicrobial susceptibility testing | Standardized protocol available [80] |
A direct comparison of the DFR and CDC-BR models for studying biofilm formation on reusable stainless steel medical device material demonstrated that both could serve as practical models, though they produced biofilms with different structural characteristics and cell densities [36]. The CDC-BR produced biofilms with significantly higher cell densities (approximately 8.5 log10 CFU/coupon) compared to the DFR (approximately 6.5 log10 CFU/coupon), highlighting how model selection must align with research objectives [36].
Experimental Protocols for Standardized Biofilm Assessment
Standardized Microtiter Plate Protocol for Interlaboratory Studies
The interlaboratory study evaluating microtiter plate methods employed a meticulously designed protocol separated into three distinct steps to ensure reproducibility [122]:
Biofilm Growth Protocol:
- Organism: Staphylococcus aureus subsp. aureus (ATCC 25923)
- Inoculum preparation: Colonies from TSA plates were transferred to TSB and incubated at 37 ± 2°C, 125 rpm overnight, then sub-inoculated to exponential growth phase (OD = 0.300 at 595 nm or 7.5 ± 0.5 Log10 CFU/mL)
- Inoculum dilution to 5.5 ± 0.5 Log10 CFU/mL in TSB
- Biofilm formation: 200 μL/well in 96-well plates at 37 ± 2°C, no shaking for 24h in humidified incubator
- Negative controls: Wells containing only TSB to check for contamination
Biofilm Challenge Protocol (for treatment experiments):
- Antimicrobial agent: Sodium hypochlorite (NaOCl) at four concentrations (1000 mg/L, 500 mg/L, 100 mg/L, and 10 mg/L)
- Exposure time: 10 minutes followed by neutralization with PBS washes
- Experimental design: All concentrations tested on the same day with 8 wells per treatment
Biofilm Assessment Methods:
- Crystal violet: Biomass staining with absorbance measurement at λ = 595 nm
- Resazurin: Metabolic activity assessment with fluorescence measurement at λexcitation = 560 nm; λemission = 590 nm
- Plate counts: Viable cell enumeration with appropriate dilution series
A critical aspect of the protocol was the inclusion of plate reader calibration tests for both crystal violet and resazurin methods, as output values can vary greatly across different instrument models and manufacturers [122].
Workflow Visualization: Standardized Microtiter Plate Assay
The following diagram illustrates the comprehensive workflow for standardized microtiter plate biofilm assays, integrating both control and treatment experiments:
Standardized Microtiter Plate Biofilm Assay Workflow
Multi-Laboratory Study Design for Reproducibility Assessment
Recent advances in reproducibility assessment include the development of sophisticated multi-laboratory study designs. One such approach involved five laboratories across three continents conducting identical experiments using shipped materials, detailed protocols, and standardized fabricated ecosystems (EcoFAB 2.0 devices) [126]. The study design included:
- Standardized Materials Distribution: Nearly all supplies (EcoFABs, seeds, synthetic community inoculum, filters) were distributed from the organizing laboratory
- Detailed Protocol Documentation: Written protocols and annotated videos ensured consistent execution across laboratories
- Treatment Variations: Comparison of different synthetic bacterial communities to test inoculum-dependent effects
- Centralized Analysis: All sequencing and metabolomic analyses performed at a single laboratory to minimize analytical variation
- Data Sharing: Publicly accessible benchmarking data and protocols for community validation and extension
This comprehensive approach demonstrated consistent plant phenotypes, exudate composition, and microbiome assembly across different laboratories, providing a model for future reproducibility studies in biofilm research [126].
The Scientist's Toolkit: Essential Research Reagent Solutions
Successful standardization in biofilm research depends on using well-characterized reagents and materials. The following table details essential research reagent solutions identified through interlaboratory studies:
Table 3: Essential Research Reagent Solutions for Standardized Biofilm Research
| Reagent/Material | Function in Biofilm Research | Standardization Consideration | Example from Literature |
|---|---|---|---|
| Crystal Violet | Biomass staining and quantification | Requires calibration curves for cross-laboratory comparison; different plate reader models produce variable outputs [122] | 0.01 g/L starting concentration for calibration curve [122] |
| Resazurin | Metabolic activity assessment | Must be chemically reduced to resorufin for standardization; fluorescence measurement requires instrument-specific calibration [122] | 5 µg/mL starting concentration for calibration curve [122] |
| Sodium Hypochlorite (NaOCl) | Biofilm challenge agent for efficacy testing | Titration tests required to measure total chlorine concentration; specific concentrations must be freshly prepared [122] | Four test concentrations: 1000, 500, 100, and 10 mg/L [122] |
| Synthetic Microbial Communities (SynComs) | Standardized inoculum for reproducibility studies | Must be available through public biobanks with cryopreservation and resuscitation protocols [126] | 17-member bacterial community for grass rhizosphere studies [126] |
| Tryptic Soy Broth (TSB) | Standard growth medium for biofilm formation | Consistent preparation and lot-to-lot variability must be controlled across laboratories | Used for S. aureus biofilm growth in interlaboratory study [122] |
| Fabricated Ecosystems (EcoFABs) | Standardized habitats for reproducible plant-microbiome studies | Sterile devices with controlled environments distributed from central source [126] | EcoFAB 2.0 devices for Brachypodium distachyon studies [126] |
Minimum Information Guidelines and Reporting Standards
The biofilm research community has developed several important initiatives to improve reporting standards and experimental documentation:
MIABiE (Minimum Information About a Biofilm Experiment)
The MIABiE guidelines represent a crucial standardization effort that specifies the essential information authors should include to enable replication of biofilm experiments in third-party laboratories [125]. These guidelines help address the reproducibility crisis by ensuring critical methodological details are documented, including:
- Strain information and cultivation conditions
- Biofilm growth surface specifications
- Environmental parameters during biofilm development
- Assessment methods and analytical conditions
- Statistical analysis approaches
Compliance with MIABiE guidelines has been shown to improve the replicability of microtiter plate-based biofilm experiments, particularly when combined with standardized protocols [122].
Platform and Database Initiatives
Beyond reporting guidelines, the biofilm community has established platforms and databases to systematically collect and share biofilm experiment data:
- BiofOmics: A database that collects biofilm experiments data on a systematic and standardized basis [123]
- International Biofilm Standards Tasks Group (IBSTG): A global initiative comprising members from multiple biofilm centers to coordinate standardization activities [125]
- Public Biobanks: Resources like the DSMZ-German Collection of Microorganisms that provide standardized model communities with cryopreservation and resuscitation protocols [126]
These initiatives represent a growing infrastructure supporting reproducible biofilm research through shared materials, data standards, and coordinated methodology development.
The ongoing standardization initiatives in biofilm research represent a paradigm shift toward more reproducible and reliable science. Interlaboratory studies have demonstrated that when suitable experimental designs and statistical analyses are applied, even common methods like microtiter plate assays can exhibit good repeatability and reproducibility across different laboratories [122]. The key factors enabling this reproducibility include detailed protocols, calibration standards for instrumentation, standardized reagents, and adherence to minimum information guidelines.
Future directions in biofilm standardization are likely to incorporate emerging technologies and approaches. The integration of big data and machine learning offers promising avenues for enhancing analytical capabilities and fostering innovation in the field [31]. Additionally, the development of more sophisticated mechanical characterization methods [123] and advanced imaging protocols [80] will provide new dimensions for standardized biofilm assessment. As these initiatives mature, they will increasingly support both fundamental research and the development of effective anti-biofilm strategies by providing validated, reproducible experimental frameworks that enable reliable comparison of results across the global research community.
Conclusion
The comparative evaluation of biofilm research models reveals a diverse ecosystem of methodological approaches, each with distinct advantages and limitations for specific research contexts. Foundational understanding of biofilm architecture and development informs appropriate model selection, while methodological innovations continue to enhance our technical capabilities. However, significant translational challenges persist, particularly in bridging the gap between simplified laboratory models and complex real-world biofilm environments. Validation studies consistently demonstrate that method choice significantly impacts research outcomes, with no single approach universally superior across all applications. Future directions should prioritize developing more physiologically relevant models that better recapitulate in vivo conditions, establishing standardized validation protocols across research communities, and fostering greater collaboration between academic researchers and industrial partners through frameworks like BRIEF. The ongoing refinement of biofilm research models remains crucial for advancing therapeutic interventions, improving clinical outcomes, and addressing the substantial economic burden of biofilm-associated infections across healthcare and industry sectors.
References
- 1. What We Still Don't Know About Biofilms—Current ... [https://www.mdpi.com/2036-7481/16/2/46]
- 2. The EPS Matrix: The “House of Biofilm Cells” - PMC [https://pmc.ncbi.nlm.nih.gov/articles/PMC2168682/]
- 3. Matrix matters: How extracellular substances shape biofilm ... [https://www.sciencedirect.com/science/article/abs/pii/S0927776524006003]
- 4. Bacterial Biofilm Inhibition: A Focused Review on Recent ... [https://www.frontiersin.org/journals/microbiology/articles/10.3389/fmicb.2021.676458/full]
- 5. The role of extracellular DNA in the formation, architecture ... [https://pmc.ncbi.nlm.nih.gov/articles/PMC8667714/]
- 6. Identification of Extracellular DNA-Binding Proteins in the ... [https://pmc.ncbi.nlm.nih.gov/articles/PMC6593408/]
- 7. Extracellular DNA filaments associated with surface ... [https://www.nature.com/articles/s41522-025-00751-5]
- 8. Classical and Modern Models for Biofilm Studies [https://www.mdpi.com/2079-6382/13/12/1228]
- 9. The biofilm life cycle– expanding the conceptual model of ... [https://pmc.ncbi.nlm.nih.gov/articles/PMC9841534/]
- 10. Biofilm dispersion - PMC - PubMed Central - NIH [https://pmc.ncbi.nlm.nih.gov/articles/PMC8564779/]
- 11. Multifunctional antibiofilm materials: surface engineering ... [https://www.sciencedirect.com/science/article/abs/pii/S1742706125005240]
- 12. Microbial Biofilm: A Review on Formation, Infection ... [https://www.mdpi.com/2076-2607/11/6/1614]
- 13. Biofilms: structure, resistance mechanism, emerging control ... [https://pubs.rsc.org/en/content/articlehtml/2025/pm/d5pm00094g]
- 14. Biofilms and their role in pathogenesis [https://www.immunology.org/public-information/bitesized-immunology/pathogens-disease/biofilms-and-their-role-pathogenesis]
- 15. Biofilm Maturation and Resistance Quorum Sensing Connection [https://www.biolscigroup.us/articles/OJB-9-129.php]
- 16. Better models, better treatment? a systematic review of ... [https://pmc.ncbi.nlm.nih.gov/articles/PMC12061920/]
- 17. Tolerance and Resistance of Pseudomonas aeruginosa ... [https://www.frontiersin.org/journals/microbiology/articles/10.3389/fmicb.2019.00913/full]
- 18. Pseudomonas aeruginosa in the Frontline of the Greatest ... [https://pmc.ncbi.nlm.nih.gov/articles/PMC11596597/]
- 19. Comparative Analysis of Biofilm Formation and Antibiotic ... [https://pmc.ncbi.nlm.nih.gov/articles/PMC12382965/]
- 20. Escaping the ESKAPE pathogens: A review on antibiofilm ... [https://www.sciencedirect.com/science/article/abs/pii/S0882401024003097]
- 21. Comparative Analysis of Biofilm Formation and Antibiotic ... [https://pubmed.ncbi.nlm.nih.gov/40868035/]
- 22. Assessment of antimicrobial resistance, biofilm formation, ... [https://www.sciencedirect.com/science/article/pii/S2405844024064958]
- 23. In Vitro Analysis of Interactions Between Staphylococcus ... [https://www.mdpi.com/2079-6382/14/5/504]
- 24. Editorial: ESKAPE biofilm: challenges and solutions [https://www.frontiersin.org/journals/cellular-and-infection-microbiology/articles/10.3389/fcimb.2023.1253439/full]
- 25. Restriction of growth and biofilm formation of ESKAPE ... [https://www.frontiersin.org/journals/microbiology/articles/10.3389/fmicb.2024.1428808/full]
- 26. Mathematical perspectives on bacterial quorum sensing - PMC [https://pmc.ncbi.nlm.nih.gov/articles/PMC12546806/]
- 27. Biofilms Exposed: Innovative Imaging and Therapeutic ... [https://pmc.ncbi.nlm.nih.gov/articles/PMC12466655/]
- 28. Quorum sensing systems in biofilm formation and the ... [https://www.sciencedirect.com/science/article/abs/pii/S0963996925019611]
- 29. Comparative evaluation of biofilm-forming capacity in ... [https://www.frontiersin.org/journals/cellular-and-infection-microbiology/articles/10.3389/fcimb.2025.1570422/full]
- 30. Analysing the integrated quorum sensing (iqs) system and ... [https://www.frontiersin.org/journals/cellular-and-infection-microbiology/articles/10.3389/fcimb.2025.1575421/full]
- 31. Biofilm research advances from an innovative bibliometric ... [https://www.sciencedirect.com/science/article/pii/S2949864325000141]
- 32. Comparison of Biofilm Growth and Quorum Sensing ... [https://www.mdpi.com/2036-7481/15/3/100]
- 33. Analysis of biofilm assembly by large area automated AFM [https://www.nature.com/articles/s41522-025-00704-y]
- 34. Application to Bacterial Biofilm Matrix Transcriptomics [https://link.springer.com/article/10.1007/s00284-025-04435-3]
- 35. Microplastic surface biofilms: a review of structural ... [https://www.frontiersin.org/journals/marine-science/articles/10.3389/fmars.2025.1701766/full]
- 36. Comparison of Two Models of Biofilm Formation on ... [https://www.sciencedirect.com/science/article/pii/S019567012500355X]
- 37. Impact of nutrient abundance on multispecies biofilm ... [https://pubmed.ncbi.nlm.nih.gov/41136133/]
- 38. Starvation-induced metabolic adaptation of Bacillus cereus ... [https://www.sciencedirect.com/science/article/abs/pii/S0963996925015054]
- 39. Stress-hardening behaviour of biofilm streamers [https://www.nature.com/articles/s41467-025-64557-x]
- 40. The interplay of adhesion, friction, and nutrient availability ... [https://www.nature.com/articles/s44431-025-00007-4]
- 41. Quantification and Comparison of Different Biofilm ... [https://pmc.ncbi.nlm.nih.gov/articles/PMC12388762/]
- 42. An overview of various methods for in vitro biofilm formation [https://pmc.ncbi.nlm.nih.gov/articles/PMC10533769/]
- 43. Comparison of methods for the detection of biofilm formation ... [https://pmc.ncbi.nlm.nih.gov/articles/PMC3804187/]
- 44. Growing and Analyzing Static Biofilms - PMC [https://pmc.ncbi.nlm.nih.gov/articles/PMC4568995/]
- 45. Modification of the Congo red agar method to detect biofilm ... [https://www.sciencedirect.com/science/article/pii/S073288931200497X]
- 46. Assessment of the biofilm-forming ability on solid surfaces ... [https://www.nature.com/articles/s41598-022-22929-z]
- 47. Critical Assessment of Methods to Quantify Biofilm Growth ... [https://pmc.ncbi.nlm.nih.gov/articles/PMC6022921/]
- 48. Evaluation of bacterial biofilm, smear layer, and debris ... [https://pmc.ncbi.nlm.nih.gov/articles/PMC11742200/]
- 49. A novel dual-staining method for cost-effective visualization ... [https://www.nature.com/articles/s41598-024-80644-3]
- 50. Microbial Biofilm Detection and Differentiation by Dual ... [https://pmc.ncbi.nlm.nih.gov/articles/PMC11896776/]
- 51. Biofilm viability checker: An open-source tool for automated ... [https://www.nature.com/articles/s41522-021-00214-7]
- 52. CLSM and SEM Analysis of Biofilm Structure Under ... [https://bio-protocol.org/exchange/minidetail?id=5607160&type=30]
- 53. Investigation of shockwave treatment for disruption ... [https://www.nature.com/articles/s41598-025-19955-y]
- 54. Biofilm formation and analysis of EPS architecture ... [https://www.sciencedirect.com/science/article/abs/pii/S0963996925006118]
- 55. Comparative analysis of biofilm detection methods and ... [https://pmc.ncbi.nlm.nih.gov/articles/PMC12625357/]
- 56. Options and Limitations in Clinical Investigation of Bacterial ... [https://pmc.ncbi.nlm.nih.gov/articles/PMC6056845/]
- 57. Review Mathematical modeling for the prediction of biofilm ... [https://www.sciencedirect.com/science/article/abs/pii/S0963996924013188]
- 58. Relevance of the Computational Models of Bacterial ... [https://arxiv.org/abs/2503.23998]
- 59. Mathematical modelling of nutrient-dependent biofilm ... [https://arxiv.org/html/2509.18065v1]
- 60. Image Analysis Software Based on Color Segmentation for ... [https://pmc.ncbi.nlm.nih.gov/articles/PMC2655470/]
- 61. Evaluating models and assessment techniques for ... [https://pmc.ncbi.nlm.nih.gov/articles/PMC10464519/]
- 62. Deep generative modeling of annotated bacterial biofilm ... [https://www.nature.com/articles/s41522-025-00647-4]
- 63. Biofilms and Wounds: An Overview of the Evidence - PMC [https://pmc.ncbi.nlm.nih.gov/articles/PMC4486148/]
- 64. and Biofilm healing: from bench to bedside | European Journal... wound [https://eurjmedres.biomedcentral.com/articles/10.1186/s40001-023-01121-7]
- 65. 3D Biofilm Models Containing Multiple Species for Antimicrobial... [https://pmc.ncbi.nlm.nih.gov/articles/PMC9611244/]
- 66. Impact of material properties for improved Pseudomonas ... [https://pmc.ncbi.nlm.nih.gov/articles/PMC12375099/]
- 67. Bioengineered Platforms for Chronic Wound Infection Studies [https://www.frontiersin.org/journals/bioengineering-and-biotechnology/articles/10.3389/fbioe.2019.00418/full]
- 68. Efficacy Test Methods, Test Criteria, and Labeling ... [https://www.epa.gov/pesticide-analytical-methods/efficacy-test-methods-test-criteria-and-labeling-guidance]
- 69. Biofilms and multidrug resistance: an emerging crisis ... [https://www.frontiersin.org/journals/bioengineering-and-biotechnology/articles/10.3389/fbioe.2025.1625356/full]
- 70. Advanced Anti-Biofilm Technologies for Biomedical Devices [https://www.sciencedirect.com/science/article/pii/S3050837125000451]
- 71. Repurposing High-Throughput Screening Reveals ... [https://www.mdpi.com/2079-6382/14/4/402]
- 72. A High-Throughput Screening Platform of Microbial Natural ... [https://pmc.ncbi.nlm.nih.gov/articles/PMC5332434/]
- 73. Recent advances in high-throughput screening methods ... [https://www.sciencedirect.com/science/article/abs/pii/S1367593125000031]
- 74. In vitro antibiofilm efficacy of ertapenem, tobramycin, and ... [https://journals.plos.org/plosone/article?id=10.1371/journal.pone.0318487]
- 75. Surface remodeling and inversion of cell-matrix ... [https://www.nature.com/articles/s41467-024-55602-2]
- 76. High-Throughput Screening for Compounds that Modulate ... [https://pubmed.ncbi.nlm.nih.gov/28889313/]
- 77. Translational challenges and opportunities in biofilm science [https://pubmed.ncbi.nlm.nih.gov/36038607/]
- 78. Targeting microbial biofilms: current and prospective ... [https://pmc.ncbi.nlm.nih.gov/articles/PMC5685531/]
- 79. Supporting the strategic pillars of translational research in ... [https://www.nature.com/articles/s41522-022-00354-4]
- 80. Experimental Designs to Study the Aggregation and ... [https://pmc.ncbi.nlm.nih.gov/articles/PMC8793059/]
- 81. Drug delivery approaches for enhanced antibiofilm therapy [https://www.sciencedirect.com/science/article/abs/pii/S0168365922008161]
- 82. Directed evolution of phages in biofilms enhances ... [https://www.nature.com/articles/s41467-025-65014-5]
- 83. Identification of priority questions in biofilm research ... [https://www.sciencedirect.com/science/article/pii/S2590207524000352]
- 84. Comparative metabolic study of planktonic and sessile cells in ... [https://pmc.ncbi.nlm.nih.gov/articles/PMC11761094/]
- 85. Biofilms: Formation, Research Models, Potential Targets, and ... [https://pmc.ncbi.nlm.nih.gov/articles/PMC9561771/]
- 86. Transcriptomic analysis of mature biofilm and planktonic ... [https://www.sciencedirect.com/science/article/abs/pii/S074000202500139X]
- 87. Challenges in the Microbiological Diagnosis of Implant ... [https://pmc.ncbi.nlm.nih.gov/articles/PMC8586543/]
- 88. Translational challenges and opportunities in biofilm science [https://www.nature.com/articles/s41522-022-00327-7]
- 89. Comparison of 3 Real-Time, Quantitative Murine Models ... [https://pmc.ncbi.nlm.nih.gov/articles/PMC3929216/]
- 90. Challenges to Antimicrobial Susceptibility Testing of Plant- ... [https://pmc.ncbi.nlm.nih.gov/articles/PMC7968511/]
- 91. Foodborne Lactic Acid Bacteria Inactivate Planktonic and ... [https://www.mdpi.com/2304-8158/14/21/3670]
- 92. Comparative Study of Different Sampling Methods ... [https://pmc.ncbi.nlm.nih.gov/articles/PMC9234490/]
- 93. The dual-species biofilm formed by Staphylococcus aureus ... [https://www.nature.com/articles/s41538-025-00581-x]
- 94. Efficacy of a Sonicating Swab for Removal and Capture ... [https://pmc.ncbi.nlm.nih.gov/articles/PMC5930312/]
- 95. Comparative assessment of biofilm sampling methods on ... [https://meetingorganizer.copernicus.org/biofilms9/biofilms9-136.html]
- 96. Comparative Study of Different Sampling Methods ... [https://www.frontiersin.org/journals/microbiology/articles/10.3389/fmicb.2022.892181/full]
- 97. Evaluation of Two Surface Sampling Methods for ... [https://www.sciencedirect.com/science/article/pii/S0362028X22096065]
- 98. Microbial Primer: In vivo biofilm - PMC [https://pmc.ncbi.nlm.nih.gov/articles/PMC10765038/]
- 99. From in vitro to in vivo Models of Bacterial Biofilm-Related ... [https://pmc.ncbi.nlm.nih.gov/articles/PMC4235718/]
- 100. Comparative analysis of biofilm models to determine the ... [https://pubmed.ncbi.nlm.nih.gov/33780904/]
- 101. Biofilm Resilience: Molecular Mechanisms Driving Antibiotic Resistance in Clinical Contexts - PMC [https://pmc.ncbi.nlm.nih.gov/articles/PMC11852148/]
- 102. Advances in the Detection and Identification of Bacterial ... [https://pmc.ncbi.nlm.nih.gov/articles/PMC11941196/]
- 103. Optimization of pathogen detection in abscess specimens: a 6-year retrospective study - PubMed [https://pubmed.ncbi.nlm.nih.gov/40660369/]
- 104. Comparative analysis of biofilm detection methods and ... [https://bmcmicrobiol.biomedcentral.com/articles/10.1186/s12866-025-04506-2]
- 105. Assessment of four in vitro phenotypic biofilm detection ... [https://pmc.ncbi.nlm.nih.gov/articles/PMC10664881/]
- 106. Comparison of methods for the detection of biofilm production ... [https://pmc.ncbi.nlm.nih.gov/articles/PMC2973941/]
- 107. Comparative evaluation of biofilm-forming capacity in ... [https://pmc.ncbi.nlm.nih.gov/articles/PMC12350247/]
- 108. Advantages and limitations of microtiter biofilm assays in ... [https://www.nature.com/articles/s41598-020-77198-5]
- 109. Biochemistry of Bacterial Biofilm: Insights into Antibiotic ... [https://www.mdpi.com/2075-1729/15/1/49]
- 110. Actividad de los antimicrobianos en biocapas bacterianas [https://www.elsevier.es/es-revista-enfermedades-infecciosas-microbiologia-clinica-28-articulo-actividad-los-antimicrobianos-biocapas-bacterianas-S0213005X08726673]
- 111. Is Increased Biofilm Formation Associated with Decreased ... [https://pmc.ncbi.nlm.nih.gov/articles/PMC12566419/]
- 112. Correlation between antimicrobial resistance, biofilm ... [https://ann-clinmicrob.biomedcentral.com/articles/10.1186/s12941-024-00679-2]
- 113. A Four-Year Study of Antibiotic Resistance, Prevalence ... [https://www.mdpi.com/2076-0817/14/1/59]
- 114. Comparative Assessment of Lower Urinary Tract Infections ... [https://pmc.ncbi.nlm.nih.gov/articles/PMC12114290/]
- 115. Comparative Analysis of Clinical Situation, Pathogen ... [https://www.sciencepg.com/article/10.11648/j.cmr.20251403.12]
- 116. Comparative Evaluation of Conventional Methods and ... [https://pubmed.ncbi.nlm.nih.gov/40438855/]
- 117. A Dual Analysis of Publications and Patents [https://www.mdpi.com/2036-7449/17/3/64]
- 118. Exploring Reliable Accessible Biofilm Detection Methods - PMC [https://pmc.ncbi.nlm.nih.gov/articles/PMC11475494/]
- 119. An evaluation of three different biofilm detection methods in ... [https://ijmmtd.org/archive/volume/8/issue/1/article/8738]
- 120. Exploring Reliable Accessible Biofilm Detection Methods [https://pubmed.ncbi.nlm.nih.gov/39410520/]
- 121. Compact and cost-effective autofluorescence sensor for ... [https://www.sciencedirect.com/science/article/abs/pii/S0013935125014227]
- 122. Interlaboratory study for the evaluation of three microtiter ... [https://www.nature.com/articles/s41598-021-93115-w]
- 123. Towards standardized mechanical characterization of ... [https://pmc.ncbi.nlm.nih.gov/articles/PMC6102240/]
- 124. Interlaboratory study for the evaluation of three microtiter ... [https://pubmed.ncbi.nlm.nih.gov/34215805/]
- 125. The role of standards in biofilm research and industry ... [https://www.sciencedirect.com/science/article/abs/pii/S0964830522001603]
- 126. Breaking the reproducibility barrier with standardized ... [https://journals.plos.org/plosbiology/article?id=10.1371/journal.pbio.3003358]