Flow Cytometry vs. Fluorescence Microscopy: A Quantitative Analysis of Cell Viability Correlation
This article provides a comprehensive analysis of the correlation between flow cytometry (FCM) and fluorescence microscopy (FM) in cell viability assessment, a critical task for researchers and drug development professionals.
Flow Cytometry vs. Fluorescence Microscopy: A Quantitative Analysis of Cell Viability Correlation
Abstract
This article provides a comprehensive analysis of the correlation between flow cytometry (FCM) and fluorescence microscopy (FM) in cell viability assessment, a critical task for researchers and drug development professionals. We explore the foundational principles of both techniques and present recent comparative study data demonstrating a strong statistical correlation (r=0.94) between their viability measurements. The content details methodological protocols for accurate viability staining, addresses common troubleshooting scenarios, and provides a framework for technique selection and data validation. By synthesizing methodological insights with practical optimization strategies, this guide empowers scientists to generate more reliable and reproducible viability data in biomaterial research and preclinical evaluation.
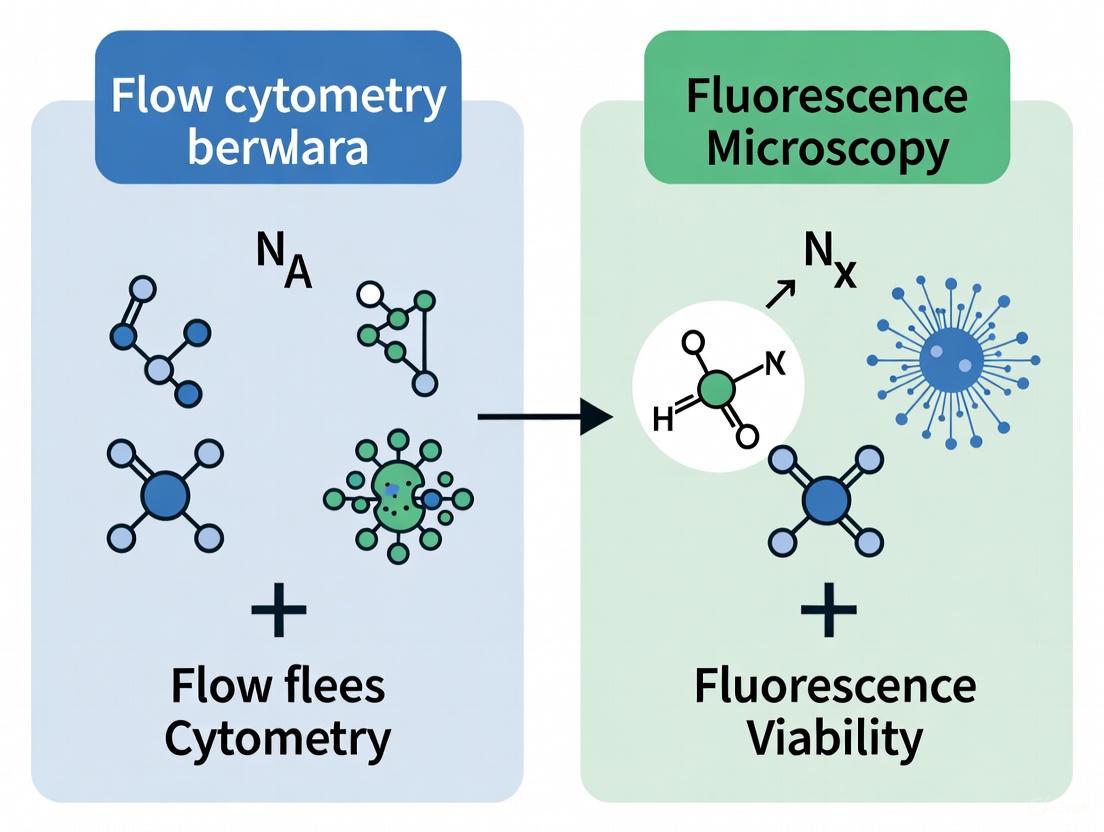
Fundamental Principles: How Flow Cytometry and Fluorescence Microscopy Measure Cell Viability
In the quest to understand cellular heterogeneity and function, two advanced technological paradigms have emerged: laser-based single-cell analysis and spatial imaging. While both aim to characterize biological systems at the microscopic level, they operate on fundamentally different principles and address distinct research questions. Laser-based methods typically involve analyzing or manipulating individual cells in suspension, often prioritizing high-throughput quantification and deep molecular profiling. In contrast, spatial imaging technologies preserve the architectural context of tissue samples, enabling researchers to study cellular organization and cell-cell interactions within their native microenvironment.
This comparison guide examines the core working principles of these approaches within the specific context of viability assessment research, where the correlation between flow cytometry (a laser-based method) and fluorescence microscopy (an imaging technique) has been extensively studied. Understanding their methodological foundations, performance characteristics, and limitations provides crucial insights for researchers selecting optimal tools for drug development and biomedical research.
Core Working Principles and Technical Foundations
Laser-Based Single-Cell Analysis
Laser-based single-cell analysis encompasses technologies that utilize focused laser light to interrogate or manipulate individual cells, typically in suspension. The fundamental principle involves passing single cells through a laser beam and detecting the resulting light interactions.
Flow Cytometry: As a cornerstone technology, flow cytometry hydrodynamically focuses cells into a single-file stream that passes through one or multiple laser beams. Detectors measure forward scatter (indicating cell size), side scatter (indicating cellular granularity/complexity), and fluorescence emissions from labeled antibodies or viability dyes [1]. Sophisticated optical systems separate these light signals through dichroic mirrors and bandpass filters, enabling simultaneous multiparametric detection of up to 30+ parameters in advanced systems.
Laser Interference Microscopy (LIM): This label-free technique analyzes laser light interference patterns after passing through cells. The phase thickness fluctuations of cellular structures provide information about metabolic activity and viability without requiring fluorescent dyes [2]. LIM measures temporal dynamics of optical thickness near the nucleolus boundary, with the power spectrum slope of these fluctuations serving as a key indicator of cell viability (β > 1.00 for viable attached MCF-7 cells; β > 0.71 for suspended cells) [2].
Functionalized Microwell Laser Sorting (FMLS): This emerging approach combines wettability-based microwell arrays with laser-induced forward transfer technology. The system captures individual microbial cells in femtoliter droplet arrays, then uses a 532-nm laser pulse (5 ns duration) to eject specific cells into a collection receiver [3]. FMLS achieves >80% single-cell capture efficiency while maintaining >95% cell viability after sorting [3].
Spatial Imaging Technologies
Spatial imaging technologies preserve the architectural context of tissue samples while enabling molecular characterization, mapping biological data onto their original physical coordinates within the sample.
Fluorescence Microscopy (FM): This conventional approach uses specific wavelength light to excite fluorescent dyes or proteins, with detectors capturing the emitted light at longer wavelengths. For viability assessment, FM typically employs fluorescent double-staining protocols such as FDA/PI (fluorescein diacetate/propidium iodide) or acridine orange/ethidium bromide to distinguish viable from non-viable cells based on membrane integrity [2] [1]. The fundamental limitation is the diffraction barrier (~200 nm resolution), restricting the level of detail observable with conventional systems [1].
Imaging-Based Spatial Transcriptomics: Advanced platforms including CosMx, MERFISH, and Xenium utilize iterative cycles of nucleic acid hybridization with fluorescent molecular barcodes to identify RNA molecules while mapping their subcellular locations [4] [5]. These technologies differ in their probe design, amplification strategies, cell segmentation algorithms, and panel sizes (CosMx: 1,000-plex; MERFISH: 500-plex; Xenium: 289-plex + 50 custom genes) [4]. They preserve spatial information through combinatorial hybridization strategies that can visualize hundreds to thousands of RNA species directly in situ at subcellular resolution [6].
Laser Particles for Multiplexed Cell Tagging: An emerging approach utilizes nano/microsized laser particles (LPs) internalized into cells for massively multiplexed cellular barcoding. Silica-coated III-V semiconductor microdisk LPs (∼2μm diameter, ∼400nm thickness) emit narrowband laser emission with subnanometer linewidths across the NIR-II window (1170-1580 nm) [7]. With over 400 unique colors achievable through stochastic diameter variation, this technology enables longitudinal tracking of thousands of individual cells in dense tissues while preserving cellular identity across analytical platforms [7].
Table 1: Comparative Technical Specifications of Laser-Based Single-Cell Analysis Platforms
| Technology | Core Principle | Key Measurable Parameters | Resolution | Multiplexing Capacity |
|---|---|---|---|---|
| Flow Cytometry | Hydrodynamic focusing + laser scattering | Cell size, granularity, fluorescence intensity | N/A (single-cell) | High (30+ parameters) |
| Laser Interference Microscopy | Laser light interference through cells | Phase thickness fluctuations, metabolic activity | Subcellular | Low (label-free) |
| Functionalized Microwell Laser Sorting | Laser-induced forward transfer from microwells | Cell viability, gene expression post-sorting | Single-cell | Medium (with fluorescence/Raman) |
| Fluorescence Microscopy | Fluorescence excitation/emission | Membrane integrity, localization patterns | ~200 nm (diffraction-limited) | Medium (4-5 colors typically) |
| Spatial Transcriptomics | Multiplexed FISH with fluorescent barcodes | RNA localization and expression | Subcellular | High (500-1,000 genes) |
| Laser Particles | Spectral barcoding with laser emission | Cell tracking, position, migration | Single-cell | Very High (400+ colors) |
Quantitative Performance Comparison in Viability Assessment
Recent comparative studies directly assessing cell viability measurement techniques provide robust experimental data for evaluating the performance characteristics of laser-based versus imaging approaches.
A 2025 methodological comparison of fluorescence microscopy and flow cytometry for assessing Bioglass 45S5 cytotoxicity on SAOS-2 osteoblast-like cells revealed both technologies detected the same trend: smaller particles and higher concentrations caused greater cytotoxicity [1] [8]. However, quantitative differences emerged in sensitivity thresholds. For particles <38 μm at 100 mg/mL concentration, fluorescence microscopy reported viability decreased to 9% at 3 hours and 10% at 72 hours, while flow cytometry measured more extreme reduction to 0.2% at 3 hours and 0.7% at 72 hours [1] [8].
Despite these absolute value differences, a strong correlation between the datasets existed (r = 0.94, R² = 0.8879, p < 0.0001) [1] [8]. Flow cytometry demonstrated superior precision in high-stress conditions and could differentiate viability status with greater nuance using multiparametric staining (Hoechst, DiIC1, Annexin V-FITC, and PI) to classify viable, early apoptotic, late apoptotic, and necrotic populations [1]. Fluorescence microscopy, using simpler FDA/PI staining, primarily distinguished viable from non-viable cells without apoptotic staging capability [1].
Laser interference microscopy studies established quantitative thresholds for viability assessment, determining that variable vc exceeds 20 nm² for viable attached cells, while the power spectrum slope βc must exceed 1.00 for attached MCF-7 cells and 0.71 for suspended cells to indicate viability [2]. This label-free approach avoids potential artifacts introduced by fluorescent dyes, which can sometimes affect nuclear architecture and cellular function [2].
Spatial transcriptomics platforms demonstrated variable performance in detecting transcripts critical for cell viability and phenotype assessment. CosMx displayed multiple target gene probes (e.g., CD3D, CD40LG, FOXP3) expressing at levels similar to negative controls across different tissue microarrays (ranging from 0.8% to 31.9% of target genes), while Xenium multimodal exhibited fewer such probes (0.6% in MESO2) [4]. This highlights how platform-specific probe design significantly impacts detection reliability for key cellular markers.
Table 2: Experimental Performance Metrics in Cell Viability Assessment
| Performance Characteristic | Flow Cytometry | Fluorescence Microscopy | Laser Interference Microscopy |
|---|---|---|---|
| Measurement Principle | Multiparametric fluorescence staining | FDA/PI membrane integrity staining | Phase thickness fluctuations |
| Viability Detection Sensitivity | 0.2% (under high cytotoxicity) | 9% (under high cytotoxicity) | Quantitative thresholds (vc >20 nm², βc >1.00) |
| Apoptosis Discrimination | Yes (early/late stages) | Limited | Based on metabolic activity |
| Sample Throughput | High (thousands of cells/second) | Low (limited fields of view) | Low (single-cell analysis) |
| Spatial Context Preservation | No (cells in suspension) | Yes (cells in situ) | Yes (cells in culture) |
| Label Requirement | Fluorescent dyes required | Fluorescent dyes required | Label-free |
| Correlation with Alternative Method | r = 0.94 with FM | r = 0.94 with FCM | Reference method needed |
Experimental Protocols and Methodologies
Flow Cytometry Viability Protocol
The comprehensive flow cytometry protocol for viability assessment in particulate biomaterial research involves several critical steps [1]:
Cell Preparation: SAOS-2 osteoblast-like cells are treated with Bioglass 45S5 particles of varying sizes (<38 μm, 63-125 μm, 315-500 μm) at concentrations of 25, 50, and 100 mg/mL for 3 and 72 hours.
Multiparametric Staining: Cells are stained with a cocktail of viability indicators including:
- Hoechst: DNA-binding dye for cell identification
- DiIC1: Membrane potential-sensitive dye for early apoptosis detection
- Annexin V-FITC: Phosphatidylserine exposure marker for apoptosis
- Propidium Iodide (PI): Membrane integrity indicator for late apoptosis/necrosis
Instrument Acquisition: Cells in suspension pass through the flow cytometer at rates of thousands of cells per second, with lasers exciting fluorochromes and detectors capturing emission signals.
Data Analysis: Software algorithms (e.g., FlowJo) gate populations based on light scatter and fluorescence patterns to classify cells into viable, early apoptotic, late apoptotic, and necrotic subpopulations with precise quantification.
Fluorescence Microscopy Viability Protocol
The fluorescence microscopy protocol for parallel assessment includes [1]:
Sample Preparation: Identical cell treatments as for flow cytometry, but cells remain adherent on culture surfaces.
Double Staining: Application of FDA (fluorescein diacetate, converted to green fluorescent fluorescein by esterases in viable cells) and PI (red fluorescence in dead cells with compromised membranes).
Image Acquisition: Multiple random fields of view captured using a fluorescence microscope with appropriate filter sets, typically analyzing 200-500 cells per condition.
Manual Counting: Researchers visually classify cells as viable (green), dead (red), or occasionally double-stained, calculating viability percentages.
Spatial Transcriptomics Workflow
The experimental workflow for imaging-based spatial transcriptomics involves [4] [5]:
Sample Preparation: Formalin-fixed paraffin-embedded (FFPE) or fresh frozen tissue sections (5μm thickness) mounted on specialized slides.
Morphology Staining: Hematoxylin and eosin (H&E) or immunofluorescence staining for histological assessment.
Probe Hybridization: Incubation with target-specific oligonucleotide probes conjugated with fluorescent barcodes.
Multiplexed Imaging: Multiple cycles of hybridization, imaging, and probe stripping to build up gene expression maps.
Cell Segmentation: Algorithms define cell boundaries based on nuclear staining and morphology markers.
Transcript Assignment: Bioinformatics pipelines assign detected transcripts to individual cells based on spatial coordinates.
The following workflow diagram illustrates the key decision points in selecting and implementing these technologies:
Research Reagent Solutions and Essential Materials
Successful implementation of these technologies requires specific reagent systems and materials optimized for each platform.
Table 3: Essential Research Reagents and Materials for Single-Cell Analysis
| Reagent/Material | Function | Example Applications | Technology Platform |
|---|---|---|---|
| Hoechst 33342 | DNA-binding dye for cell identification | Nuclear staining in viability panels | Flow Cytometry, Fluorescence Microscopy |
| Annexin V-FITC | Binds phosphatidylserine exposed during apoptosis | Early apoptosis detection | Flow Cytometry |
| Propidium Iodide (PI) | Membrane-impermeable DNA dye | Late apoptosis/necrosis identification | Flow Cytometry, Fluorescence Microscopy |
| FDA (Fluorescein Diacetate) | Converted to fluorescent fluorescein by esterases | Viable cell staining | Fluorescence Microscopy |
| DiIC1(5) | Membrane potential-sensitive dye | Early apoptosis indicator | Flow Cytometry |
| Formalin-Fixed Paraffin-Embedded (FFPE) Tissue | Tissue preservation for spatial analysis | Longitudinal sample archiving | Spatial Transcriptomics |
| CosMx Human Universal Cell Characterization Panel | 1,000-plex RNA detection panel | Tumor microenvironment characterization | CosMx Spatial Molecular Imager |
| MERFISH Immuno-Oncology Panel | 500-plex RNA detection panel | Immune cell mapping in tumors | MERFISH Platform |
| Xenium Human Lung Panel + Custom Genes | 289-plex + 50 custom genes | Lung cancer and mesothelioma studies | Xenium Platform |
| Silica-coated Microdisk Laser Particles | Spectral barcoding for cell tracking | Longitudinal cell migration studies | Laser Particle Imaging |
Laser-based single-cell analysis and spatial imaging technologies offer complementary strengths for cell viability assessment and broader cellular characterization. Flow cytometry provides superior quantitative precision, throughput, and detailed apoptosis staging for suspension cells, while spatial transcriptomics delivers unprecedented contextual information about cellular organization within intact tissues. Fluorescence microscopy balances simplicity and spatial preservation with lower throughput and analytical depth.
The strong correlation (r = 0.94) between flow cytometry and fluorescence microscopy viability data confirms that both methods reliably capture cytotoxic trends, despite absolute value differences [1] [8]. Technology selection should be guided by primary research questions: laser-based methods for high-throughput molecular profiling of dissociated cells, and spatial imaging when architectural context is biologically significant. Future integration of these approaches, such as combining spatial transcriptomics with laser-based validation, promises more comprehensive understanding of cellular behavior in health and disease.
Accurate cell viability assessment is a critical component in biomedical research and drug development, serving as a fundamental criterion for ensuring the quality, consistency, and safety of cellular products [9]. Within this landscape, flow cytometry and fluorescence microscopy have emerged as cornerstone techniques for viability analysis, each with distinct advantages and limitations. This guide objectively compares the performance of three principal viability staining mechanisms—DNA-binding dyes, fixable viability dyes, and functional assays—within the context of a broader research thesis exploring correlation between flow cytometry and fluorescence microscopy viability data. As demonstrated in a 2025 comparative study, although a strong correlation (r = 0.94) exists between fluorescence microscopy and flow cytometry data, the latter demonstrates superior precision, particularly under high cytotoxic stress, and offers enhanced capability to distinguish apoptotic and necrotic subpopulations [10]. Understanding the technical basis and performance characteristics of each staining mechanism is essential for researchers and drug development professionals to select fit-for-purpose methodologies that generate reliable, reproducible data.
Staining Mechanisms and Principles
DNA-Binding Dyes
Working Principle: DNA-binding dyes, also classified as non-fixable viability dyes, function based on cell membrane integrity [11]. These dyes are typically membrane-impermeant and are excluded by live cells with intact plasma membranes. In contrast, dead or dying cells with compromised membranes allow the dyes to enter the cell, where they bind to nucleic acids (DNA and/or RNA), resulting in intense fluorescent staining [11] [9]. Common examples include propidium iodide (PI), 7-aminoactinomycin D (7-AAD), and SYTOX dyes [11] [9]. PI intercalates into double-stranded DNA with little or no sequence preference, while 7-AAD specifically intercalates into GC-rich regions [11]. DAPI (4′,6-diamidino-2-phenylindole) is another example that binds to AT-rich regions in double-stranded DNA [11].
Critical Consideration: A significant limitation of conventional DNA-binding dyes is that they are not compatible with procedures involving cell fixation and permeabilization. If added after fixation and permeabilization, these dyes will cross the membranes of all cells (including those that were live at the time of staining) and bind to DNA, generating falsely positive stained samples and rendering viability discrimination impossible [11]. For intracellular staining assays, they must be added prior to fixation and permeabilization steps [11].
Fixable Viability Dyes
Working Principle: Fixable Viability Dyes (FVDs) are amine-reactive dyes that covalently bind to cellular proteins [12]. Their mechanism also relies on membrane integrity, but the outcome is different. In a live cell, the dye is cell-impermeant and can only react with amine groups on the cell surface proteins, resulting in dim staining. In a dead cell, the compromised membrane allows the dye to penetrate and react with both surface and internal amines, leading to intense fluorescent staining [12]. This creates a typically greater than 50-fold difference in fluorescence intensity between live and dead cell populations [12].
Key Advantage: The covalent modification of cellular proteins makes the staining pattern permanent and resistant to subsequent processing. This allows researchers to fix and permeabilize cells for intracellular immunophenotyping without losing the original viability staining information, which is a major advantage over non-fixable DNA dyes like PI [12]. The staining pattern remains clear and distinguishable for up to 30 days after fixation [12]. A wide palette of dyes excited by various lasers (UV, 405, 488, 532, 561, 633, 808 nm) is available to facilitate multicolor panel design [12].
Functional Viability Assays
Working Principle: Functional assays evaluate cell viability based on metabolic activity or enzymatic function within living cells, rather than just membrane integrity. A prime example is the use of esterase substrates like Calcein-AM or Celltrace [11]. These compounds are non-fluorescent and cell-permeant. Once inside a live cell, intracellular esterases cleave the AM ester group, releasing a fluorescent product that is retained in the cell cytoplasm, resulting in positive fluorescent staining of live cells [11]. This provides a direct positive marker for viable cells, in contrast to DNA-binding and fixable dyes which positively stain dead cells.
Comparative Performance Data
Quantitative Comparison of Viability Assays
The table below summarizes key characteristics and performance data of the three viability staining mechanisms, synthesizing findings from comparative studies.
Table 1: Comprehensive Comparison of Viability Staining Mechanisms
| Feature | DNA-Binding Dyes (e.g., PI, 7-AAD) | Fixable Viability Dyes (e.g., LIVE/DEAD Kit) | Functional Assays (e.g., Calcein-AM) |
|---|---|---|---|
| Staining Principle | Membrane integrity; nucleic acid intercalation [11] [9] | Membrane integrity; covalent binding to amines [12] | Metabolic activity; enzymatic conversion [11] |
| Live Cell Signal | Negative (dye excluded) [11] | Dim (surface staining) [12] | Positive (fluorescent product) [11] |
| Dead Cell Signal | Positive (bright fluorescence) [11] [9] | Positive (bright fluorescence) [12] | Negative (no enzymatic activity) |
| Fixation Compatibility | No (loses discrimination post-fixation) [11] [12] | Yes (staining preserved post-fixation) [12] | Varies by specific dye |
| Reported Viability in PBMC/PBSC Products | Consistent with other methods in fresh products [9] | Consistent with other methods in fresh products [9] | Often used in combination with other dyes (e.g., PI in FM) [10] |
| Key Limitation | High false positives (up to 40% for PI) if processed incorrectly; not fixable [11] | Requires careful dye selection for panel compatibility [12] | Does not directly report membrane integrity |
| Best For | Simple, rapid viability checks on unfixed samples; cost-effective applications | Complex multicolor panels requiring intracellular staining; archived samples | Assessing metabolic health and function; positive identification of live cells |
Correlation Data: Flow Cytometry vs. Fluorescence Microscopy
A 2025 comparative study on bioactive glass cytotoxicity provides robust experimental data correlating flow cytometry (FCM) and fluorescence microscopy (FM) viability assessments. The study used SAOS-2 osteoblast-like cells treated with Bioglass 45S5 particles of varying sizes and concentrations, stained with FDA/PI for FM and a multiparametric panel (Hoechst, DiIC1, Annexin V-FITC, PI) for FCM [10].
Table 2: Experimental Viability Results from FM and FCM under High Cytotoxic Stress [10]
| Condition | Viability via Fluorescence Microscopy (FDA/PI) | Viability via Flow Cytometry (Multiparametric) |
|---|---|---|
| <38 µm particles at 100 mg/mL (3 h) | 9% | 0.2% |
| <38 µm particles at 100 mg/mL (72 h) | 10% | 0.7% |
| Untreated Control | >97% | >97% |
The study concluded that despite a strong overall correlation (r = 0.94, R² = 0.8879, p < 0.0001) between the two techniques, FCM consistently reported lower viability percentages under high cytotoxic stress [10]. This discrepancy is attributed to FCM's superior ability to detect early apoptotic events and its higher sensitivity in distinguishing dimly stained or small cells from background debris, which might be misclassified in manual FM analysis [10]. Furthermore, FCM provided an additional layer of information by distinguishing between early apoptosis, late apoptosis, and necrosis, a capability generally absent in standard FM live/dead assays [10].
Detailed Experimental Protocols
Protocol: Viability Assessment using DNA-Binding Dyes (e.g., PI) with Flow Cytometry
This protocol is adapted from methods used in comparative viability studies [9].
- Sample Preparation: Prepare a single-cell suspension in an appropriate buffer like Hank's Balanced Salt Solution (HBSS). Adjust cell concentration to 1x10⁵ to 1x10⁷ cells/mL.
- Staining: Add Propidium Iodide (PI) to the cell suspension at a recommended working concentration (e.g., 1-5 µg/mL). Gently vortex to mix.
- Incubation: Incubate the stained suspension at room temperature for 5-15 minutes, protected from light. Note: No wash step is required before acquisition [9].
- Flow Cytometry Acquisition: Acquire samples on a flow cytometer within a short time frame (e.g., 1 hour) to maintain staining integrity. Use 488 nm laser for excitation and measure emission at ~617 nm.
- Analysis: Gate on the single-cell population using FSC-A vs. FSC-H. Create a histogram or dot plot for the PI channel. PI-negative events are classified as viable; PI-positive events are classified as non-viable [9].
Protocol: Viability Assessment using Fixable Viability Dyes with Flow Cytometry
This protocol is based on manufacturer instructions and application notes [12].
- Sample Preparation: Wash cells in cold PBS or a protein-free buffer. Resuspend the cell pellet at 1x10⁶ to 1x10⁷ cells/mL in cold PBS.
- Staining: Add the appropriate LIVE/DEAD Fixable Viability Dye (reconstituted in DMSO) to the cell suspension. Mix immediately and thoroughly.
- Incubation: Incubate the cells for 20-30 minutes on ice, protected from light.
- Washing: Wash the cells twice with cold PBS or a complete culture medium to remove any unreacted dye.
- Optional Fixation: If intracellular staining is required, fix the cells at this stage (e.g., with 1-4% formaldehyde). The viability stain will be preserved.
- Flow Cytometry Acquisition & Analysis: Acquire on a flow cytometer using the appropriate laser and filter set. Dead cells will be highly fluorescent, forming a distinct population from the dimly stained live cells [12].
Protocol: Simultaneous Live/Dead Staining for Fluorescence Microscopy
This protocol reflects the method used in the 2025 comparative study, which employed Fluorescein Diacetate (FDA) and PI [10].
- Sample Preparation: Culture or seed cells on a microscope-suitable surface (e.g., glass coverslip, chambered slide).
- Staining Solution: Prepare a working solution containing both FDA (e.g., 0.5-1 µg/mL) and PI (e.g., 5-10 µg/mL) in culture medium or buffer.
- Staining: Replace the culture medium with the staining solution. Incubate for 5-20 minutes at 37°C, protected from light.
- Washing: Gently rinse the cells with PBS to remove excess dye.
- Imaging: Observe immediately under a fluorescence microscope using standard FITC (for FDA/green live cells) and TRITC (for PI/red dead cells) filter sets. Capture multiple random fields for statistical analysis [10].
Visualization of Experimental Workflows and Mechanisms
Viability Dye Mechanisms and Post-Staining Workflow
Flow Cytometry Gating Strategy for Viability Analysis
The Scientist's Toolkit: Essential Reagents and Materials
Table 3: Key Reagent Solutions for Viability Staining Experiments
| Reagent / Material | Function / Purpose | Example Products / Notes |
|---|---|---|
| Propidium Iodide (PI) | Cell-impermeant DNA-binding dye for dead cell discrimination in non-fixed samples [11] [9]. | Common, cost-effective. Can yield false positives if used incorrectly [11]. |
| 7-Aminoactinomycin D (7-AAD) | DNA-binding dye for dead cell staining; binds GC-rich regions [11] [9]. | Used in flow cytometry; suitable for assays where cells are not fixed [9]. |
| LIVE/DEAD Fixable Viability Dyes | Amine-reactive dyes for dead cell staining that are compatible with cell fixation [12]. | Available in multiple colors (e.g., Violet, Aqua, Green) for panel flexibility [12]. |
| Calcein-AM | Cell-permeant esterase substrate for positive staining of live cells based on metabolic activity [11]. | Used in functional assays and fluorescence microscopy (often combined with PI) [10] [11]. |
| Acridine Orange (AO) | Cell-permeant nucleic acid dye that stains all nucleated cells (live and dead). | Typically used in combination with PI in automated cell counters (e.g., Cellometer) [9]. |
| Amine Reactive Compensation Beads | Used with fixable viability dyes to create single-stain controls for flow cytometry compensation [12]. | Essential for accurate multicolor panel setup (e.g., ArC Amine Reactive Compensation Bead Kit) [12]. |
| Cell Staining Buffer (Protein-Free PBS) | Provides an optimal environment for amine-reactive dye staining, preventing unwanted protein cross-reaction [12]. | Critical for clean and specific staining with fixable viability dyes. |
In biomedical research, particularly in preclinical cytotoxicity evaluation, the selection of an appropriate cell analysis technique is paramount. Flow cytometry (FCM) and fluorescence microscopy (FM) represent two foundational approaches for assessing cell viability and function, each with distinct advantages and limitations. Understanding their key performance metrics—throughput, resolution, and information output—is essential for researchers to make informed methodological choices. This guide provides an objective comparison of these techniques within the context of a broader thesis exploring the correlation between flow cytometry and fluorescence microscopy viability data, drawing upon recent experimental studies to highlight their complementary strengths and applications.
The correlation between FCM and FM data has been systematically investigated in recent comparative studies. Research examining the cytotoxicity of bioactive glass on osteoblast-like cells demonstrated a strong statistical correlation (r = 0.94, R² = 0.8879, p < 0.0001) between viability measurements obtained from both techniques [1] [8]. This significant correlation validates both methods for biomaterial cytotoxicity assessment while also revealing critical differences in their sensitivity and informational content that merit detailed exploration.
Technical Comparison of Performance Metrics
The performance of FCM and FM can be objectively evaluated across three fundamental metrics that directly impact their applicability for different research scenarios.
Throughput
Throughput refers to the number of cells that can be analyzed within a specific time frame, directly influencing the statistical power of experiments.
Flow Cytometry: Traditional FCM systems typically analyze thousands of cells per second, with advanced imaging flow cytometry (IFC) systems now achieving remarkable speeds. Recent developments have demonstrated IFC with real-time throughput exceeding 1,000,000 events per second [13]. High-throughput fluorescence lifetime imaging flow cytometry (FLIM) can operate at over 10,000 cells per second [14].
Fluorescence Microscopy: Conventional widefield FM has significantly lower throughput as it typically analyzes only a few fields of view, leading to potential sampling bias [1]. However, advanced techniques like super-resolution panoramic integration (SPI) microscopy can achieve high-content screening of 5,000–10,000 cells per second while maintaining continuous sample sweeping [15].
Resolution
Resolution defines the level of spatial detail that can be distinguished in cellular analysis.
Flow Cytometry: Conventional FCM provides no spatial resolution beyond light scattering properties. Imaging flow cytometry bridges this gap by capturing cellular images with spatial resolution of 780 nm in advanced systems [13] and approximately 0.8 μm in FLIM flow cytometry [14].
Fluorescence Microscopy: Standard widefield FM is limited by the diffraction barrier to approximately 200 nm resolution [1]. Super-resolution techniques like SPI microscopy overcome this limitation, achieving sub-diffraction resolution of 116 ± 9 nm after deconvolution, effectively doubling the resolution of conventional microscopy [15].
Information Output
Information output encompasses the type, quality, and dimensionality of data generated.
Flow Cytometry: FCM provides high-throughput, quantitative, multiparametric data for each cell but traditionally lacks morphological context [16]. Modern IFC captures up to 12 channels of fluorescence images simultaneously, enabling detailed analysis of nuclear shape, granule distribution, and protein co-localization [17]. FLIM flow cytometry adds another dimension by measuring fluorescence lifetime, which is unaffected by intensity fluctuations and provides sensitivity to environmental factors [14].
Fluorescence Microscopy: FM offers intuitive visual information about cellular morphology and spatial relationships but has traditionally been limited in quantitative capabilities and susceptible to subjective interpretation [1]. Advanced FM techniques now enable instant super-resolution image formation with continuous throughput, capturing both subcellular details and macroscopic structures [15].
Table 1: Direct Comparison of Key Performance Metrics Between Techniques
| Performance Metric | Conventional Flow Cytometry | Imaging Flow Cytometry | Conventional Fluorescence Microscopy | Super-Resolution Microscopy |
|---|---|---|---|---|
| Throughput | Thousands of cells/second | Up to 1,000,000 events/second [13] | Limited fields of view, sampling bias [1] | 5,000-10,000 cells/second [15] |
| Spatial Resolution | N/A | 780 nm [13] | ~200 nm (diffraction-limited) [1] | 116 ± 9 nm [15] |
| Morphological Information | Indirect via scatter | High-resolution cellular images [16] | Direct visualization | Subcellular detail with localization precision |
| Multiplexing Capacity | High (multiple fluorescence parameters) | Up to 12 fluorescence channels [17] | Limited by channel availability | Varies by technique |
| Environmental Sensitivity | Limited | Fluorescence lifetime imaging capability [14] | Limited | Varies by technique |
Experimental Data: A Case Study in Cytotoxicity Assessment
A recent 2025 comparative study provides compelling experimental data directly comparing FCM and FM performance in assessing cytotoxicity of bioactive glass (Bioglass 45S5) on SAOS-2 osteoblast-like cells [1] [8]. This study offers valuable insights into how these techniques perform under identical experimental conditions.
Experimental Protocol
The study employed a standardized approach to ensure direct comparability between techniques:
- Cell Culture: Human osteosarcoma cell line SAOS-2 with mature osteoblast-like phenotype [1].
- Treatment Conditions: Cells exposed to BG particles of three size ranges (<38 μm, 63-125 μm, 315-500 μm) at concentrations of 25, 50, and 100 mg/mL for 3 and 72 hours [1].
- Viability Staining:
- Data Analysis: Both techniques assessed under identical conditions with statistical correlation analysis.
Key Experimental Findings
The study revealed several important findings regarding the performance of each technique:
- Strong Correlation: Overall strong correlation (r = 0.94) between FM and FCM viability measurements [1] [8].
- Sensitivity Differences: FCM demonstrated higher sensitivity, detecting more pronounced viability reduction under high cytotoxic stress [1].
- Viability Assessment Precision: FCM showed superior precision, particularly under high cytotoxic stress conditions [1] [8].
- Subpopulation Discrimination: Only FCM could distinguish early apoptotic, late apoptotic, and necrotic cell populations [1] [8].
Table 2: Comparative Viability Assessment Under High Cytotoxic Stress (<38 μm particles at 100 mg/mL) [18]
| Time Point | Flow Cytometry Viability (%) | Coefficient of Variation (%) | Fluorescence Microscopy Viability (%) | Coefficient of Variation (%) |
|---|---|---|---|---|
| 3 hours | 0.2 ± 0 | 27.2 | 9.0 ± 6.8 | 75.4 |
| 72 hours | 0.7 ± 0.6 | 85.4 | 10.7 ± 0.9 | 8.3 |
The experimental workflow for this comparative study illustrates the parallel processing of samples and integration of data from both techniques:
Advanced Technological Developments
Recent innovations in both flow cytometry and microscopy are pushing the boundaries of what's possible in cellular analysis.
Imaging Flow Cytometry Advances
IFC represents a powerful hybrid approach that combines the high-throughput capability of conventional FCM with the spatial information provided by cellular morphology [16] [17]. Modern IFC systems can capture high-resolution images of cells at remarkable speeds, with some research systems achieving throughput beyond 1,000,000 events per second while maintaining sub-micron resolution [13]. Commercial systems like the ImageStreamX Mark II can acquire up to 12 channels of fluorescence images simultaneously, enabling complex multivariate analysis at the single-cell level [17].
The integration of artificial intelligence and machine learning with IFC is revolutionizing data analysis, enabling automated classification of cell states based on morphological features that were previously difficult to quantify [16] [17]. Furthermore, the recent introduction of cell sorters with integrated imaging capabilities, such as the BD FACSDiscover S8, allows for high-purity sorting of cells based on specific morphological features or molecular localization patterns [17].
Super-Resolution Microscopy Innovations
Super-resolution microscopy techniques have dramatically enhanced the information output of fluorescence microscopy. The recently developed SPI microscopy enables instant formation of super-resolution images in parallel with scalable, high-throughput screening [15]. This technique achieves a consistent two-fold resolution enhancement (~120 nm) while maintaining continuous throughput of up to 1.84 mm²/s, typically containing 5,000-10,000 cells/s [15].
SPI microscopy leverages multifocal optical rescaling, high-content sample sweeping, and synchronized sensor line-scan readout while preserving conventional epi-fluorescence settings [15]. This approach provides exceptional versatility, allowing researchers to capture both subcellular details and macroscopic structures across millimeter-scale fields of view, a capability that bridges the traditional gap between detail and scope in microscopic analysis.
Research Reagent Solutions
The selection of appropriate reagents is critical for obtaining reliable results in both flow cytometry and fluorescence microscopy. The following table details key reagents used in the featured cytotoxicity study and their functions:
Table 3: Essential Research Reagents for Cell Viability Assessment
| Reagent | Application | Function | Technique Compatibility |
|---|---|---|---|
| Propidium Iodide (PI) | Viability staining | Membrane-impermeant dye that binds DNA in dead cells | Flow Cytometry, Fluorescence Microscopy |
| Fluorescein Diacetate (FDA) | Viability staining | Converted to green fluorescent fluorescein in viable cells | Fluorescence Microscopy |
| Annexin V-FITC | Apoptosis detection | Binds phosphatidylserine exposed on outer membrane in early apoptosis | Flow Cytometry |
| Hoechst Stains | Nuclear staining | Binds DNA in live and dead cells for population identification | Flow Cytometry |
| DiIC1 | Mitochondrial staining | Labels active mitochondria in viable cells | Flow Cytometry |
| Calcein-AM | Viability staining | Converted to green fluorescent calcein in viable cells | Flow Cytometry, Fluorescence Microscopy |
The comparative analysis of flow cytometry and fluorescence microscopy reveals a complex landscape where technique selection must be guided by specific research requirements. Flow cytometry, particularly in its advanced imaging and fluorescence lifetime implementations, offers superior throughput, quantitative precision, and multiparametric analysis capabilities. Fluorescence microscopy provides intuitive morphological context and continues to evolve through super-resolution techniques that break traditional diffraction limits.
The strong correlation (r = 0.94) between viability measurements from both techniques supports their complementary use in comprehensive cytotoxicity assessment [1] [8]. Flow cytometry excels in high-throughput screening scenarios requiring statistical rigor and subpopulation discrimination, while fluorescence microscopy remains invaluable for morphological assessment and spatial relationship analysis. As both technologies continue to advance, their integration through approaches like imaging flow cytometry promises to further bridge the gap between high-throughput analysis and morphological detail, offering researchers unprecedented capabilities for cellular analysis in biomedical research and drug development.
Understanding Technical Limitations and Biases in Each Method
The accurate assessment of cell viability and function is a cornerstone of biomedical research, particularly in fields such as drug development, biomaterial testing, and immunology. Among the most widely employed techniques for cellular analysis are flow cytometry (FCM) and fluorescence microscopy (FM), each with distinct technical principles, capabilities, and limitations. Understanding the methodological biases inherent in each approach is essential for experimental design, data interpretation, and technological selection. Within the specific context of viability assessment, a growing body of research investigates the correlation and discrepancies between data generated by these two techniques. This guide provides an objective comparison of flow cytometry and fluorescence microscopy, synthesizing current experimental evidence to delineate their technical limitations and biases, thereby empowering researchers to make informed methodological decisions.
Core Principles and Comparative Technical Specifications
The fundamental difference between these techniques lies in their operational paradigm: flow cytometry is a high-throughput, suspension-based method that analyzes cells in a flowing stream, while fluorescence microscopy is an imaging-based technique that provides spatial context, typically for adhered cells.
Flow Cytometry operates by passing a single-cell suspension in a fluid stream through one or multiple laser beams. As cells intercept the light, they scatter it and, if fluorescently labeled, emit light at longer wavelengths. Detectors measure forward scatter (FSC, roughly proportional to cell size), side scatter (SSC, indicative of cell granularity/internal complexity), and fluorescence emissions. In conventional flow cytometry, optical filters (dichroic mirrors and bandpass filters) direct specific wavelength ranges to distinct detectors, following a "one detector–one fluorophore" approach [19]. A significant advancement is spectral flow cytometry, which uses a prism or diffraction grating to capture the full emission spectrum of every fluorophore across a wide range of wavelengths. This full-spectrum data is then "unmixed" computationally, significantly increasing the number of parameters that can be analyzed simultaneously and resolving fluorophores with highly overlapping emission spectra [19].
Fluorescence Microscopy illuminates the entire sample or a specific focal plane with light of a specific wavelength to excite fluorescent dyes or proteins. The emitted light is captured through an objective lens to form an image, allowing for the direct visualization of cellular and sub-localization of molecular targets [1]. Conventional widefield fluorescence microscopy is limited by the diffraction barrier (approximately 200 nm resolution) and can be hampered by issues like photobleaching and out-of-focus light [1].
Table 1: Core Technical Specifications of Flow Cytometry and Fluorescence Microscopy
| Feature | Conventional Flow Cytometry | Spectral Flow Cytometry | Fluorescence Microscopy |
|---|---|---|---|
| Throughput | High (10,000+ cells/second) [19] | High (10,000+ cells/second) [19] | Low (typically a few fields of view) [1] |
| Detection System | PMTs* with optical filters and dichroic mirrors [19] | PMT or detector array with prism/grating [19] | CCD or CMOS camera [13] |
| Multiplexing Capacity | Limited by filter configuration (often 10-20 colors) [19] | High (30-40+ colors) due to spectral unmixing [19] | Limited by filter sets and fluorophore overlap |
| Spatial Context | No | No | Yes |
| Data Output | Quantitative, population-based statistics | Quantitative, population-based statistics | Quantitative (with analysis) and qualitative images |
| Cell State for Analysis | Cells in suspension [1] | Cells in suspension | Adhered or suspended cells (in a chamber) |
*PMT: Photomultiplier Tube
Direct Comparative Data in Viability Assessment
A 2025 comparative study directly evaluated FCM and FM for assessing the cytotoxicity of particulate Bioglass 45S5 (BG) on SAOS-2 osteoblast-like cells. This study highlights how the choice of method can influence the resulting viability data, revealing a strong correlation but also critical differences in sensitivity and resolution [1] [8].
Both techniques confirmed a clear, consistent trend: smaller BG particles and higher concentrations induced greater cytotoxicity [1] [8]. However, the absolute viability percentages reported by each method differed significantly under high-stress conditions. For instance, when exposed to the smallest particles (<38 µm) at the highest concentration (100 mg/mL), FM reported viabilities of 9% at 3 hours and 10% at 72 hours. In stark contrast, FCM under the same conditions reported viabilities of just 0.2% and 0.7%, respectively [1] [8]. This indicates that FCM is more sensitive in detecting severe cytotoxic stress.
Despite these absolute differences, the overall dataset from both methods showed a strong statistical correlation (r = 0.94, R² = 0.8879, p < 0.0001), validating both for trend analysis [1] [8]. Furthermore, FCM demonstrated superior precision, evidenced by lower coefficients of variation (CV) in control samples, and a key advantage: its multiparametric staining capability (using Hoechst, DiIC1, Annexin V-FITC, and Propidium Iodide) allowed it to distinguish viable, early apoptotic, late apoptotic, and necrotic cell populations. FM, using FDA/PI staining, was largely restricted to a binary live/dead classification [1] [8].
Table 2: Comparative Viability Data for SAOS-2 Cells Exposed to Bioglass 45S5 Particles [18]
| Experimental Condition | Flow Cytometry Viability (%) | Fluorescence Microscopy Viability (%) | ||
|---|---|---|---|---|
| 3 hours | 72 hours | 3 hours | 72 hours | |
| Control | 97.6 ± 0.11 | 97.4 ± 0.5 | 88.8 ± 2.1 | 91.1 ± 0.8 |
| <38 µm [25 mg/ml] | 2.3 ± 0.9 | 0.5 ± 0.4 | 23.7 ± 11.9 | 31.7 ± 16.4 |
| <38 µm [100 mg/ml] | 0.2 ± 0 | 0.7 ± 0.6 | 9.0 ± 6.8 | 10.7 ± 0.9 |
| 63–125 µm [25 mg/ml] | 4.8 ± 4.2 | 0.6 ± 0.5 | 37.0 ± 11.4 | 38.4 ± 24.7 |
| 315–500 µm [25 mg/ml] | 22.6 ± 10.3 | 73.1 ± 1.1 | 47.9 ± 23 | 74.9 ± 10.3 |
The following workflow diagram summarizes the experimental process from this comparative study:
Experimental Workflow for Comparative Viability Study
Limitations of Fluorescence Microscopy
- Sampling Bias and Low Throughput: FM typically analyzes only a few fields of view, which may not be representative of the entire cell population, leading to sampling bias. This low throughput also makes it less suitable for detecting rare cell events [1].
- Subjectivity and Low Resolution in Crowded Fields: Manual counting is labor-intensive and subjective, while automated image analysis can struggle to accurately distinguish individual cells in confluent or clustered cultures, potentially leading to miscounting [1].
- Material Interference: Particulate biomaterials, such as bioactive glasses, can exhibit strong autofluorescence and light scattering, which inhibits fluorescence imaging and makes analysis of attached cells difficult [1].
- Limited Phenotypic Resolution: Standard FM viability protocols (e.g., FDA/PI) often lack the multiplexing capability to distinguish between different modes of cell death, such as apoptosis and necrosis, providing only a binary live/dead outcome [1] [8].
Limitations and Biases of Flow Cytometry
- Requirement for Single-Cell Suspension: FCM requires cells to be in suspension, necessitating detachment (e.g., trypsinization) of adhered cells. This process can mechanically or enzymatically stress cells, thereby altering their viability and surface marker expression and introducing a preparation artifact [1].
- Spectral Overlap and Spillover: In conventional FCM, the emission spectra of fluorophores frequently overlap, causing signal "spillover" into adjacent detectors. While compensation can correct for this, it increases background noise and can compromise data quality, especially in highly multiplexed panels [19].
- Cell Cycle and Size Bias: A critical and often overlooked bias in FCM is its susceptibility to cellular properties like cell cycle stage and size. Research shows that background autofluorescence is strongly associated with cell cycle progression. Cells in the G0/G1 phase are typically smaller and exhibit lower autofluorescence, while cells in the G2/M phase are larger and show significantly higher autofluorescence [20]. Consequently, gating on "low" vs. "high" fluorescence intensity fractions can inadvertently select for cells in different cell cycle phases, potentially confounding the interpretation of functional differences [20].
- Background Fluorescence (Autofluorescence): Cellular autofluorescence, influenced by metabolic state and proliferation rate, is a inherent source of background noise that can mask specific signals, particularly for low-abundance markers [20].
The following diagram illustrates the inherent bias in flow cytometry data caused by cell cycle and size:
Cell Cycle and Size Bias in Flow Cytometry
Essential Research Reagent Solutions
The choice of reagents, particularly fluorescent dyes and antibodies, is critical for successful experimentation with either platform. The following table details key reagents mentioned in the cited studies.
Table 3: Key Research Reagents for Cell Viability and Function Analysis
| Reagent Name | Function / Target | Application Context |
|---|---|---|
| Propidium Iodide (PI) | DNA intercalator, membrane-impermeant. Labels dead cells. | Viability staining in FCM and FM [1] [8]. |
| Fluorescein Diacetate (FDA) | Cell-permeant esterase substrate. Converted to green-fluorescent fluorescein in live cells. | Viability staining in FM (live cell indicator) [8]. |
| Annexin V-FITC | Binds phosphatidylserine (PS) exposed on the outer leaflet of the cell membrane during early apoptosis. | Distinguishing apoptotic cells in FCM (often used with PI) [1] [8]. |
| Hoechst 33342 | Cell-permeant DNA stain. Labels all nuclei. | Cell enumeration and cell cycle analysis in FCM [1]. |
| DAPI (4′,6-diamidino-2-phenylindole) | DNA intercalator, often used fixed cells. Can also bind polyphosphate (polyP) with a spectral shift. | Nuclear staining in FM; detection of polyphosphate-accumulating bacteria in FCM [21]. |
| JC-D7 | Synthetic benzimidazolinium dye, selective for polyphosphate (polyP) in living cells. | Specific labeling of intracellular polyP granules in bacteria for FCM detection and sorting [21]. |
| Tandem Dyes | Antibody-conjugated dyes with large Stokes shifts (e.g., PE-Cy7). | Highly multiplexed FCM panels, especially beneficial in spectral FCM [19]. |
Flow cytometry and fluorescence microscopy are powerful, complementary techniques for cell analysis. Flow cytometry offers superior throughput, quantitative precision, and multiparametric resolution for cell death staging, making it highly sensitive for detecting subtle population changes and severe cytotoxic stress. However, it is susceptible to biases from cell cycle, size, and autofluorescence, and requires single-cell suspensions. Fluorescence microscopy provides invaluable spatial context and is less invasive for adhered cells, but is hampered by lower throughput, sampling bias, and interference from particulate or autofluorescent materials.
The strong correlation between their viability data supports the use of FM for initial screening. For definitive, high-resolution quantification, particularly under high-stress conditions or when investigating specific death pathways, FCM is the more robust and informative tool. The emerging integration of both methods, as seen in imaging flow cytometry, promises to further overcome their individual limitations, paving the way for more comprehensive single-cell analyses in future research.
Practical Protocols: Implementing Viability Assays for Reliable Results
Standardized Staining Protocols for FM (e.g., FDA/PI) and FCM (Multiparametric Panels)
In the preclinical evaluation of biomaterials, reliable cell viability assessment is paramount. Fluorescence microscopy (FM) and flow cytometry (FCM) are two cornerstone techniques employed for this purpose, each with distinct staining protocols and analytical capabilities. FM traditionally relies on simple live/dead stains such as FDA and PI, providing a direct visual assessment of cell viability. In contrast, FCM utilizes multiparametric staining panels, enabling a more detailed quantification of cell states, including early and late apoptosis and necrosis. A 2025 comparative study on particulate bioactive glass cytotoxicity provides compelling data on the correlation and differences between these methods, revealing a strong statistical correlation (r = 0.94) while also highlighting FCM's superior precision and depth of information under high cytotoxic stress [1] [8]. This guide objectively compares the performance of these standardized staining protocols to inform researchers and drug development professionals.
Experimental Comparison: FM vs. FCM
A direct comparative study exposed SAOS-2 osteoblast-like cells to Bioglass 45S5 (BG) particles of varying sizes and concentrations, applying both FM and FCM viability assays under identical conditions [1] [8].
- Strong Correlation: A strong overall correlation was found between FM and FCM viability measurements (r = 0.94, R² = 0.8879, p < 0.0001) [1] [8].
- Superior FCM Sensitivity: FCM detected more severe viability reduction in high-stress conditions (e.g., 0.2% vs 9% viability for <38 µm particles at 100 mg/mL for 3h) and provided higher statistical precision [1] [8].
- Mechanistic Insight: FCM's multiparametric staining distinguished early apoptotic, late apoptotic, and necrotic cell populations, offering insights into the mechanism of cell death, which FM cannot differentiate [1] [8].
Table 1: Quantitative Viability Data from Comparative Study [1] [8]
| Particle Size (µm) | Concentration (mg/mL) | Time (h) | Viability by FM (FDA/PI) (%) | Viability by FCM (Multiparametric) (%) |
|---|---|---|---|---|
| < 38 | 100 | 3 | 9 | 0.2 |
| < 38 | 100 | 72 | 10 | 0.7 |
| Control | - | 3 & 72 | > 97 | > 97 |
Table 2: Performance Comparison of Staining Protocols [1] [8]
| Feature | Fluorescence Microscopy (FDA/PI) | Flow Cytometry (Multiparametric) |
|---|---|---|
| Staining Protocol | Fluorescein diacetate (FDA) & Propidium Iodide (PI) | Hoechst, DiIC1, Annexin V-FITC, Propidium Iodide (PI) |
| Viability Output | Viable (FDA+/PI-) vs. Non-viable (FDA-/PI+) | Viable, Early Apoptotic, Late Apoptotic, Necrotic |
| Throughput | Lower (manual field selection) | High (thousands of cells/second) |
| Quantitative Precision | Lower, subject to sampling bias | High, objective, large cell count |
| Key Advantage | Direct visualization, cost-effective | Multiparametric, high-resolution, quantitative |
| Key Limitation | Cannot distinguish apoptosis stages; prone to material autofluorescence | Requires cell suspension; more complex instrumentation |
Detailed Staining Protocols
Fluorescence Microscopy (FM) with FDA/PI
This protocol distinguishes live and dead cells based on membrane integrity and esterase activity [1] [8].
- Solution Preparation: Prepare working solutions of FDA and PI in buffer.
- Staining: Incubate the cell culture with the FDA/PI mixture for a designated time (e.g., 15-20 minutes) at 37°C, protected from light.
- Image Acquisition: Rinse cells gently to remove excess dye. Immediately visualize using a fluorescence microscope with appropriate filter sets.
- Analysis: Count viable (green fluorescence) and non-viable (red fluorescence) cells manually or using image analysis software.
Flow Cytometry (FCM) with a Multiparametric Panel
This protocol provides a quantitative breakdown of cell health status [1] [8].
- Cell Harvesting: Harvest cells and prepare a single-cell suspension.
- Staining:
- Viability Stain: Use a dye like DiIC1 to label metabolically active cells.
- Annexin V/PI Staining: Resuspend cells in a binding buffer. Add Annexin V-FITC and PI, then incubate in the dark.
- DNA Stain: Include a dye like Hoechst to identify nucleated cells.
- Data Acquisition: Run samples on a flow cytometer, ensuring proper calibration with controls.
- Data Analysis: Use FCM software to gate on nucleated cells and create plots (e.g., DiIC1 vs. Annexin V) to distinguish viable (DiIC1+/Annexin V-), early apoptotic (DiIC1+/Annexin V+), late apoptotic (DiIC1-/Annexin V+/PI+), and necrotic (DiIC1-/Annexin V-/PI+) populations.
Research Reagent Solutions
The following reagents are essential for implementing the described staining protocols.
Table 3: Essential Reagents for Viability Staining Protocols [1] [8]
| Reagent | Function in the Assay |
|---|---|
| Fluorescein Diacetate (FDA) | Cell-permeant esterase substrate; cleaved in live cells to produce green fluorescent fluorescein. |
| Propidium Iodide (PI) | Cell-impermeant DNA dye; enters cells with compromised membranes, staining dead cells red. |
| Hoechst 33342 | Cell-permeant DNA dye; stains the nucleus of all cells, used to identify and gate nucleated cells. |
| DiIC1(5) | Lipophilic cationic dye; accumulates in the mitochondria of active, live cells based on membrane potential. |
| Annexin V-FITC | Binds to phosphatidylserine (PS), which is externalized to the outer leaflet of the cell membrane in early apoptosis. |
Workflow and Pathway Diagrams
Experimental Workflow for FM and FCM
Cell Death Pathway and Detection
Programmed cell death, or apoptosis, is a fundamental biological process crucial for maintaining tissue homeostasis, embryogenesis, and immune function [22] [23]. The accurate detection of apoptosis is paramount in biomedical research, particularly in cancer biology and drug development, where understanding cell death mechanisms can inform therapeutic strategies. Among the various techniques available, Annexin V staining and TUNEL (Terminal deoxynucleotidyl transferase dUTP nick end labeling) assays have emerged as two cornerstone methods for identifying apoptotic cells [24] [25]. These techniques detect distinct biochemical events in the apoptotic pathway: Annexin V identifies the externalization of phosphatidylserine in the early stages of apoptosis, while the TUNEL assay detects DNA fragmentation, a characteristic feature of later-stage apoptotic events [26] [25].
The choice of detection platform significantly influences the interpretation of viability and apoptosis data. Flow cytometry (FCM) and fluorescence microscopy (FM) represent two widely used platforms, each with distinct advantages and limitations [1]. A critical understanding of the correlation and discrepancies between data generated from these platforms is essential for researchers to make informed experimental decisions and accurate biological interpretations. This guide provides a comprehensive comparison of Annexin V and TUNEL assays, framed within the context of methodological comparisons between flow cytometry and fluorescence microscopy.
Principles and Mechanisms
Biochemical Events in Apoptosis
Apoptosis is a highly regulated process characterized by a series of specific morphological and biochemical changes [22] [23]. The key events relevant to detection methods include:
- Phosphatidylserine Externalization: In viable cells, phosphatidylserine (PS) is restricted to the inner leaflet of the plasma membrane. During early apoptosis, PS is translocated to the outer leaflet, serving as an "eat-me" signal for phagocytes [25].
- Caspase Activation: A cascade of cysteine-aspartic proteases is activated, leading to the cleavage of key cellular substrates [22] [23].
- DNA Fragmentation: Caspase-activated DNAses catalyze the cleavage of nuclear DNA into oligonucleosomal fragments, a hallmark of late apoptosis [22] [26].
These distinct events occur at different stages of the apoptotic pathway, providing unique targets for detection assays.
Annexin V Staining Principle
The Annexin V assay leverages the high affinity of Annexin V, a 35-36 kDa calcium-dependent phospholipid-binding protein, for externalized phosphatidylserine [25]. When conjugated to a fluorochrome (e.g., FITC), Annexin V can bind to PS on the surface of cells in early apoptosis. This method is typically combined with a membrane-impermeant dye like propidium iodide (PI) to distinguish between early apoptotic cells (Annexin V-positive, PI-negative) and late apoptotic or necrotic cells (Annexin V-positive, PI-positive) [27] [28]. A critical advantage is its ability to detect apoptosis before the loss of membrane integrity, making it particularly useful for identifying early apoptotic events [25].
TUNEL Assay Principle
The TUNEL assay identifies apoptotic cells by labeling the 3'-hydroxyl termini of fragmented DNA [26] [29]. The enzyme Terminal deoxynucleotidyl Transferase (TdT) catalyzes the addition of modified nucleotides (e.g., dUTP labeled with fluorescein, biotin, or an alkyne moiety) to the 3'-OH ends of DNA strands. These incorporated nucleotides are then detected via fluorescence microscopy or flow cytometry [29]. This assay is highly sensitive for detecting the end-stage of apoptosis when DNA fragmentation is extensive. Modern iterations, such as the Click-iT TUNEL assays, utilize click chemistry (a copper-catalyzed azide-alkyne cycloaddition) for detection, offering improved specificity and signal-to-noise ratio [29].
Figure 1: Comparative Apoptosis Detection Pathways. This diagram illustrates the distinct biochemical events targeted by Annexin V staining (early apoptosis, green pathway) and TUNEL assays (late apoptosis, red pathway).
Methodological Comparison
Annexin V Staining Protocol
The protocol for Annexin V staining is optimized for the detection of early apoptosis and requires careful handling to preserve membrane integrity [25].
Detailed Protocol:
- Cell Preparation: Harvest cells gently, preferably using non-enzymatic dissociation methods like EDTA to prevent mechanical damage and false positives. Wash cells twice with cold PBS.
- Staining Solution Preparation: Prepare a binding buffer (10 mM HEPES/NaOH, pH 7.4, 140 mM NaCl, 2.5 mM CaCl₂). Dilute fluorescently-conjugated Annexin V (e.g., Annexin V-FITC) and Propidium Iodide (PI) in the binding buffer according to manufacturer recommendations.
- Incubation: Resuspend 1-5 x 10⁵ cells in 100 µL of the staining solution. Incubate for 15 minutes in the dark at room temperature.
- Analysis: Add 400 µL of binding buffer to the cells and analyze by flow cytometry within 1 hour. For microscopy, cells can be cytospun onto slides and fixed with 4% paraformaldehyde for 10 minutes after staining, then mounted for visualization.
Critical Notes: Calcium is essential for Annexin V binding, so the binding buffer must contain CaCl₂. The assay should be performed on live, unfixed cells for accurate assessment of membrane integrity. Including controls (untreated cells for negative background and cells treated with a known apoptosis inducer like staurosporine for positive signal) is crucial for validating the assay [25].
TUNEL Assay Protocol
The TUNEL assay is typically performed on fixed and permeabilized cells to allow enzyme and label access to the nucleus [26] [29].
Detailed Protocol (Click-iT TUNEL):
- Cell Fixation and Permeabilization: Culture cells on chamber slides or harvest and cytospin onto slides. Fix with 4% paraformaldehyde for 15 minutes at room temperature. Permeabilize the cells with 0.25% Triton X-100 in PBS for 20 minutes on ice.
- TUNEL Reaction Mixture: Prepare the TUNEL reaction cocktail containing Terminal deoxynucleotidyl Transferase (TdT) and the EdUTP (5-ethynyl-2'-deoxyuridine) nucleotide.
- Incubation and Labeling: Apply the TUNEL reaction mixture to the fixed cells and incubate in a humidified chamber at 37°C for 60 minutes. For detection, prepare the click reaction mixture containing a fluorescent azide dye (e.g., Alexa Fluor azide), copper protectant, and reaction buffer. Incubate with the cells for 30 minutes at room temperature, protected from light.
- Counterstaining and Mounting: Wash the cells and counterstain with Hoechst 33342 or DAPI to visualize all nuclei. Mount the slides with an anti-fade mounting medium.
- Analysis: Analyze the slides using fluorescence microscopy or flow cytometry (if cells are in suspension). TUNEL-positive nuclei will display bright fluorescence.
Critical Notes: The fixation and permeabilization steps are critical for assay success. Over-fixation can mask DNA breaks, while under-permeabilization can prevent reagent access. The Click-iT chemistry is more sensitive than traditional BrdU-based detection and is less prone to photobleaching [29].
Figure 2: Experimental Workflow Comparison. The Annexin V and TUNEL assays require fundamentally different sample preparation workflows, impacting their compatibility with live versus fixed cell analysis and subsequent platform choice.
Comparative Performance Data
Platform Comparison: Flow Cytometry vs. Fluorescence Microscopy
The choice between flow cytometry (FCM) and fluorescence microscopy (FM) has a substantial impact on the quantification of cell viability and apoptosis. A recent comparative study investigating the cytotoxicity of Bioglass 45S5 on SAOS-2 osteoblast-like cells highlighted significant methodological differences [1].
Table 1: Comparison of Cell Viability Assessment by Flow Cytometry and Fluorescence Microscopy [1]
| Particle Size | Concentration | Time Point | Fluorescence Microscopy Viability (%) | Flow Cytometry Viability (%) |
|---|---|---|---|---|
| Control | - | 3 h | >97% | >97% |
| < 38 µm | 100 mg/mL | 3 h | 9% | 0.2% |
| < 38 µm | 100 mg/mL | 72 h | 10% | 0.7% |
| 63-125 µm | 100 mg/mL | 3 h | 61% | 45% |
| 315-500 µm | 100 mg/mL | 3 h | 93% | 85% |
This study demonstrated a strong overall correlation between FM and FCM data (r = 0.94, R² = 0.8879, p < 0.0001) [1]. However, FCM consistently reported lower viability percentages under high cytotoxicity conditions. The authors attributed FCM's superior precision to its ability to analyze a larger number of cells (10,000-50,000 events per sample) and its objective, automated gating, which reduces sampling bias and subjective interpretation often associated with manual FM counting of a few visual fields [1]. Furthermore, FCM provided multiparametric data, distinguishing early and late apoptosis from necrosis in a single run using Annexin V and PI, a level of subpopulation distinction challenging to achieve with standard FM [1].
Direct Comparison of Annexin V and TUNEL Assays
While both assays detect apoptosis, they target different biochemical events and thus have distinct performance profiles.
Table 2: Characteristic Comparison of Annexin V and TUNEL Assays [22] [28] [26]
| Parameter | Annexin V Staining | TUNEL Assay |
|---|---|---|
| Target | Phosphatidylserine externalization | DNA fragmentation |
| Apoptosis Stage | Early stage | Late stage |
| Cell Status | Live cells (prior to membrane rupture) | Fixed and permeabilized cells |
| Specificity | High for early apoptosis; can be confounded by necrosis if not combined with PI | High for late apoptosis and necrosis; specific for DNA strand breaks |
| Throughput | High with flow cytometry | Moderate (requires fixation and permeabilization) |
| Multiplexing | Excellent with other fluorescent probes and PI | Good with nuclear counterstains (DAPI); modern kits allow multiplexing with phalloidin or fluorescent proteins |
| Key Limitation | Cannot detect late apoptotic cells with compromised membranes without PI; requires calcium | May detect non-apoptotic DNA damage (e.g., necrosis, oxidative stress) if not carefully controlled |
The most conclusive data often comes from using these assays in combination. For instance, Annexin V/PI staining can quantify early and late apoptotic populations, while TUNEL can confirm the late-stage commitment to apoptosis through DNA fragmentation [24] [28]. The CeDaD (Cell Death and Division) assay is a novel approach that combines CFSE-based cell division tracking with Annexin V-based cell death analysis in a single flow cytometric run, highlighting the trend towards integrated, multiparametric analysis [27].
The Scientist's Toolkit
Selecting the appropriate reagents and kits is fundamental for obtaining reliable and reproducible data in apoptosis detection.
Table 3: Essential Research Reagent Solutions for Apoptosis Detection
| Reagent / Kit Name | Primary Function | Key Features & Applications |
|---|---|---|
| Recombinant Annexin V (FITC) [25] | Binds to externalized phosphatidylserine on apoptotic cells. | Calcium-dependent binding; used in flow cytometry and fluorescence microscopy; often combined with PI for viability assessment. |
| Click-iT TUNEL Alexa Fluor Imaging Assays [29] | Detects DNA fragmentation in apoptotic cells via click chemistry. | High sensitivity and specificity; compatible with fluorescence microscopy and high-content screening; available in multiple fluorophores (Alexa Fluor 488, 594, 647). |
| Click-iT Plus TUNEL Assay [29] | Detects DNA fragmentation with improved multiplexing capabilities. | Optimized copper concentration preserves fluorescent protein signals and phalloidin binding; ideal for multiplexed imaging in tissue sections and adherent cells. |
| Apotracker Green [27] | Calcium-independent fluorogenic peptide for detecting apoptotic cells. | An alternative to traditional Annexin V; used in the CeDaD assay for simultaneous analysis of cell death and division by flow cytometry. |
| Propidium Iodide (PI) [1] [28] | Membrane-impermeant nucleic acid stain. | Distinguishes live/dead cells; used as a counterstain in Annexin V assays to identify late apoptotic/necrotic cells (Annexin V+/PI+). |
| CellTrace Violet [27] | Fluorescent cell membrane dye for tracking cell division. | Dye dilution with each cell division allows quantification of proliferation; used in the CeDaD assay in combination with apoptosis markers. |
Annexin V staining and TUNEL assays are powerful, yet distinct, tools for apoptosis detection. The choice between them should be guided by the specific apoptotic stage of interest and the experimental design. Annexin V is ideal for detecting early, reversible apoptosis in live cells, while TUNEL is definitive for late-stage, committed apoptosis in fixed samples.
The parallel choice of detection platform—flow cytometry or fluorescence microscopy—carries significant implications for data accuracy, throughput, and depth. Flow cytometry offers superior statistical power, objectivity, and multiparametric capabilities, making it highly suitable for quantitative studies of heterogeneous cell populations [1]. Fluorescence microscopy provides valuable spatial context and morphological detail, which is crucial for complex samples like tissues or 3D cultures [28].
For the most comprehensive analysis, researchers should consider an integrated approach. This could involve using both assays sequentially to map the progression of apoptosis or employing advanced multiparametric flow cytometry assays like CeDaD to simultaneously capture cell death and proliferation dynamics [27]. Understanding the correlation and inherent differences between FCM and FM data ensures that researchers can select the most appropriate methodology for their specific research context, ultimately leading to more reliable and biologically relevant conclusions in drug development and basic cell death research.
Sample Preparation Best Practices for Particulate Systems and Challenging Samples
Assessing cell viability in particulate systems presents unique methodological challenges for researchers in biomaterial science and drug development. Particulate biomaterials, such as bioactive glasses, can interfere with optical assays through autofluorescence and light scattering, potentially compromising accuracy [1]. This guide objectively compares two cornerstone techniques—flow cytometry (FCM) and fluorescence microscopy (FM)—within the context of a broader research thesis establishing a correlation between their viability data. A foundational 2025 study published in BioMedical Engineering OnLine directly compared these techniques under identical experimental conditions, revealing a strong statistical correlation (r = 0.94, R² = 0.8879, p < 0.0001) while also highlighting critical differences in sensitivity and informational depth [1] [8]. This article synthesizes these findings to provide best practices for sample preparation, enabling researchers to select and optimize the most appropriate method for their specific particulate system.
Technique Comparison: Flow Cytometry vs. Fluorescence Microscopy
Core Principles and Technical Specifications
Understanding the fundamental operating principles of each technology is crucial for selecting the appropriate tool for particulate systems.
Flow Cytometry (FCM): This is a high-throughput, suspension-based technique that analyzes the optical properties of cells as they pass single-file through a laser beam. It provides quantitative, multi-parametric data at rates exceeding 10,000 cells per second [1] [19]. In its advanced spectral form, it captures the full emission spectrum of fluorophores, significantly increasing the number of markers that can be analyzed simultaneously [19]. Imaging Flow Cytometry (IFC) is a hybrid technology that combines the high-throughput of FCM with the spatial information of microscopy, capturing images of cells at rates that can exceed 1,000,000 events per second in cutting-edge systems [30] [13].
Fluorescence Microscopy (FM): This technique relies on illuminating a sample with specific wavelengths of light to excite fluorescent dyes, with the emitted light captured through an objective lens to create an image [1]. It provides invaluable spatial context and direct visualization of cell-material interactions. However, its throughput is limited as it analyzes only a few fields of view, making it susceptible to sampling bias, and it can be hampered by the autofluorescence of some biomaterials [1].
Comparative Performance Analysis
The following table summarizes the key characteristics of both techniques when applied to challenging particulate samples, based on direct comparative studies.
Table 1: Technique Comparison for Particulate System Analysis
| Feature | Flow Cytometry (FCM) | Fluorescence Microscopy (FM) |
|---|---|---|
| Throughput | High (≥10,000 cells/sec) [19] | Low (Limited fields of view) [1] |
| Data Output | Quantitative, multi-parametric statistics | Qualitative/Semi-quantitative, spatial imaging |
| Viability Discrimination | Distinguishes viable, early/late apoptotic, and necrotic cells [1] [8] | Typically distinguishes only viable and non-viable cells [8] |
| Sensitivity in Cytotoxic Stress | High (Detected 0.2% viability) [8] | Moderate (Detected 9% viability under same conditions) [8] |
| Key Advantage | Superior precision, statistical power, and detailed death mechanism analysis [1] | Direct visualization of cell-particle interactions and spatial relationships |
| Key Limitation | Requires single-cell suspension; cannot visualize cell attachment [1] | Susceptible to sampling bias and biomaterial autofluorescence [1] |
| Sample Preparation | Cells must be detached from substrate/particles for analysis [1] | Cells can be analyzed adherent and in situ with particles [1] |
Correlation and Divergence in Experimental Data
The strong correlation between FCM and FM viability data (r = 0.94) confirms that both are valid for assessing cytocompatibility in particulate systems [1] [8]. However, the absolute viability percentages can diverge significantly under high cytotoxic stress. For example, with <38 µm Bioglass 45S5 particles at 100 mg/mL, FM reported viabilities of 9% (3h) and 10% (72h), whereas FCM reported 0.2% and 0.7%, respectively [8]. This demonstrates FCM's enhanced sensitivity in detecting rare viable cells within a largely non-viable population. Furthermore, FCM's multiparametric staining provides a deeper understanding of the mechanism of cell death, differentiating early apoptosis from late apoptosis and necrosis, which FM cannot reliably achieve [1] [8].
Experimental Protocols for Particulate Systems
Core Workflow for Viability Assessment
The following diagram illustrates the general experimental workflow for preparing and analyzing particulate-treated cells, highlighting paths for both FCM and FM.
Detailed Staining and Preparation Protocols
The protocols below are adapted from the comparative study to ensure correlated and reliable data [1] [8].
Table 2: Key Research Reagent Solutions
| Reagent | Function | Application |
|---|---|---|
| Propidium Iodide (PI) | Membrane-impermeant dye staining DNA in dead/necrotic cells [1] [8] | FM & FCM |
| Fluorescein Diacetate (FDA) | Cell-permeant esterase substrate producing green fluorescence in live cells [8] | FM |
| Annexin V-FITC | Binds phosphatidylserine exposed on the outer leaflet of early apoptotic cells [1] [8] | FCM |
| Hoechst 33342 | Cell-permeant nuclear counterstain [1] [8] | FCM |
| DiIC1(5) | Mitochondrial dye indicating metabolic activity in live cells [1] | FCM |
| Phosphate Buffered Saline (PBS) | Washing and dilution buffer [31] | FM & FCM |
| Poly-L-lysine | Coating agent to promote cell adhesion to slides [31] | FM Sample Prep |
| Fish Skin Gelatin | Blocking agent to reduce non-specific antibody binding [31] | Immunofluorescence |
Protocol for Flow Cytometry with Multiparametric Staining
This protocol is designed for detailed viability and death mechanism analysis [1] [8].
- Cell Harvest: After exposure to particulates, detach cells from the substrate using a gentle method like trypsinization. Note: This is a critical step that may require optimization to efficiently separate cells from adherent particles without causing additional damage [1].
- Washing: Centrifuge the cell suspension (4000 × g for 4 minutes is a typical benchmark [31]), discard supernatant, and resuspend the pellet in PBS. Repeat this wash three times to remove residual particles and serum [31].
- Staining: Resuspend the final cell pellet in a staining solution containing:
- Hoechst 33342: For nuclear identification.
- DiIC1(5): To assess mitochondrial membrane potential.
- Annexin V-FITC: To detect phosphatidylserine exposure.
- Propidium Iodide (PI): To detect loss of membrane integrity.
- Incubate according to manufacturer's recommendations, protecting from light.
- Analysis: Acquire data on a flow cytometer capable of detecting all fluorophores. A minimum of 10,000 events per sample is recommended for robust statistics. Use single-stained controls for proper spectral compensation [1] [30].
Protocol for Fluorescence Microscopy with FDA/PI Staining
This protocol is optimized for in-situ visualization of cell-particle interactions [8] [31].
- Slide Preparation: Seed cells on glass slides, often pre-coated with Poly-L-lysine to enhance adhesion. For particulate studies, cells can be cultured directly on the material or co-cultured with particles [31].
- Fixation (Optional): For some experimental designs, cells may be fixed with 2–5% formaldehyde to preserve morphology. However, for live/dead assays, staining is typically performed on unfixed, live cells.
- Staining: Prepare a working solution containing Fluorescein Diacetate (FDA) and Propidium Iodide (PI) in PBS.
- Gently apply the staining solution to the cells and incubate for a short period (e.g., 10-20 minutes) at 37°C, protected from light [8].
- Mounting: After incubation, carefully apply a coverslip. Use an appropriate mounting medium (e.g., VectaShield or Fluoromount) to preserve fluorescence and prevent photobleaching. Seal the edges with clear nail varnish if necessary [31].
- Imaging: Visualize immediately using a fluorescence microscope with FITC and TRITC/Rhodamine filter sets. Capture multiple, random fields of view to mitigate sampling bias [1].
Best Practices and Critical Considerations
Addressing Particulate-Specific Challenges
- Mitigating Autofluorescence: Many biomaterials, especially polymers and glasses, exhibit intrinsic autofluorescence that can overlap with stain signals. This can "inhibit fluorescence imaging" and is a major limitation for FM [1]. To address this, conduct a control with unstained particulates to determine the autofluorescence profile and adjust laser powers/detection gates accordingly. FCM is generally more robust in resolving this issue through spectral unmixing [19].
- Ensuring Representative Sampling: FM's limitation to a few fields of view can introduce significant sampling bias [1]. To counter this, acquire a large number of images from different, randomly selected areas of the sample. FCM's strength is its analysis of tens of thousands of cells, providing a statistically representative profile of the entire population [1].
- Particle-Induced Interference: Small, internalized particles can affect light scatter properties in FCM, potentially complicating the distinction between single cells and cell-particle doublets. Using a nuclear dye like Hoechst helps to accurately identify and gate on single, intact cells [1].
Decision Framework for Researchers
The choice between FCM and FM is not mutually exclusive, and the optimal approach often depends on the research question.
Use Flow Cytometry (FCM) when:
- Your primary need is high-throughput, quantitative data with high statistical power.
- You need to distinguish between different modes of cell death (apoptosis vs. necrosis).
- The experimental conditions induce high cytotoxic stress, and you need maximum sensitivity to detect rare viable cells.
- Sample autofluorescence is a major concern that can be managed via spectral unmixing [1] [19] [8].
Use Fluorescence Microscopy (FM) when:
For the most comprehensive analysis, an integrated approach is highly recommended, using FM for qualitative spatial assessment and FCM for robust, quantitative viability statistics [1].
Data Acquisition Settings and Instrument Configuration for Optimal Viability Assessment
Accurate cell viability assessment is a critical component of biomedical research, preclinical evaluation of biomaterials, and drug development. Among the various techniques available, flow cytometry (FCM) and fluorescence microscopy (FM) have emerged as two prominent methods for quantifying live and dead cells. While both techniques utilize fluorescent dyes to differentiate between viable and non-viable cell populations based on membrane integrity and other markers, their data acquisition settings, instrument configurations, and analytical capabilities differ significantly. Understanding these differences is essential for researchers to select the appropriate method for their specific applications and to correctly interpret the resulting data. This guide provides a detailed comparative analysis of flow cytometry and fluorescence microscopy for viability assessment, focusing specifically on the correlation between data generated by these methods and the technical configurations required for optimal performance.
Comparative Performance Analysis: Flow Cytometry vs. Fluorescence Microscopy
A comprehensive 2025 comparative study published in BioMedical Engineering OnLine directly evaluated the performance of flow cytometry and fluorescence microscopy for assessing viability of SAOS-2 osteoblast-like cells exposed to particulate bioactive glass (Bioglass 45S5). The findings provide critical insights into the relative strengths and limitations of each technique under controlled, identical experimental conditions [1] [8].
Table 1: Comparative Viability Assessment of SAOS-2 Cells Exposed to Bioglass 45S5 Particles
| Particle Size | Concentration (mg/mL) | Exposure Time (h) | Viability by FM (FDA/PI) (%) | Viability by FCM (Multiparametric) (%) |
|---|---|---|---|---|
| < 38 µm | 100 | 3 | 9.0 | 0.2 |
| < 38 µm | 100 | 72 | 10.0 | 0.7 |
| Controls | 0 | 3 & 72 | >97.0 | >97.0 |
Table 2: Technical Comparison of Flow Cytometry and Fluorescence Microscopy
| Parameter | Flow Cytometry | Fluorescence Microscopy |
|---|---|---|
| Throughput | High (10,000+ cells/second) [14] | Low (limited fields of view) [1] |
| Spatial Information | Limited | Comprehensive cellular visualization [1] |
| Sensitivity | Superior detection of rare populations [1] | Moderate [1] |
| Multiparametric Analysis | Excellent (up to 20+ parameters simultaneously) [1] | Limited by channels and fluorophores [1] |
| Sample Requirements | Single-cell suspension required [1] | Adherent or suspension cells possible [32] |
| Apoptosis Detection | Can distinguish early/late apoptosis and necrosis [1] | Limited to basic live/dead distinction [1] |
| Statistical Power | High (analyzes thousands of cells) [1] | Moderate (limited cell count per field) [1] |
| Quantitative Capability | Highly quantitative with minimal operator bias [1] | Semi-quantitative, potential for observer bias [1] |
Despite the apparent discrepancy in absolute viability percentages shown in Table 1, statistical analysis revealed a strong correlation between FM and FCM data (r = 0.94, R² = 0.8879, p < 0.0001) [1] [8]. This correlation validates both techniques for viability screening while highlighting flow cytometry's enhanced sensitivity, particularly under high cytotoxic stress conditions where it detected significantly lower viability percentages than fluorescence microscopy.
Experimental Protocols for Viability Assessment
Flow Cytometry Viability Staining Protocol
The following protocol outlines the standard procedure for viability assessment using flow cytometry, adapted from established methodologies [33] [34] [35]:
Sample Preparation: Harvest cells and prepare a single-cell suspension in ice-cold suspension buffer (PBS with 5-10% FCS) at a concentration of 0.5–1 × 10⁶ cells/mL. Centrifuge at 200–300 × g for 5 minutes at 4°C [35].
Viability Staining: Resuspend cell pellet in an appropriate volume of staining buffer. Choose one of the following staining approaches based on experimental needs:
- Membrane-Impermeant Dyes (PI/7-AAD): Add 5 μL of propidium iodide (PI) or 7-AAD staining solution per 100 μL of cells. Incubate for 5–15 minutes on ice or at room temperature. Do not wash cells after staining [33].
- Fixable Viability Dyes: For experiments requiring fixation, use amine-reactive fixable viability dyes. Add 1 μL of dye per 1 mL of cells in azide-free and protein-free PBS. Incubate for 30 minutes at 2–8°C, protected from light. Wash cells 1–2 times with staining buffer before analysis [33].
- SYTO 9/PI Dual Staining: For enhanced resolution of viability states, use dual staining with SYTO 9 (33.4 μM) and PI (0.2 mM) in 0.85% saline buffer. Incubate for 15–30 minutes at room temperature, protected from light [34].
Data Acquisition: Analyze samples by flow cytometry within 4 hours of staining. Use appropriate laser excitation and filter sets matched to the fluorescence spectra of the viability dyes selected [33] [35].
Fluorescence Microscopy Viability Staining Protocol
For viability assessment using fluorescence microscopy, the following protocol is recommended [1] [8]:
Cell Preparation: Seed cells in coverglass-bottom plates or chamber slides and apply experimental treatments. For adherent cells, a brief trypsin treatment can improve cell segmentation and counting accuracy by reducing cell overlap [32].
Staining Solution Preparation: Prepare fresh staining solution containing fluorescein diacetate (FDA) for live cells (typically 0.5–1 μg/mL) and propidium iodide (PI) for dead cells (typically 5–10 μg/mL) in culture medium or buffer.
Staining Procedure: Remove culture medium from cells and replace with the staining solution. Incubate for 10–20 minutes at 37°C protected from light.
Image Acquisition: Acquire images using a fluorescence microscope with appropriate filter sets:
- FDA (Live cells): Excitation 490 nm, Emission 525 nm (Green)
- PI (Dead cells): Excitation 535 nm, Emission 617 nm (Red) Acquire multiple random fields (minimum 5–10) per sample to ensure statistical significance.
Image Analysis: Use automated image analysis software with cell segmentation algorithms (e.g., Cellpose) to identify and count live (FDA-positive) and dead (PI-positive) cells [32]. Manual counting may be performed but introduces potential observer bias.
Figure 1: Fluorescence Microscopy Viability Workflow
Technical Configuration for Optimal Data Acquisition
Flow Cytometry Instrument Settings
Proper instrument configuration is essential for accurate viability assessment by flow cytometry. The following settings should be optimized:
- Laser Power and Detector Voltage: Adjust photomultiplier tube (PMT) voltages to maximize signal-to-noise ratio and minimize coefficient of variation. For mApple fluorescence, a PMT voltage of 450 mV has been shown to provide optimal performance [32].
- Threshold Setting: Set appropriate threshold on forward scatter (FSC) or fluorescence channel to exclude debris and noise while retaining cell populations of interest.
- Compensation Controls: Use single-stained controls for each fluorophore to compensate for spectral overlap between channels, particularly when using multiple viability markers or combining with immunostaining.
- Flow Rate: Use lower flow rates for improved resolution when analyzing delicate cells or rare populations. Higher flow rates (up to 3 m/s) can be used for high-throughput applications [14].
- Gating Strategy: Implement sequential gating to exclude doublets, debris, and non-viable cells:
- FSC-A vs SSC-A to identify cell population
- FSC-H vs FSC-A to exclude doublets
- Viability dye vs target fluorescence to select live cells
Figure 2: Flow Cytometry Gating Strategy
Fluorescence Microscopy Imaging Parameters
For consistent viability assessment using fluorescence microscopy, the following imaging parameters should be standardized:
- Microscope Type: Both widefield (e.g., Nikon Ti-E) and simpler systems (e.g., EVOS) can be used, with higher magnification objectives (60X) providing reduced variation in fluorescence intensities compared to lower magnifications (10X-20X) [32].
- Exposure Time: Optimize exposure time for each channel to avoid saturation while ensuring sufficient signal. Keep consistent across samples within an experiment.
- Image Resolution: Higher resolution improves segmentation accuracy but increases acquisition time and data storage requirements. Balance based on cell size and density.
- Cell Segmentation Parameters: When using automated analysis tools like Cellpose, optimize parameters such as estimated cell diameter (typically 145 pixels) and flow threshold (0.95–2.05) for accurate cell detection [32].
- Cell Density: Maintain cell densities between 15,600–62,500 cells/well in a 96-well plate to ensure reliable segmentation and avoid cell overlapping that compromises accuracy [32].
Advanced Technical Considerations
Emerging Technologies in Viability Assessment
Recent technological advances are bridging the gap between flow cytometry and fluorescence microscopy:
- Microscopy-Based Cytometry: New approaches combine the spatial information of microscopy with the quantitative analysis of flow cytometry. Using advanced segmentation algorithms (e.g., Cellpose) on brightfield images of partially detached cells, these methods can produce flow cytometry-like data from microscope images with comparable speed and enhanced sensitivity [32].
- High-Throughput FLIM Flow Cytometry: Fluorescence lifetime imaging microscopy (FLIM) integrated with flow cytometry enables high-throughput analysis at rates exceeding 10,000 cells per second. This technology provides spatial information and is robust against fluorescence intensity variations, overcoming a key limitation of conventional flow cytometry [14].
- Automated Fluorescence Cell Counters: Dedicated automated cell counters (e.g., LUNA-FL) provide a middle ground between traditional microscopy and flow cytometry, offering automated viability analysis with visual validation capabilities at a lower cost and complexity than flow cytometers [36].
Method Selection Guide
The choice between flow cytometry and fluorescence microscopy should be guided by specific experimental requirements:
Select Flow Cytometry When:
- High-throughput analysis of large sample numbers is required
- Multiparametric analysis beyond simple viability is needed
- Distinguishing apoptosis stages (early/late) is important
- Maximum sensitivity and statistical power are prioritized
- Sample can be prepared as a single-cell suspension
Select Fluorescence Microscopy When:
- Spatial context and cellular morphology are important
- Working with adherent cells that cannot be easily detached
- Instrumentation budget is limited
- Visual validation of staining quality is desired
- Sample numbers are limited
Essential Research Reagent Solutions
Table 3: Key Reagents for Viability Assessment
| Reagent Category | Specific Examples | Function | Compatibility Considerations |
|---|---|---|---|
| Membrane-Impermeant DNA Dyes | Propidium Iodide (PI), 7-AAD, TO-PRO family | Stain dead cells with compromised membranes | Incompatible with intracellular staining; must remain in buffer during acquisition [33] |
| Cell-Permeant Viability Dyes | Calcein AM, Calcein Violet AM, SYTO 9 | Stain live cells through intact membranes | Not retained in fixed cells; may require optimization of concentration [33] [34] |
| Fixable Viability Dyes | eFluor 506, eFluor 660, eFluor 780 | Covalently label dead cells; compatible with fixation | Allow staining before fixation; require azide/protein-free conditions for optimal staining [33] |
| Apoptosis Detection Reagents | Annexin V-FITC, Hoechst dyes, DiIC1 | Distinguish early/late apoptosis and necrosis | Require specific binding buffers (Annexin V); need viable cells for accurate assessment [1] |
| Dual Staining Kits | SYTO 9/PI combination, FDA/PI, AO/PI | Simultaneously label live and dead populations | Provide competitive binding and FRET effects for enhanced resolution [34] [36] |
| Segmentation Tools | Cellpose algorithm, Acridine Orange | Enable automated cell identification and counting | Require parameter optimization (diameter, flow threshold) for different cell types [32] |
Flow cytometry and fluorescence microscopy provide complementary approaches to cell viability assessment, each with distinct advantages and limitations. While both methods show strong correlation in viability measurements, flow cytometry offers superior sensitivity, statistical power, and ability to distinguish apoptosis stages, particularly under high cytotoxic stress conditions. Fluorescence microscopy provides valuable spatial context and is more accessible for researchers with budget constraints or those working with adherent cell systems. The optimal choice depends on specific experimental requirements, sample characteristics, and available resources. Proper implementation of the data acquisition settings and staining protocols outlined in this guide will ensure reliable, reproducible viability assessment regardless of the selected methodology. As technological advances continue to emerge, particularly in the integration of fluorescence lifetime imaging and artificial intelligence-based image analysis, the boundaries between these techniques are likely to further blur, offering researchers increasingly powerful tools for accurate viability assessment.
Solving Common Challenges: Optimization Strategies for Accurate Viability Data
Addressing High Background and Autofluorescence in Particulate Biomaterials
The accurate assessment of cell viability is a foundational requirement in biomaterial science, pre-clinical evaluation, and drug development. The inherent properties of particulate biomaterials—such as their light-scattering characteristics and strong autofluorescence (AF)—introduce significant technical challenges that can compromise data accuracy. Autofluorescence, the background emission of light from endogenous biomolecules or the material itself, creates a confounding signal that obscures specific fluorescence from viability dyes [37] [20]. This interference is a critical methodological concern, as it can lead to the misinterpretation of cytocompatibility results. Within a broader research thesis investigating the correlation between flow cytometry (FCM) and fluorescence microscopy (FM) viability data, understanding and mitigating this background noise is paramount. This guide objectively compares the performance of FCM and FM in the context of particulate biomaterials, supported by recent experimental data, to provide scientists with a clear framework for selecting and optimizing viability assays.
The Autofluorescence Challenge in Particulate Systems
Autofluorescence arises from intracellular biomolecules and, critically, from the biomaterials under investigation. Common endogenous fluorophores include NAD(P)H, flavins, lipofuscin, and structural proteins like collagen and elastin [37] [20]. These molecules exhibit broad excitation and emission spectra, which often overlap with the spectra of commonly used fluorescent probes, creating a high background that reduces the signal-to-noise ratio [38] [20].
This problem is acutely exacerbated in the presence of particulate biomaterials. As noted in a 2025 study, "Biomaterials (especially polymers and glasses) can exhibit strong autofluorescence and light scattering that 'inhibit fluorescence imaging'" [10]. This intrinsic fluorescence, combined with light refraction and reflection from irregular particle surfaces, can swamp the specific signal from viability stains, leading to both false positives and false negatives. The core challenge, therefore, is to select a viability method that can effectively discriminate true biological signals from this material-induced background.
Comparative Analysis: Flow Cytometry vs. Fluorescence Microscopy
A direct comparative study published in 2025 evaluated FM and FCM for assessing the cytotoxicity of Bioglass 45S5 (BG) on SAOS-2 osteoblast-like cells. The study employed different BG particle sizes and concentrations to create a gradient of cytotoxic stress, providing a robust test for the two methodologies [10].
Key Experimental Parameters and Quantitative Results
The following table summarizes the core findings from this comparative study, highlighting the performance of each technique under identical experimental conditions.
Table 1: Comparative performance of Flow Cytometry and Fluorescence Microscopy in assessing viability of cells exposed to particulate Bioglass 45S5 [10].
| Parameter | Fluorescence Microscopy (FM) | Flow Cytometry (FCM) |
|---|---|---|
| Viability Staining | FDA (live) and PI (dead) | Multiparametric: Hoechst, DiIC1, Annexin V-FITC, PI |
| Reported Viability (Most cytotoxic condition: <38 µm, 100 mg/mL, 3h) | 9% | 0.2% |
| Control Viability | >97% | >97% |
| Key Advantage | Direct visualization of cell-particle interaction | High-throughput, multi-parameter single-cell analysis |
| Key Disadvantage | Susceptible to interference from particle autofluorescence; low throughput; sampling bias. | Requires single-cell suspension; cannot visualize spatial context. |
| Sensitivity & Resolution | Lower sensitivity under high cytotoxic stress; overestimation of viability possible due to background. | Superior precision and sensitivity, especially under high cytotoxic stress. |
| Subpopulation Distinction | Limited to live/dead based on dye exclusion. | Capable of distinguishing viable, early apoptotic, late apoptotic, and necrotic populations. |
The data revealed a strong overall correlation between FM and FCM results (r = 0.94), confirming that both techniques capture the same general trends of size- and dose-dependent cytotoxicity [10]. However, FCM demonstrated superior sensitivity in extreme conditions, registering near-total cytotoxicity where FM still indicated a small viable population. This discrepancy is attributed to FCM's ability to gate out debris and dead cells electronically and its multi-parametric nature, which provides a more nuanced and quantitative assessment of cell death pathways.
Experimental Protocols for Viability Assessment
The reliability of data depends on rigorously optimized protocols. Below are detailed methodologies for both techniques as applied in particulate biomaterial research.
Protocol 1: Fluorescence Microscopy with FDA/PI Staining This protocol is adapted from the 2025 comparative study [10].
- Sample Preparation: Seed cells on biomaterial-containing wells. After exposure, carefully aspirate the culture medium to avoid dislodging particles.
- Staining: Prepare a working solution of Fluorescein Diacetate (FDA, 5 µg/mL) and Propidium Iodide (PI, 20 µg/mL) in a buffered saline like PBS. Add the staining solution to the wells and incubate for 5-15 minutes at 37°C, protected from light.
- Imaging: Gently rinse with PBS to remove excess, unbound dye. Image immediately using a standard fluorescence microscope with appropriate filter sets (e.g., FITC for FDA, TRITC for PI).
- Analysis: Capture multiple random fields. Viable cells (FDA-positive) fluoresce green, while dead cells (PI-positive) fluoresce red. Manually or automatically count cells, being cautious to distinguish true cells from fluorescent particles.
Protocol 2: Flow Cytometry with Multiparametric Staining This protocol synthesizes methods from the comparative study [10] and a dedicated viability assay review [9].
- Cell Harvesting: Gently trypsinize cells and neutralize the enzyme. The suspension will contain cells, particles, and debris. Pass the suspension through a cell strainer (e.g., 40-70 µm) to remove large aggregates that could clog the instrument.
- Staining: Divide the cell suspension into aliquots for staining.
- Direct Viability Staining: Incubate cells with 7-AAD or PI for 5-10 minutes at room temperature in the dark. Acquire immediately without washing [9].
- Multiparametric Phenotyping: For a more detailed analysis, first stain with fluorochrome-conjugated antibodies against cell surface markers (e.g., CD45 for leukocytes) for 20 minutes at 4°C. Wash the cells, then resuspend in a buffer containing a viability dye like 7-AAD. If needed, perform a red blood cell lysis step using an ammonium-chloride-potassium (ACK) buffer [9].
- Data Acquisition & Analysis: Acquire data on a flow cytometer. Use forward scatter (FSC, indicator of cell size) and side scatter (SSC, indicator of granularity/complexity) to create a primary gate around the population of interest, excluding most debris and particles. From the CD45+ gate (if used), viable cells are identified as 7-AAD negative [9]. Further subpopulations (e.g., apoptotic) can be identified using Annexin V and other markers.
The Scientist's Toolkit: Essential Reagents and Materials
Table 2: Key research reagents and materials for viability assessment in particulate biomaterial studies.
| Item | Function/Benefit | Example Application |
|---|---|---|
| Propidium Iodide (PI) | Nucleic acid stain that is excluded by live cells; labels dead cells. | A standard, cost-effective dead cell stain for both FM and FCM [9] [10]. |
| 7-Aminoactinomycin D (7-AAD) | DNA binding dye that is excluded by viable cells; used as a viability marker in FCM. | Preferred for multiparametric FCM as it fits well into panel design due to its far-red emission [9]. |
| Acridine Orange (AO) | Cell-permeable nucleic acid stain that labels all nucleated cells. | Used in automated cell counters (e.g., Cellometer) in combination with PI to count total and dead cells [9]. |
| Annexin V-FITC | Binds to phosphatidylserine exposed on the outer leaflet of the cell membrane during apoptosis. | Used in FCM panels with PI to distinguish viable (Annexin-/PI-), early apoptotic (Annexin+/PI-), and late apoptotic/necrotic (Annexin+/PI+) cells [10]. |
| Ethyl Cinnamate (ECi) | A non-hazardous optical clearing agent. | Used to render tissues transparent for advanced microscopy like LSFM, allowing 3D characterization based on autofluorescence patterns [39]. |
| FluoroBrite DMEM | A specially formulated, low-autofluorescence culture medium. | Reduces background fluorescence during live-cell imaging, improving the signal-to-noise ratio [38]. |
| Glass-bottom Dishes | Imaging vessels with a glass coverslip base. | Glass exhibits much lower autofluorescence compared to standard plastic cultureware, significantly reducing background [38]. |
Strategic Workflow for Method Selection
The following diagram outlines a logical decision-making workflow to guide researchers in selecting and applying the most appropriate technique based on their experimental goals and the challenges posed by their specific biomaterial.
The presence of high background and autofluorescence in particulate biomaterial systems presents a significant analytical hurdle. The comparative data clearly demonstrates that while fluorescence microscopy offers valuable spatial context, flow cytometry provides superior quantitative accuracy, sensitivity, and the ability to resolve complex cell populations under the challenging conditions imposed by particulate biomaterials [10]. For research aiming to establish a robust correlation between viability data sets, FCM emerges as the more reliable and precise tool. An integrated approach, leveraging the strengths of both techniques while employing the optimization strategies and reagents outlined in this guide, will empower researchers to generate the most accurate and comprehensive viability data, thereby de-risking the development of new biomaterials and therapeutic agents.
Optimizing Antibody Titration and Fluorophore Selection for Target Antigen Expression
Accurate measurement of target antigen expression is a cornerstone of modern biological research, particularly in studies correlating flow cytometry with fluorescence microscopy data. The reliability of this data hinges on two critical, interconnected optimization processes: antibody titration and informed fluorophore selection. Antibody titration ensures that the concentration of a fluorescently-labeled antibody used in an assay is sufficient to saturate all target antigens without causing non-specific background staining, thereby providing a robust, quantitative signal proportional to the true antigen density [40]. Concurrently, the choice of fluorophore—weighing factors such as brightness, photostability, and instrument compatibility—directly impacts the sensitivity and specificity of detection across different imaging and cytometry platforms [41].
Failure to optimize these parameters can introduce significant artifacts, undermining the validity of correlations between flow cytometric quantification and microscopic spatial localization. This guide provides a structured comparison of methodologies and reagents, offering experimental data and protocols to empower researchers to generate highly reproducible and quantitatively accurate data on antigen expression.
Comparative Analysis of Direct vs. Indirect Fluorescent Labeling
The foundational choice in any fluorescence-based experiment is between direct and indirect labeling methods. Each approach offers a distinct set of advantages and trade-offs concerning simplicity, signal strength, and flexibility [41].
Table 1: Comparison of Direct and Indirect Fluorescent Antibody Labeling
| Feature | Direct Labeling | Indirect Labeling |
|---|---|---|
| Principle | Primary antibody is directly conjugated to a fluorophore [41]. | An unlabeled primary antibody is detected by a fluorophore-conjugated secondary antibody [41]. |
| Workflow Steps | 1. Incubate sample with labeled primary antibody.2. Wash and acquire/data. | 1. Incubate sample with unlabeled primary antibody.2. Wash.3. Incubate with labeled secondary antibody.4. Wash and acquire/data. |
| Time Required | Shorter (single staining step) [41]. | Longer (multiple staining and washing steps) [41]. |
| Signal Amplification | Limited; one fluorophore per antibody molecule. | High; multiple secondary antibodies, each with multiple fluorophores, bind to one primary [41]. |
| Sensitivity | Good for medium- to high-abundance antigens. | Superior for low-abundance antigens due to signal amplification [41]. |
| Flexibility | Low; requires a conjugated primary antibody for each target. | High; one secondary antibody can be used with many primaries from the same host species [41]. |
| Background / Specificity | Generally lower background; avoids potential cross-reactivity of secondary antibodies [41]. | Potentially higher background from non-specific secondary antibody binding [41]. |
| Multiplexing Capability | Easier for multicolor panels, as it avoids host species conflicts. | Can be challenging with multiple primaries from the same species. |
| Cost | Higher for conjugated primary antibodies. | Generally more cost-effective, especially for multiple targets [41]. |
Workflow Visualization
The following diagram illustrates the procedural and logical differences between the two labeling strategies.
Achieving Antibody Saturation: A Novel "Spike-In" Workflow
A paramount goal in quantitative flow cytometry is achieving antibody saturation, where all antigen-binding sites are occupied. This ensures that the measured Median Fluorescence Intensity (MFI) is robust and unaffected by minor, unavoidable variations in staining conditions, enabling a true comparison of biomarker expression across samples [40]. A recent innovative method addresses the common problem where commercially available fluorophore-labeled monoclonal antibodies (mAbs) do not reach a plateau staining concentration that is practically useful [40].
This workflow involves 'spiking-in' unlabeled antibody of the same clone to achieve saturation while maintaining an adequate fluorescence signal.
Table 2: Workflow to Achieve Antibody Saturation via "Spike-In" Method
| Step | Procedure | Purpose & Outcome |
|---|---|---|
| 1. Determine Saturating Concentration of Unlabeled Antibody | Titrate unlabeled (purified) antibody and detect binding with a fluorophore-labeled anti-species secondary antibody [40]. | Establishes the total antibody concentration required to saturate all antigenic sites on the target cells. |
| 2. Compare Labeled vs. Unlabeled Antibody Binding | Generate titration curves for both the unlabeled and the fluorophore-conjugated versions of the same antibody clone [40]. | Assesses whether the fluorophore conjugation process has impaired the antibody's binding affinity or avidity. |
| 3. "Spike-In" Titration | Mix the labeled antibody with unlabeled antibody at varying ratios (e.g., different percentage mixtures) [40]. | Identifies the optimal ratio that achieves full antigen saturation while preserving a clear, detectable fluorescence signal above background. |
| 4. Validation | Use the optimized "spike-in" mixture in the final staining protocol and compare the MFI stability across sample replicates or different cell types expressing varying antigen levels [40]. | Confirms that the staining is now performed at a saturating concentration, leading to highly reproducible and robust MFI measurements for comparison. |
Logical Workflow of the "Spike-In" Method
The following chart outlines the key decision points in the "spike-in" saturation workflow.
Experimental Protocols for Optimized Staining
Basic Protocol: Surface Staining for Flow Cytometry
This protocol is optimized for high-parameter flow cytometry, incorporating blocking steps to minimize non-specific binding and improve the signal-to-noise ratio [42].
Materials:
- Cells: Mammalian immune cells (e.g., PBMCs) in a single-cell suspension.
- Antibodies: Directly conjugated primary antibodies, titrated and diluted in FACS buffer.
- Blocking Reagents: Normal serum from the host species of the antibodies (e.g., mouse serum, rat serum).
- Staining Buffer: FACS buffer (e.g., PBS with 1-2% FBS and possibly 0.1% sodium azide).
- Specialized Reagents: Brilliant Stain Buffer (or similar) to prevent polymer dye interactions [42].
- Labware: 96-well V-bottom plates, centrifuge, multichannel pipettes.
Procedure:
- Prepare Blocking Solution: Create a mixture containing mouse serum, rat serum, and tandem stabilizer diluted in FACS buffer [42].
- Dispense and Wash Cells: Aliquot cells into a V-bottom 96-well plate. Centrifuge at 300 × g for 5 minutes and decant the supernatant.
- Block: Resuspend the cell pellet in 20 µl of the prepared blocking solution. Incubate for 15 minutes at room temperature in the dark [42].
- Prepare Surface Stain Master Mix: Combine titrated antibodies, Brilliant Stain Buffer, and tandem stabilizer in FACS buffer.
- Stain: Add 100 µl of the surface staining mix directly to the blocked cells (without washing). Mix gently by pipetting.
- Incubate: Protect from light and incubate for 1 hour at room temperature.
- Wash: Add 120 µl of FACS buffer to each well, centrifuge, and discard the supernatant. Repeat this wash step with a larger volume (200 µl) [42].
- Resuspend and Acquire: Resuspend the final cell pellet in FACS buffer containing tandem stabilizer. Acquire data on a flow cytometer [42].
Protocol for Antibody Titration
Titration is essential for determining the optimal concentration of an antibody that provides the best signal-to-noise ratio (the highest specific signal with the lowest non-specific background).
Procedure:
- Prepare Dilutions: Perform a series of 2-fold or 1.5-fold serial dilutions of the antibody in FACS buffer. A typical range might span from 4x to 0.125x of the manufacturer's recommended concentration.
- Stain Cells: Aliquot a constant number of cells (e.g., 0.5-1 million) into a series of tubes or wells. Add the different antibody dilutions to the respective cell pellets. Include a negative control (unstained or isotype control).
- Incubate and Wash: Follow the basic surface staining protocol (steps 5-7 above).
- Analyze: Acquire data and plot the Median Fluorescence Intensity (MFI) for each antibody dilution. The optimal concentration is typically the one just below the point where the MFI plateaus (saturation), as this concentration maximizes specific binding while minimizing non-specific background.
The Scientist's Toolkit: Key Reagent Solutions
Successful experimental outcomes depend on the appropriate selection and use of key reagents.
Table 3: Essential Research Reagents for Fluorescence-Based Assays
| Reagent Category | Specific Examples | Function & Rationale |
|---|---|---|
| Fluorophores | FITC, Alexa Fluor series (e.g., 488, 647), Cy dyes (e.g., Cy3, Cy5, Cy7) [41]. | Generate detectable fluorescence signal. Choice depends on brightness, photostability, and instrument laser/filter configuration. |
| Blocking Reagents | Normal Serum (mouse, rat), Fc Receptor Block, BSA [42]. | Reduce non-specific antibody binding to Fc receptors and other cellular components, lowering background. |
| Staining Buffers | FACS Buffer (PBS + FBS/BSA), Brilliant Stain Buffer, CellBlox [42]. | Provide a physiological environment for staining. Specialized buffers prevent dye-dye interactions and tandem dye degradation. |
| "Spike-In" Reagents | Unlabeled Purified Antibody (same clone as labeled antibody) [40]. | Enables the achievement of true antibody saturation for robust quantitative comparisons without requiring excessive, costly labeled antibody. |
| Secondary Antibodies | Goat Anti-Mouse IgG (Alexa Fluor 488), Donkey Anti-Rabbit IgG (Cy3) [41]. | Used in indirect staining for signal amplification. Must be raised against the host species of the primary antibody. |
| Viability Dyes | Propidium Iodide, DAPI, Fixable Viability Stains | Distinguish live cells from dead cells, which often exhibit high non-specific antibody binding, improving data accuracy. |
Optimizing antibody titration and fluorophore selection is not a mere preliminary step but a fundamental requirement for generating reliable, quantitative data in fluorescence-based applications. The strategic choice between direct and indirect labeling, coupled with rigorous titration—potentially enhanced by the novel "spike-in" saturation method—ensures that measurements of antigen expression are accurate and reproducible. By adhering to the detailed protocols and reagent guidelines provided in this guide, researchers can significantly strengthen the correlation and validity of their data across flow cytometry and fluorescence microscopy platforms, thereby accelerating discovery and development in biomedical research.
Resolving Issues with Low Signal, Unusual Scatter, and Abnormal Event Rates
In the field of biomedical research and drug development, flow cytometry (FCM) and fluorescence microscopy (FM) are cornerstone techniques for cell viability and cytotoxicity assessment. However, researchers frequently encounter technical challenges including low signal-to-noise ratios, unusual light scatter patterns, and abnormal event rates, which can compromise data integrity and lead to erroneous conclusions. These issues are particularly pronounced in complex experimental setups involving particulate biomaterials, drug screening, and detailed cellular analysis. Recognizing and resolving these pitfalls is crucial for generating reliable, reproducible data. This guide provides a systematic comparison of flow cytometry and fluorescence microscopy, focusing on their performance in resolving these common issues, supported by recent experimental data and detailed methodologies. The content is framed within the broader research context establishing a strong correlation between FCM and FM viability data, empowering scientists to select the optimal technique for their specific applications.
Technical Comparison: Flow Cytometry vs. Fluorescence Microscopy
Flow cytometry and fluorescence microscopy offer distinct advantages and face unique challenges, particularly regarding signal intensity, scatter interpretation, and event analysis.
Flow Cytometry is a high-throughput technique that analyzes cells in suspension as they pass single-file through a laser beam. It provides quantitative, multi-parameter data on cell size, granularity (via light scatter), and biomarker expression (via fluorescence). However, its accuracy can be compromised by fluctuations in fluorescence intensity due to light scattering, absorption in complex cellular structures, concentration dependence of fluorophores, and overlapping emission spectra [14]. A key advantage is its robustness in event rate analysis, with modern systems achieving throughput exceeding 10,000 cells per second [14] and advanced optofluidic systems even reaching over 1,000,000 events per second [43].
Fluorescence Microscopy allows for direct visualization and spatial context of cells, making it invaluable for observing morphological details and subcellular localization. Nevertheless, it is prone to issues such as photobleaching, background autofluorescence, and a shallow depth of field, which can contribute to low signal problems [44] [1]. Furthermore, its throughput is inherently limited, as analysis is typically restricted to a few fields of view, which can lead to sampling bias and is unsuitable for analyzing large cell populations efficiently [1].
The table below summarizes the core characteristics of each technique in the context of common issues:
Table 1: Core Characteristics of Flow Cytometry and Fluorescence Microscopy
| Feature | Flow Cytometry | Fluorescence Microscopy |
|---|---|---|
| Throughput | Very high (1,000 - 1,000,000+ events/sec) [14] [43] | Low (limited fields of view) [1] |
| Signal Issues | Intensity fluctuations from scatter, absorption, concentration [14] | Photobleaching, autofluorescence, shallow depth of field [44] [1] |
| Scatter Information | Quantitative FSC (size) and SSC (granularity/complexity) | Qualitative morphological assessment |
| Data Output | Quantitative, statistical | Qualitative, spatial |
| Single-Cell Resolution | Yes, but lacks spatial context (unless imaging flow cytometry) | Yes, with subcellular spatial context |
| Best for | Large population statistics, rare cell detection, multi-parameter phenotyping | Morphological detail, spatial relationships, co-localization studies |
Resolving Common Issues: A Data-Driven Approach
Addressing Low Signal and Signal Variability
Low signal and high signal variability are critical challenges that can affect the precision of both techniques.
- In Flow Cytometry, fluorescence lifetime measurement is an advanced solution that bypasses intensity-based limitations. Fluorescence lifetime remains largely unaffected by fluorescence intensity fluctuations, excitation light variability, and fluorophore concentration, providing a more robust readout [14]. For instance, a study comparing the coefficient of variations (CVs) for fluorescence intensity and fluorescence lifetime found that fluorescence lifetime showed significantly smaller variation both between cells and within each cell, demonstrating superior robustness [14].
- In Fluorescence Microscopy, low signal is often tackled at the probe level. Developing novel fluorescent materials with higher quantum yields and greater photostability is a key research focus. For example, BODIPY (boron-dipyrromethene) dyes are noted for their remarkable fluorescence quantum yields (>0.8), strong extinction coefficients, and exceptional photostability, making them superior probes for overcoming issues like photobleaching [44].
Interpreting Unusual Scatter
Unusual light scatter patterns often indicate changes in cell morphology or health.
- Flow Cytometry quantitatively measures forward scatter (FSC) and side scatter (SSC), which are proportional to cell size and internal granularity/complexity, respectively [1]. Drastic changes in these parameters can signal underlying issues. For example, in cytotoxicity studies, the presence of particulate biomaterials or drug-induced changes can alter scatter profiles, potentially leading to abnormal event rates or gating difficulties. In such cases, imaging flow cytometry can be invaluable, as it combines the statistical power of flow cytometry with visual confirmation, allowing researchers to directly see the cells behind the unusual scatter plots [45].
- Fluorescence Microscopy provides direct visual insight into the causes of unusual scatter, such as cell shrinkage, membrane blebbing (in apoptosis), increased granularity, or the physical presence of particles adhering to cells [1] [8]. This qualitative assessment is crucial for validating observations made in flow cytometry.
Managing Abnormal Event Rates
Abnormal event rates in flow cytometry can stem from technical issues like cell clumping, improper sample concentration, or microfluidic blockages.
- High-Throughput Solutions: For applications requiring immense scale, such as rare cell detection, optofluidic time-stretch (OTS) imaging flow cytometry has set new benchmarks, enabling real-time throughput exceeding 1,000,000 events per second while maintaining sub-micron resolution [43].
- Standard Practice: For conventional flow cytometry, ensuring a single-cell suspension and optimizing sample concentration are critical. Modern acoustic-focused cytometers have also been developed to address instability in hydrodynamically focused samples, greatly increasing acquisition throughput and reliability [45].
Comparative Experimental Data: A Case Study in Viability Assessment
A seminal 2025 study directly compared FCM and FM for assessing the cytotoxicity of bioactive glass (Bioglass 45S5) on SAOS-2 osteoblast-like cells, providing a clear dataset on their relative performance under identical conditions [1] [8] [18].
Experimental Protocol:
- Cell Line & Treatment: Human osteosarcoma cell line (SAOS-2) was treated with BG particles of three size ranges (<38 µm, 63–125 µm, 315–500 µm) at concentrations of 25, 50, and 100 mg/mL for 3 and 72 hours [1] [8].
- Staining & Analysis (FM): Cells were stained with fluorescein diacetate (FDA) and propidium iodide (PI) to distinguish viable (FDA+) and non-viable (PI+) cells via visual assessment [8].
- Staining & Analysis (FCM): Cells underwent multiparametric staining using Hoechst (nuclei), DiIC1 (membrane potential), Annexin V-FITC (apoptosis), and PI (necrosis). This allowed FCM to classify cells into viable, early apoptotic, late apoptotic, and necrotic populations [1] [8].
Key Findings and Correlation: Both techniques confirmed a strong, statistically significant correlation (r = 0.94, R² = 0.8879, p < 0.0001) in identifying the trend of size- and dose-dependent cytotoxicity [1] [8]. However, FCM demonstrated superior sensitivity and precision, especially under high cytotoxic stress.
Table 2: Comparative Viability Data (% Viable Cells) from FM and FCM [18]
| Experimental Condition | Flow Cytometry (FCM) | Fluorescence Microscopy (FM) | ||
|---|---|---|---|---|
| 3 hours (Mean ± SD) | 72 hours (Mean ± SD) | 3 hours (Mean ± SD) | 72 hours (Mean ± SD) | |
| Control | 97.6 ± 0.11% | 97.4 ± 0.5% | 88.8 ± 2.1% | 91.1 ± 0.8% |
| <38 µm [100 mg/mL] | 0.2 ± 0% | 0.7 ± 0.6% | 9.0 ± 6.8% | 10.7 ± 0.9% |
| 63–125 µm [100 mg/mL] | 0.7 ± 0.6% | 0.4 ± 0.5% | 10.5 ± 4.5% | 19.7 ± 7.4% |
| 315–500 µm [100 mg/mL] | 6.2 ± 2.8% | 1.7 ± 1.3% | 18.7 ± 12.7% | 23.5 ± 9.8% |
The data shows that FCM reported consistently lower viability percentages under high-stress conditions compared to FM. For example, with the smallest particles (<38 µm) at the highest concentration (100 mg/mL), FCM measured viabilities of 0.2% and 0.7% at 3 and 72 hours, respectively, whereas FM reported 9% and 10.7% [18]. This stark difference underscores FCM's enhanced ability to detect subtle cellular changes and its higher sensitivity. Furthermore, FCM's lower coefficients of variation (CV) in control conditions highlight its superior precision and reduced variability compared to FM [1] [18].
Research Reagent Solutions
The choice of reagents is critical for optimizing signal, minimizing background, and ensuring specific detection.
Table 3: Key Research Reagents and Their Functions
| Reagent | Function/Application | Significance |
|---|---|---|
| BODIPY Dyes [44] | Versatile fluorescent probes for cellular imaging. | High quantum yield and photostability help combat photobleaching and low signal. |
| Annexin V-FITC [1] [8] | Binds to phosphatidylserine exposed on the outer leaflet of the cell membrane during early apoptosis. | Enables flow cytometry to distinguish apoptosis from necrosis, providing mechanistic insight beyond simple live/dead status. |
| Propidium Iodide (PI) [1] [8] | A DNA intercalating dye that is excluded by viable cells with intact membranes. | A standard dye for identifying dead/necrotic cells in both FCM and FM. |
| Hoechst Stains [1] [8] | Cell-permeant blue fluorescent dyes that bind to DNA in the nucleus. | Used in FCM for identifying nucleated cells and excluding debris, improving event rate accuracy. |
| Calcein-AM [14] | A cell-permeant esterase substrate that produces green fluorescence in viable cells. | A common viability probe; its fluorescence lifetime can be measured for more robust quantification in FCM. |
| Antibodies (e.g., Trastuzumab) [44] | Conjugated to fluorescent dyes to visualize specific proteins or antigens (e.g., HER2). | Provides high specificity for phenotyping and identifying cell populations, crucial for complex samples. |
Experimental Workflow and Signaling Pathways
The following diagram illustrates a generalized integrated workflow for resolving analysis issues using complementary techniques, leading to a more comprehensive biological interpretation.
Diagram 1: Integrated Workflow for Issue Resolution
The comparative analysis of flow cytometry and fluorescence microscopy reveals that the "best" technique is highly dependent on the specific research question. Flow cytometry, especially when enhanced with fluorescence lifetime measurements (FLIM) and imaging capabilities, offers unparalleled quantitative power, high-throughput, and robustness against signal fluctuations for large-scale population analysis. Fluorescence microscopy provides indispensable spatial and morphological context. The strong correlation between their viability data confirms that they are complementary, not contradictory, techniques. For resolving persistent issues with low signal, unusual scatter, and event rates, an integrated approach—leveraging the strengths of each method and modern technical advancements—is the most effective strategy for researchers and drug developers aiming to generate deep, reliable, and translatable biological insights.
In the quantitative analysis of cellular health, flow cytometry (FCM) and fluorescence microscopy (FM) are cornerstone techniques. A direct comparison of their performance, using identical experimental conditions, reveals a strong correlation in viability data but also highlights critical differences in sensitivity and informational depth, underscoring the indispensable role of proper experimental controls.
Fluorescence Microscopy (FM) allows for the direct visualization of cells. In viability assessments, cells are typically stained with fluorescent dyes, such as Fluorescein Diacetate (FDA) for live cells and Propidium Iodide (PI) for dead cells, and examined under a microscope. This provides a qualitative to semi-quantitative view of cell status and spatial context. However, its limitations include a shallow depth of field, potential for photobleaching, and lower throughput due to the analysis of only a few fields of view, which can introduce sampling bias [1].
Flow Cytometry (FCM), in contrast, is a high-throughput technique that analyzes cells in suspension as they pass single-file through a laser beam. It can simultaneously measure multiple parameters per cell, including light scattering (indicating size and granularity) and fluorescence from multiple probes. For advanced viability and apoptosis analysis, it employs multiparametric staining panels (e.g., Hoechst, DiIC1, Annexin V-FITC, and PI) to distinguish viable, early apoptotic, late apoptotic, and necrotic cell populations. Its strength lies in its ability to rapidly provide quantitative, statistical data from thousands of cells [1] [46].
The following diagram illustrates the core workflow and critical control points in a flow cytometry experiment.
Direct Comparative Analysis: FCM vs. FM Viability Assessment
A definitive 2025 study directly compared FCM and FM for assessing the cytotoxicity of bioactive glass (Bioglass 45S5) on SAOS-2 osteoblast-like cells. The experimental design created a gradient of cytotoxic stress by using different particle sizes (< 38 µm, 63–125 µm, and 315–500 µm) and concentrations (25, 50, and 100 mg/mL) over 3 and 72 hours [1].
Experimental Protocols:
- FM Protocol: Cells were stained with FDA and PI. Viable cells (green fluorescence from FDA) and non-viable cells (red fluorescence from PI) were counted manually or via image analysis from multiple microscope fields [1] [8].
- FCM Protocol: Cells were stained with a multiparametric panel including Hoechst, DiIC1, Annexin V-FITC, and PI. This allowed for quantitative classification into viable, apoptotic, and necrotic populations based on membrane integrity and phospholipid exposure [1] [8].
The quantitative results from this comparative study are summarized in the table below.
Table 1: Comparison of SAOS-2 cell viability (%) assessed by Flow Cytometry (FCM) and Fluorescence Microscopy (FM) [18]
| Conditions | FCM 3h (Mean ± SD) | FM 3h (Mean ± SD) | FCM 72h (Mean ± SD) | FM 72h (Mean ± SD) |
|---|---|---|---|---|
| Control | 97.6 ± 0.11 | 88.8 ± 2.1 | 97.4 ± 0.5 | 91.1 ± 0.8 |
| <38 µm [25 mg/ml] | 2.3 ± 0.9 | 23.7 ± 11.9 | 0.5 ± 0.4 | 31.7 ± 16.4 |
| <38 µm [50 mg/ml] | 0.2 ± 0.7 | 22.1 ± 10.6 | 0.5 ± 0.5 | 30.2 ± 14.7 |
| <38 µm [100 mg/ml] | 0.2 ± 0.0 | 9.0 ± 6.8 | 0.7 ± 0.6 | 10.7 ± 0.9 |
| 63–125 µm [25 mg/ml] | 4.8 ± 4.2 | 37.0 ± 11.4 | 0.6 ± 0.5 | 38.4 ± 24.7 |
| 315–500 µm [25 mg/ml] | 22.6 ± 10.3 | 47.9 ± 23.0 | 73.1 ± 1.1 | 74.9 ± 10.3 |
Key Findings from the Data:
- Strong Correlation: A strong overall statistical correlation was observed between the two techniques (r = 0.94, R² = 0.8879, p < 0.0001), validating FM as a useful screening tool [1] [8].
- Dramatic Difference in Sensitivity: Under high cytotoxic stress (smaller particles, higher concentration), FCM reported drastically lower viability percentages. For example, with <38 µm particles at 100 mg/mL for 3 hours, FCM measured 0.2% viability, while FM measured 9.0% [18]. This suggests FCM is more effective at excluding dead cells and debris from analysis.
- Superior Precision of FCM: The lower standard deviations and coefficients of variation (CV) in FCM data, especially in control conditions, indicate it provides more precise and reproducible quantitative data [1] [18].
- Beyond Viability: Apoptosis Detection: A key advantage of FCM was its ability to use multiparametric staining to differentiate early apoptotic from late apoptotic and necrotic cells, providing a deeper understanding of the cell death mechanism triggered by the biomaterial [1] [8].
The Scientist's Toolkit: Essential Controls and Reagents
Robust experimental data, especially in flow cytometry, hinges on the use of appropriate controls and reagents. The following table details critical components for reliable viability assessment.
Table 2: Research Reagent Solutions for Cell Viability and Flow Cytometry
| Reagent / Control | Function & Purpose | Key Examples |
|---|---|---|
| Viability Dyes | Distinguish live/dead cells; critical as dead cells show non-specific binding and autofluorescence [47]. | Propidium Iodide (PI), 7-AAD (DNA binding, membrane impermeant); Calcein-AM (metabolized to green fluorophore by live cells) [47]. |
| Isotype Controls | Assess background from non-specific antibody binding. Must match the primary antibody's species, isotype, and conjugation [47] [48]. | Mouse IgG2a, IgG1 (matched to the experimental antibody). |
| Compensation Controls | Correct for fluorescence spillover (spectral overlap) between channels in multicolor experiments [47] [49]. | Single-stained cells or compensation beads for each fluorophore in the panel [47] [48]. |
| FMO Controls | Define positive/negative populations and accurate gate placement by accounting for fluorescence spread from all other dyes in the panel [47] [48]. | Cells stained with all antibodies except one. |
| Fc Blocking Reagents | Reduce non-specific antibody binding to Fc receptors on immune cells [47] [49]. | Purified IgG, commercial FcR blocking reagents. |
| Unstained Control | Determine cellular autofluorescence and set baseline for voltage/negative gates [49] [48]. | Untreated cells from the same sample. |
Visualizing the Apoptosis Pathway and Detection
A major advantage of flow cytometry is its ability to probe specific biological pathways, such as apoptosis, in depth. The following diagram outlines the key stages of apoptosis and how they are detected using flow cytometry markers like Annexin V and PI.
The correlation between flow cytometry and fluorescence microscopy viability data is strong, confirming that both are valid techniques for cytocompatibility screening. However, the choice of technique has a profound impact on experimental outcomes. Fluorescence microscopy offers valuable spatial context and is a accessible tool for initial assessments. Flow cytometry, however, delivers superior quantitative precision, higher sensitivity, and a greater depth of information by distinguishing subtle cell death modalities. For research and drug development requiring definitive, high-resolution data on cellular health—particularly under conditions of high cytotoxic stress—flow cytometry, governed by rigorous experimental controls, is the unequivocally more powerful and reliable technique.
Data Correlation and Technique Selection: When to Use Which Method
The preclinical assessment of cytotoxicity is a critical step in the development of new biomaterials. For bioactive glasses (BGs)—a class of materials with established osteoconductive and osteogenic properties—accurately determining their effects on cell viability is essential for clinical translation [50]. However, the particulate nature of these materials presents unique challenges for cytotoxicity evaluation, as traditional assessment techniques may vary in their sensitivity and ability to detect subtle cellular responses [1].
This guide provides a comparative analysis of two widely employed cell viability assessment techniques—fluorescence microscopy (FM) and flow cytometry (FCM)—within the context of bioactive glass cytotoxicity. We objectively evaluate their performance characteristics, supported by experimental data from a recent comparative study that examined the effects of Bioglass 45S5 (BG) on SAOS-2 osteoblast-like cells [1] [8]. The findings are framed within a broader thesis on the correlation between flow cytometry and fluorescence microscopy viability data, offering researchers evidence-based guidance for selecting appropriate methodologies in biomaterial biocompatibility testing.
Technical Comparison of Viability Assessment Techniques
Fundamental Principles and Capabilities
Fluorescence Microscopy (FM) employs FDA/PI (fluorescein diacetate/propidium iodide) staining to visually distinguish viable from non-viable cells based on membrane integrity. Viable cells with intact membranes enzymatically convert non-fluorescent FDA to green-fluorescent fluorescein, while non-viable cells with compromised membranes permit PI entry, binding to DNA and producing red fluorescence [1] [8]. This technique provides direct morphological context but is generally limited to binary live/dead classification.
Flow Cytometry (FCM) utilizes a multiparametric staining approach (typically incorporating Hoechst, DiIC1, Annexin V-FITC, and PI) to not only distinguish viable and non-viable populations but also to differentiate early apoptotic, late apoptotic, and necrotic cells [1] [8]. This technique analyzes cells in suspension as they pass through a laser beam, detecting scattered and emitted light to provide high-throughput, quantitative single-cell data without morphological context.
Comparative Performance Metrics
Table 1: Direct comparison of fluorescence microscopy and flow cytometry for cell viability assessment
| Performance Characteristic | Fluorescence Microscopy (FM) | Flow Cytometry (FCM) |
|---|---|---|
| Primary Staining Method | FDA/PI (binary live/dead) [8] | Multiparametric (Hoechst, DiIC1, Annexin V-FITC, PI) [8] |
| Viability Resolution | Basic viable/non-viable distinction [1] | Distinguishes viable, early apoptotic, late apoptotic, and necrotic populations [1] |
| Data Output | Qualitative with quantitative potential; limited sampling [1] | Fully quantitative; high-throughput single-cell analysis [1] |
| Throughput | Lower; manual field selection limits cell count [1] | Higher; rapidly analyzes thousands of cells per sample [1] |
| Sensitivity in High Cytotoxicity | Detected 9-10% viability under extreme conditions [8] | Detected 0.2-0.7% viability under identical conditions [8] |
| Key Advantage | Direct visualization and morphological context [1] | Superior precision, sensitivity, and detailed subpopulation analysis [1] |
| Main Limitation | Susceptible to biomaterial autofluorescence interference [1] | Requires single-cell suspension; loses spatial information [1] |
Experimental Data: Bioactive Glass Cytotoxicity Assessment
Experimental Design and Parameters
A direct comparative study exposed SAOS-2 osteoblast-like cells to Bioglass 45S5 (BG) particles of varying sizes (<38 μm, 63–125 μm, and 315–500 μm) at concentrations of 25, 50, and 100 mg/mL for 3 and 72 hours [1]. This design created a controlled gradient of cytotoxic stress to evaluate how effectively each detection method captured a range of cellular responses.
Quantitative Findings on Cell Viability
Both FM and FCM confirmed a clear size- and dose-dependent cytotoxic trend: smaller particles and higher concentrations resulted in significantly greater cytotoxicity [1] [8]. The most pronounced effect was observed for the smallest particles (<38 μm) at the highest concentration (100 mg/mL).
Table 2: Comparative viability results for BG particles (<38 μm at 100 mg/mL) using FM vs. FCM
| Exposure Time | Fluorescence Microscopy (FM) Viability | Flow Cytometry (FCM) Viability |
|---|---|---|
| 3 hours | 9% [8] | 0.2% [8] |
| 72 hours | 10% [8] | 0.7% [8] |
| Control Group Viability | >97% [1] | >97% [1] |
Despite the absolute difference in viability percentages, statistical analysis revealed a strong correlation between the datasets generated by both techniques (r = 0.94, R² = 0.8879, p < 0.0001) [8]. This indicates that while FCM provides greater absolute sensitivity, both methods capture the same underlying biological trends in response to bioactive glass exposure.
The pH Cytotoxicity Mechanism
The cytotoxicity of bioactive glass is closely linked to pH changes in the culture medium. As BG dissolves, it releases Na⁺ and Ca²⁺ ions, increasing local pH and disrupting cellular homeostasis [1] [51]. Studies show that 45S5 bioactive glass can raise medium pH from 7.5 to 8.7 within 24 hours, while mixed strontium calcium glass (Sr40) causes a more moderate increase to 7.6 under the same conditions [51]. This pH effect is more pronounced with smaller particles and higher concentrations, explaining the observed size- and dose-dependent cytotoxicity [1].
Methodological Protocols
Fluorescence Microscopy Protocol for BG Cytotoxicity
The following workflow outlines the standard procedure for assessing bioactive glass cytotoxicity using fluorescence microscopy:
Cell Seeding and Treatment: SAOS-2 osteoblast-like cells are seeded in appropriate culture vessels and allowed to adhere for 24 hours. Cells are then treated with BG particles across the desired size ranges and concentrations [1].
Exposure and Staining: After 3 or 72 hours of exposure, culture medium is removed and cells are stained with FDA/PI working solution. FDA stock solution (5 mg/mL in acetone) is diluted to 10 μg/mL in PBS, while PI stock solution (1 mg/mL in water) is diluted to 15 μg/mL in PBS [1].
Visualization and Analysis: Cells are incubated with stains for 10-15 minutes at 37°C, then visualized using a fluorescence microscope with appropriate filter sets. Viable cells (green fluorescence) and non-viable cells (red fluorescence) are counted manually or using image analysis software across multiple representative fields [1].
Flow Cytometry Protocol for BG Cytotoxicity
The following workflow outlines the comprehensive procedure for multiparametric viability assessment using flow cytometry:
Cell Harvesting: Following BG exposure, cells are washed with PBS and detached using trypsin-EDTA. The cell suspension is centrifuged, and the pellet is resuspended in appropriate buffer [1].
Multiparametric Staining: Cells are stained with a cocktail of fluorescent probes including:
- Hoechst dye for DNA content and cell cycle analysis
- DiIC1 for mitochondrial membrane potential
- Annexin V-FITC for phosphatidylserine exposure (early apoptosis)
- Propidium iodide for membrane integrity (late apoptosis/necrosis) [1] [8]
Data Acquisition and Analysis: Stained cells are analyzed using a flow cytometer equipped with multiple lasers and detectors. A minimum of 10,000 events per sample is typically collected. Data analysis involves sequential gating to exclude debris and doublets, followed by quadrant analysis to distinguish viable (Annexin V⁻/PI⁻), early apoptotic (Annexin V⁺/PI⁻), late apoptotic (Annexin V⁺/PI⁺), and necrotic (Annexin V⁻/PI⁺) populations [1].
Essential Research Reagent Solutions
Table 3: Key reagents and materials for bioactive glass cytotoxicity assessment
| Reagent/Material | Function/Purpose | Application Notes |
|---|---|---|
| Bioactive Glass 45S5 | Test material demonstrating dose-dependent cytotoxicity [1] | Vary particle sizes (<38 μm, 63-125 μm, 315-500 μm) and concentrations (25-100 mg/mL) [1] |
| SAOS-2 Cell Line | Human osteoblast-like cells with mature osteogenic phenotype [1] | Suitable for bone biomaterial studies; maintain in recommended media with serum [1] |
| FDA/PI Staining Kit | Fluorescent viability staining for microscopy [8] | Distinguishes live (green) and dead (red) cells based on membrane integrity [8] |
| Annexin V-FITC/PI Kit | Apoptosis detection kit for flow cytometry [1] | Enables differentiation of apoptotic stages (early vs. late) and necrosis [1] |
| Hoechst Staining Dye | DNA binding dye for cell cycle analysis [8] | Used in multiparametric panels to assess nuclear morphology and viability [8] |
| DiIC1 Fluorescent Probe | Mitochondrial membrane potential indicator [8] | Detects early apoptotic changes through mitochondrial function assessment [8] |
This comparative analysis demonstrates that both fluorescence microscopy and flow cytometry are valuable techniques for assessing bioactive glass cytotoxicity, with a strong correlation between their viability measurements (r = 0.94) [8]. However, their respective capabilities differ significantly.
- Fluorescence microscopy serves as an accessible screening tool that provides morphological context but has limitations in resolution, throughput, and ability to detect subtle cellular changes.
- Flow cytometry offers superior sensitivity, precision, and detailed subpopulation analysis, capable of distinguishing early apoptotic transitions that precede cell death.
The choice between these techniques should be guided by research objectives. For initial screening of biomaterial biocompatibility, FM provides sufficient data with less specialized equipment. For mechanistic studies requiring precise quantification of cell death pathways or for evaluating materials with anticipated subtle cytotoxic effects, FCM is unequivocally more sensitive and informative. Researchers should consider implementing a tiered approach, using FM for preliminary screening followed by FCM for detailed analysis of promising candidates, thereby optimizing resources while maintaining analytical rigor in biomaterial safety assessment.
In biomedical research, accurately assessing cell viability is fundamental for applications ranging from preclinical biomaterial evaluation to drug discovery. Fluorescence microscopy (FM) and flow cytometry (FCM) are two cornerstone techniques for this purpose, yet a comprehensive understanding of the correlation between the data they produce is critical for methodological selection and data interpretation [1]. This guide objectively compares the performance of flow cytometry and fluorescence microscopy in generating cell viability data, framed within the broader thesis of validating statistical correlation between these techniques. We synthesize comparative experimental data to provide researchers, scientists, and drug development professionals with a clear evidence base, supporting robust experimental design and analysis.
The fundamental difference between the techniques lies in their operation: FM allows direct imaging of cells, providing spatial context, whereas FCM offers high-throughput, quantitative analysis of individual cells in suspension [1]. A key challenge in correlating data from these methods is that FCM quantitatively analyzes single cells, while FM often relies on manual or semi-automated analysis of a smaller number of cells in a field of view, which can introduce sampling bias [1].
Comparative Experimental Data
A direct comparative study investigating the cytotoxicity of Bioglass 45S5 (BG) on SAOS-2 osteoblast-like cells provides robust quantitative data on the relationship between FM and FCM [1].
Table 1: Comparative Viability Assessment by FM and FCM
| BG Particle Condition | Viability by FM (%) | Viability by FCM (%) | Discrepancy (FCM-FM) |
|---|---|---|---|
| Control | > 97% | > 97% | Minimal |
| < 38 µm, 100 mg/mL, 3h | 9% | 0.2% | -8.8% |
| < 38 µm, 100 mg/mL, 72h | 10% | 0.7% | -9.3% |
Source: Adapted from [1]
Despite the absolute differences highlighted in Table 1, statistical analysis across all tested particle sizes and concentrations revealed a strong positive correlation between the two methods. The study reported a correlation coefficient of r = 0.94, with a coefficient of determination of R² = 0.8879 and a high level of statistical significance (p < 0.0001) [1]. This indicates that nearly 89% of the variation in FCM viability data can be explained by the variation in FM data, confirming that both techniques capture the same underlying biological trends—namely, that smaller particles and higher concentrations cause greater cytotoxicity [1].
Key Findings from Comparative Analysis
- Strong Overall Correlation: The high correlation coefficient (r=0.94) confirms that FM and FCM data are strongly related for viability assessment in particulate systems [1].
- Systematic Underestimation by FCM: Under conditions of high cytotoxic stress, FCM consistently reports lower viability percentages than FM. This is attributed to FCM's ability to detect a greater proportion of dead or apoptotic cells that may be loosely attached or absent in the fields analyzed by microscopy [1].
- Superior Discriminatory Power of FCM: A key advantage of FCM is its ability to use multiparametric staining to distinguish between different cell death pathways. Unlike FM, which typically classifies cells as simply live or dead, FCM can classify cells into viable, early apoptotic, late apoptotic, and necrotic populations, providing deeper biological insight [1].
- Context-Dependent Correlation: The correlation between methods can be influenced by the biological model. A study on gene electrotransfer efficiency also found that FCM measured higher transfection percentages than FM, though the critical electric field strength was similar [52].
Experimental Protocols
To ensure the validity of correlation studies, standardized and detailed experimental protocols are essential. Below are the core methodologies from the cited comparative study.
Cell Culture and Treatment
- Cell Line: Use SAOS-2 osteoblast-like cells, known for their mature osteoblast phenotype [1].
- Test Material: Employ Bioglass 45S5 (BG) particles as a model particulate biomaterial. Sort particles into defined size ranges (e.g., < 38 µm, 63–125 µm, 315–500 µm) [1].
- Treatment: Expose cells to BG particles at various concentrations (e.g., 25, 50, and 100 mg/mL) for designated time periods (e.g., 3 h and 72 h) [1].
Fluorescence Microscopy Protocol
- Staining: After treatment, stain cells with a fluorescent live/dead stain. The protocol used Fluorescein Diacetate (FDA) for viable cells (green fluorescence) and Propidium Iodide (PI) for nonviable cells (red fluorescence) [1].
- Image Acquisition: Acquire multiple random fields of view using a fluorescence microscope to ensure a representative sample of the cell population [1].
- Viability Calculation: Manually or using image analysis software, count the number of green (viable) and red (nonviable) cells. Calculate viability as the percentage of viable cells out of the total counted cells [1].
Flow Cytometry Protocol
- Cell Harvesting: Gently trypsinize cells and prepare a single-cell suspension. This step is critical for accurate FCM analysis [1].
- Multiparametric Staining: Stain the cell suspension with a cocktail of fluorescent probes. The cited protocol used:
- Hoechst: A DNA-binding dye to identify nucleated cells.
- DiIC1: A dye to assess mitochondrial membrane potential.
- Annexin V-FITC: To detect phosphatidylserine exposure on the outer leaflet of the cell membrane, a marker for early apoptosis.
- Propidium Iodide (PI): To label cells with compromised membrane integrity (late apoptosis/necrosis) [1].
- Data Acquisition: Analyze the stained suspension on a flow cytometer, ensuring that a high number of events (e.g., >10,000 cells) are collected for statistical robustness [1].
- Gating and Viability Calculation: Use a sequential gating strategy to first select single, nucleated cells. Then, based on the staining profile (e.g., Annexin V and PI), classify cells into viable (Annexin V-/PI-), early apoptotic (Annexin V+/PI-), late apoptotic (Annexin V+/PI+), and necrotic (Annexin V-/PI+) populations. Calculate total viability as the percentage of cells in the viable population [1] [53].
Statistical Validation of Correlation
Interpreting correlation coefficients correctly is paramount for validating that two methods measure the same underlying phenomenon.
Pearson Correlation Coefficient (PCC)
The Pearson Correlation Coefficient is a common statistic used to measure the degree of linear correlation between two datasets, such as the pixel-by-pixel intensity in two fluorescence images or, as in our context, the viability percentages obtained from FM and FCM across multiple samples [54] [55]. The formula for PCC is:
$$PCC = \frac{\sum{i=1}^n (xi - \overline{x})(yi - \overline{y})}{\sqrt{\sum{i=1}^n (xi - \overline{x})^2} \sqrt{\sum{i=1}^n (y_i - \overline{y})^2}}$$
where (xi) and (yi) are the individual paired samples (e.g., viability from FM and FCM for sample i), and (\overline{x}) and (\overline{y}) are the mean values of the two datasets [55]. The PCC returns a value between -1 and +1:
- +1: Perfect positive linear correlation.
- 0: No linear correlation.
- -1: Perfect negative linear correlation.
The reported PCC of 0.94 between FM and FCM viability data indicates a very strong positive linear relationship [1].
Coefficient of Determination (R²)
The coefficient of determination, R², is the square of the PCC. It represents the proportion of the variance in one variable that is predictable from the other variable [1]. An R² value of 0.8879 means that approximately 88.8% of the variance in FCM viability measurements can be explained by the variance in FM measurements, further reinforcing the strong agreement between the two techniques.
p-value
The p-value tests the null hypothesis that there is no correlation between the two methods. A p-value < 0.0001 is highly significant, providing strong statistical evidence to reject the null hypothesis and conclude that the observed correlation is real and not due to random chance [1].
The Scientist's Toolkit
Table 2: Essential Research Reagent Solutions
| Item | Function in Experiment |
|---|---|
| Bioglass 45S5 Particles | Model particulate biomaterial to induce a controlled gradient of cytotoxic stress for method comparison [1]. |
| SAOS-2 Osteoblast-like Cells | A human cell line with a mature osteoblast phenotype, suitable for bone biomaterial studies [1]. |
| Fluorescein Diacetate (FDA) | Cell-permeant esterase substrate; live cells convert it to fluorescent fluorescein (green) [1]. |
| Propidium Iodide (PI) | Cell-impermeant DNA intercalator; stains nuclei of dead cells (red) in both FM and FCM [1]. |
| Hoechst Stains | Cell-permeant DNA-binding dye; used in FCM to identify and gate on nucleated cells [1]. |
| Annexin V-FITC | Binds to phosphatidylserine exposed on the outer membrane of apoptotic cells; used in FCM for early apoptosis detection [1]. |
| DiIC1(3) | Lipophilic cationic dye that accumulates in active mitochondria; used in FCM to assess mitochondrial health [1]. |
| AccuCheck ERF Reference Particles | NIST-traceable bead standards for instrument calibration and standardization across experiments and platforms [56]. |
| Flow Cytometry Compensation Beads | Used with single-stained controls to correct for spectral overlap (spillover) between fluorescent channels in FCM [56]. |
This comparison guide demonstrates that while absolute viability readings may differ, particularly under high cytotoxicity, flow cytometry and fluorescence microscopy produce strongly correlated data for cell viability assessment, as evidenced by a Pearson correlation coefficient of 0.94 and a highly significant p-value [1]. The choice between techniques should be guided by experimental needs: FM provides visual confirmation and spatial context, while FCM offers superior quantitative precision, higher throughput, and the ability to dissect complex cell death pathways through multiparametric analysis [1]. For robust conclusions, researchers should be aware of FCM's tendency to yield lower absolute viability under high-stress conditions and consider using it as the gold standard when detailed mechanistic insights into apoptosis and necrosis are required.
In biomedical research, particularly in preclinical cytotoxicity evaluation, the choice of analytical technique fundamentally shapes the data and insights one can gather. This guide objectively compares two cornerstone methodologies: flow cytometry (FCM), renowned for its high-throughput quantitative capabilities, and fluorescence microscopy (FM), valued for its provision of rich morphological context. Framed within a broader thesis on correlating viability data, this analysis leverages recent comparative studies to delineate the performance, applications, and limitations of each technique. The critical importance of this comparison is highlighted by investigations into particulate biomaterials like Bioglass 4555, where the selection of an assessment method can significantly influence the interpretation of a material's biocompatibility and cytotoxic potential [1] [8]. Understanding the intrinsic strengths of each platform enables researchers to make informed decisions, whether the goal is rapid, statistical analysis of heterogenous populations or the detailed observation of cellular structure and spatial relationships.
The following table summarizes the core performance characteristics of flow cytometry and fluorescence microscopy as established by direct comparative studies.
Table 1: Core Technique Performance Comparison
| Feature | Flow Cytometry (FCM) | Fluorescence Microscopy (FM) |
|---|---|---|
| Primary Strength | High-throughput, multiparametric quantification [14] | Direct morphological imaging and contextual analysis [1] |
| Viability Measurement | Quantitative, based on fluorescence intensity of suspended cells [1] | Semi-quantitative, based on visual assessment of adherent cells [1] |
| Throughput | Very high (>10,000 cells/second) [14] | Low to moderate (limited by fields of view) [1] |
| Statistical Power | High (analyzes large cell numbers) [1] | Lower (potential for sampling bias) [1] |
| Spatial Context | None (cells in suspension) | Preserved (cells in adherent culture) |
| Apoptosis/Necrosis Discrimination | Yes (via multiparametric staining e.g., Annexin V/PI) [8] | Limited (generally binary live/dead distinction) [8] |
| Data Correlation | Strong correlation with FM (r = 0.94) [8] | Strong correlation with FCM (r = 0.94) [8] |
| Reported Viability (BG <38µm, 100 mg/mL) | 0.2% at 3h; 0.7% at 72h [8] | 9% at 3h; 10% at 72h [8] |
A pivotal 2025 study that directly compared both techniques under identical experimental conditions—treating SAOS-2 osteoblast-like cells with Bioglass 4555 particles of varying sizes and concentrations—found a strong overall correlation (r=0.94) between the viability data produced by FCM and FM [8]. However, a critical discrepancy was observed: FCM consistently reported lower viability percentages under high cytotoxic stress. For instance, with the smallest particles (<38 µm) at the highest concentration (100 mg/mL), FCM measured viabilities of 0.2% and 0.7% at 3 and 72 hours, respectively, whereas FM reported 9% and 10% under the same conditions [8]. This difference is attributed to FCM's superior sensitivity and its ability to analyze a much larger number of cells, thereby providing a more statistically robust measurement and reducing sampling bias [1].
Technical Principles and Workflows
The fundamental difference between these techniques lies in their operational paradigms: FCM is a suspension-based biochemical sensor, while FM is an imaging-based morphological tool.
Flow Cytometry: High-Throughput Quantification
Flow cytometry operates by analyzing individual cells in a fluid stream as they pass through a laser beam. It measures both light scattering properties (forward scatter for cell size and side scatter for granularity) and fluorescence intensity from labeled markers [1]. The key to its quantitative power is multiparametric staining, which uses a panel of fluorescent dyes to simultaneously probe different cellular states. A typical panel for advanced viability assessment includes:
- Hoechst: Stains DNA for nucleus identification.
- DiIC1: Labels mitochondria in live cells.
- Annexin V-FITC: Binds to phosphatidylserine exposed on the surface of cells in early apoptosis.
- Propidium Iodide (PI): Penetrates cells with compromised membranes (late apoptosis/necrosis) [8].
This allows FCM to distinguish not just live and dead populations, but also to identify early apoptotic, late apoptotic, and necrotic cells, providing a nuanced view of cell death mechanisms [8].
Fluorescence Microscopy: Morphological Context
Fluorescence microscopy visualizes cells directly within their culture environment. It works by exciting fluorescent dyes with specific wavelengths of light and capturing the emitted light through an objective lens [1]. For standard viability assays, a binary staining approach is common:
- Fluorescein Diacetate (FDA): A non-fluorescent compound that is converted to green-fluorescent fluorescein by metabolically active live cells.
- Propidium Iodide (PI): Labels nuclei of dead cells with red fluorescence [8].
Researchers then visually count or use software to analyze the ratio of green (live) to red (dead) cells across several selected fields of view. This process preserves the spatial context and allows for the assessment of cell morphology, confluency, and attachment. However, it is generally limited to a binary live/dead classification and is more susceptible to sampling bias and lower throughput [1] [8].
Experimental Protocols for Cytotoxicity Assessment
The following protocols are adapted from the seminal comparative study on Bioglass 4555 cytotoxicity [1] [8], providing a template for direct methodological comparison.
Sample Preparation and Treatment
- Cell Line: SAOS-2 human osteoblast-like cells.
- Test Material: Bioglass 4555 (BG) particles, sieved into three size ranges: <38 µm, 63-125 µm, and 315-500 µm.
- Treatment: Expose cells to BG particles at concentrations of 25, 50, and 100 mg/mL in culture medium for 3 and 72 hours.
- Controls: Include untreated cells as a negative control (>97% viability expected).
Flow Cytometry Protocol
- Cell Harvesting: Gently detach adherent cells using a non-enzymatic cell dissociation buffer to avoid damaging cell membranes.
- Staining: Resuspend the cell pellet in a staining solution containing:
- Hoechst (e.g., 1 µg/mL) for 15 minutes.
- Add DiIC1 (e.g., 50 nM), Annexin V-FITC (as per manufacturer's instructions), and PI (e.g., 1 µg/mL) and incubate for an additional 15-20 minutes in the dark.
- Data Acquisition: Analyze samples on a flow cytometer within 1 hour. Collect a minimum of 10,000 events per sample to ensure statistical significance.
- Gating Strategy:
- Use FSC vs. SSC to gate on the primary cell population.
- Use Hoechst-positive events to select nucleated cells.
- Analyze Annexin V-FITC vs. PI fluorescence to distinguish viable (Annexin V-/PI-), early apoptotic (Annexin V+/PI-), late apoptotic (Annexin V+/PI+), and necrotic (Annexin V-/PI+) populations [8].
Fluorescence Microscopy Protocol
- Staining: After treatment, aspirate the medium from adherent cells and add a solution containing FDA (e.g., 1 µg/mL) and PI (e.g., 1 µg/mL) in PBS. Incubate for 5-10 minutes at 37°C.
- Image Acquisition: Using a fluorescence microscope with appropriate filters, immediately capture multiple non-overlapping images (e.g., 5-10 fields) from each well at 10x or 20x magnification. Ensure consistent lighting and exposure settings across all samples.
- Cell Counting and Analysis:
- Manual Counting: Visually count green-fluorescent (live) and red-fluorescent (dead) cells in each image.
- Software-Assisted Analysis: Use image analysis software (e.g., ImageJ/Fiji, CellProfiler) to automatically threshold and count cells based on fluorescence color [57].
- Viability Calculation: Calculate percentage viability as (Number of Live Cells / Total Number of Cells) × 100 for each field of view, then average the results.
Table 2: Key Research Reagent Solutions
| Reagent / Solution | Function / Role in Experiment | Associated Technique |
|---|---|---|
| Hoechst | DNA-binding dye that stains the nucleus of all cells. | Flow Cytometry |
| Annexin V-FITC | Binds to phosphatidylserine, a marker of early apoptosis. | Flow Cytometry |
| DiIC1(5) | Mitochondrial stain indicating metabolic activity in live cells. | Flow Cytometry |
| Propidium Iodide (PI) | Membrane-impermeant dye that stains nuclei of dead cells. | Flow Cytometry & Microscopy |
| Fluorescein Diacetate (FDA) | Converted to green fluorescein by esterases in live cells. | Fluorescence Microscopy |
| Bioglass 4555 Particles | Model particulate biomaterial to induce a gradient of cytotoxic stress. | Both |
| Trypsin-EDTA / Dissociation Buffer | Detaches adherent cells for analysis in suspension. | Flow Cytometry |
Analysis of Technique Selection Criteria
Choosing between flow cytometry and fluorescence microscopy depends on the specific research questions and practical constraints.
Advantages and Limitations in Context
Flow Cytometry Advantages:
- Multiparametric Analysis: Its greatest strength is the ability to measure multiple fluorescent labels simultaneously, enabling deep phenotyping of cell death (viable, early/late apoptotic, necrotic) [8].
- High Throughput and Objectivity: It rapidly analyzes tens of thousands of cells, providing robust statistics and minimizing operator-induced bias [1] [14].
- Superior Sensitivity: FCM detects subtle changes in cell populations under high cytotoxic stress, as evidenced by the significantly lower viability readings compared to FM [8].
Flow Cytometry Limitations:
- Loss of Spatial Context: Analyzing cells in suspension destroys information about cell-to-cell interactions and adherence morphology.
- Higher Cost and Complexity: Requires significant capital investment and technical expertise to operate and maintain.
- Sample Preparation: Cell detachment can artificially affect viability and surface markers.
Fluorescence Microscopy Advantages:
- Morphological Preservation: Allows direct visualization of cell shape, size, and spatial distribution, which can be crucial for studies on adhesion or cytoskeletal changes [58].
- Accessibility and Lower Cost: Fluorescence microscopes are more common and affordable in most research settings.
- Simplicity: The FDA/PI staining protocol is straightforward and requires less specialized training.
Fluorescence Microscopy Limitations:
- Lower Throughput and Sampling Bias: Manual counting of a few fields of view is time-consuming and may not represent the entire cell population [1].
- Limited Phenotyping: Typically restricted to a binary live/dead assessment.
- Susceptibility to Interference: Autofluorescence from materials or biomaterials can inhibit accurate imaging and analysis [1].
The choice between high-throughput quantification (flow cytometry) and morphological context (fluorescence microscopy) is not a matter of identifying a superior technique, but of selecting the right tool for the specific research objective. For studies requiring detailed, statistically powerful quantification of cell death pathways in large populations, flow cytometry is unequivocally more sensitive and informative. Conversely, when the preservation of morphological context and spatial relationships is paramount, fluorescence microscopy remains indispensable.
The strong correlation (r=0.94) between datasets from both techniques validates their use in viability assessment [8]. However, the consistent quantitative differences highlight that data from these methods are not directly interchangeable. Future developments in imaging flow cytometry, which combines the high-throughput, multiparametric analysis of flow cytometry with the imaging capabilities of microscopy, promise to bridge this gap [14]. Furthermore, the integration of machine learning-based morphological profiling with standard FM is enriching the quantitative data that can be extracted from images, moving beyond simple viability to predict functional states like immunomodulatory potential [58]. For researchers framing a thesis on the correlation between these methods, this guide underscores that technique selection must be deliberate, justified, and aligned with the core questions of the investigation.
Integrating FM and FCM in a Complementary Workflow for Comprehensive Analysis
The pursuit of reliable cytotoxicity assessment in biomaterial research and drug development necessitates robust, complementary cell viability techniques. Fluorescence Microscopy (FM) and Flow Cytometry (FCM) are two cornerstone methods for quantitative cell analysis, yet a direct comparison of their performance, particularly in challenging contexts like particulate systems, has been underexplored [1]. A foundational study investigating the cytotoxicity of Bioglass 45S5 on SAOS-2 osteoblast-like cells revealed a strong correlation between viability data obtained from FM and FCM, with a Pearson correlation coefficient of r = 0.94 (R² = 0.8879, p < 0.0001) [1] [59]. This significant correlation underscores the potential for integrating these technologies into a unified workflow. This guide objectively compares the performance of FM and FCM, providing supporting experimental data to frame their complementary use for a comprehensive analytical strategy.
Technology Comparison: FM vs. FCM
While both FM and FCM are bioanalysis tools that use fluorescence to quantify cellular components, they possess distinct strengths and limitations, making them suitable for different, yet complementary, applications [60].
Fluorescence Microscopy (FM) is an enhanced light microscope that uses high-intensity light to excite fluorophores in a specimen, which then emit light at a longer wavelength to produce a magnified image [60]. It allows for the visualization of how a component is distributed within the cell—whether uniformly or clustered in specific anatomical compartments [60].
Flow Cytometry (FCM) is a laser-based technique that analyzes the physical and chemical characteristics of cells or particles as they pass in a single file stream through a laser beam [1]. It provides high-throughput, quantitative data on a per-cell basis for parameters like cell size, granularity, and the quantity of specific markers [60].
Table 1: Core Characteristics of Fluorescence Microscopy and Flow Cytometry
| Feature | Fluorescence Microscopy (FM) | Flow Cytometry (FCM) |
|---|---|---|
| Spatial Resolution | High; enables subcellular localization [60] | None; whole-cell analysis without spatial context [60] |
| Throughput | Low to medium (tens to hundreds of cells) [60] | Very high (thousands to millions of cells) [1] [60] |
| Sample Requirement | Adherent cells or tissue sections; suspension not required [60] | Single-cell suspension is mandatory [1] [60] |
| Data Output | Qualitative images and semi-quantitative data from fields of view | Highly quantitative, multi-parameter data for entire population [1] [60] |
| Live Cell Sorting | Not capable [60] | Capable of distinguishing and sorting living cells [60] |
| Key Advantage | Visual confirmation and context of cellular interactions [60] | Objective, statistical power and ability to detect rare events [1] |
Comparative Experimental Data: A Case Study in Cytotoxicity
A direct comparative study exposed SAOS-2 osteoblast-like cells to Bioglass 45S5 (BG) particles of varying sizes and concentrations to generate a gradient of cytotoxic stress [1]. The viability was assessed using both FM and FCM under identical conditions, but with staining protocols optimized for each technology.
- FM Staining: Utilized Fluorescein Diacetate (FDA) for viable cells (green) and Propidium Iodide (PI) for nonviable cells (red) [1].
- FCM Staining: Employed a multiparametric panel including Hoechst (viability), DiIC1 (viability), Annexin V-FITC (apoptosis), and PI (necrosis) to classify viable, early apoptotic, late apoptotic, and necrotic cell populations [1].
The results, summarized in Table 2, confirm a consistent trend of greater cytotoxicity with smaller particles and higher concentrations across both techniques. However, FCM consistently reported lower viability percentages under high cytotoxic stress and provided a more detailed breakdown of cell death mechanisms [1].
Table 2: Comparative Viability Data from FM and FCM under High Cytotoxic Stress (100 mg/mL BG) [1]
| Particle Size | Timepoint | FM Viability (%) | FCM Viability (%) | FCM Apoptosis/Necrosis Data |
|---|---|---|---|---|
| < 38 µm | 3 hours | 9% | 0.2% | Distinguished early/late apoptosis and necrosis |
| < 38 µm | 72 hours | 10% | 0.7% | Distinguished early/late apoptosis and necrosis |
| 63-125 µm | 72 hours | 84% | 78% | Distinguished early/late apoptosis and necrosis |
| Control | 72 hours | >97% | >97% | Distinguished early/late apoptosis and necrosis |
The deviation in absolute viability values, particularly under extreme conditions, can be attributed to FCM's superior precision and its ability to analyze a much larger number of cells, thereby reducing sampling bias [1]. Furthermore, the study noted that particulate biomaterials can exhibit autofluorescence and light scattering that inhibit fluorescence imaging, a limitation that FCM is better equipped to overcome [1].
Experimental Protocols for Viability Assessment
Protocol: Fluorescence Microscopy for Live/Dead Staining
This protocol is adapted from the comparative study using FDA and PI staining [1].
- Cell Seeding and Treatment: Seed SAOS-2 osteoblast-like cells onto an appropriate culture vessel (e.g., multi-well plate) and allow them to adhere. Treat cells with the test particulate biomaterial (e.g., Bioglass 45S5) at desired concentrations and durations.
- Staining Solution Preparation: Prepare a working staining solution in a buffered saline or culture medium. The solution should contain ~5-10 µg/mL Fluorescein Diacetate (FDA) and ~1-5 µg/mL Propidium Iodide (PI). Protect from light.
- Staining Incubation: After the treatment period, remove the culture medium from the wells. Gently rinse the cells with PBS to remove loose particles. Add the FDA/PI staining solution to cover the cells and incubate for 5-15 minutes at room temperature, protected from light.
- Image Acquisition: Following incubation, remove the staining solution and replace with PBS or fresh medium. Immediately visualize the cells using a fluorescence microscope with standard FITC (green) and TRITC (red) filter sets. Capture multiple, random fields of view for statistical robustness.
- Image Analysis: Manually count or use image analysis software to quantify the number of green-fluorescent (viable) and red-fluorescent (nonviable) cells. Calculate the percentage viability as: (Number of viable cells / Total number of cells) × 100.
Protocol: Multiparametric Flow Cytometry for Viability and Death Mechanism
This protocol details the use of a multi-dye panel to distinguish viable, apoptotic, and necrotic populations [1].
- Cell Harvest and Preparation: After treatment, harvest the cells (including any floating cells, which are crucial for accurate cytotoxicity assessment) to create a single-cell suspension. Gently wash the cells with a buffer such as PBS.
- Staining with Fluorescent Dyes: Resuspend the cell pellet in a binding buffer. Add the following dyes to distinguish different states:
- Annexin V-FITC: To detect phosphatidylserine externalization, a marker for early apoptosis. Incubate for 10-15 minutes in the dark.
- Propidium Iodide (PI): To stain cells with compromised membrane integrity (necrotic or late-stage apoptotic). Add PI just before running the sample on the flow cytometer.
- Hoechst Stains (e.g., for DNA content/viability) and DiIC1 (a mitochondrial dye for viability) can be incorporated as per the panel design [1].
- Flow Cytometer Acquisition: Within 1 hour of staining, analyze the samples on a flow cytometer. Configure the instrument with lasers and filters appropriate for FITC (Annexin V), PI, and any other dyes used (e.g., Hoechst). Collect data for a minimum of 10,000 events per sample to ensure statistical significance.
- Gating and Data Analysis: Use flow cytometry analysis software. First, gate on the cell population of interest using forward scatter (FSC, indicates size) and side scatter (SSC, indicates granularity) to exclude debris. Then, analyze the fluorescence in a dot plot of Annexin V-FITC vs. PI to distinguish the populations:
- Annexin V-FITC negative / PI negative: Viable cells.
- Annexin V-FITC positive / PI negative: Early apoptotic cells.
- Annexin V-FITC positive / PI positive: Late apoptotic or necrotic cells.
A Complementary Workflow for Comprehensive Analysis
The data demonstrates that FM and FCM are not mutually exclusive but are synergistic. A proposed integrated workflow leverages the spatial context of FM with the quantitative, high-throughput, and detailed phenotyping power of FCM. The following diagram visualizes this complementary relationship and experimental pathway.
Research Reagent Solutions
The execution of these protocols requires specific reagents and materials. The following table details key solutions used in the featured experiments.
Table 3: Essential Research Reagents for FM and FCM Viability Assays
| Reagent / Material | Function / Application | Example Use in Context |
|---|---|---|
| Fluorescein Diacetate (FDA) | Cell-permeant esterase substrate; metabolized in live cells to produce green fluorescent fluorescein [1]. | FM live/dead staining; viable cells fluoresce green [1]. |
| Propidium Iodide (PI) | Cell-impermeant DNA intercalator; red fluorescent upon binding DNA in cells with compromised membranes [1]. | Labels dead cells in both FM and FCM assays [1]. |
| Annexin V-FITC | Binds to phosphatidylserine (PS) exposed on the outer leaflet of the cell membrane during early apoptosis [1]. | FCM apoptosis detection; used with PI to distinguish early vs. late apoptosis [1]. |
| Hoechst Stains | Cell-permeant blue fluorescent dyes that bind to DNA in the nucleus. | FCM viability marker and for gating on nucleated cells [1]. |
| DiIC1 | Cell-permeant carbocyanine dye that labels active mitochondria; loss of signal indicates loss of mitochondrial membrane potential. | FCM viability marker [1]. |
| Bioglass 45S5 Particles | Model particulate biomaterial; dissolves and increases local pH, creating a controlled cytotoxic stress [1]. | Used as the test material to induce a gradient of cell death for method comparison [1]. |
| SAOS-2 Cell Line | Human osteosarcoma-derived cell line with a mature osteoblast-like phenotype [1]. | Model cell system for evaluating cytotoxic effects of bioactive materials [1]. |
Conclusion
Flow cytometry and fluorescence microscopy demonstrate a strong correlation in viability assessment, yet each offers distinct advantages. FCM provides superior quantitative precision, sensitivity under high cytotoxic stress, and the ability to distinguish apoptotic subpopulations. FM retains value for visual confirmation and morphological context. The choice between techniques should be guided by specific research needs: FCM for high-throughput, quantitative studies requiring statistical power, and FM for investigations needing spatial information or analysis of rare, complex cellular events. Future directions include the integration of spectral flow cytometry, artificial intelligence-assisted analysis, and the development of standardized, multiplexed viability assays for complex biomaterial systems. This synergistic approach will enhance the reliability of preclinical cytotoxicity evaluations, ultimately accelerating the development of safer biomaterials and therapeutics.
References
- 1. Evaluating cell viability assessment techniques [https://pmc.ncbi.nlm.nih.gov/articles/PMC12492793/]
- 2. Label-Free Single Cell Viability Assay Using Laser ... [https://pmc.ncbi.nlm.nih.gov/articles/PMC8301067/]
- 3. Functionalized microwell laser sorting method for single- ... [https://www.sciencedirect.com/science/article/abs/pii/S0925400524019324]
- 4. Comparison of imaging based single-cell resolution spatial ... [https://www.nature.com/articles/s41467-025-63414-1]
- 5. Comparison of imaging based single-cell resolution spatial ... [https://www.rna-seqblog.com/comparison-of-imaging-based-single-cell-resolution-spatial-transcriptomics-profiling-platforms-using-formalin-fixed-paraffin-embedded-tumor-samples/]
- 6. The Rise of Spatial Omics in Immunology - PubMed Central [https://pmc.ncbi.nlm.nih.gov/articles/PMC12501406/]
- 7. Multiplexed laser particles for spatially resolved single-cell ... [https://pmc.ncbi.nlm.nih.gov/articles/PMC6804532/]
- 8. Comparing Cell Viability: Flow Cytometry vs. Microscopy [https://bioengineer.org/comparing-cell-viability-flow-cytometry-vs-microscopy/]
- 9. Assessment and Comparison of Viability Assays for ... [https://pmc.ncbi.nlm.nih.gov/articles/PMC10872314/]
- 10. Evaluating cell viability assessment techniques: a comparative ... [https://biomedical-engineering-online.biomedcentral.com/articles/10.1186/s12938-025-01452-y]
- 11. Live Dead Measurement and Cell Viability - Blog [https://blog.td2inc.com/live-dead-measurement-and-cell-viability?hsLang=en]
- 12. Fixable Viability Dyes for Flow Cytometry [https://www.thermofisher.com/us/en/home/life-science/cell-analysis/flow-cytometry/flow-cytometry-assays-reagents/cell-viability-assays-flow-cytometry/fixable-viability-dyes-flow-cytometry.html]
- 13. Imaging flow cytometry with a real-time throughput beyond ... [https://www.nature.com/articles/s41377-025-01754-9]
- 14. High-throughput fluorescence lifetime imaging flow cytometry [https://www.nature.com/articles/s41467-024-51125-y]
- 15. Real-time, high-throughput super-resolution microscopy ... [https://www.nature.com/articles/s41467-025-64368-0]
- 16. Imaging flow cytometry: from high - resolution morphological ... [https://pmc.ncbi.nlm.nih.gov/articles/PMC12098090/]
- 17. Imaging Flow Cytometry as a Molecular Biology Tool [https://pmc.ncbi.nlm.nih.gov/articles/PMC12524540/]
- 18. Evaluating cell viability assessment techniques: a comparative ... [https://biomedical-engineering-online.biomedcentral.com/articles/10.1186/s12938-025-01452-y/tables/2]
- 19. Spectral Flow Cytometry: The Current State and Future of ... [https://pmc.ncbi.nlm.nih.gov/articles/PMC12193525/]
- 20. Variability of fluorescence intensity distribution measured ... [https://www.nature.com/articles/s41598-023-31990-1]
- 21. Technical note: Flow cytometry assays for the detection ... - BG [https://bg.copernicus.org/articles/22/1729/2025/]
- 22. Programmed cell death detection methods - PubMed Central [https://pmc.ncbi.nlm.nih.gov/articles/PMC9308588/]
- 23. Programmed cell death detection methods: a systematic ... [https://link.springer.com/article/10.1007/s10495-022-01735-y]
- 24. Comparison of the TUNEL, lamin B and annexin V ... [https://www.sciencedirect.com/science/article/abs/pii/S0065128104701403]
- 25. Expression, purification and use of recombinant annexin V ... [https://www.nature.com/articles/nprot.2009.143]
- 26. TUNEL staining : The method of choice for measuring cell ... [https://www.assaygenie.com/blog/tunel-staining?srsltid=AfmBOoooAsgtNEccLqwRbreRLzcB8rM93kJKidkuEUmcR-AJzvHm02Bf]
- 27. CeDaD—a novel assay for simultaneous tracking of cell death ... [https://pmc.ncbi.nlm.nih.gov/articles/PMC11880512/]
- 28. From dye exclusion to high-throughput screening: A review ... [https://www.sciencedirect.com/science/article/pii/S0734975025002502]
- 29. TUNEL Assays | Thermo Fisher Scientific - US [https://www.thermofisher.com/us/en/home/life-science/cell-analysis/cell-viability-and-regulation/apoptosis/tunel-assays.html]
- 30. Imaging flow cytometry: a primer - PMC - PubMed Central - NIH [https://pmc.ncbi.nlm.nih.gov/articles/PMC10468826/]
- 31. Immunofluorescence Staining of Bacterial Samples [https://www.protocols.io/view/immunofluorescence-staining-of-bacterial-samples-frrbbm52p.html]
- 32. Accessible and accurate cytometry analysis using ... [https://pmc.ncbi.nlm.nih.gov/articles/PMC11785219/]
- 33. BestProtocols: Viability Staining Protocol for Flow Cytometry [https://www.thermofisher.com/us/en/home/references/protocols/cell-and-tissue-analysis/protocols/viability-staining-flow-cytometry.html]
- 34. An Optimized LIVE/DEAD Assay Coupled with Flow ... [https://pmc.ncbi.nlm.nih.gov/articles/PMC12453624/]
- 35. Flow Cytometry Protocol | Abcam [https://www.abcam.com/en-us/technical-resources/protocols/flow-cytometry-for-intracellular-and-extracellular-targets]
- 36. Automated Fluorescence Cell Counters for Cell Counting and Viability ... [https://www.news-medical.net/whitepaper/20140430/Automated-Fluorescence-Cell-Counters-for-Cell-Counting-and-Viability-Analysis.aspx]
- 37. Autofluorescence Spectroscopy and Imaging: A Tool for ... [https://pmc.ncbi.nlm.nih.gov/articles/PMC4289852/]
- 38. Background in Fluorescence Imaging [https://www.thermofisher.com/us/en/home/life-science/cell-analysis/cell-analysis-learning-center/molecular-probes-school-of-fluorescence/imaging-basics/protocols-troubleshooting/troubleshooting/background-fluorescence.html]
- 39. Autofluorescence-based tissue characterization enhances ... [https://www.nature.com/articles/s41598-024-67366-2]
- 40. A Workflow to Achieve Saturation of Fluorophore ... [https://pubmed.ncbi.nlm.nih.gov/40298242/]
- 41. Direct vs. Indirect Fluorescent Antibody Labeling [https://probes.bocsci.com/resources/direct-vs-indirect-fluorescent-antibody-labeling-which-is-right-for-your-research.html]
- 42. Optimization of the Blocking and Signal Preservation ... [https://pmc.ncbi.nlm.nih.gov/articles/PMC12462741/]
- 43. Imaging flow cytometry with a real-time throughput beyond ... [https://pmc.ncbi.nlm.nih.gov/articles/PMC11808109/]
- 44. An update on recent advances in fluorescent materials for ... [https://pubs.rsc.org/en/content/articlehtml/2025/ra/d5ra03102h]
- 45. Applications of Flow Cytometry in Drug Discovery and ... [https://pmc.ncbi.nlm.nih.gov/articles/PMC11011675/]
- 46. Overview of Flow Cytometry [https://www.cellsignal.com/applications/flow-cytometry/flow-cytometry-overview?srsltid=AfmBOorrY4hiFt5014ur81okTx5SYu9UzyBCuEEITcVVY8aA2-1x6zoW]
- 47. Recommended controls for flow cytometry [https://www.abcam.com/en-us/technical-resources/guides/flow-cytometry-guide/recommended-controls-for-flow-cytometry]
- 48. Spectral Flow Cytometry Panel Controls and Sample ... [https://www.thermofisher.com/us/en/home/life-science/cell-analysis/flow-cytometry/flow-cytometry-learning-center/flow-cytometry-resource-library/flow-cytometry-methods/spectral-flow-cytometry-panel-controls-sample-preparation.html]
- 49. Tips on Flow Cytometry Controls [https://www.abacusdx.com/life-science/tips-flow-cytometry-controls/]
- 50. In-vitro Comparison of Cytotoxicity of Two Bioactive ... [https://pmc.ncbi.nlm.nih.gov/articles/PMC3813266/]
- 51. Comparative cytotoxicity of 45S5 bioactive glass and ... [https://www.sciencedirect.com/science/article/pii/S0109564125008206?dgcid=rss_sd_all]
- 52. Comparison of flow cytometry, fluorescence microscopy ... [https://pubmed.ncbi.nlm.nih.gov/25146882/]
- 53. Data analysis in flow cytometry [https://www.abcam.com/en-us/technical-resources/guides/flow-cytometry-guide/data-analysis-in-flow-cytometry]
- 54. A practical guide to evaluating colocalization in biological ... [https://pmc.ncbi.nlm.nih.gov/articles/PMC3074624/]
- 55. Modified Pearson correlation coefficient for two-color imaging ... [https://bmcbioinformatics.biomedcentral.com/articles/10.1186/s12859-018-2444-3]
- 56. Standardization Challenges: How to Compare Your Flow ... [https://www.thermofisher.com/blog/behindthebench/standardization-challenges-how-to-compare-flow-cytometry-data-across-experiments/]
- 57. An open access, machine learning pipeline for high- ... [https://pmc.ncbi.nlm.nih.gov/articles/PMC9792532/]
- 58. High throughput morphological screening identifies ... [https://stemcellres.biomedcentral.com/articles/10.1186/s13287-025-04206-8]
- 59. Evaluating cell viability assessment techniques: a comparative ... [https://pubmed.ncbi.nlm.nih.gov/41044769/]
- 60. Flow Cytometry vs. Fluorescence Microscopy [https://www.news-medical.net/life-sciences/Flow-Cytometry-vs-Fluorescence-Microscopy.aspx]