Flow Cytometry vs. Fluorescence Microscopy for Cell Viability: A Researcher's Guide to Techniques, Applications, and Data Accuracy
This article provides a comprehensive comparative analysis of flow cytometry (FCM) and fluorescence microscopy (FM) for cell viability assessment, tailored for researchers, scientists, and drug development professionals.
Flow Cytometry vs. Fluorescence Microscopy for Cell Viability: A Researcher's Guide to Techniques, Applications, and Data Accuracy
Abstract
This article provides a comprehensive comparative analysis of flow cytometry (FCM) and fluorescence microscopy (FM) for cell viability assessment, tailored for researchers, scientists, and drug development professionals. It covers foundational principles, methodological protocols, and specific applications, including the use of multiparametric staining in FCM to distinguish apoptosis from necrosis. The content addresses common troubleshooting scenarios and presents recent validation studies, such as those involving particulate biomaterials, which demonstrate a strong correlation between techniques (r=0.94) while highlighting FCM's superior precision under high cytotoxic stress. The goal is to equip professionals with the knowledge to select the optimal method, optimize their workflows, and accurately interpret viability data for robust preclinical evaluation.
Core Principles: How Flow Cytometry and Fluorescence Microscopy Work
Fluorescence microscopy is an indispensable imaging technique in biological research that provides unparalleled insights into cellular structures and functions. By utilizing the properties of fluorophores—chemical compounds that re-emit light upon excitation—this technology enables specific labeling and visualization of cellular components with dramatically improved contrast compared to conventional light microscopy [1]. For researchers and drug development professionals evaluating cell viability, fluorescence microscopy offers the unique advantage of preserving spatial context, allowing direct observation of cell morphology, subcellular localization, and cell-cell interactions within their native microenvironment [2]. This capability stands in contrast to flow cytometry, which, while offering superior throughput and statistical power, sacrifices spatial information in favor of quantitative population data [2]. This guide examines how fluorescence microscopy functions alongside flow cytometry as complementary tools in cell viability assessment, exploring their respective strengths, limitations, and optimal applications in biomedical research.
Fundamental Principles and Instrumentation
Fluorescence microscopy operates on the principle of exciting fluorophores with specific wavelengths of light and detecting their emitted light at longer wavelengths. The core components include an excitation light source (historically mercury or xenon arc-lamps, now largely replaced by LEDs and lasers), a filter turret containing excitation filters, dichroic mirrors, and emission filters that selectively separate excitation and emission light, an objective lens to focus light and collect signals, and a detector to capture the resulting image [1].
Two primary implementations dominate modern laboratories: widefield and confocal microscopy. Widefield microscopy illuminates the entire sample volume homogeneously, capturing signals from all focal planes simultaneously. This approach provides brighter images with faster acquisition speeds, making it suitable for live-cell imaging and high-throughput screening, but suffers from out-of-focus light that can reduce image clarity [1] [3]. Confocal microscopy employs a laser beam focused to a specific depth within the sample, combined with a pinhole to physically block out-of-focus light. This optical sectioning capability produces sharper images with higher resolution and enables three-dimensional reconstruction, though at the cost of increased acquisition time, phototoxicity, and instrument expense [1] [3].
Figure 1: Complementary analytical strengths of fluorescence microscopy and flow cytometry in biological research.
Comparative Performance Analysis: Fluorescence Microscopy vs. Flow Cytometry
Throughput and Statistical Power
Flow cytometry demonstrates clear superiority in analysis speed, capable of processing tens of thousands of cells per second compared to the much lower throughput of imaging systems [2]. This high-throughput capability provides greater statistical power for detecting rare cell populations and analyzing large sample sizes, making it ideal for extensive screening applications and clinical diagnostics where quantitative data from millions of cells is required [2].
Information Content and Spatial Context
Fluorescence microscopy excels in information richness, preserving spatial relationships and morphological details that flow cytometry inherently destroys through cell suspension. Imaging techniques enable researchers to analyze subcellular localization, track protein translocation (such as transcription factor movement into the nucleus), observe cell-cell interactions, and assess complex morphological changes—capabilities impossible with standard flow cytometry [2].
Precision and Sensitivity in Cell Viability Assessment
Recent comparative studies reveal important distinctions in how these techniques perform in viability assessment. A 2025 cytotoxicity study comparing fluorescence microscopy and flow cytometry for evaluating Bioglass 45S5 on SAOS-2 osteoblast-like cells found that while both techniques confirmed the same trends (smaller particles and higher concentrations caused greater cytotoxicity), flow cytometry demonstrated superior precision, particularly under high cytotoxic stress [4]. The correlation between methods was strong (r = 0.94, R² = 0.8879, p < 0.0001), but flow cytometry provided more sensitive detection of viability reduction—measuring 0.2% viability at 3 hours for <38μm particles at 100 mg/mL compared to 9% viability measured by fluorescence microscopy under identical conditions [4].
Photobleaching and Technical Limitations
A significant challenge in fluorescence microscopy is photobleaching—the photochemical degradation of fluorophores that causes fluorescence signal loss over time. Research has demonstrated that photobleaching follows first-order reaction kinetics with spatially heterogeneous rate constants that can vary within the same cell [5]. This phenomenon creates experimental barriers to accurate quantification and requires careful optimization of excitation light intensity and exposure times. Flow cytometry minimizes this concern through rapid analysis of individual cells with brief light exposure [5].
Table 1: Direct comparison of technical capabilities between fluorescence microscopy and flow cytometry
| Feature | Fluorescence Microscopy | Flow Cytometry |
|---|---|---|
| Throughput | Low to medium (1-100 events/sec) [2] | High (10,000+ events/sec) [2] |
| Spatial Context | Preserved [2] | Lost [2] |
| Information Gained | Phenotype, morphology, subcellular localization, cell-cell interactions [2] | Phenotype, cell count, protein expression level [2] |
| Viability Measurement Precision | Lower precision under high cytotoxic stress [4] | Superior precision, especially under high cytotoxic stress [4] |
| Photobleaching Concerns | Significant concern requiring optimization [5] | Minimal concern due to rapid analysis |
| Best Applications | Rare event analysis, morphological assessment, spatial studies [2] | High-throughput screening, population analysis, cell sorting [2] |
Experimental Protocols for Cell Viability Assessment
Fluorescence Microscopy Viability Protocol
A standardized approach for viability assessment via fluorescence microscopy typically employs double-staining with fluorescent dyes that distinguish live and dead cells based on membrane integrity:
- Cell Preparation: Plate cells on appropriate imaging chambers and apply experimental treatments. For adhesive cells, ensure 60-80% confluence at time of analysis.
- Staining Solution Preparation: Prepare a working solution containing 1-2μM Calcein-AM and 1-2μg/mL Propidium Iodide (PI) in cell culture medium or buffer. Calcein-AM is membrane-permeant and converted to green-fluorescent calcein by intracellular esterases in viable cells, while PI only enters cells with compromised membranes, producing red fluorescence in dead cells.
- Staining Incubation: Replace culture medium with staining solution and incubate for 15-30 minutes at 37°C protected from light.
- Image Acquisition: Image using standard FITC (Calcein) and TRITC (PI) filter sets. Capture multiple representative fields for statistical relevance.
- Analysis: Quantify viable (Calcein-positive) and non-viable (PI-positive) cells manually or using automated image analysis software. Calculate viability percentage as (viable cells/total cells) × 100.
Flow Cytometry Viability Protocol
Flow cytometry offers a more automated approach for viability assessment:
- Cell Harvesting: Collect cells and prepare single-cell suspension. For adherent cells, use gentle enzymatic detachment to minimize membrane damage.
- Staining: Resuspend approximately 1×10⁶ cells/mL in staining solution containing 1μg/mL PI. Alternative stains such as 7-AAD or DAPI may be used depending on laser configuration.
- Incubation: Incubate for 5-15 minutes at room temperature protected from light.
- Acquisition: Analyze samples on flow cytometer, collecting a minimum of 10,000 events per sample. Set appropriate gates to exclude debris and aggregates based on forward and side scatter properties.
- Analysis: Determine viability percentage by quantifying PI-negative (viable) versus PI-positive (non-viable) populations.
Table 2: Comparison of cell viability assessment methods and performance characteristics
| Method | Principle | Viability Stains | Precision (CV%) | Linearity (r value) | Reference |
|---|---|---|---|---|---|
| Fluorescence Microscopy | Membrane integrity visualization | FDA/PI, Calcein-AM/PI | Varies with sampling | >0.99 | [4] [6] |
| Flow Cytometry | Quantitative population analysis | Propidium Iodide, 7-AAD | 2.0-6.2% | >0.99 | [6] |
| Automated Microscopic Cell Counter | Microchip-based counting | Propidium Iodide | 2.0-6.2% | >0.99 | [6] |
| Manual Trypan Blue | Dye exclusion hemocytometer | Trypan Blue | 4.3-37.2% | >0.99 | [6] |
Figure 2: Experimental workflow for cell viability assessment comparing fluorescence microscopy and flow cytometry pathways.
Research Reagent Solutions for Cell Viability Assays
Table 3: Essential reagents and their functions in viability assessment
| Reagent | Function | Application |
|---|---|---|
| Propidium Iodide (PI) | DNA intercalating dye excluded by intact membranes; labels dead cells [4] [6] | Flow cytometry, fluorescence microscopy |
| Calcein-AM | Cell-permeant esterase substrate converted to fluorescent product in viable cells [4] | Fluorescence microscopy |
| FDA (Fluorescein Diacetate) | Cell-permeant substrate hydrolyzed to fluorescent fluorescein in live cells [4] | Fluorescence microscopy |
| Annexin V-FITC | Binds phosphatidylserine exposed during apoptosis [4] | Flow cytometry (apoptosis detection) |
| Hoechst Stains | Cell-permeant DNA dyes for nuclear staining [4] | Fluorescence microscopy |
| Trypan Blue | Vital dye excluded by cells with intact membranes [6] | Brightfield microscopy, manual counting |
| Dual Staining Kits | Combined dyes for simultaneous live/dead detection | Both techniques |
Advanced Fluorescence Microscopy Technologies
Super-Resolution Techniques
Conventional fluorescence microscopy is limited by diffraction to approximately 200-300 nm laterally and 500-700 nm axially [7]. Super-resolution techniques, including STED (Stimulated Emission Depletion), STORM (Stochastic Optical Reconstruction Microscopy), and PALM (Photoactivated Localization Microscopy), overcome this barrier to achieve nanometer-scale resolution [7]. These methods employ sophisticated illumination patterns or single-molecule localization to resolve cellular structures below the traditional diffraction limit, enabling visualization of previously unresolvable subcellular details [7].
Automated Fluorescence Microscopy Systems
Recent technological advances have led to the development of automated microscopic cell counters that combine the imaging capabilities of fluorescence microscopy with the analytical efficiency of flow cytometry. These systems utilize microchip-based technology and automated image analysis to provide rapid, precise viability measurements with coefficients of variation between 2.0-6.2%, outperforming manual trypan blue exclusion methods which show CVs of 4.3-37.2% [6].
Fluorescence microscopy and flow cytometry represent complementary rather than competing technologies in cell viability assessment and broader biological research. The optimal choice depends squarely on the specific research question: fluorescence microscopy excels when spatial context, morphological detail, and subcellular information are paramount, while flow cytometry provides superior statistical power, throughput, and precision for population-level studies [2]. For comprehensive research programs, an integrated approach leveraging both technologies often yields the most complete understanding—using flow cytometry for initial high-throughput screening followed by fluorescence microscopy for detailed investigation of specific populations or phenomena [2]. As both technologies continue to evolve, particularly with advancements in super-resolution imaging and automated analysis, their synergistic application will undoubtedly drive further innovations in drug development and basic biological research.
Flow cytometry (FCM) and fluorescence microscopy (FM) are cornerstone techniques for assessing cell viability, a critical step in preclinical biomaterial evaluation and drug development. While both methods utilize fluorescent staining to distinguish between live and dead cells, their underlying principles, capabilities, and applications differ significantly [4]. This guide provides an objective comparison of their performance, supported by experimental data, within the broader context of cell viability assessment research.
Experimental Comparison: Flow Cytometry vs. Fluorescence Microscopy
A direct comparative study investigating the cytotoxicity of particulate Bioglass 45S5 (BG) on SAOS-2 osteoblast-like cells offers quantitative data for a head-to-head performance analysis [4] [8]. The experimental design exposed cells to BG particles of different sizes (< 38 µm, 63–125 µm, and 315–500 µm) and concentrations (25, 50, and 100 mg/mL) for 3 and 72 hours.
The table below summarizes the key experimental protocols used in this comparative study.
| Aspect | Fluorescence Microscopy (FM) Protocol | Flow Cytometry (FCM) Protocol |
|---|---|---|
| Staining Method | FDA (fluorescein diacetate) and PI (propidium iodide) [4] [8] | Multiparametric: Hoechst, DiIC1, Annexin V-FITC, and PI [4] [8] |
| Analysis Output | Visual distinction between viable (FDA+) and nonviable (PI+) cells [4] | Quantitative classification into viable, early apoptotic, late apoptotic, and necrotic populations [4] [8] |
| Key Differentiator | Direct imaging of cells; qualitative to semi-quantitative [4] | High-throughput, quantitative single-cell analysis without spatial context [4] [9] |
The core findings of the study, highlighting the performance differences of the two techniques, are summarized in the table below.
| Performance Metric | Fluorescence Microscopy (FM) | Flow Cytometry (FCM) |
|---|---|---|
| Reported Viability (< 38 µm, 100 mg/mL, 3h) | 9% viability [4] [8] | 0.2% viability [4] [8] |
| Sensitivity & Resolution | Lower sensitivity; can miss subtle viability changes and subtypes of cell death [4] | Superior sensitivity and precision, especially under high cytotoxic stress [4] [8] |
| Cell Death Pathway Insight | Dichotomous live/dead classification [4] | Distinguishes early apoptosis, late apoptosis, and necrosis [4] [8] |
| Throughput & Statistical Power | Lower throughput; analysis of limited fields of view can lead to sampling bias [4] | High-throughput; analyzes thousands of cells rapidly for robust statistics [4] [9] |
| Data Correlation | Strong correlation with FCM data (r = 0.94, R² = 0.8879, p < 0.0001) [4] | Strong correlation with FM data, validating overall trends [4] |
Technical Foundations and Advanced Capabilities
The performance differences stem from the fundamental operational principles of each technology.
Fluorescence Microscopy relies on illuminating the entire sample with light of a specific wavelength to excite fluorescent dyes. The emitted light is captured through an objective lens to create an image, allowing for the direct visualization of cells and their location [4] [10]. However, its resolution is limited by diffraction, and it is susceptible to photobleaching and phototoxicity. In the context of particulate biomaterials, autofluorescence and light scattering from the material itself can significantly inhibit fluorescence imaging and accurate analysis [4].
Flow Cytometry is a high-throughput technique that analyzes single cells in suspension as they pass individually through a laser beam. As each cell intersects the laser, it scatters light and may emit fluorescence from attached probes or intrinsic molecules [4] [9]. The instrument captures this information for multiple parameters per cell.
- Light Scatter: Forward scatter (FSC) correlates with cell size, and side scatter (SSC) correlates with cell granularity and internal complexity [11] [9].
- Fluorescence Detection: Fluorochrome-conjugated antibodies and dyes are used to detect highly specific biological markers. In conventional flow cytometry, optical filters direct specific wavelength ranges to dedicated detectors, and a mathematical process called compensation corrects for fluorescent spillover between channels [11] [9] [12].
- Spectral Flow Cytometry: An advanced evolution of the technology, spectral flow cytometry captures the full emission spectrum of every fluorophore across a wide range of wavelengths instead of just the peak emission. A process called unmixing then uses the unique spectral signature of each fluorophore to distinguish them, allowing for the use of more fluorophores simultaneously and the ability to separate cellular autofluorescence as a distinct parameter [9] [12].
The following diagram illustrates the core analytical workflow of a flow cytometer.
The Scientist's Toolkit: Essential Research Reagents
The choice of fluorescent reagents is critical for a successful experiment. The table below details key reagents used in the cited study and their functions.
| Reagent | Function / Target | Application in Cell Death Analysis |
|---|---|---|
| Propidium Iodide (PI) | DNA intercalator, membrane-impermeant [4] [8] | Labels necrotic cells or cells with compromised membranes [4] [8] |
| Annexin V-FITC | Binds to phosphatidylserine (PS) [4] [8] | Marks early apoptotic cells where PS is externalized [4] [8] |
| Hoechst Dye | Cell-permeant DNA stain [4] | Used as a general nuclear stain for cell identification and viability [4] |
| DiIC1 | Mitochondrial membrane potential sensor [4] | Assesses mitochondrial health, lost in apoptosis [4] |
| FDA | Enzyme substrate converted to fluorescent fluorescein [4] | Labels metabolically active (viable) cells [4] |
Experimental Workflow: From Sample to Insight
A typical comparative experiment for cell viability assessment follows a structured pathway, as visualized in the workflow below.
Analytical Approach: From Raw Data to Biological Insight
Once data is acquired, the analytical approach differs between the two techniques, with flow cytometry offering a more complex, multi-step gating strategy to resolve fine cellular details.
The selection of an appropriate analytical technique is a critical step in the design of cell viability assessment experiments. In biomedical research, flow cytometry (FCM) and fluorescence microscopy (FM) stand as two cornerstone methods for evaluating cellular health and function. While both techniques leverage fluorescent probes to distinguish between live, apoptotic, and dead cells, they diverge significantly in their operational principles, data output, and application suitability. This guide provides an objective, data-driven comparison of flow cytometry and fluorescence microscopy, focusing on their performance in cell viability assessment to inform researchers and drug development professionals in selecting the optimal tool for their specific experimental needs.
Experimental Protocols for Cell Viability Assessment
Flow Cytometry Protocol
Flow cytometry offers a high-throughput, quantitative approach for analyzing cell populations in suspension. A detailed protocol from a 2025 comparative study illustrates a multiparametric staining procedure designed to distinguish various cell states [13].
Sample Preparation: Cells are first dissociated into a single-cell suspension. For tissues, such as osteochondral grafts, this requires enzymatic digestion using reagents like pronase and type II collagenase to isolate individual cells [14].
Staining: The cell suspension is divided into aliquots and incubated with a panel of fluorescent probes:
- Hoechst: Stains DNA, identifying all nucleated cells.
- DiIC1: A lipophilic dye that accumulates in the mitochondria of live, metabolically active cells.
- Annexin V-FITC: Binds to phosphatidylserine exposed on the outer leaflet of the cell membrane during early apoptosis.
- Propidium Iodide (PI): A membrane-impermeant dye that enters cells with compromised plasma membranes, staining the DNA of necrotic or late apoptotic cells [13].
Acquisition and Analysis: The stained cell suspension is hydrodynamically focused and passed through a flow cytometer (e.g., BD LSR Fortessa). As each cell intersects one or more laser beams, light scattering and fluorescence emissions are detected. The resulting data is analyzed using specialized software (e.g., FACS Diva) to quantify the percentages of viable (Hoechst+/DiIC1+), early apoptotic (Annexin V+/PI-), late apoptotic (Annexin V+/PI+), and necrotic (Annexin V-/PI+) populations [13].
Fluorescence Microscopy Protocol
Fluorescence microscopy provides visual confirmation of cell viability and preserves spatial information, making it suitable for adherent cell cultures and complex structures.
Staining: Adherent cells or tissue fragments are incubated with a live/dead stain. A common combination is:
- Calcein AM: A cell-permeant compound converted by intracellular esterases into a green-fluorescent product, labeling viable cells.
- 7-AAD or Propidium Iodide (PI): Membrane-impermeant dyes that label the DNA of dead cells with red fluorescence [14] [13]. For instance, cartilage fragments can be incubated with Calcein AM followed by 7-AAD with gentle stirring [14].
Image Acquisition: Stained samples are imaged using a fluorescence microscope (e.g., a Leica TCS SP5 confocal microscope). Confocal microscopy is often preferred as it reduces background noise and enables optical sectioning of thicker samples [14].
Image Analysis: The acquired images are analyzed using software, which may involve a custom macro to count the number of calcein-positive (live) and 7-AAD-positive (dead) cells. The viability percentage is calculated as (Number of Live Cells / Total Number of Cells) × 100% [14].
Comparative Performance Data
Direct comparative studies reveal significant differences in the performance and output of FCM and FM. A 2025 study on osteoblast-like cells treated with bioactive glass particles provided quantitative data on how these techniques compare under identical experimental conditions [13].
| Condition | Time | Viability by FM (%) | Viability by FCM (%) |
|---|---|---|---|
| Control | 72 h | >97 | >97 |
| <38 μm BG, 100 mg/mL | 3 h | 9 | 0.2 |
| <38 μm BG, 100 mg/mL | 72 h | 10 | 0.7 |
Despite the stark difference in absolute values, the study found a strong correlation (r=0.94) between the results from both methods, confirming that both reliably capture trends of increasing cytotoxicity with smaller particle sizes and higher concentrations. However, flow cytometry demonstrated superior precision, especially under high cytotoxic stress, and its ability to distinguish early and late apoptosis from necrosis provided a more nuanced view of cell death mechanisms [13].
Another study on chondrocyte viability in osteochondral allografts reported a similar discrepancy, with confocal fluorescence microscopy showing 83.7% viability versus 55.8% measured by flow cytometry at week three of preservation. The authors suggested that the microscopy approach might be more advantageous and correlate better with actual cell viability in a 3D tissue context, as it does not require enzymatic digestion which could itself damage cells [14].
Key Differences in Technique Characteristics
The following table summarizes the core operational differences between flow cytometry and fluorescence microscopy that influence their application in research.
| Feature | Flow Cytometry | Fluorescence Microscopy |
|---|---|---|
| Throughput | High (10,000+ events/second) [2] | Low to medium (1-100 events/second) [2] |
| Data Type | Quantitative, multi-parametric single-cell data | Quantitative intensity & qualitative spatial data |
| Spatial Context | Lost | Preserved (subcellular location, morphology) [2] [15] |
| Sample Requirement | Single-cell suspension [15] [16] | Adherent cells, tissues, or suspensions |
| Cell State After Analysis | Often non-viable (destructive) [16] | Can remain viable (non-destructive) [16] |
| Key Advantage | Statistical power from large cell numbers | Visual assurance and morphological insight [16] |
| Major Limitation | No visualization, requires dissociation | Lower throughput, potential for observer bias [13] |
Essential Research Reagent Solutions
The following table lists key reagents and their functions for cell viability assays in both flow cytometry and fluorescence microscopy, as cited in the experimental protocols.
| Reagent | Function | Typical Application |
|---|---|---|
| Calcein AM | Viability stain; metabolized by esterases in live cells to emit green fluorescence. | FM, FCM |
| Propidium Iodide (PI) | Dead cell stain; enters cells with compromised membranes, intercalates into DNA (red fluorescence). | FM, FCM |
| 7-AAD | Dead cell stain; alternative to PI, binds DNA of dead cells (far-red fluorescence). | FM, FCM |
| Annexin V (e.g., FITC conjugate) | Apoptosis detection; binds to phosphatidylserine exposed on the cell surface during early apoptosis. | FCM |
| Hoechst Stains | DNA stain; labels all nucleated cells, used for cell identification and counting. | FCM |
| DiIC1 | Mitochondrial stain; accumulates in active mitochondria of viable cells. | FCM |
| Pronase / Collagenase | Enzymatic digestion; breaks down extracellular matrix to create single-cell suspensions from tissues. | FCM (sample prep) |
Visualizing Workflow and Data Relationships
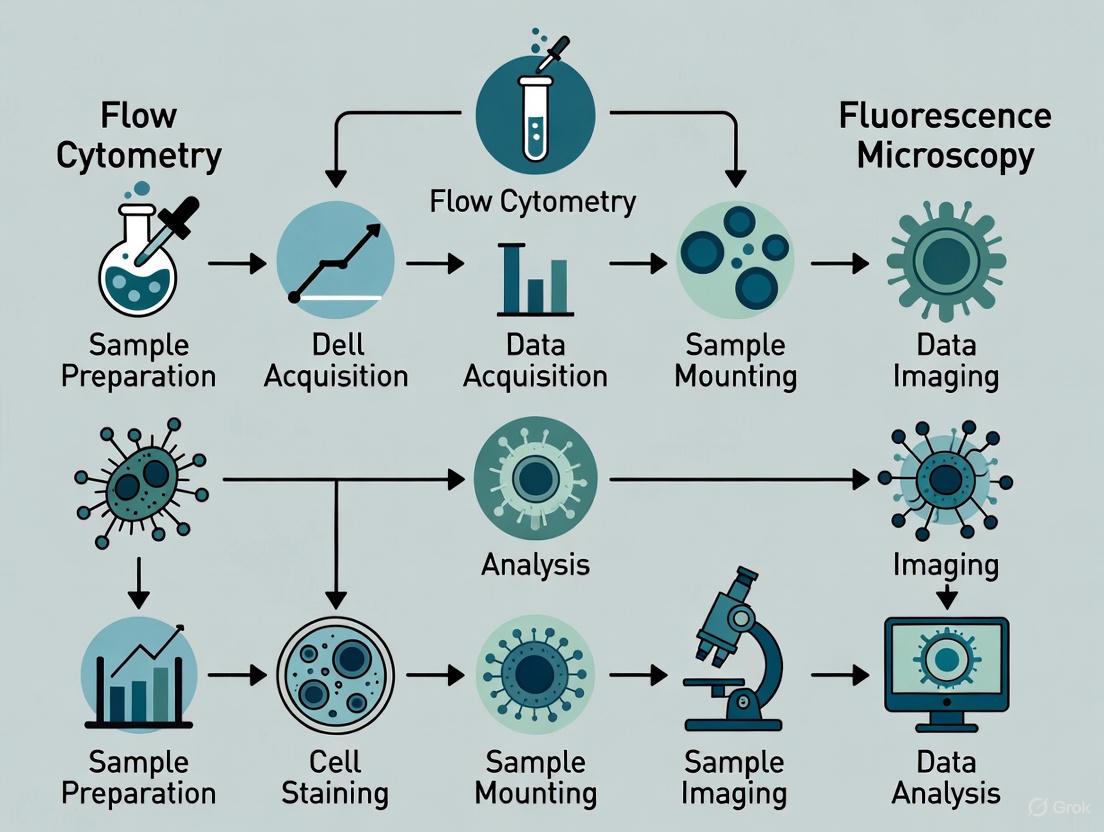
The diagrams below illustrate the fundamental workflows for fluorescence microscopy and flow cytometry, highlighting the logical progression from sample preparation to data output.
Fluorescence Microscopy Workflow
Flow Cytometry Workflow
Flow cytometry and fluorescence microscopy are not mutually exclusive but rather complementary techniques. The choice between them should be dictated by the specific research question. Flow cytometry is the tool of choice when the experimental goal requires high-throughput, statistically robust quantification of cell populations and the discrimination of subtle cell death pathways, such as in large-scale drug screening [13]. Conversely, fluorescence microscopy is indispensable when the preservation of spatial, morphological, and subcellular information is paramount, or when analyzing cells in their native, adherent state or within complex 3D structures [14] [16].
For the most comprehensive understanding, a synergistic approach is often most powerful. Flow cytometry can be used for an initial high-throughput screen to identify populations of interest, which can then be isolated and investigated in greater morphological detail using fluorescence microscopy [2]. By understanding the distinct capabilities and limitations of each method, researchers can make an informed decision that optimizes experimental outcomes in cell viability assessment.
The field of cell analysis has long been shaped by two powerful, yet distinct, technologies: flow cytometry and fluorescence microscopy. Flow cytometry excels in high-throughput, quantitative analysis of thousands of cells per second, providing robust statistical data on protein expression and cell populations [2]. Conversely, fluorescence microscopy offers detailed visualization of cellular morphology, subcellular localization, and spatial relationships between cellular components, but at a much lower throughput [15]. The emergence of imaging flow cytometry represents a pivotal hybridization of these two methodologies, combining the statistical power of flow cytometry with the rich morphological context of microscopy [17] [18]. This technological synergy is particularly transformative for cell viability assessment research, where understanding not just the percentage of live cells but also the morphological cues of cell death is crucial. By capturing high-resolution images of individual cells in flow at high speeds, imaging flow cytometry enables researchers to quantify cell populations while visually confirming processes like apoptosis and necrosis based on structural changes [19] [8].
Technological Evolution: From Conventional Flow Cytometry to Imaging Flow Cytometry
The Principles of Imaging Flow Cytometry
Imaging flow cytometry (ImFC) operates on the fundamental principle of merging the hydraulic system of a conventional flow cytometer with advanced camera technology [17]. Cells in suspension are hydrodynamically focused into a single-file stream and passed through one or more laser interrogation points, similar to traditional flow cytometry. However, unlike conventional systems that only measure total fluorescence intensity and light scatter, ImFC incorporates a camera—often using time-delay integration (TDI)—to capture multichannel images of each cell as it flows through the system [18]. These typically include brightfield, darkfield (side scatter), and multiple fluorescence channels, providing both spectral and spatial information for every cell analyzed [17] [18].
The first commercial imaging flow cytometers emerged in the early 2000s, with systems like the ImageStream (originally developed by Amnis Corporation, now under Luminex) revolutionizing the field by offering up to 12 images per cell at rates of up to 5,000 cells per second [17] [18]. Current systems can capture images at different magnifications (20X, 40X, 60X) with pixel resolutions as fine as 0.3 µm, enabling detailed analysis of subcellular structures and processes [18].
Throughput Advancements: Pushing the Speed Boundary
A significant challenge in ImFC development has been balancing spatial resolution with analysis throughput. While early commercial systems achieved speeds of approximately 1,000-5,000 events per second, recent technological breakthroughs have dramatically increased this capability.
Table 1: Evolution of Imaging Flow Cytometry Throughput
| Technology Generation | Approximate Throughput | Spatial Resolution | Key Technological Features |
|---|---|---|---|
| Early Commercial Systems | 1,000-5,000 eps | ~0.3-1.0 µm | CCD cameras, TDI imaging, hydrodynamic focusing |
| Optofluidic Time-Stretch (OTS) IFC | 10,000-100,000 eps | ~1.4 µm | Optical time-stretch imaging, faster data processing |
| Advanced OTS-IFC (2025) | >1,000,000 eps | 780 nm | 80-MHz laser source, 10 GS/s ADC, advanced FPGA processing [20] |
| FLIM Flow Cytometry | >10,000 eps | 0.8 µm | Fluorescence lifetime imaging, intensity-modulated beam arrays [21] |
Notably, a 2025 study demonstrated ImFC with real-time throughput exceeding 1,000,000 events per second by integrating optical time-stretch imaging, advanced microfluidics, and online image processing, achieving sub-micron resolution while maintaining unprecedented speed [20]. This represents more than a 100-fold improvement over earlier systems and opens new possibilities for large-scale cell population analysis.
Comparative Performance Analysis: Imaging Flow Cytometry vs. Alternative Technologies
Direct Comparison with Conventional Flow Cytometry and Fluorescence Microscopy
Understanding the relative strengths and limitations of each technology is essential for selecting the appropriate tool for cell viability assessment and other applications.
Table 2: Technology Comparison for Cell Analysis
| Feature | Conventional Flow Cytometry | Imaging Flow Cytometry | Fluorescence Microscopy |
|---|---|---|---|
| Throughput | High (10,000+ events/sec) [2] | Medium to High (1-5,000 eps, up to 1,000,000+ with advanced systems) [2] [20] | Low (tens to hundreds of cells) [15] |
| Spatial Information | Lost [2] | Preserved (subcellular resolution) [17] [18] | Preserved (subcellular to super-resolution) [15] |
| Data Type | Quantitative fluorescence intensity [2] | Quantitative fluorescence intensity + morphology [18] | Quantitative + qualitative imaging [15] |
| Cell Viability Assessment | Multiparametric staining (viable, apoptotic, necrotic) [4] [8] | Multiparametric staining + morphological confirmation [19] [8] | Basic live/dead staining with visual assessment [4] [8] |
| Strengths | High-speed quantification, cell sorting, statistical power [2] | High-content screening, rare event detection, spatial context [17] [18] | Detailed structural analysis, temporal monitoring, cellular interactions [15] |
| Limitations | No spatial context, limited morphological data [2] | Higher data storage needs, complex analysis [17] | Low throughput, manual analysis, potential sampling bias [4] |
Experimental Evidence in Cell Viability Assessment
A comprehensive 2025 comparative study directly evaluated flow cytometry and fluorescence microscopy for assessing cytotoxicity of particulate bioactive glass on SAOS-2 osteoblast-like cells, providing robust experimental data relevant to imaging flow cytometry [4] [8].
Experimental Protocol:
- Cell Line: SAOS-2 osteoblast-like cells
- Test Material: Bioglass 45S5 particles in three size ranges (<38 µm, 63-125 µm, 315-500 µm) at concentrations of 25, 50, and 100 mg/mL
- Exposure Time: 3 hours and 72 hours
- Viability Staining:
- Fluorescence Microscopy: FDA/PI staining to distinguish viable (green) and nonviable (red) cells
- Flow Cytometry: Multiparametric staining with Hoechst (DNA), DiIC1 (membrane potential), Annexin V-FITC (apoptosis), and PI (necrosis)
- Analysis: Both techniques assessed cell viability under identical experimental conditions [4] [8]
Key Findings:
- Both techniques confirmed size-dependent and concentration-dependent cytotoxicity
- Smaller particles (<38 µm) at higher concentrations (100 mg/mL) showed greatest cytotoxicity
- Strong correlation between FM and FCM data (r = 0.94, R² = 0.8879, p < 0.0001)
- Flow cytometry demonstrated superior precision, particularly under high cytotoxic stress
- FM reported viability of 9% (3h) and 10% (72h) for <38 µm particles at 100 mg/mL
- FCM reported more extreme viability reduction to 0.2% (3h) and 0.7% (72h) for same conditions [4] [8]
This study highlights a critical advantage of flow-based techniques: their ability to provide more sensitive detection of cytotoxicity and distinguish between early apoptosis, late apoptosis, and necrosis through multiparametric staining [4] [8]. Imaging flow cytometry builds upon this foundation by adding morphological validation of these cell death states.
Diagram 1: Experimental workflow for cell viability assessment comparing different technologies.
Key Applications and Methodologies in Imaging Flow Cytometry
Research Applications and Reagent Solutions
Imaging flow cytometry has enabled advanced applications across multiple research domains by providing both quantitative and spatial information:
Table 3: Key Research Applications and Required Reagents
| Application | Research Purpose | Essential Reagents & Solutions | Function in Experiment |
|---|---|---|---|
| Cell Viability & Death Mechanisms | Distinguish apoptosis vs. necrosis with morphological confirmation [4] [8] | Annexin V-FITC, PI, Hoechst, DiIC1, Calcein-AM [4] [8] | Apoptosis marker, necrosis marker, DNA content, membrane potential, viability indicator |
| Immune Synapse Formation | Study cell-cell interactions in immune responses [19] | Antibodies to CD3, CD4, CD25, CD127, FoxP3 [18] | T-cell markers, T-reg markers, transcription factor localization |
| Subcellular Localization | Analyze protein translocation (e.g., NF-κB to nucleus) [19] [18] | Phospho-specific antibodies, organelle-specific dyes | Detection of phosphorylation, organelle identification |
| Cell Cycle Analysis | Determine cell cycle phases with morphological context [19] | DNA dyes (DAPI, Hoechst), proliferation markers (Ki-67) | DNA content quantification, proliferation status |
| Virus-Host Interactions | Study viral infection stages [17] | Virus-specific antibodies, cell surface markers | Viral protein detection, host cell identification |
Sample Preparation and Staining Protocol for Immune Cell Analysis
A representative protocol for analyzing regulatory T cells (T-regs) demonstrates the experimental workflow:
- Sample Preparation: Whole blood is lysed to remove red blood cells, and white blood cells are resuspended at high concentration (20-30 million cells/mL) [18].
- Surface Staining: Cells are stained with optimized concentrations of surface marker antibodies (CD45, CD3, CD4, CD25, CD127) in suspension [18].
- Fixation and Permeabilization: Cells are fixed with 2-5% formaldehyde, then permeabilized using detergent (TritonX-100, Nonidet-P40, or Saponin) [18].
- Intracellular Staining: Antibodies against intracellular targets (e.g., FoxP3) are added, followed by careful titration of nuclear dyes [18].
- Data Acquisition: Samples are acquired on the imaging flow cytometer, with laser powers adjusted to maximize signal without saturation [18].
- Compensation: Single-stained controls are used for spectral compensation at the pixel level to account for cross-talk between channels [18].
Advanced Applications and Future Directions
Innovative Applications in Biomedical Research
The unique capabilities of imaging flow cytometry have enabled novel research applications that were previously challenging with either parent technology alone:
- Spatiotemporal Analysis of Calcium Mobilization: Combining the statistical rigor of conventional flow cytometry with microscopic spatial information to observe Ca2+ flux in response to stimuli in T cells [17].
- Mitochondrial Dynamics: Novel, unbiased, high-throughput measurement of mitochondrial fusion activity using specialized imaging and analysis algorithms [17].
- Extracellular Vesicle Analysis: Detailed characterization of EV subset composition, identification of exosomes in circulation, and determination of their functional immunological impact [17].
- Rare Event Detection: Identification and characterization of rare cell populations, such as circulating tumor cells or stem cells, with both quantitative and morphological validation [17] [19].
- Protein-Protein Interactions: Proximity ligation imaging cytometry enables high-resolution detection and quantification of protein-protein interactions and post-translational modifications at single-cell level, even in rare cell populations [17].
The Impact of Artificial Intelligence and Future Developments
The significant data generation from imaging flow cytometry (hundreds of features per cell) has driven the adoption of artificial intelligence and machine learning for analysis [17] [19] [18]. These computational approaches enable:
- Automated classification of cell types and states based on morphological features
- Identification of subtle patterns not discernible by human observation
- High-content screening applications for drug discovery
- Integration with other omics data for comprehensive cell profiling
Future developments focus on increasing analytical capabilities while addressing current limitations in data management and analysis. The integration of fluorescence lifetime imaging (FLIM) into flow cytometry represents a particularly promising advancement, providing additional environmental information about cellular conditions independent of fluorophore concentration [21].
Diagram 2: Key technological aspects and applications of imaging flow cytometry.
Imaging flow cytometry has emerged as a transformative hybrid technology that successfully bridges the gap between the high-throughput analytical power of flow cytometry and the detailed morphological information provided by fluorescence microscopy. For cell viability assessment and beyond, this integration enables researchers to not only quantify cellular responses but also visually validate and characterize them at single-cell resolution. The technology continues to evolve, with recent breakthroughs achieving unprecedented throughput exceeding 1,000,000 events per second while maintaining submicron resolution [20]. As artificial intelligence and advanced computational methods become increasingly integrated with imaging flow cytometry, the technology is poised to become an indispensable tool in both research and clinical settings, driving innovations in biomaterial evaluation, drug discovery, and diagnostic applications [17] [19].
Protocols in Practice: Staining Techniques and Application-Specific Workflows
In the field of biomaterial research and drug development, accurately assessing cell viability is a fundamental requirement for evaluating the biocompatibility and cytotoxic effects of novel compounds and materials. Among the various techniques available, fluorescence microscopy (FM) utilizing Fluorescein Diacetate (FDA) and Propidium Iodide (PI) staining represents a widely accessible standard for live/dead cell distinction. This guide provides an objective comparison of this established FM method against the increasingly utilized flow cytometry (FCF) approach, framing the discussion within the broader context of selecting the most appropriate tool for viability assessment in research applications.
Core Concepts and Staining Mechanisms
The fundamental principle behind many viability assays, including the FDA/PI method, is the assessment of cell membrane integrity. This principle serves as a reliable proxy for cell health, as a compromised plasma membrane is a definitive indicator of cell death [22] [23].
- Viable Cells (FDA Stain): FDA is a non-fluorescent, cell-permeant compound. Once inside a live cell, intracellular esterases cleave it to produce fluorescein, a green-fluorescent compound (Ex/Em ~494/517 nm) that is well-retained by cells with intact membranes, marking them as viable [8] [24].
- Non-Viable Cells (PI Stain): Propidium Iodide (PI) is a red-fluorescent DNA-binding dye (Ex/Em ~535/617 nm) that is impermeant to live cells. It can only enter cells with damaged plasma membranes, binding to nuclear DNA and marking them as dead [24] [23].
This binary distinction provides a clear and immediate snapshot of the viability status within a cell population.
Comparative Experimental Data: FM vs. Flow Cytometry
A direct comparative study investigating the cytotoxicity of Bioglass 45S5 (BG) on SAOS-2 osteoblast-like cells offers robust, quantitative data contrasting FM and flow cytometry (FCM) performance. The study exposed cells to BG particles of varying sizes and concentrations, assessing viability using both FM (with FDA/PI) and FCM (with multiparametric staining including Hoechst, DiIC1, Annexin V-FITC, and PI) under identical conditions [4] [8].
The table below summarizes key viability findings from this study, highlighting the differential outcomes between the two techniques.
Table 1: Cell Viability Assessment by Fluorescence Microscopy vs. Flow Cytometry
| Experimental Condition | Viability by FM (FDA/PI) (%) | Viability by FCM (Multiparametric) (%) |
|---|---|---|
| Control | 88.8 - 91.1 | 97.4 - 97.6 |
| <38 µm [25 mg/ml] | 23.7 - 31.7 | 0.5 - 2.3 |
| <38 µm [50 mg/ml] | 22.1 - 30.2 | 0.2 - 0.5 |
| <38 µm [100 mg/ml] | 9.0 - 10.7 | 0.2 - 0.7 |
| 315-500 µm [25 mg/ml] | 47.9 - 74.9 | 22.6 - 73.1 |
Data adapted from Samuel et al., 2025 [4] [25].
Key Findings from the Data:
- Strong Correlation, Different Sensitivity: The results from both techniques were strongly correlated (r = 0.94), validating FM as a reliable screening tool. However, FCM consistently reported lower viability percentages, particularly under high cytotoxic stress (e.g., small particles at high concentrations), indicating superior sensitivity and a lower threshold for detecting compromised cells [4] [8].
- Dynamic Range and Control Baseline: The viability percentages for the untreated control were notably lower when measured by FM compared to FCM. This suggests that FM might be susceptible to over-estimating cell death in healthy populations, potentially due to limitations in focusing, background fluorescence, or subjective image analysis [4] [25].
- Mechanistic Insight: A critical advantage of the multiparametric FCM approach used in the study was its ability to differentiate stages of cell death, distinguishing viable, early apoptotic, late apoptotic, and necrotic populations. The standard FDA/PI FM assay is generally limited to a binary live/dead classification [4] [8].
Detailed Experimental Protocols
To ensure reproducibility, below are the detailed methodologies for the key experiments cited.
Protocol 1: Fluorescence Microscopy with FDA/PI Staining
This protocol is adapted from the comparative study using Bioglass 45S5 and SAOS-2 cells [4] [8].
- Cell Seeding and Treatment: Seed osteoblast-like cells (e.g., SAOS-2) in culture plates and allow them to adhere. Expose the cells to the test material (e.g., BG particles) at varying concentrations (e.g., 25, 50, 100 mg/mL) and sizes for defined periods (e.g., 3h and 72h).
- Staining Solution Preparation: Prepare a working solution containing FDA and PI in a balanced salt solution or culture medium without serum. Typical final concentrations are in the range of 0.5-10 µg/mL for FDA and 5-20 µg/mL for PI, though optimization is recommended.
- Staining Incubation: After the treatment period, remove the culture medium, gently wash the cells with PBS, and add the FDA/PI working solution. Incubate for 5-20 minutes at 37°C, protected from light.
- Microscopy and Image Acquisition: Remove the staining solution, replace with fresh PBS or medium, and immediately visualize using a fluorescence microscope equipped with appropriate filter sets (e.g., FITC for green fluorescein and TRITC for red PI).
- Image Analysis: Capture multiple random fields of view. Manually or using image analysis software (e.g., ImageJ), count the green (live) and red (dead) cells. Viability is calculated as: (Number of Live Cells / Total Number of Cells) × 100.
Protocol 2: Multiparametric Viability Assessment by Flow Cytometry
This protocol outlines the FCM method used in the comparative study, which provides a more detailed breakdown of cell states [4].
- Cell Harvesting and Staining: After treatment, harvest the cells (including any detached cells, which are often missed in FM) and wash. Resuspend the cell pellet in a binding buffer.
- Multiparametric Staining: Stain the cells with a cocktail of fluorescent probes. The cited study used:
- Hoechst 33342: A cell-permeant blue fluorescent DNA stain that labels all nucleated cells, used for identifying the cellular population.
- DiIC1(5): A carbocyanine dye that accumulates in active mitochondria of live cells, serving as an indicator of mitochondrial membrane potential.
- Annexin V-FITC: Binds to phosphatidylserine (PS), which is externalized to the outer leaflet of the plasma membrane during early apoptosis.
- Propidium Iodide (PI): As in the FM assay, it labels cells with compromised membranes (late apoptosis and necrosis).
- Incubation and Analysis: Incubate the stained cells for 15-20 minutes at room temperature in the dark. Acquire data on a flow cytometer equipped with lasers and filters capable of detecting all the fluorochromes used.
- Gating and Population Analysis: First, gate on the cellular population based on Hoechst staining and side scatter. Then, analyze the cells based on Annexin V and PI signals to distinguish:
- Viable cells: Annexin V-/PI-
- Early Apoptotic cells: Annexin V+/PI-
- Late Apoptotic cells: Annexin V+/PI+
- Necrotic cells: Annexin V-/PI+
Workflow and Signaling Pathways
The following diagram illustrates the experimental workflow and the biological mechanisms detected by the stains in the two compared methods.
Research Reagent Solutions
The table below lists key reagents and their functions in the viability assays discussed.
Table 2: Essential Reagents for Cell Viability Assessment
| Reagent / Kit | Primary Function | Experimental Platform |
|---|---|---|
| Fluorescein Diacetate (FDA) | Substrate for intracellular esterases; marks viable cells (green). | Fluorescence Microscopy |
| Propidium Iodide (PI) | Membrane-impermeant DNA dye; marks dead cells (red). | FM, Flow Cytometry |
| Annexin V-FITC | Binds externalized phosphatidylserine; detects early apoptosis. | Flow Cytometry |
| Hoechst 33342 | Cell-permeant DNA dye; identifies all nucleated cells. | Flow Cytometry |
| DiIC1(5) | Mitochondrial membrane potential sensor; indicates metabolic activity. | Flow Cytometry |
| LIVE/DEAD Viability/Cytotoxicity Kit | Commercial kit containing Calcein AM (live, green) and Ethidium Homodimer-1 (dead, red). | FM, Flow Cytometry, Microplate [24] |
| ReadyProbes Cell Viability Imaging Kit | Commercial kit with NucBlue (all cells) and NucGreen (dead cells). | Fluorescence Microscopy [26] |
The standard FM viability staining with FDA and PI remains a vital and accessible technique for providing a rapid, visual assessment of cell viability, particularly useful for initial screening and confirming cell morphology. However, empirical data from direct comparative studies demonstrates that flow cytometry offers significant advantages in sensitivity, quantitative precision, statistical robustness, and the ability to delineate specific modes of cell death. The choice between these methods should be guided by the specific research question: FM for quick, spatial insights and FCM for high-throughput, in-depth mechanistic studies in particulate biomaterial research and drug development.
Flow cytometry (FCM) and fluorescence microscopy (FM) are foundational techniques for cell viability assessment, yet they differ significantly in their application and capabilities, especially in complex experimental scenarios involving particulate biomaterials. This guide provides a direct comparison of these methodologies, focusing on their performance in discriminating viable, apoptotic, and necrotic cell populations using a multiparametric FCM panel based on Hoechst, Annexin V, and Propidium Iodide (PI). We present supporting experimental data demonstrating that under identical conditions, FCM offers superior quantification, sensitivity, and capacity for subpopulation distinction compared to FM, validating its role as a robust tool for advanced cytocompatibility evaluation.
Assessing cell viability and death mechanisms is a cornerstone of biomedical research and drug development. While fluorescence microscopy (FM) provides valuable spatial information and direct visualization of cells, its limitations in quantitative analysis, throughput, and resolution of complex cell death phenotypes are increasingly recognized [4]. These limitations are particularly pronounced when analyzing cells in the presence of particulate biomaterials, which can produce autofluorescence and light scattering that inhibit precise fluorescence imaging [4].
In contrast, flow cytometry (FCM) enables high-throughput, multiparametric analysis at the single-cell level, bypassing many limitations of microscopy. The power of FCM lies in its ability to simultaneously measure multiple fluorescent signals from each cell, allowing researchers to deconstruct heterogeneous populations into viable, early apoptotic, late apoptotic, and necrotic subsets within a single assay [27] [23]. This guide objectively compares the performance of a specific FCM panel—utilizing Hoechst, Annexin V, and PI—against FM-based approaches, providing experimental data and detailed protocols to inform method selection for advanced cell viability assessment.
Comparative Performance: FCM vs. Fluorescence Microscopy
A direct comparative study investigating the cytotoxicity of Bioglass 45S5 on SAOS-2 osteoblast-like cells provides robust, head-to-head data on the performance of FCM and FM [4]. Both techniques were applied under identical experimental conditions, with cells exposed to particles of different sizes and concentrations.
Key Experimental Findings
- Strong Correlation but Different Sensitivity: The study found a strong overall correlation between FM and FCM data (r = 0.94, R² = 0.8879, p < 0.0001). However, FCM demonstrated superior precision, particularly under high cytotoxic stress [4].
- Revealing Discrepancy in Detection: The most revealing data emerged under high-stress conditions. For the smallest particles (< 38 µm) at the highest concentration (100 mg/mL), FM-assessed viability was 9% at 3 hours and 10% at 72 hours. Strikingly, FCM measurements under the same conditions revealed viabilities of just 0.2% and 0.7%, respectively [4]. This indicates FCM's enhanced sensitivity in detecting rare cell populations and its ability to provide a more accurate picture under extreme cytotoxic challenge.
- Superior Subpopulation Distinction: A key advantage of the multiparametric FCM panel was its ability to distinguish early and late apoptosis from necrosis, a distinction that is challenging to achieve reliably with standard FM [4].
Table 1: Direct Comparison of Cell Viability Assessment by Fluorescence Microscopy vs. Flow Cytometry
| Parameter | Fluorescence Microscopy (FM) | Flow Cytometry (FCM) |
|---|---|---|
| Viability Stains Used | FDA (live) & PI (dead) [4] | Multiparametric: Hoechst, DiIC1, Annexin V-FITC, PI [4] |
| Reported Viability (<38µm, 100 mg/mL, 3h) | 9% [4] | 0.2% [4] |
| Reported Viability (<38µm, 100 mg/mL, 72h) | 10% [4] | 0.7% [4] |
| Statistical Correlation | Strong correlation with FCM (r=0.94) [4] | Strong correlation with FM (r=0.94) [4] |
| Subpopulation Distinction | Limited to live/dead | Can distinguish viable, early apoptotic, late apoptotic, and necrotic populations [4] |
| Throughput & Quantification | Lower throughput; manual counting or image analysis can undermine precision [4] | High-throughput; provides rapid, quantitative single-cell analysis [4] |
| Influence of Particulate Biomaterials | Imaging can be impeded by background autofluorescence and light scattering from materials [4] | Potential to overcome imaging issues by analyzing large cell numbers [4] |
Advantages and Limitations of Each Technique
Table 2: Inherent Advantages and Limitations of FM and FCM for Viability Assessment
| Aspect | Fluorescence Microscopy (FM) | Flow Cytometry (FCM) |
|---|---|---|
| Primary Strengths | Direct visual representation and spatial context of cells [4]. | High-throughput, quantitative data from thousands of cells [4]. Superior precision in multiparametric analysis [4]. |
| Key Limitations | Susceptible to observer bias; lower throughput; difficult to distinguish apoptosis from necrosis [4]. Background interference from particulate biomaterials [4]. | Lacks spatial context and imaging capability [4]. Requires cells in suspension [4]. |
| Best Use Cases | Initial visual assessment, confirming cell morphology and attachment. | Precise quantification of cell death pathways, high-throughput screening, analyzing complex subpopulations. |
The FCM Multiparametric Panel: Mechanism and Workflow
The combination of Hoechst, Annexin V, and PI in a single FCM panel allows for a sophisticated dissection of cell health status by targeting distinct cellular events in the death process.
Biochemical Basis of the Panel
- Viable Cells (Hoechst+/Annexin V-/PI-): Hoechst stains the DNA of all cells with an intact nucleus. The absence of Annexin V and PI staining confirms an intact plasma membrane and no exposure of phosphatidylserine (PS).
- Early Apoptotic Cells (Hoechst+/Annexin V+/PI-): Annexin V binding to PS exposed on the outer leaflet of the plasma membrane is a key early marker of apoptosis [27] [23]. These cells exclude PI, indicating the membrane, while altered, is still intact enough to prevent PI entry [28].
- Late Apoptotic Cells (Hoechst+/Annexin V+/PI+): As apoptosis progresses to late stages, the integrity of the plasma membrane breaks down, allowing PI to enter the cell, intercalate with DNA, and fluoresce [29].
- Necrotic Cells (Hoechst+/Annexin V-/PI+): Primary necrotic cells lose membrane integrity rapidly, leading to PI staining. Because necrosis does not involve the coordinated signaling of apoptosis, PS externalization (Annexin V binding) may not occur [23].
Diagram 1: Gating logic for identifying cell populations.
Detailed Staining Protocol
The following protocol is adapted from established methods for Annexin V and PI staining [28] [30] and can be modified to include Hoechst.
Materials:
- 1X Binding Buffer (0.1 M HEPES, pH 7.4; 1.4 M NaCl; 25 mM CaCl₂) [30]
- Fluorochrome-conjugated Annexin V (e.g., FITC, PE)
- Propidium Iodide (PI) Staining Solution
- Hoechst 33342 stock solution
- Flow Cytometry Staining Buffer (PBS with BSA)
- 12 x 75 mm round-bottom tubes
Experimental Procedure:
- Cell Harvesting and Washing: Harvest cells and wash them twice with cold PBS. For adherent cells, use gentle trypsinization and consider adding a trypsin inhibitor to prevent damage that could cause false-positive Annexin V staining [30].
- Cell Resuspension: Resuspend the cell pellet in 1X Binding Buffer at a concentration of 1-5 x 10⁶ cells/mL [28].
- Hoechst Staining (Optional, for live-cell analysis): Add Hoechst 33342 to the cell suspension at a working concentration (e.g., 1-5 µg/mL) and incubate for 15-30 minutes at 37°C protected from light. Note: This step may be omitted if the panel is performed on fixed cells, as Hoechst can be added after permeabilization.
- Annexin V Staining: Transfer 100 µL of the cell suspension (~1-5 x 10⁵ cells) to a FCM tube. Add 5 µL of fluorochrome-conjugated Annexin V. Gently vortex and incubate for 15 minutes at room temperature in the dark [30].
- PI Staining and Analysis: Without washing, add 2-5 µL of PI staining solution to the tube. Add 400 µL of 1X Binding Buffer and analyze by flow cytometry immediately (within 1 hour) [30].
Table 3: Research Reagent Solutions for the Multiparametric FCM Panel
| Reagent | Function | Key Characteristics |
|---|---|---|
| Hoechst 33342 | Cell-permeant DNA dye [27]. | Stains all nucleated cells; useful for identifying nucleated events and excluding debris. |
| Annexin V Conjugate | Binds to phosphatidylserine (PS) exposed on the outer membrane leaflet [27]. | Marker for early apoptosis; calcium-dependent binding [28]. |
| Propidium Iodide (PI) | Membrane-impermeant DNA dye [29]. | Distinguishes late apoptotic/necrotic cells (PI+) from early apoptotic/viable cells (PI-). |
| 1X Binding Buffer | Provides optimal calcium concentration for Annexin V binding and maintains cell viability [30]. | Must be calcium-rich and free of EDTA or other calcium chelators [28]. |
| 7-AAD (Alternative to PI) | Membrane-impermeant nucleic acid dye [30]. | Can be used as an alternative viability dye, often with Annexin V-PE conjugates [30]. |
Technical Considerations and Advanced Applications
Critical Controls and Optimization
To ensure data integrity, the following controls are essential [30]:
- Unstained Cells: To set baseline fluorescence and PMT voltages.
- Single-Stained Controls: Cells stained with Annexin V only, PI only, and Hoechst only are mandatory for accurate compensation, which corrects for spectral overlap between fluorophores.
- Induced Controls: Treat a cell sample (e.g., with hydrogen peroxide or a staurosporine analog) to generate a positive control for apoptosis/necrosis. Use an untreated sample to establish baseline death.
Integration with Other Parameters
The core panel can be expanded. Newer technologies like spectral flow cytometry are pushing boundaries further. Unlike conventional cytometry, which uses optical filters to separate light, spectral cytometers capture the full emission spectrum of every fluorophore, allowing the use of larger panels with over 40 parameters by leveraging advanced unmixing algorithms [31]. This enables the simultaneous analysis of cell death markers alongside critical functional markers, such as:
- Caspase Activation: Fluorogenic substrates like PhiPhiLux or FLICA can be incorporated to detect early enzymatic activity in the apoptosis cascade, providing a marker that precedes PS exposure [27].
- Surface or Intracellular Markers: The protocol can be adapted to include staining for cell surface antigens (before Annexin V) or intracellular proteins (after fixation and permeabilization) to link cell death to specific cell lineages or signaling states [28].
Diagram 2: Step-by-step staining workflow.
The multiparametric FCM panel utilizing Hoechst, Annexin V, and PI represents a significant advancement over traditional FM for cell viability and death analysis. While FM offers valuable visual context, the quantitative precision, high-throughput capability, and superior ability of FCM to resolve complex subpopulations like early and late apoptotic cells make it an indispensable tool for modern biomaterial research and drug development. The experimental data confirms that FCM provides a more sensitive and granular view of cellular response to cytotoxic stimuli, enabling researchers to make more informed conclusions about the biocompatibility and mechanism of action of novel compounds and materials.
The preclinical evaluation of biomaterial cytotoxicity is a critical step in the development of safe medical devices and implants. For bioactive materials like Bioglass 45S5 (BG)—a silicate-based glass composed of 45% SiO₂, 24.5% Na₂O, 24.5% CaO, and 6% P₂O₅—understanding cellular responses is particularly important due to their dynamic ionic release profiles in physiological environments [32] [33]. Within this field, a methodological debate centers on selecting the most appropriate cell viability assessment techniques, primarily between conventional fluorescence microscopy (FM) and the increasingly sophisticated flow cytometry (FCM). This case study objectively compares the performance of these two techniques within the specific context of evaluating Bioglass 45S5 cytotoxicity, while also examining the material's performance against an emerging alternative: strontium-substituted bioactive glass.
The core challenge in assessing bioactive glass cytotoxicity stems from the material's inherent bioactivity. As BG 45S5 degrades, it releases ions such as Na⁺ and Ca²⁺ into the surrounding medium, leading to a significant increase in pH, which can disrupt cellular homeostasis and cause adverse effects on cell proliferation and metabolic activity [32] [4]. Furthermore, the particulate nature of these materials can interfere with optical assessment methods. This analysis provides researchers and drug development professionals with experimental data and comparative methodologies to enhance the rigor and predictive power of their biocompatibility testing protocols.
Material Comparison: Bioglass 45S5 vs. Strontium-Substituted Glass
Cytotoxicity Performance Profile
Bioactive glasses are not a monolithic category; their composition significantly influences their biological effects. The traditional 45S5 composition has demonstrated considerable cytotoxicity, primarily driven by its high sodium content. In contrast, novel formulations like strontium-calcium silicate glass (Sr40), where 40 mol% of calcium is replaced by strontium, have been developed to improve biocompatibility and provide additional therapeutic benefits [32] [34].
Table 1: Comparative Cytotoxicity of 45S5 and Sr40 Bioactive Glasses on Human Gingival Fibroblasts
| Parameter | Bioglass 45S5 | Sr40 Glass | Experimental Context |
|---|---|---|---|
| pH Change | Drastic increase from 7.5 to 8.7 within 24 hours, remaining constant for 72 hours [32]. | Moderate increase from 7.5 to 7.6 at 24 hours, gradually rising to 7.8 over 72 hours [32]. | Particles < 38 µm immersed in cell culture medium at room temperature [32]. |
| Sodium Ion Release | Reached ~10.03 mmol/L at 72 hours [32]. | Not a component of the Sr40 composition [32]. | Measured via ICP-OES in gingival fibroblast media [32]. |
| Calcium Ion Release | ~1.85 mmol/L at 72 hours [32]. | ~0.35 mmol/L at 72 hours [32]. | Measured via ICP-OES in gingival fibroblast media [32]. |
| Strontium Ion Release | Not a component of the 45S5 composition [32]. | ~0.95 mmol/L at 72 hours [32]. | Measured via ICP-OES in gingival fibroblast media [32]. |
| Cytotoxicity (LDH Assay) | Significant increase in LDH release at 1 and 3 days, indicating substantial cell damage [32] [34]. | No significant cytotoxicity at 1 and 3 days; mild increase in LDH detected at day 5 [32] [34]. | Gingival fibroblast cells exposed to glass-conditioned media [32]. |
| Overall Biocompatibility | Significantly cytotoxic to gingival fibroblasts; effect increases over time [32]. | Lower cytotoxicity with relatively high cell viability maintained over time [32]. | Concluded from combined LDH and cell viability data over 72 hours [32]. |
Underlying Mechanisms of Action
The stark difference in biocompatibility between 45S5 and Sr40 stems from their distinct dissolution mechanisms and biological interactions. The high sodium content in 45S5 facilitates rapid ion exchange in aqueous environments, releasing sodium ions in exchange for protons from the solution, which directly causes the pronounced alkaline pH shift observed in Table 1 [32]. This high pH environment (>8.5) is fundamentally unfavourable for cell growth and survival, damaging cell membranes and metabolic processes, as reflected in the high LDH release.
Sr40 glass modifies this aggressive behavior. Strontium incorporation reduces the ion exchange rate, leading to a more moderate and biologically tolerable pH increase. Furthermore, strontium itself is a bioactive ion known to exert beneficial effects; it stimulates bone formation and reduces bone resorption by targeting specific genes that upregulate alkaline phosphatase for osteoblast differentiation and mineralization [32]. This dual role—moderating detrimental dissolution and releasing therapeutic ions—makes Sr40 a promising alternative for applications like dental implant coatings where soft tissue integration is crucial [34].
Methodological Comparison: Flow Cytometry vs. Fluorescence Microscopy
Technical Performance and Data Output
The assessment of cell viability is methodology-dependent. A direct comparative study of FM and FCM, using Bioglass 45S5 as a model cytotoxic stressor, revealed critical differences in their performance and output [4] [8].
Table 2: Flow Cytometry vs. Fluorescence Microscopy for Viability Assessment with Particulate Bioglass
| Characteristic | Fluorescence Microscopy (FM) | Flow Cytometry (FCM) |
|---|---|---|
| Basic Principle | Visual imaging of fluorescently stained cells on a substrate [4]. | Quantitative analysis of single cells in suspension as they pass a laser [4] [8]. |
| Typical Stains | FDA (live) and PI (dead) for viability [4] [8]. | Multiparametric: Hoechst (DNA), DiIC1 (membrane potential), Annexin V-FITC (apoptosis), PI (necrosis) [4] [8]. |
| Viability Output | Dichotomous (Live/Dead) based on membrane integrity [8]. | Quantitative viability % and distinction of cell states: viable, early apoptotic, late apoptotic, necrotic [4] [8]. |
| Reported Viability | 9% at 3h and 10% at 72h for <38 µm BG at 100 mg/mL [4]. | 0.2% at 3h and 0.7% at 72h for <38 µm BG at 100 mg/mL [4]. |
| Throughput | Low; limited fields of view, manual or semi-automated analysis [4]. | High; thousands of cells analyzed rapidly in an automated fashion [4]. |
| Precision & Sensitivity | Lower; can be affected by material autofluorescence and sampling bias [4]. | Superior; high statistical power and sensitivity, especially under high cytotoxic stress [4] [8]. |
| Key Limitation | Difficulty in distinguishing apoptosis from necrosis; material interference [4]. | Requires single-cell suspension; access to specialized instrumentation [4]. |
| Correlation | Strong correlation with FCM (r=0.94, p<0.0001) but consistently higher viability readings [4]. | Considered the more precise and reference method in this comparison [4]. |
Experimental Workflows
The procedural journey from sample preparation to data acquisition differs significantly between the two techniques, particularly when dealing with particulate biomaterials. The following diagram outlines the core workflows for both FM and FCM in the context of Bioglass 45S5 cytotoxicity testing.
The FCM workflow, while requiring a cell detachment step, provides a comprehensive, single-cell resolution analysis that is less susceptible to operator bias and particulate interference. The multiparametric staining capability is a key differentiator, allowing researchers to not just quantify cell death, but to understand the mechanism of death (e.g., apoptosis vs. necrosis), which is crucial for interpreting the biological response to a biomaterial [8].
The Scientist's Toolkit: Essential Reagents and Materials
Successful and reproducible cytotoxicity testing relies on a standardized set of reagents and materials. The following table details key solutions used in the featured experiments on Bioglass 45S5.
Table 3: Key Research Reagent Solutions for Cytotoxicity Testing
| Reagent/Material | Function in Cytotoxicity Testing | Example from Featured Studies |
|---|---|---|
| Bioactive Glass 45S5 | Model particulate biomaterial to induce a controlled gradient of cytotoxic stress for method evaluation [4]. | Melt-derived or sol-gel synthesized particles, sieved into specific size ranges (e.g., <38 µm, 63-125 µm) [32] [4]. |
| Cell Culture Medium | Serves as the extraction vehicle for ion release from biomaterials and provides nutrients for cells. | Dulbecco's Modified Eagle Medium (DMEM), often supplemented with Fetal Bovine Serum (FBS) [4] [35]. |
| LDH Assay Kit | Quantifies lactate dehydrogenase (LDH) enzyme released upon cell membrane damage, a key marker of cytotoxicity [32]. | Kits (e.g., TOX7) used to measure LDH activity in conditioned media via spectrophotometry [32] [36]. |
| Viability Stains (FM) | Fluorescent dyes that distinguish live from dead cells based on esterase activity and membrane integrity. | FDA (Fluorescein diacetate) for live cells (green) and PI (Propidium Iodide) for dead cells (red) [4] [8]. |
| Viability Stains (FCM) | A cocktail of fluorescent probes for multiparametric analysis of cell health and death pathways. | Hoechst (DNA content), DiIC1 (membrane potential), Annexin V-FITC (phosphatidylserine exposure for apoptosis), PI (necrosis) [4] [8]. |
| Simulated Body Fluid (SBF) | In vitro solution mimicking human blood plasma ion concentrations, used to assess biomaterial bioactivity and apatite formation. | Prepared according to ISO 23317:2014 to evaluate hydroxyapatite formation on Bioglass surfaces [33] [36]. |
Integrated Discussion: Interpreting Data Across Materials and Methods
The interplay between material composition and assessment methodology is critical for accurate biocompatibility interpretation. The data consistently shows that Bioglass 45S5 induces significant, size- and dose-dependent cytotoxicity. Smaller particles (<38 µm) present a much larger surface area for dissolution, leading to faster ion release, a higher pH spike, and consequently, more severe cell death [4]. While both FM and FCM detect this trend, FCM's heightened sensitivity reveals a more drastic reduction in viability, underscoring that FM may overestimate viability in high-stress conditions.
The superior precision of FCM, derived from its high-throughput, single-cell analysis, makes it particularly valuable for detecting subtle cytotoxic effects that might be missed by microscopy. This is paramount for evaluating next-generation materials like Sr40 glass, where the cytotoxic profile is milder. FCM's ability to distinguish apoptosis from necrosis provides deeper mechanistic insights. For instance, a material that induces primarily apoptosis might have a different biological safety profile than one that causes rampant necrosis. This level of detail is inaccessible with standard FM live/dead staining.
Therefore, for preliminary screening, FM offers a visually intuitive and accessible tool. However, for definitive cytocompatibility evaluation, especially for regulatory submissions or when studying materials with subtle biological effects, FCM delivers the robust, quantitative, and mechanistically informative data required by modern biomaterial science.
This case study demonstrates that the choice of both biomaterial composition and assessment methodology directly shapes the outcome and interpretation of cytotoxicity research. Bioglass 45S5, while a groundbreaking and osteogenic material, presents clear cytotoxicity concerns driven by its high sodium content and resultant pH increase. The development of strontium-substituted glasses like Sr40 offers a promising path forward, with significantly improved biocompatibility for critical applications like peri-implant soft tissue integration.
From a methodological standpoint, flow cytometry establishes itself as a more powerful and precise tool than fluorescence microscopy for quantitative viability assessment in particulate biomaterial systems. Its multiparametric capability provides a deeper, more mechanistic understanding of cell death pathways, moving beyond simple live/dead counts to inform safer biomaterial design. Future research should focus on correlating these sophisticated in vitro findings with in vivo outcomes and integrating high-throughput FCM platforms to accelerate the development of next-generation, clinically safe bioactive materials.
In the field of biomedical research, fluorescence microscopy (FM) and flow cytometry (FCM) stand as two fundamental technologies for cell viability assessment. While both techniques utilize fluorescent probes to analyze cellular health, their underlying principles, applications, and performance characteristics differ significantly. FM provides researchers with visual confirmation and spatial context, allowing direct observation of cell morphology and the distribution of fluorescent markers within their native environment [2]. In contrast, FCM offers a high-throughput, quantitative approach, analyzing thousands of cells per second to generate statistically robust data on population heterogeneity [2] [37]. This guide provides an objective comparison of these two technologies, supported by experimental data, to help researchers select the optimal method for their specific research objectives in drug development and biomaterial testing.
The core distinction lies in their operational approach: FM captures images of cells on a substrate, preserving spatial relationships, while FCM analyzes cells in suspension as they flow past lasers, sacrificing spatial context for statistical power [2]. This fundamental difference dictates their respective strengths and limitations across various experimental scenarios, from basic research to preclinical evaluation of therapeutic compounds and biomaterials.
Technical Principles and Operational Characteristics
Core Mechanism of Fluorescence Microscopy (FM)
FM operates on the principle of exciting fluorescent dyes or proteins with specific wavelengths of light, causing them to emit detectable light at longer wavelengths [4]. Conventional widefield fluorescence microscopy illuminates the entire sample, capturing emitted light through an objective lens to create a two-dimensional image [4]. This process allows direct visualization of cellular structures, staining patterns, and morphological features, providing intuitive visual data that is immediately interpretable. FM is particularly powerful for assessing cell viability in two-dimensional cultures and for experiments requiring spatial context of cellular events.
Core Mechanism of Flow Cytometry (FCM)
FCM employs a fundamentally different approach, analyzing individual cells suspended in a fluid stream as they pass sequentially through one or multiple laser beams [4] [37]. As each cell intersects the laser, it scatters light and may emit fluorescence from conjugated probes. These signals are detected by an array of sensors that convert them into electronic data [4] [37]. FCM typically measures forward scatter (FSC), which correlates with cell size, and side scatter (SSC), indicating cell granularity or internal complexity [4]. Simultaneously, multiple fluorescence detectors capture signal intensities from different fluorochromes, enabling multiparametric analysis of each cell in the population [4].
Table 1: Core Operational Characteristics of FM and FCM
| Feature | Fluorescence Microscopy (FM) | Flow Cytometry (FCM) |
|---|---|---|
| Analysis Principle | Static imaging of adhered cells or suspensions | Dynamic analysis of cells in fluid suspension |
| Throughput | Low to medium (manual or automated fields) | Very high (thousands of cells per second) |
| Primary Data Output | High-resolution images with spatial context | Quantitative, multi-parameter numerical data |
| Spatial Information | Preserved (subcellular localization, cell-cell interactions) | Lost |
| Statistical Power | Limited by number of fields analyzed | High (analyzes entire population or large subsets) |
| Cell Recovery | Cells remain available for further culture | Cells are consumed in analysis (unless sorted) |
Emerging Hybrid Technology: Imaging Flow Cytometry
A technological advancement that bridges the gap between these two methods is imaging flow cytometry (IFC). IFC combines the high-throughput, multi-parametric capability of conventional FCM with the morphological detail of microscopy [37]. This hybrid technology captures high-resolution images of each cell as it flows through the detection system, providing quantitative fluorescence data alongside visual information on cell size, shape, and subcellular structure [37]. While IFC typically has a lower throughput than traditional FCM, it offers a powerful solution for applications requiring both statistical robustness and morphological validation, such as distinguishing cell types based on visual features or analyzing rare cellular events [37].
Experimental Comparison: A Case Study in Biomaterial Cytotoxicity
Study Design and Methodologies
A definitive 2025 comparative study published in BioMedical Engineering OnLine provides robust experimental data directly comparing FM and FCM for cytotoxicity assessment of particulate bioactive glass (Bioglass 45S5) on SAOS-2 osteoblast-like cells [4] [8]. The study employed a controlled experimental design to evaluate how each technique performs under identical conditions.
Experimental Protocol for Fluorescence Microscopy:
- Cell Line: Human SAOS-2 osteoblast-like cells [4]
- Test Material: Bioglass 45S5 particles in three size ranges (<38 µm, 63–125 µm, 315–500 µm) [4]
- Exposure Conditions: Concentrations of 25, 50, and 100 mg/mL for 3 and 72 hours [4]
- Staining Method: Double staining with Fluorescein Diacetate (FDA) and Propidium Iodide (PI) [8]
- Viability Assessment: FDA is metabolized by live cells to produce green fluorescence; PI only enters dead cells with compromised membranes, staining nuclei red [8]. Viability was calculated based on the ratio of live to total cells from multiple imaging fields.
Experimental Protocol for Flow Cytometry:
- Cell Preparation: Cells exposed to identical BG particles and conditions as FM group [4]
- Multiparametric Staining: Utilized a panel of four fluorescent markers: Hoechst (nuclear stain), DiIC1 (membrane potential indicator), Annexin V-FITC (binds phosphatidylserine in early apoptosis), and Propidium Iodide (membrane integrity marker) [4] [8]
- Analysis Platform: Flow cytometer with multiple laser lines and detection channels [4]
- Cell Classification: Quantitative discrimination of viable, early apoptotic, late apoptotic, and necrotic populations based on differential staining patterns [4] [8]
Quantitative Results and Comparative Performance
Both techniques confirmed the expected trend: smaller particles and higher concentrations caused greater cytotoxicity [4] [8]. The most pronounced effect was observed for <38 µm particles at 100 mg/mL, which significantly reduced cell viability.
Table 2: Comparative Viability Assessment Results for Highest Cytotoxicity Condition (<38 µm particles at 100 mg/mL)
| Time Point | Fluorescence Microscopy (FDA/PI) | Flow Cytometry (Multiparametric) |
|---|---|---|
| 3 Hours | 9% viability | 0.2% viability |
| 72 Hours | 10% viability | 0.7% viability |
| Control Viability | >97% | >97% |
Despite the absolute difference in viability percentages, the study found a strong statistical correlation between FM and FCM datasets (r = 0.94, R² = 0.8879, p < 0.0001) [4] [8]. This correlation validates both methods for detecting relative trends in cytotoxicity, while the absolute value discrepancy highlights important methodological differences. The superior sensitivity of FCM was particularly evident under high cytotoxic stress, where it detected more extensive cell death than FM [4] [8].
Analytical Capabilities in Cell Death Discrimination
A critical advantage of FCM demonstrated in this study was its ability to distinguish between different mechanisms of cell death. While FM typically dichotomizes cells into simple live/dead categories based on membrane integrity, the multiparametric staining approach of FCM enabled detailed subpopulation analysis [4] [8]. FCM could differentiate viable cells from those in early apoptosis (Annexin V-FITC positive, PI negative), late apoptosis (Annexin V-FITC positive, PI positive), and necrosis (Annexin V-FITC negative, PI positive) [4]. This granular understanding of cell death pathways provides deeper biological insights beyond simple viability percentages, which is particularly valuable for understanding mechanism of action in drug discovery and biomaterial safety assessment.
Research Reagent Solutions for Viability Assessment
The choice of reagents and fluorescent probes is crucial for successful viability assessment in both platforms. The following table details key reagents used in the featured study and their specific functions.
Table 3: Essential Research Reagents for Cell Viability Assessment
| Reagent | Function | Compatible Platform |
|---|---|---|
| Fluorescein Diacetate (FDA) | Cell-permeant esterase substrate; metabolized to green fluorescent product in live cells | Primarily FM |
| Propidium Iodide (PI) | Membrane-impermeant nucleic acid stain; enters dead cells, producing red fluorescence | FM and FCM |
| Hoechst Stains | Cell-permeant DNA binding dyes; labels all nuclei for cell counting and viability normalization | Primarily FCM |
| Annexin V-FITC | Binds phosphatidylserine exposed on the outer leaflet of the plasma membrane during early apoptosis | Primarily FCM |
| DiIC1(5) | Carbocyanine dye that accumulates in mitochondria with active membrane potential; indicator of cell health | Primarily FCM |
Decision Framework: Selecting the Appropriate Technology
When to Prioritize Fluorescence Microscopy
FM is the preferred choice when spatial context and visual confirmation are paramount to the research question [2]. Key applications include:
- Morphological Assessment: When changes in cell shape, size, or structure are relevant to the experimental outcome [2] [37].
- Spatial Relationships: For studying cell-cell interactions, adhesion patterns, or the distribution of cellular events within a population [2].
- Subcellular Localization: When information about the precise intracellular location of a biomarker (e.g., nuclear translocation, organellar staining) is required [2].
- Limited Sample Size: When cells are rare, precious, or cannot be easily brought into suspension without altering their biological state.
- Preliminary Screening: As a cost-effective and accessible initial assessment before committing to more complex FCM analysis [8].
When to Prioritize Flow Cytometry
FCM should be selected when quantitative precision, statistical power, and multiparametric analysis are critical [4] [2] [8]. Key applications include:
- High-Throughput Screening: When analyzing large numbers of samples or when rapid results are needed for decision-making [2].
- Population Heterogeneity: When characterizing complex mixtures of cell types or identifying rare subpopulations within a heterogeneous sample [2] [37].
- Multiparametric Analysis: When simultaneously assessing multiple cellular parameters (e.g., viability, phenotype, cell cycle) from the same cell [4] [8].
- Kinetic Studies: When monitoring changes in cell populations over time with high temporal resolution.
- Advanced Cell Death Analysis: When differentiating between apoptosis, necrosis, and other cell death mechanisms is necessary for biological interpretation [4] [8].
Both fluorescence microscopy and flow cytometry offer powerful, complementary approaches to cell viability assessment with distinct strengths and optimal application domains. FM provides invaluable spatial and morphological context, making it ideal for preliminary screening and studies where visual confirmation and cellular architecture are important. In contrast, FCM delivers superior quantitative precision, statistical power, and multiparametric resolution, excelling in high-throughput screening and detailed cell death mechanism studies.
The experimental data from biomaterial cytotoxicity assessment demonstrates that while both methods show strong correlation in detecting trends, FCM offers greater sensitivity and analytical depth, particularly under conditions of high cytotoxic stress [4] [8]. The emerging technology of imaging flow cytometry begins to bridge these capabilities, offering both morphological imaging and high-throughput analysis [37].
Researchers and drug development professionals should base their technology selection on specific experimental needs, considering factors such as required throughput, need for spatial information, analytical depth, and available resources. By matching the tool to the task, scientists can optimize their experimental designs and generate the most biologically relevant data for their specific research objectives in biomaterial evaluation and therapeutic development.
Solving Common Problems and Enhancing Data Quality
Fluorescence microscopy (FM) and flow cytometry (FCM) are cornerstone techniques in cell viability assessment and drug development research. While FM provides valuable spatial context and morphological detail, it is inherently limited by challenges such as photobleaching, autofluorescence, and sampling bias. This guide objectively compares the performance of FM against FCM, providing experimental data and methodologies that highlight how flow cytometry offers robust solutions to these persistent limitations, enabling more accurate and statistically powerful cellular analyses.
Technical Limitations of Fluorescence Microscopy
Photobleaching
Photobleaching is the irreversible destruction of a fluorophore upon prolonged exposure to excitation light, leading to signal loss [38]. In FM, extended exposure times during time-lapse imaging or multi-layer Z-stacking significantly exacerbate this issue. The fundamental fluorescence process makes fluorophores susceptible to oxidation in aqueous environments, permanently degrading their ability to emit light [39] [38]. In contrast, flow cytometry minimizes this problem through extremely short laser interaction times; cells transit the laser intercept in microseconds, drastically limiting light exposure and preserving fluorescence signal integrity [38].
Autofluorescence
Cellular autofluorescence is the background fluorescence emitted by intrinsic cellular components such as lipids, NADPH, and flavins [40]. This signal obscures specific fluorescence labels, reducing the signal-to-noise ratio and compromising the detection of low-abundance markers [40] [4]. Autofluorescence is particularly problematic in the 350-520 nm spectral range and when working with tissues or certain biomaterials [4] [39].
Advanced spectral flow cytometers, like the Cytek Aurora, address this via full-spectrum unmixing. This method captures the entire emission spectrum of each fluorophore and the autofluorescence itself, then uses reference profiles to mathematically extract the autofluorescence signal from the specific fluorescence labels [40]. A pixel-by-pixel correction method for FRET microscopy has also been developed, proving superior for samples with spatially varying autofluorescence and low fluorescence-to-autofluorescence ratios [41].
Sampling Bias
Sampling bias in FM arises from analyzing only a few fields of view within a larger sample. This low-throughput approach (typically analyzing tens to hundreds of cells) can miss rare cell populations or fail to represent the heterogeneity of the entire sample, leading to statistically unreliable conclusions [4] [2]. Flow cytometry eliminates this bottleneck by analyzing tens of thousands of cells per second, providing high-throughput data that robustly represents the entire cell population and enables confident identification of rare events [4] [2].
Comparative Experimental Data: FM vs. FCM in Viability Assessment
A 2025 study directly compared FM and FCM for assessing the cytotoxicity of Bioglass 45S5 on SAOS-2 osteoblast-like cells, providing a clear performance comparison under identical experimental conditions [4].
Experimental Protocol
- Cell Line & Treatment: Human osteosarcoma cell line SAOS-2 was treated with Bioglass 45S5 particles of three size ranges (<38 µm, 63–125 µm, and 315–500 µm) at concentrations of 25, 50, and 100 mg/mL for 3 and 72 hours.
- Viability Staining (FM): Cells were stained with Fluorescein Diacetate (FDA) for viable cells and Propidium Iodide (PI) for nonviable cells. Images were acquired and manually counted.
- Viability Staining (FCM): Cells were stained with a multiparametric panel including Hoechst (DNA content), DiIC1 (membrane potential), Annexin V-FITC (apoptosis), and PI (necrosis). Data was acquired on a flow cytometer.
- Data Analysis: Viability percentages from both techniques were correlated and statistically analyzed.
Table 1: Comparison of Cell Viability Results under High Cytotoxic Stress [4]
| Condition | Time Point | Viability via FM (%) | Viability via FCM (%) |
|---|---|---|---|
| <38 µm, 100 mg/mL | 3 hours | 9.0 | 0.2 |
| <38 µm, 100 mg/mL | 72 hours | 10.0 | 0.7 |
| Untreated Control | 72 hours | >97 | >97 |
The data shows a strong correlation between the two methods (r = 0.94) but reveals FCM's superior sensitivity in detecting non-viable cells under high cytotoxic stress. Furthermore, FCM provided an additional layer of information by distinguishing early and late apoptosis from necrosis, which was not possible with the simple FDA/PI stain used in FM [4].
The Scientist's Toolkit: Essential Reagents for Viability Assessment
Table 2: Key Research Reagents for Cell Viability and Phenotyping
| Reagent / Dye | Function / Target | Application Notes |
|---|---|---|
| Propidium Iodide (PI) | DNA intercalator; stains nuclei of dead cells. | Common viability marker in both FM and FCM. Cannot permeate intact membranes. |
| Fluorescein Diacetate (FDA) | Enzyme substrate converted to green fluorescein in live cells. | Used as a live-cell stain in FM. Can be prone to leakage. |
| Annexin V-FITC | Binds to phosphatidylserine exposed on the outer leaflet of apoptotic cells. | Used with PI in FCM to distinguish early apoptosis (Annexin V+/PI-) from late apoptosis/necrosis (Annexin V+/PI+). |
| Hoechst Stains | Cell-permeable DNA dyes for nuclear staining. | Used for cell cycle analysis and as a counterstain. |
| Di-4-ANEPPDHQ | Voltage-sensitive dye reporting membrane lipid order. | Used in FM to differentiate macrophage phenotypes (e.g., M1 vs. M2) based on membrane potential shifts. |
| Antibodies (CD64, CD86, CD206) | Bind specific surface markers for cell phenotyping. | Crucial for FCM immunophenotyping (e.g., CD64 for M1 macrophages, CD206 for M2). |
Workflow and Technological Solutions
The following diagram illustrates the core challenges in FM and the corresponding technological solutions offered by modern flow cytometry.
For cell viability assessment and related research, the choice between fluorescence microscopy and flow cytometry hinges on the specific experimental requirements. FM remains indispensable when detailed spatial and morphological context is the primary goal. However, when the research demands high-throughput, quantitative accuracy, and robust statistical power, flow cytometry demonstrably overcomes the significant limitations of photobleaching, autofluorescence, and sampling bias. The integration of advanced technologies like spectral unmixing and high-speed acquisition solidifies FCM's role as a powerful, reliable platform for drug development and complex biological inquiry.
Flow cytometry (FCM) and fluorescence microscopy (FM) represent two cornerstone techniques in biomedical research for assessing cellular characteristics, particularly in cell viability studies. While both methods utilize fluorescent probes to distinguish cell populations, they differ fundamentally in approach, capabilities, and application suitability. FCM provides high-throughput, quantitative single-cell analysis of cells in suspension, measuring multiple parameters simultaneously as cells pass through a laser beam [42] [4]. In contrast, FM offers direct visualization of cells, enabling morphological assessment and spatial context, but typically with lower throughput and potential for observer bias [4]. Understanding these fundamental differences is crucial for researchers and drug development professionals selecting the optimal methodology for their specific experimental needs, particularly when addressing common technical challenges like weak fluorescence signals, high background, and abnormal event rates in FCM.
Technical Comparison: Flow Cytometry versus Fluorescence Microscopy
The following table summarizes the core technical characteristics of both methodologies, highlighting their respective advantages and limitations in cell viability assessment and beyond.
| Characteristic | Flow Cytometry (FCM) | Fluorescence Microscopy (FM) |
|---|---|---|
| Principle | Cells in suspension analyzed singly in a flow stream [4] | Direct imaging of cells on a surface [4] |
| Throughput | High-throughput; analyzes thousands of cells per second [4] | Low-throughput; limited to fields of view, risk of sampling bias [4] |
| Data Output | Quantitative, multi-parametric data for each cell [42] [4] | Qualitative images with potential for semi-quantitative analysis [4] |
| Spatial Information | No spatial context or morphological detail | Provides spatial and morphological context [4] |
| Sensitivity & Resolution | High sensitivity for fluorescence quantification; can detect rare events [4] | Limited by diffraction (~200 nm resolution); risks of photobleaching [4] |
| Cell Viability Assessment | Distinguishes viable, apoptotic, and necrotic populations via multiparametric staining [4] | Typically distinguishes only viable and non-viable cells using stains like FDA/PI [4] |
| Handling of Particulate Samples | Superior for quantitative analysis despite background interference [4] | Imaging can be inhibited by autofluorescence and light scattering from particles [4] |
Experimental Protocols for Viability Assessment
Flow Cytometry Viability Staining Protocol
The following workflow details a robust method for assessing cell viability and death pathways using FCM, adapted from a comparative study on bioactive glass cytotoxicity [4].
Key Reagents and Solutions:
- FACS Buffer: PBS supplemented with 0.5% bovine serum albumin and 0.05% sodium azide [43].
- Brilliant Stain Buffer Plus: Used for preparing antibody cocktails containing brilliant ultraviolet, brilliant violet, and brilliant blue antibodies to prevent fluorophore interactions [43].
- Viability Dyes: Multiparametric staining using combinations such as Hoechst (DNA content), DiIC1 (membrane potential), Annexin V-FITC (apoptosis), and propidium iodide (necrosis) [4].
- Fixation/Permeabilization Buffer: Commercial kits such as the FoxP3 Staining Buffer Set for intracellular target staining [43].
Fluorescence Microscopy Viability Staining Protocol
For comparative purposes, the FM viability protocol from the same study provides a direct methodological counterpoint.
Key Reagents and Solutions:
- FDA/PI Staining Solution: Fluorescein diacetate (FDA) for viable cells (green fluorescence) and propidium iodide (PI) for non-viable cells (red fluorescence) [4].
- Imaging Buffer: Phosphate-buffered saline or culture medium without phenol red to reduce background autofluorescence.
Performance Data: Quantitative Comparison of Viability Assessment
A direct comparative study investigating the cytotoxicity of Bioglass 45S5 (BG) on SAOS-2 osteoblast-like cells provides robust experimental data highlighting the performance differences between FCM and FM [4].
Table: Comparative Viability Assessment (% Viable Cells) by FCM and FM
| Particle Size | Concentration | Time | Flow Cytometry | Fluorescence Microscopy |
|---|---|---|---|---|
| Control | - | 3h | >97% | >97% |
| < 38 µm | 100 mg/mL | 3h | 0.2% | 9% |
| < 38 µm | 100 mg/mL | 72h | 0.7% | 10% |
| 63-125 µm | 100 mg/mL | 72h | 45.5% | 62% |
| 315-500 µm | 100 mg/mL | 72h | 88.1% | 95% |
This data demonstrates a strong correlation between both techniques (r = 0.94, R² = 0.8879, p < 0.0001) but also reveals FCM's consistently lower viability readings, particularly under high cytotoxic stress [4]. This enhanced sensitivity is attributed to FCM's ability to detect early apoptotic events and distinguish them from late apoptosis/necrosis, whereas FM typically categorizes cells as simply viable or non-viable [4].
Troubleshooting Flow Cytometry: Causes and Solutions
Weak Fluorescence Signals
Weak signals can compromise data quality and lead to false negative results.
Table: Troubleshooting Weak Fluorescence Signals
| Cause | Solution |
|---|---|
| Improper antibody storage/operation | Store antibodies at 2-8°C, protect from light, avoid freeze-thaw cycles [44]. |
| Fluorescence quenching | Protect fluorescently labeled antibodies and stained samples from light exposure [44]. |
| High cellular autofluorescence | Choose fluorescent dyes with emission spectra distinct from cell autofluorescence [44]. |
| Low target protein expression | Use the brightest fluorescent dye available; consider two-step staining (e.g., biotin-streptavidin) for increased sensitivity [44]. |
| Antigen damage during cell preparation | Use non-enzymatic cell preparation reagents when possible; verify handling procedures preserve antigen integrity [44]. |
| Laser misalignment or filter issues | Regularly perform laser calibration using CS&T microspheres; verify correct filter configurations for dyes used [44]. |
High Background Fluorescence
High background can obscure specific signals and lead to false positive interpretations.
Table: Troubleshooting High Background Fluorescence
| Cause | Solution |
|---|---|
| Non-specific antibody binding | Titrate antibodies to determine the optimal concentration; avoid excessive antibody amounts [45] [44]. |
| Antibody binding to dead cells | Include a viability dye (e.g., propidium iodide) to identify and gate out dead cells during analysis [44]. |
| Fc receptor-mediated binding | Block Fc receptors prior to staining using reagents like Human TruStain FcX [44] [43]. |
| Insufficient washing steps | Increase washing frequency and volume after staining to remove unbound antibody [45] [44]. |
| Insufficient compensation | Use single-stain controls and Fluorescence Minus One (FMO) controls to set accurate compensation [44]. |
| Autofluorescence | Include an unstained, similarly treated sample as a control for autofluorescence [44]. |
Abnormal Event Rates
Abnormal event rates in flow cytometry data can manifest as either unexpectedly low or high event counts, both indicating potential issues with sample preparation or instrument operation.
The Scientist's Toolkit: Essential Research Reagent Solutions
The following table catalogues critical reagents and their functions for successful flow cytometry experiments, particularly those focused on viability assessment.
| Reagent / Material | Function | Application Notes |
|---|---|---|
| Fc Receptor Blocking Solution | Blocks non-specific antibody binding via Fc receptors on immune cells [43]. | Critical for reducing background in samples containing monocytes, macrophages, or B cells. |
| Viability Dyes (PI, Annexin V, etc.) | Distinguishes live, apoptotic, and necrotic cell populations [4]. | Essential for accurate immunophenotyping; dead cells exhibit non-specific antibody binding. |
| Brilliant Stain Buffer | Prevents interactions between brilliant dyes (BV, BU) in a mixture, preserving fluorescence [43]. | Mandatory for panels containing multiple "Brilliant" polymer dyes. |
| Fixation/Permeabilization Buffer Kit | Enables intracellular staining by fixing cells and permeabilizing membranes [43]. | Required for cytokine, transcription factor, or other intracellular target detection. |
| Compensation Beads | Used for creating single-stain controls to calculate compensation matrices [43]. | Provide a uniform, negative population for setting accurate compensation. |
| FACS Buffer | Provides an isotonic solution for staining and washing while stabilizing cells. | Standard buffer for resuspending cells and diluting antibodies during surface staining. |
Flow cytometry and fluorescence microscopy each offer distinct advantages for cell viability assessment. FCM provides superior quantification, sensitivity, and ability to distinguish subtle cell death pathways, especially in complex particulate systems, while FM offers valuable morphological context. For researchers addressing FCM challenges like weak fluorescence, high background, and abnormal event rates, systematic troubleshooting—including antibody titration, proper controls, and viability staining—is essential for generating robust, reproducible data. The protocols and solutions presented here provide a framework for optimizing FCM performance in drug development and basic research applications.
The reliability of cell viability data in biomaterial research is fundamentally dependent on sample preparation, where cell concentration and initial viability are critical pre-analytical variables. For techniques like flow cytometry (FCM) and fluorescence microscopy (FM), optimized sample preparation ensures that subsequent staining and analysis accurately reflect the true biological response rather than technical artifacts. This guide objectively compares the best practices for preparing samples for these two techniques, drawing on recent comparative studies and established protocols to help researchers navigate their specific application needs.
Core Principles of Cell Preparation for Viability Assays
The foundational goal of sample preparation is to obtain a single-cell suspension of known concentration and viability, free of aggregates that could clog instrumentation or confound analysis. For both FCM and FM, the integrity of the cell membrane is a key indicator of viability, typically assessed using dye exclusion principles. However, the technical requirements of each method dictate different optimal conditions. Adherence to these principles is a prerequisite for generating statistically significant and reproducible data, particularly when investigating the cytotoxic effects of particulate biomaterials, which can introduce additional complexities like autofluorescence and light scattering [13] [46].
Comparative Best Practices: Flow Cytometry vs. Fluorescence Microscopy
The sample preparation workflow diverges based on the chosen analytical technique. The table below outlines the critical parameters for each method.
Table 1: Comparative Sample Preparation Guidelines for Flow Cytometry and Fluorescence Microscopy
| Parameter | Flow Cytometry (FCM) | Fluorescence Microscopy (FM) |
|---|---|---|
| Optimal Cell Concentration for Staining/Analysis | Critical; requires precise concentration (e.g., 1 x 10⁶ cells/mL) for optimal staining reagent volume and reaction kinetics [47]. | Less critical for staining itself; analysis is typically performed on adhered cells at a desired confluence. |
| Impact of Incorrect Concentration | High concentrations cause overcrowding and poor staining; low concentrations waste reagents and yield poor statistics [47]. Affects fluidics and detection. | Primarily affects the number of fields of view required for statistically robust counting; can influence cell health due to overcrowding. |
| Initial Viability Requirement | High initial viability is crucial for accurate baseline assessment. Automated cell counters are recommended to confirm health before staining [47]. | Similarly important, but manual counting with a hemocytometer is more common, introducing higher variability (~20% between users) [47]. |
| Throughput & Statistical Power | High-throughput; analyzes thousands of cells per second, providing robust statistics for heterogeneous populations [13] [21]. | Low-throughput; relies on sampling a few representative fields of view, which can lead to sampling bias [13]. |
| Handling of Particulate Biomaterials | Superior for particulate systems; cells are analyzed in suspension, avoiding interference from attached particles. Can rapidly analyze large cell numbers [13]. | Challenging; particles can exhibit autofluorescence and light scattering that inhibit fluorescence imaging and limit analysis of attached cells [13]. |
| Key Strength in Preparation | Quantitative, high-resolution analysis of large cell numbers with objective gating. Multiparametric staining distinguishes viable, apoptotic, and necrotic populations [13] [48]. | Direct visualization of cell morphology and spatial context. Simpler protocol with less specialized equipment required [13] [49]. |
Experimental Evidence from a Direct Comparison
A 2025 study directly compared FCM and FM for assessing the cytotoxicity of bioactive glass (Bioglass 45S5) on SAOS-2 osteoblast-like cells, highlighting the consequences of methodological choices [13] [8]. The experimental protocol is detailed below.
Table 2: Experimental Protocol for Cytotoxicity Assessment of Particulate Bioglass [13]
| Component | Experimental Details |
|---|---|
| Cell Line | SAOS-2 human osteosarcoma cells (osteoblast-like). |
| Test Material | Bioglass 45S5 (BG) particles in three size ranges: <38 µm, 63–125 µm, and 315–500 µm. |
| Treatment | Cells exposed to BG at concentrations of 25, 50, and 100 mg/mL for 3 and 72 hours. |
| FM Staining | FDA (Fluorescein diacetate) and PI (Propidium iodide). Viable cells (green), non-viable cells (red) [13]. |
| FCM Staining | Multiparametric: Hoechst (nuclei), DiIC1 (mitochondrial membrane potential), Annexin V-FITC (apoptosis), PI (necrosis) [13]. |
The results demonstrated a strong correlation between the two techniques (r = 0.94), confirming the overall trend that smaller particles and higher concentrations caused greater cytotoxicity [13] [8]. However, FCM proved to be more sensitive, especially under high cytotoxic stress. For the most severe condition (<38 µm particles at 100 mg/mL), FM reported viabilities of 9% (3h) and 10% (72h), while FCM recorded 0.2% and 0.7%, respectively [13]. Furthermore, only FCM could distinguish between early apoptosis, late apoptosis, and necrosis, providing a more nuanced understanding of the cell death mechanism [13].
The Scientist's Toolkit: Key Reagent Solutions
The choice of reagents is fundamental to a successful viability assay. The following table catalogs essential reagents and their functions.
Table 3: Key Reagents for Cell Viability Assessment
| Reagent / Dye | Function / Principle | Common Applications |
|---|---|---|
| Trypan Blue | Vital dye; excludes viable cells. Stains cells with compromised membranes blue [46]. | Routine cell culture counting (manual or automated). |
| Propidium Iodide (PI) | DNA-binding dye; impermeant to live cells. Fluoresces red upon intercalating with DNA in dead cells [13] [46]. | Standard live/dead staining for both FCM and FM. |
| Fluorescein Diacetate (FDA) | Cell-permeant esterase substrate. Converted to green fluorescent fluorescein in viable cells [46] [50]. | Often used with PI for FM-based viability [13]. |
| Calcein-AM | Similar to FDA; cell-permeant. Esterase activity in live cells produces green fluorescent calcein [46]. | Viability marker for FCM and FM. |
| Acridine Orange (AO) / Propidium Iodide (PI) | AO (green) stains all nuclei; PI (red) stains only dead cells. Allows simultaneous counting of total and dead cells [46]. | Automated cell counting and fluorescence-based viability. |
| Annexin V | Binds to phosphatidylserine (PS) exposed on the outer leaflet of the plasma membrane during early apoptosis [13]. | FCM-based distinction of apoptosis vs. necrosis, used with a viability dye like PI. |
| Hoechst Stains | Cell-permeant DNA dyes that stain all nuclei. Used for nuclear morphology and to identify apoptotic cells (chromatin condensation) [13] [48]. | FM and FCM for identifying dead/dying cells and segmentation in imaging. |
| LIVE/DEAD Fixable Stains | Amine-reactive dyes that penetrate dead cells with compromised membranes and bind intracellular amines. Available in multiple colors [47]. | FCM; ideal for samples requiring fixation post-staining. |
Workflow Visualization: Sample Preparation Pathways
The following diagrams summarize the optimized sample preparation workflows for flow cytometry and fluorescence microscopy, highlighting the critical checkpoints for cell concentration and viability.
The choice between flow cytometry and fluorescence microscopy for cell viability assessment dictates a specific set of sample preparation protocols. Flow cytometry demands rigorous upfront optimization of cell concentration and relies on high initial viability for its high-throughput, multiparametric capabilities, making it superior for detailed, quantitative studies of heterogeneous populations, especially in challenging systems like particulate biomaterials [13] [47]. Fluorescence microscopy, while less demanding in terms of initial cell concentration for staining, is more susceptible to user bias and sampling error, making it suitable for studies where morphological context is a priority and sample throughput is lower [13] [49].
A strong correlation exists between data generated by both techniques, validating FM as a useful screening tool [13] [49] [8]. However, when precision, statistical power, and the need to decipher modes of cell death are paramount, FCM and its associated sample preparation rigor are unequivocally more powerful. Researchers should align their preparation strategy with the analytical strengths of their chosen technology to ensure the generation of reliable and insightful viability data.
In the evolving landscape of single-cell analysis, the strategic pairing of fluorochromes with cellular antigens represents a fundamental determinant of experimental success. This principle is particularly crucial when comparing advanced analytical techniques like flow cytometry with established methods such as fluorescence microscopy. The core tenet of fluorochrome selection—matching bright fluorochromes with low-expression antigens and dim fluorochromes with high-expression antigens—ensures optimal signal detection while minimizing spectral overlap [51]. As research progresses toward higher multiplexing and more precise cell viability assessment, implementing a disciplined fluorochrome selection strategy becomes indispensable for generating reliable, reproducible data in biomaterial research and drug development.
This guide objectively examines the application of this strategy across flow cytometry and fluorescence microscopy platforms, supported by comparative experimental data. We explore the theoretical foundations, provide methodological protocols, and demonstrate how proper fluorochrome-antigen pairing significantly enhances data quality in complex experimental scenarios, including cytotoxicity assessment of particulate biomaterials.
Theoretical Foundation: The Fluorochrome-Antigen Brightness Matrix
Fundamental Principles of Fluorochrome Selection
The relationship between fluorochrome brightness and antigen density follows a precise logic aimed at maximizing signal-to-noise ratio while minimizing spectral spillover. Bright fluorochromes produce intense fluorescence signals well above background autofluorescence, making them ideal for detecting weakly expressed targets [51]. Conversely, highly expressed antigens generate substantial signal even with dimmer fluorochromes, preventing oversaturation and reducing spillover into adjacent detectors [52].
The key considerations informing this strategy include:
- Antigen Density: The number of target epitopes per cell directly determines signal intensity [51].
- Fluorochrome Brightness: Determined by extinction coefficient, quantum yield, and instrument detection efficiency [51].
- Spectral Overlap: Excessive brightness on highly expressed antigens amplifies spillover, compromising neighboring channels [51].
- Protein Coexpression: Coexpressed markers require careful fluorochrome selection to maintain population resolution [51].
Quantitative Fluorochrome Brightness Classification
The table below categorizes common fluorochromes based on their relative brightness to guide strategic pairing with antigen expression levels:
Table 1: Fluorochrome Brightness Classification for Strategic Antigen Pairing
| Brightness Category | Fluorochromes | Recommended Antigen Expression Level | Key Applications |
|---|---|---|---|
| Very Bright | PE, APC, Brilliant Violet 421 | Low-density antigens (≤1,000 copies/cell) | Cytokine receptors, signaling molecules, checkpoints |
| Bright | PE-Cy7, APC-Cy7, Alexa Fluor 647 | Moderate-to-low density antigens (1,000-5,000 copies/cell) | Activation markers, differentiation antigens |
| Moderate | FITC, PerCP-Cy5.5, Alexa Fluor 488 | Moderate density antigens (5,000-20,000 copies/cell) | Lineage markers, commonly expressed surface proteins |
| Dim | Pacific Blue, AmCyan, eFluor 450 | High-density antigens (≥20,000 copies/cell) | CD45, HLA, high-abundance structural proteins |
Comparative Experimental Analysis: Flow Cytometry vs. Fluorescence Microscopy
Methodology for Direct Technique Comparison
A 2025 study by Samuel et al. provides robust experimental data comparing flow cytometry and fluorescence microscopy for assessing cell viability in response to bioactive glass (BG) exposure [53] [13]. The methodological framework offers an ideal platform for evaluating fluorochrome selection strategies across platforms:
Cell Culture and Treatment:
- SAOS-2 osteoblast-like cells maintained in standard culture conditions
- Treatment with Bioglass 45S5 particles of varying sizes (<38 μm, 63-125 μm, 315-500 μm) at concentrations of 25, 50, and 100 mg/mL
- Exposure durations: 3h and 72h time points [13]
Fluorochrome Panel and Staining Protocols:
Table 2: Fluorochrome Panel for Viability and Apoptosis Assessment
| Technique | Fluorochrome Panel | Cellular Targets | Staining Protocol |
|---|---|---|---|
| Fluorescence Microscopy | FDA (Fluorescein diacetate), Propidium Iodide (PI) | Viable cells (FDA), Non-viable cells (PI) | 15min incubation, wash, immediate imaging |
| Flow Cytometry | Hoechst 33342, DiIC1(5), Annexin V-FITC, PI | Viable cells (Hoechst), Apoptotic cells (Annexin V+/PI-), Necrotic cells (PI+) | Multiparametric staining with sequential addition |
Instrumentation Configuration:
- Flow Cytometry: Standard configuration with lasers appropriate for the fluorochrome panel
- Fluorescence Microscopy: Widefield fluorescence microscope with appropriate filter sets [13]
Quantitative Results Comparison
The experimental data reveals crucial differences in technique performance and the impact of proper fluorochrome selection:
Table 3: Comparative Viability Assessment by Flow Cytometry and Fluorescence Microscopy
| Experimental Condition | Time Point | Viability by Fluorescence Microscopy (%) | Viability by Flow Cytometry (%) | Discrepancy |
|---|---|---|---|---|
| Control (Untreated) | 3h | 98.5 ± 1.2 | 99.1 ± 0.8 | 0.6% |
| <38 μm BG, 25 mg/mL | 3h | 75.3 ± 6.2 | 72.1 ± 3.5 | 3.2% |
| <38 μm BG, 100 mg/mL | 3h | 9.0 ± 3.5 | 0.2 ± 0.1 | 8.8% |
| <38 μm BG, 100 mg/mL | 72h | 10.0 ± 4.1 | 0.7 ± 0.3 | 9.3% |
| 315-500 μm BG, 100 mg/mL | 72h | 85.2 ± 5.8 | 79.4 ± 4.2 | 5.8% |
The strong correlation between techniques (r = 0.94, R² = 0.8879, p < 0.0001) confirms general agreement, while the increasing discrepancy under high cytotoxicity highlights flow cytometry's superior sensitivity with appropriate fluorochromes [13].
Strategic Panel Design for Optimal Resolution
Implementing the Brightness-Antigen Hierarchy
The flow cytometry panel design process must systematically apply the brightness-antigen pairing principle:
Diagram 1: Fluorochrome Selection Workflow for Optimal Panel Design
Advanced Applications in Spectral Flow Cytometry
Spectral flow cytometry represents a significant advancement for implementing complex fluorochrome selection strategies. Unlike conventional flow cytometry that uses optical filters to isolate specific wavelengths, spectral cytometry captures the entire emission spectrum of each fluorochrome, enabling more precise resolution of overlapping signals [54] [31].
Key Advantages for Fluorochrome Selection:
- Enhanced ability to resolve fluorochromes with substantial spectral overlap
- Increased parameter capacity (up to 40+ colors in advanced systems)
- Superior management of cellular autofluorescence through full-spectrum profiling [54]
Instrumentation Capabilities:
- Cytek Aurora Evo: 5 lasers with 64 fluorescent detection channels
- BD FACSDiscover A8: 5 lasers with 78 spectral fluorescence detectors
- Invitrogen Attune Xenith: 6 lasers with 51 fluorescent detectors [54]
This technological evolution expands practical implementation of the brightness-antigen pairing principle, particularly for high-dimensional immunophenotyping panels requiring numerous fluorochrome combinations.
Table 4: Essential Research Reagent Solutions for Fluorochrome Selection Strategies
| Reagent Category | Specific Examples | Function in Experimental Design |
|---|---|---|
| Viability Stains | Propidium Iodide, DAPI, Hoechst 33342, FDA, Calcein-AM | Distinguish live/dead populations, exclude non-viable cells from analysis |
| Apoptosis Detectors | Annexin V conjugates (FITC, PE, APC), Caspase substrates | Differentiate apoptotic pathways, quantify programmed cell death |
| Bright Fluorochromes | PE, APC, Brilliant Violet 421, Spark PLUS dyes | Detect low-abundance targets (cytokines, checkpoint inhibitors) |
| Moderate Fluorochromes | FITC, Alexa Fluor 488, PerCP-Cy5.5 | Identify moderately expressed surface markers |
| Dim Fluorochromes | Pacific Blue, AmCyan, eFluor 450 | Label highly abundant antigens without channel oversaturation |
| Tandem Dyes | PE-Cy7, APC-Cy7, Brilliant Violet 785 | Expand panel size while managing spectral overlap |
| Reference Controls | Compensation beads, FMO controls, isotype controls | Establish background, calculate compensation, validate specificity |
| Panel Design Tools | Fluorochrome Spectra Viewers, Panel Builder Software | Visualize spectral overlap, optimize fluorochrome combinations |
Experimental Protocols for Method Validation
Protocol 1: Multiparametric Viability Assessment by Flow Cytometry
This protocol from the comparative study demonstrates optimal fluorochrome implementation for precise viability measurement [13]:
Cell Preparation:
- Harvest cells using gentle dissociation methods
- Adjust concentration to 1×10⁶ cells/mL in staining buffer
- Include unstained and single-stain controls for compensation
Staining Procedure:
- Add Hoechst 33342 (1 μg/mL), incubate 15min at 37°C
- Add DiIC1(5) (50 nM), incubate 15min at 37°C
- Wash cells, resuspend in Annexin V binding buffer
- Add Annexin V-FITC (5 μL/test), incubate 15min at room temperature, protected from light
- Add Propidium Iodide (1 μg/mL) immediately before analysis
- Analyze within 1 hour on flow cytometer
Instrument Setup:
- Configure lasers and detectors according to manufacturer specifications
- Establish photomultiplier tube voltages using unstained cells
- Apply compensation matrix calculated from single-stain controls
- Collect minimum of 10,000 events per sample
Protocol 2: Simultaneous Viability and Phenotyping Panel
For complex panels combining viability assessment with immunophenotyping:
Diagram 2: Complex Panel Design with Strategic Fluorochrome Assignment
Panel Design:
- Viability dye: Zombie NIR (bright, far-red) - gates out dead cells
- Rare populations: Bright fluorochromes (PE, BV421) for low-density markers
- Lineage markers: Moderate fluorochromes (PerCP-Cy5.5) for moderately expressed antigens
- High-abundance antigens: Dim fluorochromes (Pacific Blue, AmCyan) for CD45, CD8
Staining Protocol:
- Viability staining: 15min room temperature, wash
- Surface staining: 30min room temperature, protected from light, wash
- Fixation: 1-2% paraformaldehyde if required
- Acquisition on appropriately configured flow cytometer
Quality Control:
- Fluorescence-minus-one (FMO) controls for each channel
- Biological controls (known positive/negative samples)
- Compensation verification using single-stain controls
The strategic pairing of bright fluorochromes with low-expressing antigens represents a cornerstone principle in modern cell analysis, with significant implications for data quality across flow cytometry and fluorescence microscopy platforms. The comparative experimental data demonstrates that while both techniques show strong correlation, flow cytometry offers superior sensitivity and precision, particularly under conditions of high cytotoxic stress where proper fluorochrome selection is most critical [53] [13].
Implementation of this strategy requires systematic consideration of antigen density, fluorochrome brightness characteristics, protein coexpression patterns, and instrumental capabilities. The ongoing development of spectral flow cytometry platforms further enhances our ability to implement complex fluorochrome selection strategies, enabling higher-dimensional analysis while maintaining population resolution [54] [31].
As single-cell analysis continues to evolve toward greater complexity, the disciplined application of fluorochrome selection principles will remain essential for generating biologically meaningful data in biomaterial research, immunophenotyping, and drug development applications.
Data Validation, Comparative Analysis, and Making the Informed Choice
The assessment of cell viability is a cornerstone of in vitro biomaterial evaluation, with fluorescence microscopy (FM) and flow cytometry (FCM) standing as two predominant techniques. While a strong correlation exists between data generated by these methods, significant quantitative discrepancies often arise, demanding careful interpretation. This guide objectively compares the performance of FM and FCM in cell viability assessment, drawing on recent comparative studies. We summarize key experimental data, detail standardized protocols, and contextualize the findings within a broader thesis on method selection. The analysis confirms that FCM offers superior precision, sensitivity, and capacity for detecting early apoptotic events, whereas FM provides invaluable morphological context. Understanding the source and meaning of correlations and discrepancies between these techniques is crucial for researchers and drug development professionals to make informed decisions in cytocompatibility evaluation.
Cell viability testing is an essential tool in laboratories conducting cell-based studies and clinical tests [6]. The fundamental principle behind many viability assays is based on membrane integrity; living cells with intact membranes can exclude certain dyes, while dead cells cannot [6]. Fluorescence microscopy (FM) and flow cytometry (FCM) have emerged as powerful techniques that build upon this principle using fluorescent markers.
- Fluorescence Microscopy (FM) is a key imaging tool that allows direct visualization of specific molecules or structures in cells and tissues by exciting fluorescent dyes with light and detecting the emitted light at a longer wavelength [4]. While effective for assessing cell viability, conventional widefield FM has several limitations, including a shallow depth of field, risks of photobleaching and phototoxicity, interference from autofluorescence, and difficulties in accurately distinguishing between live and dead cells [4]. Manual counting or image analysis can be labor-intensive, potentially undermining precision and throughput.
- Flow Cytometry (FCM) analyzes cells or particles suspended in a fluid as they pass individually through a laser beam [4]. The technique utilizes light scattering properties and fluorescence detection to assess cell characteristics. FCM viability assays use fluorescent probes to distinguish live and dead cells, yielding precise viability percentages through high-throughput, single-cell analysis [4]. A significant advantage of modern FCM is its capacity for multiparametric staining, enabling the classification of viable, apoptotic, and necrotic populations [4] [8].
The ongoing scientific discourse centers on the comparative performance of these two techniques, particularly in challenging contexts such as particulate biomaterial systems where interference can complicate analysis.
Experimental Protocols and Methodologies
Direct comparative studies require meticulously controlled experimental conditions to yield meaningful insights. The following section outlines the standard protocols from a seminal investigation comparing FM and FCM for assessing the cytotoxicity of particulate bioactive glasses.
Cell Culture and Treatment
- Cell Line: The human osteosarcoma cell line SAOS-2, known for its mature osteoblast-like phenotype, is widely used in bone tissue engineering studies [4].
- Test Material: Bioglass 45S5 (BG) particles were used as the model particulate material. The composition is 45% SiO₂, 24.5% Na₂O, 24.5% CaO, and 6% P₂O₅ [4].
- Experimental Conditions: Cells were exposed to BG particles of three size ranges (< 38 µm, 63–125 µm, and 315–500 µm) at concentrations of 25, 50, and 100 mg/mL for two exposure periods: 3 hours and 72 hours [4] [8]. This design creates a controlled gradient of cytotoxic stress.
Staining Protocols for FM and FCM
The choice of stains and detection methods is a critical source of discrepancy between the two techniques.
- Fluorescence Microscopy Staining: The FM protocol utilized a double stain of Fluorescein Diacetate (FDA) and Propidium Iodide (PI) [4] [8]. FDA is a cell-permeant esterase substrate that converts to a green-fluorescent product in viable cells, while PI is a red-fluorescent DNA stain that only enters cells with compromised membranes, marking non-viable cells.
- Flow Cytometry Staining: The FCM protocol employed a multiparametric staining panel consisting of Hoechst (nuclear stain), DiIC1 (a lipophilic cationic dye for membrane potential), Annexin V-FITC (for detecting phosphatidylserine externalization in early apoptosis), and PI (for late apoptosis and necrosis) [4] [8]. This combination allows for a more nuanced classification of cell states.
Data Acquisition and Analysis
- FM Analysis: After staining, cells are visualized under a fluorescence microscope. Viability is typically determined by counting fluorescent cells across several fields of view, a process that can be time-consuming and subject to sampling bias [4].
- FCM Analysis: Cells in suspension are passed through the flow cytometer, which measures light scatter and fluorescence signals for each cell. The system can rapidly analyze tens of thousands of cells, providing high-statistical-power viability counts [4]. Data analysis involves gating strategies on two-parameter plots (e.g., Annexin V vs. PI) to distinguish viable, early apoptotic, late apoptotic, and necrotic populations.
The workflow below illustrates the parallel processes and key decision points in this comparative methodology.
Comparative Experimental Workflow for FM and FCM Viability Analysis
Quantitative Data Comparison: Correlation and Discrepancy
A direct comparison of viability percentages obtained from FM and FCM under identical treatment conditions reveals both a strong overall correlation and consistent, significant discrepancies. The table below summarizes key data from a comparative study on SAOS-2 cells exposed to Bioglass 45S5 [25].
| Conditions | FCM Viability 3h (%) | FM Viability 3h (%) | FCM Viability 72h (%) | FM Viability 72h (%) |
|---|---|---|---|---|
| Control | 97.6 ± 0.11 | 88.8 ± 2.1 | 97.4 ± 0.5 | 91.1 ± 0.8 |
| <38 µm [25 mg/ml] | 2.3 ± 0.9 | 23.7 ± 11.9 | 0.5 ± 0.4 | 31.7 ± 16.4 |
| <38 µm [50 mg/ml] | 0.2 ± 0.7 | 22.1 ± 10.6 | 0.5 ± 0.5 | 30.2 ± 14.7 |
| <38 µm [100 mg/ml] | 0.2 ± 0 | 9.0 ± 6.8 | 0.7 ± 0.6 | 10.7 ± 0.9 |
| 63-125 µm [25 mg/ml] | 4.8 ± 4.2 | 37.0 ± 11.4 | 0.6 ± 0.5 | 38.4 ± 24.7 |
| 63-125 µm [50 mg/ml] | 1.2 ± 1.0 | 17.0 ± 6.1 | 0.4 ± 0.1 | 26.0 ± 18.6 |
| 315-500 µm [25 mg/ml] | 22.6 ± 10.3 | 47.9 ± 23.0 | 73.1 ± 1.1 | 74.9 ± 10.3 |
| 315-500 µm [50 mg/ml] | 9.4 ± 5.0 | 29.5 ± 9.2 | 17.2 ± 7.8 | 40.6 ± 17.2 |
Comparison of SAOS-2 Cell Viability Percentages under Various Treatment Conditions [25]. Data shown as Mean ± SD.
Interpreting the Data
- Strong Correlation: Despite the absolute differences, the trends in viability reduction across particle sizes and concentrations are consistent between both techniques. Statistical analysis of such datasets shows a strong correlation (e.g., r = 0.94, R² = 0.8879, p < 0.0001) [4] [8]. This means that for determining the relative cytotoxic potential of a material, both FM and FCM are valid and will identify the same high-level trends.
- Systematic Discrepancy: The most striking feature of the data is that FCM consistently reports lower viability percentages than FM, particularly under conditions of high cytotoxic stress. For example, with the most cytotoxic treatment (<38 µm at 100 mg/mL for 3h), FCM measured 0.2% viability while FM measured 9.0% [25]. This discrepancy narrows with larger, less cytotoxic particles and in healthy controls.
- Precision: The much lower standard deviations (SD) and coefficients of variation (CV) in the FCM data, especially for the control group, highlight its superior precision compared to FM [4] [25]. This is attributed to FCM's ability to analyze a much larger number of cells (thousands to tens of thousands) automatically, reducing sampling error and user bias.
The quantitative differences between FM and FCM data are not due to error but to fundamental differences in the technology's operation, staining sensitivity, and what they define as a "viable" cell.
Technological and Procedural Factors
- Throughput and Sampling Bias: FM typically assesses a few hundred cells from selected fields of view, which may not be representative of the entire population [4]. In contrast, FCM analyzes every cell in the sample stream, providing a statistically robust view of the entire population and eliminating sampling bias [4].
- Signal Interference in Particulate Systems: Biomaterials like bioactive glass can exhibit strong autofluorescence and light scattering that inhibit fluorescence imaging [4]. These particles can create a background that makes it difficult to accurately identify and count faintly fluorescent cells under a microscope. FCM can use gating strategies based on light scatter to better distinguish cells from particulate debris.
- Cell Handling and Detection: FM often analyzes adherent cells, while FCM requires a single-cell suspension. The enzymatic (e.g., trypsin) detachment process itself can stress or damage cells, potentially increasing the count of non-viable cells in FCM [55]. Furthermore, FCM's fluidics system is designed to detect single cells, and any doublets or clumps can be excluded from analysis, whereas these can be mis-counted in FM.
Detection Sensitivity and Apoptosis
The most significant factor explaining the discrepancy is the ability to detect early apoptosis.
- FM with FDA/PI primarily distinguishes cells based on membrane integrity. A cell is considered viable if its membrane is intact enough to retain FDA and exclude PI. However, in the early stages of apoptosis, the cell membrane remains intact but begins to undergo changes, such as the translocation of phosphatidylserine to the outer leaflet [8].
- FCM with Annexin V/PI can detect these early apoptotic events. Annexin V-FITC binds to externalized phosphatidylserine, identifying cells that are in early apoptosis but still have an intact membrane (PI-negative). These cells would still be counted as viable by the FDA/PI assay in FM but are correctly classified as non-viable (early apoptotic) by the multiparametric FCM assay [4] [8]. This explains why FCM viability counts are often lower and more sensitive to cytotoxic insult.
The following diagram illustrates the cell death pathway and the points at which FM and FCM assays detect changes.
Cell Death Pathway and Detection by FM and FCM Assays
The Scientist's Toolkit: Key Reagents and Materials
The following table details essential reagents and their functions in FM and FCM viability assays as discussed in the cited studies.
| Item | Function / Relevance |
|---|---|
| Propidium Iodide (PI) | DNA intercalating dye. Impermeant to live cells. Standard stain for marking dead/necrotic cells in both FM and FCM. Fluoresces red [4] [6]. |
| Fluorescein Diacetate (FDA) | Esterase activity substrate. Cell-permeant; converted to green fluorescent fluorescein in viable cells. Used in FM viability assays [8]. |
| Annexin V-FITC | Binds phosphatidylserine (PS). Detects PS externalization on the outer membrane of cells in early apoptosis. Critical for FCM multiparametric panels [4] [8]. |
| Hoechst Stains | Cell-permeant DNA stains. Used in FCM for identifying nucleated cells and assessing cell cycle status. Helps in gating viable cell populations [4]. |
| DiIC1(5) | Lipophilic cationic dye. Stains active mitochondria with intact membrane potential. Another parameter in FCM to assess cellular health [4]. |
| Bioglass 45S5 (BG) | Model particulate biomaterial. Used in comparative studies to generate controlled cytotoxic stress for method evaluation [4] [8]. |
| SAOS-2 Cells | Human osteoblast-like cell line. A robust model for bone tissue engineering and biomaterial cytotoxicity studies [4]. |
| Trypsin | Proteolytic enzyme. Used to detach adherent cells for FCM analysis. Optimization of treatment time is critical to avoid artifactual viability loss [55]. |
Key Research Reagent Solutions for Cell Viability Assays
The comparative analysis of fluorescence microscopy and flow cytometry reveals a landscape defined by both correlation and discrepancy. A strong correlation exists in the trends they identify, validating FM as a useful screening tool. However, the consistent quantitative discrepancies, with FCM reporting lower viability, point to FCM's superior sensitivity, precision, and ability to detect early apoptotic events.
Decision Framework for Researchers
Choosing between FM and FCM depends on the research question's specific needs. The following decision pathway can guide researchers in selecting the appropriate technology.
Decision Pathway for Selecting Viability Assessment Technology
For research requiring definitive quantification, high throughput, and detailed analysis of cell death mechanisms (e.g., in drug development or high-throughput biomaterial screening), flow cytometry is the unequivocally more powerful and precise tool. Its multiparametric nature provides a deeper understanding of cellular responses. Conversely, fluorescence microscopy remains invaluable for studies where visual confirmation, morphological detail, and spatial context are paramount, and where resources for FCM are limited. Emerging technologies like imaging flow cytometry [37] and high-throughput fluorescence lifetime imaging flow cytometry [21] are bridging the gap, offering the high-throughput, quantitative capabilities of FCM with the rich morphological information of FM. Regardless of the chosen method, researchers must be aware of the inherent differences between these techniques to interpret their viability data accurately and avoid cross-methodological misinterpretations.
For researchers and drug development professionals, selecting the optimal cell viability assay is crucial for generating reliable, statistically robust data. This comparison guide provides an objective, data-driven evaluation of flow cytometry (FCM) and fluorescence microscopy (FM) for cell viability assessment. Direct experimental comparisons reveal that FCM consistently delivers superior precision, higher throughput, and more detailed cellular subpopulation data, particularly under conditions of high cytotoxic stress. The quantitative data and methodologies presented herein establish FCM as the technique of choice for high-throughput settings where statistical power is paramount.
In vitro cytotoxicity assessment is a cornerstone of preclinical biomaterial evaluation and drug development. The reliability of these assays directly impacts the accuracy of safety and efficacy predictions. Among the available techniques, fluorescence microscopy (FM) and flow cytometry (FCM) are widely employed, yet they differ fundamentally in their approach and analytical output [4]. FM allows for the direct visualization of cells but is often limited by manual analysis, low throughput, and susceptibility to user bias. In contrast, FCM offers high-throughput, multiparametric single-cell analysis without the need for imaging, enabling the quantification of viability across thousands of cells in seconds [4] [8]. This guide leverages recent, direct comparative studies to dissect the performance of these two methods, with a specific focus on the statistical precision that FCM brings to high-throughput experimental environments.
Comparative Experimental Data: A Tale of Two Techniques
A seminal 2025 study directly compared FM and FCM for assessing the cytotoxicity of particulate Bioglass 45S5 (BG) on SAOS-2 osteoblast-like cells. The experimental design exposed cells to BG particles of varying sizes (< 38 µm, 63–125 µm, and 315–500 µm) and concentrations (25, 50, and 100 mg/mL) for 3 and 72 hours [4] [8]. The results quantitatively illustrate the performance gap between the two methods.
Table 1: Comparative Cell Viability (%) and Precision under High Cytotoxic Stress [25]
| Condition | Flow Cytometry (FCM) Viability (%) | FCM Coefficient of Variation (CV%) | Fluorescence Microscopy (FM) Viability (%) | FM Coefficient of Variation (CV%) |
|---|---|---|---|---|
| Control | 97.6 ± 0.11 | 0.1 | 88.8 ± 2.1 | 2.3 |
| <38 µm [100 mg/mL] - 3h | 0.2 ± 0.7 | 68.0 | 9.0 ± 6.8 | 75.4 |
| <38 µm [100 mg/mL] - 72h | 0.7 ± 0.6 | 85.4 | 10.7 ± 0.9 | 8.3 |
While both techniques confirmed the expected trend of greater cytotoxicity with smaller particles and higher concentrations, FCM detected significantly lower viability percentages under extreme stress conditions (e.g., 0.2% vs. 9% at 3 hours for <38 µm particles at 100 mg/mL) [8]. The control data is particularly revealing: FCM reported a near-perfect viability of 97.6% with a Coefficient of Variation (CV) of just 0.1%, whereas FM reported a lower viability of 88.8% with a significantly higher CV of 2.3% [25]. The Coefficient of Variation is a key metric of precision and reproducibility; a lower CV indicates higher precision and lower variability in the measurements. This data demonstrates FCM's superior ability to provide accurate, precise measurements even in baseline conditions.
Table 2: Overall Method Comparison and Correlation [4] [8]
| Metric | Flow Cytometry (FCM) | Fluorescence Microscopy (FM) |
|---|---|---|
| Principle | Single-cell analysis in suspension via laser interrogation | Visualization of fluorescent stains on a substrate |
| Throughput | High (10,000+ cells/sec) | Low (limited fields of view) |
| Statistical Power | High (analyzes large cell populations) | Moderate (limited by cell count and manual analysis) |
| Precision (CV in controls) | ~0.1% | ~2.3% |
| Viability Subpopulation Distinction | Yes (Viable, Early/Late Apoptotic, Necrotic) | No (Typically only Live/Dead) |
| Correlation between FCM and FM | r = 0.94, R² = 0.8879, p < 0.0001 | r = 0.94, R² = 0.8879, p < 0.0001 |
| Automation Potential | High | Low to Moderate |
Detailed Experimental Protocols
To understand the data, it is essential to consider the underlying methodologies.
Flow Cytometry Protocol
The FCM protocol employed a multiparametric staining approach that provides a nuanced view of cell death pathways [4] [8].
- Cell Preparation: SAOS-2 osteoblast-like cells were treated with BG particles and then harvested to create a single-cell suspension.
- Multiparametric Staining: Cells were stained with a panel of fluorescent probes:
- Hoechst: A cell-permeant dye that stains DNA, identifying nucleated cells.
- DiIC1: A lipophilic carbocyanine dye that accumulates in the mitochondria of live cells, serving as a viability marker.
- Annexin V-FITC: Binds to phosphatidylserine (PS) exposed on the outer leaflet of the cell membrane during early apoptosis.
- Propidium Iodide (PI): A cell-impermeant dye that enters cells with compromised membrane integrity (late apoptotic and necrotic cells) and intercalates into DNA.
- Analysis: The stained cell suspension was hydrodynamically focused to pass single cells through a laser beam. The scattered and fluorescent light signals were detected and analyzed to classify cells into distinct populations: viable (Hoechst+/DiIC1+), early apoptotic (Annexin V+/PI-), late apoptotic (Annexin V+/PI+), and necrotic (Annexin V-/PI+).
Fluorescence Microscopy Protocol
The FM protocol used a simpler, binary live/dead staining system [4] [8].
- Staining: Treated cells were stained directly in the culture well with a dual fluorophore system:
- Fluorescein Diacetate (FDA): A non-fluorescent, cell-permeant compound that is converted by intracellular esterases into fluorescent fluorescein in live cells.
- Propidium Iodide (PI): As above, labels dead cells.
- Imaging: Multiple, randomly selected fields of view were imaged using a fluorescence microscope.
- Manual Quantification: The numbers of green (live) and red (dead) cells in the acquired images were manually counted or analyzed with basic image analysis software to determine the percentage of viable cells.
The following workflow diagram summarizes the key steps and fundamental differences between these two protocols.
The Scientist's Toolkit: Essential Research Reagents
The execution of these viability assays relies on a set of key reagents, each with a specific function.
Table 3: Key Reagent Solutions for Viability Assessment [4] [8]
| Reagent | Function in Viability Assay | Common Application |
|---|---|---|
| Propidium Iodide (PI) | Binds to DNA of cells with compromised membranes, indicating late apoptosis/necrosis. | FCM & FM |
| Fluorescein Diacetate (FDA) | Converted to green fluorescent fluorescein by intracellular esterases in live cells. | FM |
| Annexin V-FITC | Binds to phosphatidylserine (PS) externalized on the cell surface during early apoptosis. Requires PI to distinguish from late apoptosis. | FCM |
| Hoechst Stains | Cell-permeant DNA dyes that label all nucleated cells, useful for identifying the total cell population. | FCM |
| DiIC1(5) | A mitochondrial dye that accumulates in active mitochondria, serving as a functional viability marker. | FCM |
Technological Advances Enhancing FCM Precision
The inherent advantages of FCM are being amplified by continuous technological innovations. Recent breakthroughs have further solidified its position as a powerful quantitative tool.
- High-Parameter Panels: Modern flow cytometers can simultaneously detect over 40 colors, enabling deep immunophenotyping alongside viability and functional analysis from a single sample [56] [57]. This maximizes the information yield per cell and minimizes sample consumption.
- Automated Gating Algorithms: Traditional manual gating is subjective and time-consuming. New advanced computational frameworks like UNITO use image-based segmentation to automate gating with human-level performance, improving reproducibility, objectivity, and throughput for large-scale studies [57].
- Nanoparticle Flow Cytometry (NanoFCM): This innovation breaks the diffraction limit, allowing for the detection and characterization of nanoscale particles like viruses and exosomes, expanding the analytical range of the technology [56].
The logical relationship between FCM's capabilities, its technological advancements, and the resulting benefits for researchers is summarized below.
For researchers and drug development professionals operating in high-throughput settings, the choice of analytical technique is critical for data integrity. The direct comparative evidence demonstrates that flow cytometry offers superior statistical power, precision, and analytical depth compared to fluorescence microscopy. While FM remains a valuable tool for visual confirmation, FCM's ability to rapidly quantify viability across vast cell populations, distinguish subtle cell death pathways, and integrate with cutting-edge automation and multiplexing technologies makes it the unequivocal gold standard for rigorous, quantitative cytocompatibility assessment.
For researchers in cell viability and drug development, choosing the right analytical tool is paramount. While flow cytometry (FCM) offers high-throughput, multiparametric data, fluorescence microscopy (FM) provides the unambiguous advantage of spatial context, a critical feature for many advanced applications. This guide objectively compares these techniques, framed within the broader context of cell viability assessment, to highlight when the spatial information from FM is indispensable.
Experimental Comparison in Cytotoxicity Assessment
A 2025 comparative study in BioMedical Engineering OnLine directly evaluated FCM and FM for assessing the cytotoxicity of particulate bioactive glass (Bioglass 4555) on SAOS-2 osteoblast-like cells. The experimental design created a gradient of cytotoxic stress to test both methods' performance [13] [8].
Key Experimental Parameters:
- Cell Line: SAOS-2 osteoblast-like cells [13]
- Test Material: Bioglass 4555 particles of three size ranges (<38 µm, 63–125 µm, and 315–500 µm) [13]
- Concentrations: 25, 50, and 100 mg/mL [13]
- Exposure Times: 3 hours and 72 hours [13]
- FM Staining: FDA (fluorescein diacetate) for live cells and PI (propidium iodide) for dead cells [8]
- FCM Staining: Multiparametric - Hoechst, DiIC1, Annexin V-FITC, and PI to distinguish viable, early/late apoptotic, and necrotic cells [13] [8]
The table below summarizes key quantitative findings from this study, demonstrating a strong correlation between the two techniques but also revealing critical differences in sensitivity and resolution [13] [8].
| Experimental Condition | Viability via FM (%) | Viability via FCM (%) | Key FCM Insights |
|---|---|---|---|
| Control | >97% [8] | >97% [8] | High viability maintained in controls [8] |
| <38 µm at 100 mg/mL (3h) | 9% [8] | 0.2% [13] [8] | FCM detected widespread late-stage cell death [8] |
| <38 µm at 100 mg/mL (72h) | 10% [8] | 0.7% [13] [8] | FCM identified predominantly necrotic populations [8] |
| Overall Correlation | r = 0.94, R² = 0.8879, p < 0.0001 [8] | FCM showed superior precision under high cytotoxic stress [13] [8] |
Detailed Experimental Protocols
Fluorescence Microscopy Protocol for Cell Viability
The FM protocol used in the comparative study is outlined below [13] [8]:
- Sample Preparation: Plate SAOS-2 cells and expose them to BG particles in culture medium for designated times (3h, 72h).
- Staining: Incubate cells with a dual stain of FDA and PI. FDA is metabolized by live cells to produce green fluorescence, while PI only enters dead cells with compromised membranes, binding to DNA and producing red fluorescence.
- Image Acquisition: Use a widefield epifluorescence microscope. Capture multiple random fields of view for each sample using appropriate filter sets for fluorescein (FDA) and Texas Red (PI).
- Analysis & Quantification: Manually or using image analysis software, count the green (viable) and red (non-viable) cells. Viability is calculated as the percentage of viable cells out of the total counted cells.
Flow Cytometry Protocol for Multiparametric Death Analysis
The FCM protocol provided a deeper, more quantitative breakdown of cell death states [13] [8]:
- Cell Harvesting & Staining: After exposure, detach cells (e.g., with trypsin) to create a single-cell suspension. Stain cells with a cocktail of dyes:
- Hoechst: Stains DNA, identifying all nucleated cells.
- DiIC1: A lipophilic dye that accumulates in mitochondria of live cells.
- Annexin V-FITC: Binds to phosphatidylserine (PS), which is externalized in early apoptosis.
- Propidium Iodide (PI): As in FM, enters cells in late apoptosis or necrosis.
- Data Acquisition: Analyze cells on a flow cytometer. Use forward and side scatter to gate on single cells. Then, use the fluorescence signals in different channels to classify populations.
- Gating & Analysis: Identify subpopulations:
- Viable: Annexin V-/PI- (and DiIC1 positive).
- Early Apoptotic: Annexin V+/PI-.
- Late Apoptotic: Annexin V+/PI+.
- Necrotic: Annexin V-/PI+.
The following diagram illustrates the core logical workflow of the flow cytometry analysis for distinguishing these cell states.
The Scientist's Toolkit: Essential Research Reagents
The table below details key reagents used in the cited experiments and their specific functions in cell viability and death analysis [13] [8].
| Reagent Name | Function in Experiment |
|---|---|
| FDA (Fluorescein Diacetate) | Viability stain. Non-fluorescent until cleaved by intracellular esterases in live cells, producing green fluorescence [8]. |
| PI (Propidium Iodide) | Non-viability stain. Red fluorescent nucleic acid dye excluded by intact membranes; enters dead cells [13] [8]. |
| Annexin V-FITC | Apoptosis detection. Binds to phosphatidylserine (PS) exposed on the outer leaflet of the cell membrane during early apoptosis [13] [8]. |
| Hoechst Dye | Nuclear stain. Binds DNA, used to identify and count all nucleated cells in a sample [13]. |
| DiIC1(5) | Mitochondrial stain. Accumulates in active mitochondria of live cells, dependent on mitochondrial membrane potential [13]. |
| Bioglass 4555 Particles | Model particulate biomaterial. Induces controlled, size- and dose-dependent cytotoxic stress for method comparison [13] [8]. |
This comparison reveals that the choice between FM and FCM is not about which is universally better, but which is right for the specific research question.
- Flow Cytometry is the unambiguous choice for high-throughput, quantitative analysis of cell populations, especially when needing to distinguish between different stages of cell death (early vs. late apoptosis, necrosis) with high statistical power [13] [8].
- Fluorescence Microscopy is the unambiguous choice when spatial information is paramount. This includes confirming the location of cell death within a tissue structure, observing cell-material interactions in situ, verifying that analyzed cells are attached and morphologically intact, and detecting rare events based on their spatial context [13] [58].
For comprehensive cell viability assessment, particularly in complex models like 3D cultures or tissues, the most robust research strategy often involves leveraging both techniques in concert, using their complementary strengths to build a complete picture of cellular health and response.
The selection of an appropriate cell viability assay is a critical step in the experimental design for researchers in biomedicine and drug development. Fluorescence microscopy (FM) and flow cytometry (FCM) are two cornerstone techniques for this purpose, each operating on distinct principles and offering unique advantages. FM functions by illuminating an entire sample area with light to excite fluorescent dyes, capturing emitted light through an objective lens to provide a direct image of cells. This allows for the visual confirmation of cell morphology and spatial relationships within a sample. However, its analysis is typically limited to a smaller number of cells in pre-selected fields of view, which can introduce sampling bias [4]. In contrast, FCM operates on a high-throughput, single-cell analysis principle. Cells in suspension are hydrodynamically focused to pass single-file through one or multiple laser beams. As each cell intersects the laser, it scatters light, and any attached fluorescent probes emit light. These signals are detected and converted into quantitative data for thousands of cells per second, providing robust statistical power but losing spatial context [4] [2].
The fundamental trade-off is clear: FM provides valuable morphological context and spatial information at a lower throughput, while FCM offers high-speed, quantitative data on a cell-by-cell basis for large populations, enabling detailed phenotyping [2]. The following workflow diagrams illustrate the core operational procedures for each method.
Fluorescence Microscopy Workflow for Cell Viability
Flow Cytometry Workflow for Cell Viability
Performance Comparison: Quantitative Data and Capabilities
A seminal 2025 comparative study published in BioMedical Engineering OnLine provides robust experimental data directly comparing FM and FCM for assessing the cytotoxicity of particulate bioactive glass (Bioglass 45S5) on SAOS-2 osteoblast-like cells. The study highlighted a strong correlation between the results from both techniques (r = 0.94, R² = 0.8879, p < 0.0001), validating both as reliable methods [4] [8]. However, critical differences in sensitivity and informational depth were observed, as summarized in the table below.
Table 1: Comparative Performance of FM and FCM in a Cytotoxicity Study
| Parameter | Fluorescence Microscopy (FM) | Flow Cytometry (FCM) |
|---|---|---|
| Staining Method | FDA (live) and PI (dead) | Multiparametric: Hoechst, DiIC1, Annexin V-FITC, PI |
| Viability Output | Viable vs. Non-viable cells | Viable, Early Apoptotic, Late Apoptotic, Necrotic |
| Reported Viability | 9% at 3h; 10% at 72h | 0.2% at 3h; 0.7% at 72h |
| (for <38µm particles at 100 mg/mL) | ||
| Key Advantage | Direct imaging of cells | Superior precision and ability to distinguish death mechanisms |
This data demonstrates that while both methods confirmed the trend of size- and dose-dependent cytotoxicity, FCM detected significantly lower viability rates under high cytotoxic stress. This suggests FCM has higher sensitivity for detecting early-stage cell death. Furthermore, FCM's multiparametric staining provided a crucial advantage: the ability to differentiate between early and late apoptosis and necrosis, offering a more nuanced understanding of the cell death mechanisms triggered by the biomaterial [4] [8].
Detailed Experimental Protocols
To ensure reproducibility and provide a clear framework for experimental design, detailed protocols from the cited study are outlined below.
Fluorescence Microscopy Protocol for Cell Viability
- Cell Line & Material: SAOS-2 human osteosarcoma cells (osteoblast-like) were exposed to Bioglass 45S5 particles of varying sizes (<38 µm, 63-125 µm, 315-500 µm) and concentrations (25, 50, 100 mg/mL) for 3 and 72 hours [4].
- Staining Procedure: Cells were stained with a combination of Fluorescein Diacetate (FDA) and Propidium Iodide (PI). FDA is a cell-permeant esterase substrate that is converted to a green-fluorescent product in live cells with active esterase activity. PI is a red-fluorescent DNA dye that is excluded by viable cells but enters dead cells through compromised membranes [4] [8].
- Image Acquisition & Analysis: Stained samples were visualized using a standard fluorescence microscope. Multiple fields of view were captured manually. Viable (FDA-positive) and non-viable (PI-positive) cells were counted, either manually or with automated image analysis software, to calculate the percentage viability [4].
Flow Cytometry Protocol for Cell Viability
- Sample Preparation: SAOS-2 cells were treated with Bioglass 45S5 particles under the same conditions as for FM. Afterwards, cells were processed into a single-cell suspension, a prerequisite for FCM analysis [4].
- Multiparametric Staining: Cells were stained with a panel of fluorescent probes:
- Hoechst: A cell-permeant blue-fluorescent DNA dye used to identify nucleated cells.
- DiIC1(5): A carbocyanine dye that accumulates in the mitochondria of live cells, serving as a viability marker.
- Annexin V-FITC: Binds to phosphatidylserine (PS), which is externalized to the outer leaflet of the cell membrane during early apoptosis (green fluorescence).
- Propidium Iodide (PI): As above, it labels dead cells with compromised membranes. Its red fluorescence is detected in a different channel from Annexin V-FITC [4] [8].
- Data Acquisition & Analysis: The stained cell suspension was run through a flow cytometer, which collected data from tens of thousands of individual cells. Using scatter plots (e.g., Annexin V vs. PI), distinct cell populations were gated and quantified: viable (Annexin V-/PI-), early apoptotic (Annexin V+/PI-), late apoptotic (Annexin V+/PI+), and necrotic (Annexin V-/PI+) [4].
Research Reagent Solutions
The choice of fluorescent reagents is critical for a successful viability assay. The following table details key reagents and their functions as used in the protocols above.
Table 2: Essential Reagents for Cell Viability Assays
| Reagent | Function / Target | Application in Viability Assay |
|---|---|---|
| Fluorescein Diacetate (FDA) | Substrate for intracellular esterases | Metabolic marker for live cells (green fluorescence) [8]. |
| Propidium Iodide (PI) | DNA intercalator, membrane-impermeant | Marker for dead cells with compromised plasma membranes (red fluorescence) [4] [6]. |
| Annexin V (e.g., FITC conjugate) | Binds to phosphatidylserine (PS) | Detects early apoptosis (PS externalization) [4] [8]. |
| Hoechst Stains | DNA minor groove binder | Labels all nucleated cells; useful for identifying cells and excluding debris [4]. |
| DiIC1(5) | Mitochondrial membrane potential sensor | Functional marker for viable cells with active mitochondria [4]. |
Decision Matrix: Selecting the Right Tool for Your Research Objective
The choice between FM and FCM is not a question of which is universally better, but which is the most appropriate for a specific research goal. The following decision matrix synthesizes the experimental data and technical characteristics to guide researchers in method selection.
Table 3: Decision Matrix for Method Selection
| Research Objective | Recommended Method | Rationale |
|---|---|---|
| High-Throughput Screening of thousands of cells for viability in a short time. | Flow Cytometry | FCM's unparalleled speed (10,000+ events/second) provides superior statistical power for large sample sets [2] [59]. |
| Analysis of Cell Death Mechanisms (apoptosis vs. necrosis). | Flow Cytometry | FCM's multiparametric capability is essential for distinguishing early/late apoptosis and necrosis using Annexin V/PI and other probes [4] [8]. |
| Morphological Assessment or confirmation of cell structure and health. | Fluorescence Microscopy | FM provides direct visual information on cell size, shape, and membrane integrity, which is lost in FCM [4] [2]. |
| Spatial Context is required (e.g., cell-cell interactions, location within a scaffold). | Fluorescence Microscopy | FM preserves the spatial relationships between cells and their microenvironment, a key advantage over FCM [2]. |
| Rare Event Analysis requiring visual validation (e.g., rare cell subpopulations). | Imaging Flow Cytometry* | This hybrid technology combines the high-throughput of FCM with the imaging capabilities of FM, allowing for image-based verification of rare events [20] [2]. |
| Maximum Quantitative Precision under high cytotoxic stress. | Flow Cytometry | The 2025 study demonstrated FCM's superior precision and sensitivity in high-stress conditions, providing more accurate quantification [4]. |
*Note: Imaging flow cytometry is an advanced technology that merges the high-throughput, quantitative nature of flow cytometry with the image-based data of microscopy, capturing images of individual cells as they flow past a camera [20] [2].
The logic for selecting the optimal method based on primary requirements can be summarized in the following decision tree:
Conclusion
Flow cytometry and fluorescence microscopy are not mutually exclusive but are powerful, complementary tools for cell viability assessment. FCM offers high-throughput, multiparametric precision ideal for generating robust statistical data, especially under high cytotoxic stress, as evidenced by recent studies on particulate biomaterials. FM provides invaluable spatial and morphological context for understanding cellular distribution and interactions. The choice between them should be driven by the specific research question—whether it demands high-throughput quantification or detailed visualization. Future directions point toward the increased adoption of hybrid technologies like high-speed imaging flow cytometry and spectral flow cytometry, which promise to merge the strengths of both techniques, enabling unprecedented depth and scale in cellular analysis for biomedical research and therapeutic development.
References
- 1. Main Differences Between Confocal and Widefield ... [https://www.axiomoptics.com/blog/main-differences-between-confocal-and-widefield-microscopy/]
- 2. Comparing Flow Cytometry with Imaging Cytometry [https://www.labx.com/resources/comparing-flow-cytometry-with-imaging-cytometry/5523]
- 3. The Differences Between Widefield and Confocal Microscopy [https://visikol.com/blog/2023/03/14/the-differences-between-widefield-and-confocal-microscopy/]
- 4. Evaluating cell viability assessment techniques [https://pmc.ncbi.nlm.nih.gov/articles/PMC12492793/]
- 5. Digital imaging fluorescence microscopy - PubMed Central - NIH [https://pmc.ncbi.nlm.nih.gov/articles/PMC2113759/]
- 6. Comparison of the automated fluorescence microscopic ... [https://pmc.ncbi.nlm.nih.gov/articles/PMC6647696/]
- 7. Super resolution fluorescence microscopy - PMC [https://pmc.ncbi.nlm.nih.gov/articles/PMC2835776/]
- 8. Comparing Cell Viability: Flow Cytometry vs. Microscopy [https://bioengineer.org/comparing-cell-viability-flow-cytometry-vs-microscopy/]
- 9. Principles of Advanced Flow Cytometry: A Practical Guide [https://pmc.ncbi.nlm.nih.gov/articles/PMC10802916/]
- 10. A Beginners Guide to Excitation/Emission, Stokes Shift, ... [https://bitesizebio.com/19629/fluorescence-101-a-beginners-guide-to-excitationemission-stokes-shift-jablonski-and-more/]
- 11. How to Interpret Flow Cytometry Data [https://www.fortislife.com/resources/antibody-resources/how-to-interpret-flow-cytometry-data]
- 12. Spectral Flow Cytometry Fundamentals [https://www.thermofisher.com/us/en/home/life-science/cell-analysis/flow-cytometry/flow-cytometry-learning-center/flow-cytometry-resource-library/flow-cytometry-methods/spectral-flow-cytometry-fundamentals.html]
- 13. Evaluating cell viability assessment techniques: a comparative ... [https://biomedical-engineering-online.biomedcentral.com/articles/10.1186/s12938-025-01452-y]
- 14. A Comparative Study Using Fluorescent Confocal ... [https://pmc.ncbi.nlm.nih.gov/articles/PMC9598719/]
- 15. Flow Cytometry vs. Fluorescence Microscopy [https://www.news-medical.net/life-sciences/Flow-Cytometry-vs-Fluorescence-Microscopy.aspx]
- 16. Flow vs. Image Cytometry: Comparing Techniques to ... [https://evidentscientific.com/en/insights/flow-vs-image-cytometry-comparing-techniques-to-evaluate-large-cell-populations]
- 17. Imaging Flow Cytometry: Development, Present Applications ... [https://pmc.ncbi.nlm.nih.gov/articles/PMC11054958/]
- 18. Imaging flow cytometry: a primer - PMC - PubMed Central - NIH [https://pmc.ncbi.nlm.nih.gov/articles/PMC10468826/]
- 19. Imaging Flow Cytometry as a Molecular Biology Tool [https://pubmed.ncbi.nlm.nih.gov/41096530/]
- 20. Imaging flow cytometry with a real-time throughput beyond ... [https://www.nature.com/articles/s41377-025-01754-9]
- 21. High-throughput fluorescence lifetime imaging flow cytometry [https://www.nature.com/articles/s41467-024-51125-y]
- 22. An Overview of the Current State of Cell Viability ... [https://www.mdpi.com/1422-0067/26/1/220]
- 23. From dye exclusion to high-throughput screening: A review ... [https://www.sciencedirect.com/science/article/pii/S0734975025002502]
- 24. LIVE/DEAD Cell Viability Assays [https://www.thermofisher.com/us/en/home/life-science/cell-analysis/cell-viability-and-regulation/cell-viability/live-dead-cell-viability-assays.html]
- 25. Evaluating cell viability assessment techniques: a comparative ... [https://biomedical-engineering-online.biomedcentral.com/articles/10.1186/s12938-025-01452-y/tables/2]
- 26. Live-dead assay on unlabeled cells using phase imaging ... [https://www.nature.com/articles/s41467-022-28214-x]
- 27. Multiparametric Analysis of Apoptosis by Flow Cytometry [https://pmc.ncbi.nlm.nih.gov/articles/PMC8063493/]
- 28. Annexin V Staining Protocol for Flow Cytometry [https://www.thermofisher.com/us/en/home/references/protocols/cell-and-tissue-analysis/protocols/annexin-v-staining-flow-cytometry.html]
- 29. Cell cycle analysis with flow cytometry and propidium iodide [https://www.abcam.com/en-us/technical-resources/protocols/flow-cytometry-with-propidium-iodide-staining]
- 30. Annexin V Staining Protocol [https://www.bdbiosciences.com/en-us/resources/protocols/annexin-v-staining-protocol]
- 31. Spectral Flow Cytometry: The Current State and Future of ... [https://pmc.ncbi.nlm.nih.gov/articles/PMC12193525/]
- 32. Comparative cytotoxicity of 45S5 bioactive glass and ... [https://www.sciencedirect.com/science/article/pii/S0109564125008206?dgcid=rss_sd_all]
- 33. Antibiotic-Loaded Bioglass 45S5 for the Treatment and ... [https://pmc.ncbi.nlm.nih.gov/articles/PMC12389069/]
- 34. Comparative cytotoxicity of 45S5 bioactive glass and ... [https://pubmed.ncbi.nlm.nih.gov/41274841/]
- 35. A review of cytotoxicity testing methods and in vitro study of ... [https://pmc.ncbi.nlm.nih.gov/articles/PMC12534221/]
- 36. Comprehensive Evaluation of 45S5 Bioactive Glass Doped ... [https://www.mdpi.com/2079-6412/15/4/404]
- 37. Imaging flow cytometry: from high - resolution ... [https://www.frontiersin.org/journals/bioengineering-and-biotechnology/articles/10.3389/fbioe.2025.1580749/full]
- 38. Fluorescence Fundamentals | Thermo Fisher Scientific - US [https://www.thermofisher.com/us/en/home/references/molecular-probes-the-handbook/introduction-to-fluorescence-techniques.html]
- 39. Overcoming Limitations to Multiplexed Fluorescence ... [https://fluorofinder.com/limitations-multiplex-microscopy/]
- 40. Unlocking autofluorescence in the era of full spectrum analysis [https://pmc.ncbi.nlm.nih.gov/articles/PMC9519814/]
- 41. Pixel-by-pixel autofluorescence corrected FRET in ... [https://www.nature.com/articles/s41598-023-30098-w]
- 42. Flow Cytometry in the Diagnosis of Leukemias - NCBI [https://www.ncbi.nlm.nih.gov/books/NBK586209/]
- 43. How to Prepare Spectral Flow Cytometry Datasets for High ... [https://www.frontiersin.org/journals/immunology/articles/10.3389/fimmu.2021.768113/full]
- 44. Flow Cytometry Troubleshooting Tips [https://www.elabscience.com/resources/flow-cytometry-experiment-guidelines-and-q-a/1065?srsltid=AfmBOopHl61W1FkhwGeTjm-Mxo0gzpE9qkxQrOkWFg4my906e-yOw8Oy]
- 45. Why the immune fluorescence result has high background? [https://www.sinobiological.com/category/if-icc-troubleshooting-high-background]
- 46. The Ultimate Guide to Cell Viability Measurement [https://logosbio.com/the-ultimate-guide-to-cell-viability-measurement/]
- 47. The Importance Of Accurate Cell Counting In Flow ... [https://www.thermofisher.com/us/en/home/life-science/cell-analysis/cell-analysis-learning-center/cell-analysis-resource-library/cell-analysis-application-notes/importance-accurate-cell-counting-flow-cytometry-cell-sorting.html]
- 48. Quantification of cellular viability by automated microscopy ... [https://pmc.ncbi.nlm.nih.gov/articles/PMC4496231/]
- 49. Quantitative assessment of cell viability based on flow cytometry and microscopy - PubMed [https://pubmed.ncbi.nlm.nih.gov/23081720/]
- 50. Estimation of cell survival by flow cytometric ... - PubMed [https://pubmed.ncbi.nlm.nih.gov/2736519/]
- 51. Fluorochrome Selection | Cytometry [https://cytometry.mlsascp.com/fluorochrome-selection.html]
- 52. Panel Design [https://www.bdbiosciences.com/en-us/resources/panel-design]
- 53. Evaluating cell viability assessment techniques [https://pubmed.ncbi.nlm.nih.gov/41044769/]
- 54. New & Emerging Spectral Flow Cytometry Instrumentation [https://fluorofinder.com/new-and-emerging-spectral-flow-cytometry-instrumentation/]
- 55. Accessible and accurate cytometry analysis using ... [https://pmc.ncbi.nlm.nih.gov/articles/PMC11785219/]
- 56. Review Technologic advances in flow cytometry [https://www.sciencedirect.com/science/article/abs/pii/S0009898125004462]
- 57. Automated cytometric gating with human-level ... [https://www.nature.com/articles/s41467-025-56622-2]
- 58. Image Cytometry [https://tissuegnostics.com/introduction-spatial-tissue-cytometry]
- 59. Advantages & Limitations of Flow Cytometry [https://lifesciences.danaher.com/us/en/products/flow-cytometers/topics/non-sorting-flow-cytometry.html]