Fluorescein Diacetate (FDA) Dye Uptake Assay: A Complete Guide from Protocol to Advanced Applications
This comprehensive guide details the fluorescein diacetate (FDA) dye uptake assay, a fundamental technique for assessing cell membrane integrity and metabolic activity.
Fluorescein Diacetate (FDA) Dye Uptake Assay: A Complete Guide from Protocol to Advanced Applications
Abstract
This comprehensive guide details the fluorescein diacetate (FDA) dye uptake assay, a fundamental technique for assessing cell membrane integrity and metabolic activity. Tailored for researchers, scientists, and drug development professionals, it covers the foundational principles of FDA hydrolysis by intracellular esterases, provides step-by-step protocols for diverse applications from mammalian cells to extracellular vesicles, and offers advanced troubleshooting and validation strategies. By integrating methodological depth with practical optimization and comparative analysis, this article serves as an essential resource for implementing robust, reproducible FDA assays in quality control, toxicology, and therapeutic development.
Understanding Fluorescein Diacetate: Principles and Cellular Mechanisms
The fluorescein diacetate (FDA) assay is a fundamental tool in cell biology for assessing cell viability, metabolic activity, and membrane integrity. Its core principle hinges on the biochemical conversion of a non-fluorescent, membrane-permeant molecule into a fluorescent, membrane-impermeant product retained within living cells. This transformation provides researchers with a direct visual and quantifiable measure of cellular esterase activity and plasma membrane integrity, two key indicators of cell viability [1]. The assay is widely applicable across diverse cell types, from mammalian and microbial systems to environmental samples, making it a versatile mainstay in research and diagnostic laboratories [2] [3] [4].
This application note details the underlying mechanism of the FDA assay and provides standardized protocols for its use in various experimental contexts, supported by optimized parameters and key reagent solutions.
Core Biochemical Mechanism
The mechanism of the FDA assay involves a two-step biochemical transformation that exploits the differential permeability of the substrate and its product.
- Step 1: Passive Diffusion: FDA is a non-polar, hydrophobic, and non-fluorescent compound. Due to its lipophilicity, it readily passively diffuses across the intact plasma membranes of both live and dead cells [3] [1].
- Step 2: Enzymatic Hydrolysis and Fluorescent Conversion: Once inside the cell, FDA serves as a substrate for ubiquitous intracellular nonspecific esterases. These enzymes hydrolyze FDA, cleaving its acetate groups to release fluorescein [2] [1]. This hydrolyzed product is hydrophilic, charged, and highly fluorescent, exhibiting strong absorption at approximately 490 nm and emission in the visible wavelength range [2].
- Step 3: Intracellular Retention: The charged nature of fluorescein prevents it from freely diffusing out of the cell. Consequently, it accumulates intracellularly, but only in cells with an intact plasma membrane. In dead or damaged cells with compromised membranes, fluorescein rapidly leaks out into the extracellular space [1]. Therefore, the retention of the bright green fluorescence directly correlates with both enzymatic activity (a metabolic function) and structural integrity of the plasma membrane.
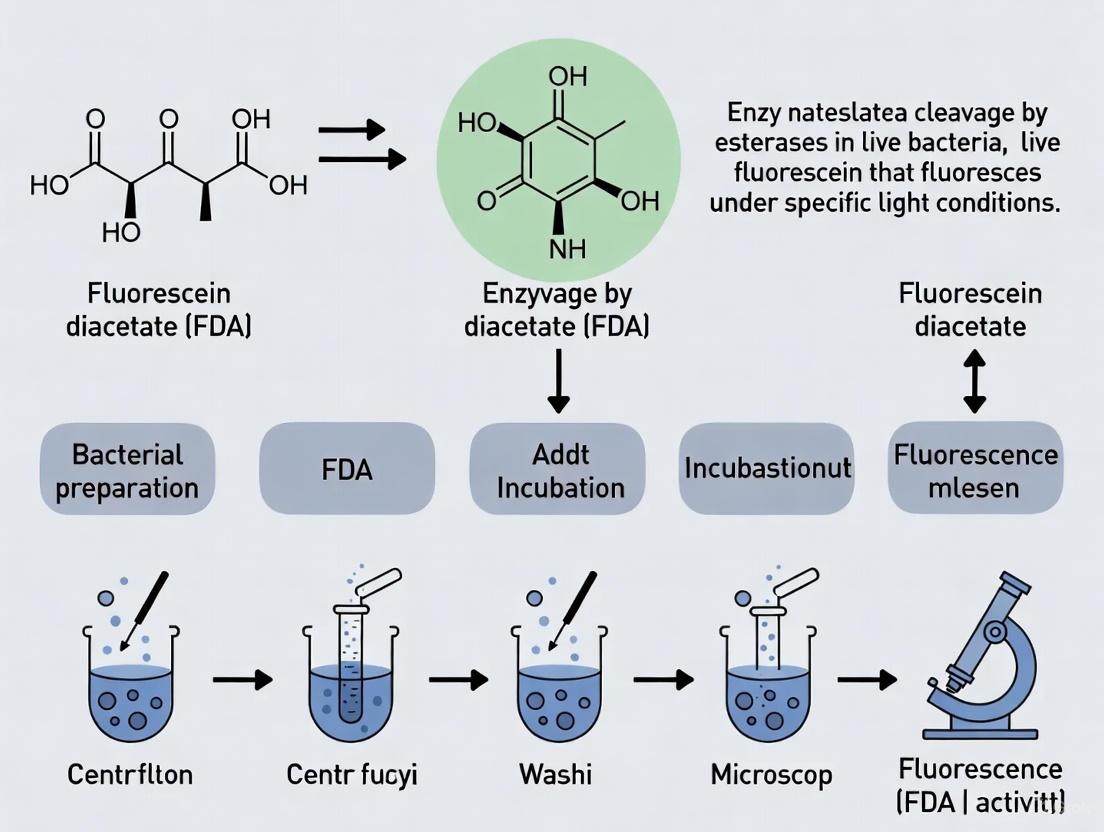
The following diagram illustrates this core principle and a generalized experimental workflow:
Critical Experimental Parameters and Optimization
Successful implementation of the FDA assay requires careful optimization of key parameters. Inconsistent results in the literature are often attributable to variations in these factors [4]. The following tables summarize optimized conditions from published studies.
Table 1: Optimized FDA Assay Parameters for Different Cell Types
| Cell Type | Optimal FDA Concentration | Optimal Incubation Time | Temperature | Key Buffer Considerations | Citation |
|---|---|---|---|---|---|
| Cyanobacteria (Microcystis aeruginosa) | 10 mg/L | 14 - 21 minutes | Not specified | Initial pH (6-9) had no significant effect on results. | [3] |
| Mammalian Renal Cells (RC-124, 786-O, Caki-1) | ~ 5 µg/mL (from 5 µg/mL stock) | 30 minutes (for loading) | On ice | Phosphate-Buffered Saline (PBS) used for staining and washing. | [5] |
| General Cell Types (Theoretical) | 1 – 25 µM | 30 minutes (typical) | 37°C | Serum-containing media (e.g., DMEM+) can be used. Dye retention is cell-type dependent. | [1] |
| Soil Microbial Activity | Method-dependent | 1 - 3 hours | Not specified | Buffered at pH 7.6 for maximum hydrolysis rate; acetone as stop reagent can quench signal. | [2] |
Table 2: Co-Staining with Propidium Iodide (PI) for Viability
| Parameter | Optimized Condition | Rationale | Citation |
|---|---|---|---|
| PI Concentration | 10 µM | Effective for staining Microcystis aeruginosa without excessive background. | [3] |
| Staining Outcome | Cells with intact membranes: bright green (FDA).Cells with damaged membranes: bright orange (PI). | PI is membrane-impermeant and only enters dead cells, intercalating with DNA. | [3] |
| Assay Limitation | Results may not directly correlate with functional outcomes like islet transplantation success. | Highlights the assay's role in assessing membrane integrity, which is one aspect of viability. | [4] |
Detailed Experimental Protocols
Protocol 1: FDA Uptake Assay for Mammalian Cells (Flow Cytometry)
This protocol is adapted from studies on renal cell lines and is suitable for quantitative, single-cell analysis of membrane integrity [5].
Research Reagent Solutions:
- Fluorescein Diacetate (FDA): Prepare a 1-5 mg/mL stock solution in high-quality dimethyl sulfoxide (DMSO). Aliquot and store at -20°C.
- Propidium Iodide (PI) or Ethidium Bromide (EtBr): Prepare a 120 µg/mL solution in PBS.
- Staining Solution: Combine FDA stock and PI/EtBr stock in PBS to achieve a final working concentration of ~20 µg/mL FDA and ~20 µg/mL PI/EtBr. Prepare fresh before use.
- Phosphate-Buffered Saline (PBS)
- Cell Culture Medium with Serum (e.g., RPMI 1640 with 10% FBS)
Methodology:
- Cell Preparation: Harvest nearly confluent cells using trypsin/EDTA. Neutralize trypsin with a stop solution (PBS with 10% FBS). Adjust cell concentration to 1 x 10^6 cells/mL and keep on ice.
- Staining: Combine 400 µL of cell suspension with 200 µL of PBS (with or without a permeabilizing agent as a experimental control) and 200 µL of the prepared staining solution.
- Incubation: Incubate the mixture on ice for 5 minutes in the dark to allow for FDA uptake and hydrolysis.
- Washing: Add 2 mL of cold PBS to the mixture. Sediment cells by centrifugation (5 min at 300 x g, 4°C). Carefully decant the supernatant.
- Resuspension and Analysis: Resuspend the cell pellet in 300 µL of PBS. Analyze immediately using a flow cytometer equipped with a 488 nm laser. Exclude cell debris and doublets using standard forward-scatter and side-scatter gating strategies. Detect fluorescein (viable cells) at ~515-530 nm and PI/EtBr (dead cells) at >617 nm [5] [4].
Protocol 2: FDA-Release Assay for Quantifying Membrane Damage (Plate Reader)
This protocol measures the release of pre-loaded fluorescein from cells upon membrane damage, providing a bulk fluorescence measurement [5].
Methodology:
- Cell Loading: Incubate cells at a concentration of 1 x 10^6 cells/mL with 5 µg/mL FDA in PBS for 30 minutes in the dark on ice.
- Washing: Wash the cells three times with cold PBS (3 min, 150 x g, 4°C) to thoroughly remove extracellular FDA.
- Treatment and Dye Release: Resuspend the FDA-loaded cells in PBS or treatment medium. Divide the suspension and treat one aliquot with a membrane-disrupting agent (e.g., 0.001% Triton X-100) and keep another as an untreated control.
- Separation and Measurement: Sediment the cells using gentle centrifugation (3 min, 27 x g, 4°C). Carefully collect 100 µL of the cell-free supernatant from each sample.
- Analysis: Transfer the supernatant to a 96-well plate. Measure the fluorescence in a plate reader using an excitation wavelength of ~490 nm and an emission wavelength of ~520 nm. A significant increase in fluorescence in the supernatant of treated cells indicates loss of membrane integrity and release of fluorescein [5].
The Scientist's Toolkit: Essential Reagents and Materials
Table 3: Key Research Reagent Solutions for FDA-Based Assays
| Reagent / Material | Function / Principle of Action | Key Considerations |
|---|---|---|
| Fluorescein Diacetate (FDA) | Non-fluorescent, lipophilic substrate that diffuses into cells. Hydrolyzed by esterases to fluorescent fluorescein. | Stock solutions in DMSO are stable at -20°C. Final working concentrations are typically in the 1-25 µM range [1]. |
| Propidium Iodide (PI) | Cell-impermeant nucleic acid stain. Binds to DNA/RNA in cells with compromised membranes, producing red fluorescence. | Used as a counterstain for dead cells. Often used in a molar excess to displace permeable green stains in dead cells [3] [4]. |
| Calcein AM | An alternative esterase substrate. Hydrolyzed to a green-fluorescent, polyanionic product (calcein) with superior cellular retention compared to fluorescein [1]. | Less pH-sensitive and leaks more slowly from viable cells than fluorescein, making it a premier indicator for long-term viability assays [1]. |
| SYTO Green Stains | Cell-permeant nucleic acid stains that label all cells (live and dead). | Used in combination with PI for two-color viability assays based solely on membrane integrity [4]. |
| Dimethyl Sulfoxide (DMSO) | Solvent for preparing stable, concentrated stock solutions of FDA and other esterase substrates. | Final concentration in the assay should be kept low (e.g., <0.1-1.0%) to avoid cellular toxicity. |
The Crucial Role of Intracellular Esterases in FDA Hydrolysis
Fluorescein diacetate (FDA) is a non-fluorescent, lipophilic compound that serves as a crucial substrate for assessing cell viability, enzymatic activity, and membrane integrity across diverse biological systems. The utility of FDA stems from its unique biochemical properties: its ability to passively diffuse across intact cell membranes and subsequent hydrolysis by intracellular esterases to release fluorescein, a highly fluorescent product. This transformation from a non-fluorescent precursor to a fluorescent compound provides a readily detectable signal that correlates directly with enzymatic activity and cell viability [6].
The process of FDA hydrolysis serves as a fundamental marker in numerous applications, ranging from microbial activity assessments in environmental samples to viability assays in mammalian cell cultures and drug discovery research [2]. The widespread use of this method across disciplines highlights its reliability and the fundamental biological principles it represents. Understanding the precise mechanisms governing FDA uptake and hydrolysis is essential for proper experimental design and accurate interpretation of results in research and diagnostic applications.
Mechanism of FDA Hydrolysis
The hydrolysis of fluorescein diacetate occurs through a well-defined biochemical process that involves both physical transport and enzymatic conversion, making it a robust indicator of cellular metabolic activity and membrane integrity.
Uptake and Transport
FDA enters cells through passive diffusion across the lipid bilayer of the cell membrane. Research with Saccharomyces cerevisiae has demonstrated that the uptake rate increases in direct proportion to the extracellular FDA concentration and does not exhibit saturation kinetics, confirming that transport occurs via passive diffusion rather than carrier-mediated mechanisms [7]. The permeability coefficient for FDA derivatives has been calculated at approximately 1.3 × 10⁻⁸ m·s⁻¹, indicating efficient membrane crossing capability [7] [8].
Enzymatic Conversion
Once inside the cell, FDA serves as a substrate for intracellular esterases that cleave the acetate groups from the fluorescein core. This hydrolysis reaction occurs in two stages:
- First, FDA is converted to fluorescein monoacetate
- Subsequently, the monoacetate is hydrolyzed to free fluorescein [2]
The free fluorescein molecule exhibits strong fluorescence with excitation and emission maxima at approximately 490 nm and 514 nm respectively, and a high molar extinction coefficient of 93,000 in potassium phosphate buffer at pH 9 [4].
Cellular Retention
The enzymatic conversion confers a critical change in the chemical properties of the molecule. While FDA is lipophilic and membrane-permeable, fluorescein is hydrophilic and membrane-impermeable due to its charged state at physiological pH. This polarity change traps the fluorescent product within cells with intact membranes, allowing for the discrimination between viable and non-viable cells [9] [6].
Table 1: Key Spectral Properties of FDA and Its Hydrolysis Product
| Compound | Excitation Maximum (nm) | Emission Maximum (nm) | Molar Extinction Coefficient | Fluorescence |
|---|---|---|---|---|
| FDA | <300 | None | Not applicable | Non-fluorescent |
| Fluorescein | 490 | 514 | 93,000 (KPO₄/pH9) | Strong green fluorescence |
Kinetic Parameters of FDA Hydrolysis
The enzymatic hydrolysis of FDA follows characteristic kinetic patterns that vary depending on the biological system and experimental conditions. Understanding these parameters is essential for optimizing assay conditions and interpreting results accurately.
Enzyme Kinetics
Studies with Saccharomyces cerevisiae have revealed that FDA hydrolysis in cell extracts at 40°C follows first-order reaction kinetics with a rate constant (K) of 0.33 s⁻¹ [7] [8]. In contrast, the hydrolysis of carboxyfluorescein diacetate (cFDA), an FDA derivative, follows Michaelis-Menten kinetics with an apparent Vmax of 12.3 nmol·min⁻¹·mg protein⁻¹ and Km of 0.29 mM [7].
The rate-limiting step in fluorescein accumulation is the esterase activity itself, as FDA transport occurs faster than its hydrolysis. For cFDA, however, the slower transport through the cell envelope limits the accumulation of the fluorescent product [7]. This distinction highlights the importance of considering both membrane permeability and enzymatic activity when designing experiments with different fluorescein esters.
Optimal Conditions
The hydrolysis rate of FDA is highly dependent on environmental conditions. The reaction reaches its maximum rate between pH 7.0 and 8.0, with optimal activity observed at approximately pH 7.6 [2]. Temperature also significantly influences the reaction rate, with higher temperatures accelerating hydrolysis up to the point of enzyme denaturation.
Table 2: Kinetic Parameters of FDA Hydrolysis in Different Systems
| Organism/System | Temperature (°C) | Kinetic Model | Rate Constant (K) | Vmax | Km |
|---|---|---|---|---|---|
| S. cerevisiae extracts | 40 | First-order | 0.33 s⁻¹ | Not applicable | Not applicable |
| S. cerevisiae extracts (cFDA) | 40 | Michaelis-Menten | Not applicable | 12.3 nmol·min⁻¹·mg⁻¹ | 0.29 mM |
| Soil microbial communities | 20-25 | Not specified | Variable | Dependent on microbial biomass | Dependent on system |
Experimental Protocols
Well-standardized protocols are essential for obtaining reliable and reproducible results with FDA-based assays. The following sections provide detailed methodologies for different applications.
Cell Viability Staining Protocol
This protocol is adapted from established methods for mammalian cell staining and can be applied to various cell types with minimal modifications [10]:
Preparation of Stock Solution
- Prepare FDA stock solution at 0.5 mg/mL in anhydrous DMSO
- Store aliquots at -20°C protected from light
- Stable for several months under proper storage conditions
Staining Procedure
- Harvest cells and wash with PBS(-) to remove culture medium
- Prepare cell suspension at 1×10⁵ to 1×10⁶ cells/mL
- Dilute 10 μL FDA stock solution in 5 mL PBS(-) to create working solution
- Add 15 μL FDA working solution to 30 μL cell suspension
- Incubate at 37°C for 15-30 minutes in the dark
Detection and Analysis
- Place 10 μL stained cell suspension on glass slide and coverslip
- Observe under fluorescence microscope with 488 nm excitation and 530 nm emission filters
- Viable cells with intact membranes and esterase activity display green fluorescence
- Counterstain with propidium iodide (PI) for dead cell identification if required
Soil Microbial Activity Assay
This protocol measures total microbial activity in soil samples through FDA hydrolysis [2]:
Reagent Preparation
- Prepare FDA solution: 4.9 mM in acetone
- Prepare phosphate buffer: 60 mM, pH 7.6
- Prepare stopping solution: chloroform:methanol (2:1 v/v)
Assay Procedure
- Add 1.0 g of soil sample to 50 mL centrifuge tube
- Add 10 mL phosphate buffer and 0.1 mL FDA solution
- Incubate with shaking at 20-25°C for 3 hours
- Terminate reaction by adding 10 mL stopping solution
- Centrifuge at 2700 × g for 5 minutes
- Measure supernatant absorbance at 490 nm
Calculation
- Prepare fluorescein standard curve (0-10 μg/mL)
- Calculate soil microbial activity as μg fluorescein formed per g dry soil per hour
Membrane Permeability Assessment
This dual-assay approach combines FDA uptake and release measurements for comprehensive membrane integrity assessment [9]:
FDA Uptake Assay Protocol:
- Prepare cell suspension (∼10⁶ cells/mL) in appropriate buffer
- Mix 400 μL cell suspension with 200 μL PBS containing Triton X-100 (concentration range: 10⁻⁵% to 10⁻²%)
- Add 200 μL staining solution (120 μg/mL EtBr + 20 μg/mL FDA in PBS)
- Incubate on ice for 5 minutes in the dark
- Add 2 mL PBS, sediment cells (300 × g, 5 minutes, 4°C)
- Resuspend in 300 μL PBS and analyze by flow cytometry
- Calculate mean fluorescence intensity (MFI) using FlowJo or similar software
FDA Release Assay Protocol:
- Incubate cells with 5 μg/mL FDA in PBS for 30 minutes in the dark on ice
- Wash cells three times with PBS (150 × g, 3 minutes, 4°C)
- Treat with Triton X-100 (e.g., 10⁻³%) or test compound
- Sediment cells (27 × g, 3 minutes, 4°C)
- Collect 100 μL supernatant and analyze in fluorescence plate reader
- Set excitation to ~300 nm and emission to 520 nm
- Express data as relative fluorescence units (RFU)
Research Reagent Solutions
Successful FDA-based assays require specific reagents and materials optimized for different experimental systems. The following table outlines essential components and their functions.
Table 3: Essential Reagents for FDA-Based Assays
| Reagent/Material | Specifications | Function | Application Notes |
|---|---|---|---|
| Fluorescein Diacetate (FDA) | High purity (>95%), MW: 416.38 [10] | Membrane-permeable substrate for esterases | Prepare stock in DMSO; protect from light |
| Dimethyl Sulfoxide (DMSO) | Anhydrous, molecular biology grade | Solvent for FDA stock solution | Maintain anhydrous conditions; store with desiccant |
| Phosphate Buffered Saline (PBS) | Without Ca²⁺/Mg²⁺ (PBS-) | Cell washing and suspension | Maintain physiological pH and osmolarity |
| Propidium Iodide (PI) | 1.5 mM aqueous solution | Membrane-impermeant dead cell stain | Final concentration 4-15 μM; exclude from viable cells |
| Ethidium Bromide (EB) | 500 μM aqueous solution | Alternative dead cell stain | Final concentration 75-500 μM [4] |
| Triton X-100 | Laboratory grade detergent | Positive control for membrane permeabilization | Use concentration range 10⁻⁵% to 10⁻²% [9] |
| Carboxyfluorescein Diacetate (cFDA) | Higher retention in Gram-negative cells [6] | Alternative substrate with better cellular retention | Particularly useful for bacterial systems |
Applications in Research
The hydrolysis of FDA by intracellular esterases serves as a fundamental principle in numerous research applications, each leveraging the direct relationship between enzymatic activity and fluorescent signal generation.
Cell Viability and Membrane Integrity
FDA hydrolysis is extensively used for assessing cell viability through the combined evaluation of esterase activity and membrane integrity [6]. Viable cells with active esterases and intact membranes hydrolyze FDA to fluorescein, which is retained and produces green fluorescence. Non-viable cells with compromised membranes either lack esterase activity or cannot retain the fluorescein product. This principle forms the basis for widely used live/dead assays, often combined with membrane-impermeant DNA stains like propidium iodide that selectively label dead cells [4].
Microbial Activity in Environmental Samples
In environmental microbiology, FDA hydrolysis serves as a sensitive indicator of total microbial activity in soil, water, and other samples [2]. The method correlates well with established measures of microbial biomass such as ATP content and cell density studies. Its advantages include simplicity, rapidity, and sensitivity compared to more complex methods like radio-labeled thymidine incorporation into microbial DNA. The assay has been successfully adapted for various environmental matrices including stream sediment biofilms, activated sludge, and deep-sea sediments.
Drug Discovery and Development
In pharmaceutical research, the principle of enzyme-activated substrate conversion underpins prodrug strategies and drug metabolism studies [11]. Esterase-activated prodrugs leverage the same fundamental biochemistry as FDA hydrolysis, where an inactive prodrug is converted to its active form by intracellular esterases. This approach enables targeted drug release in specific tissues or cell types with elevated esterase expression. Additionally, FDA-based assays help evaluate drug-induced cytotoxicity and membrane damage in preclinical testing [9].
Troubleshooting and Technical Considerations
Several technical factors can influence the outcome and interpretation of FDA hydrolysis assays. Addressing these considerations is essential for obtaining reliable results.
Methodological Limitations
- Fluorescein Leakage: Fluorescein exhibits relatively high leakage rates from some cell types compared to other fluorescent dyes like BCECF or calcein, potentially leading to underestimation of viable cells [10]
- Enzyme Specificity: FDA is hydrolyzed by multiple esterase enzymes with varying substrate affinities and kinetic properties, which can differ between cell types and physiological states [7]
- Background Hydrolysis: Spontaneous, non-enzymatic hydrolysis of FDA can occur at extreme pH values, contributing to background fluorescence [2]
Optimization Strategies
- pH Control: Maintain pH between 7.0-7.6 for optimal enzymatic activity while minimizing non-specific hydrolysis [2]
- Incubation Time: Determine optimal incubation time empirically for each cell type; typically 15-45 minutes for mammalian cells [10]
- Loading Temperature: Performing the loading step at reduced temperatures (e.g., on ice) can improve dye retention in some cell types [9]
- Dye Concentration: Use the lowest effective concentration of FDA to minimize potential toxicity and non-specific staining
Interpretation Challenges
- Viability Overestimation: Cells with intact membranes but inactive metabolism may retain some esterase activity, potentially leading to false positive viability signals
- Cell-Type Variability: Esterase activity and substrate preferences vary significantly between different cell types and species; cFDA may be preferable for Gram-negative bacteria where FDA may be cleaved by periplasmic enzymes [6]
- Functional Correlation: FDA hydrolysis indicates esterase activity and membrane integrity but does not necessarily correlate with other cellular functions; studies with islets of Langerhans showed poor correlation between FDA/PI staining and transplantation success [4]
Why FDA is a Marker for Membrane Integrity and Cell Viability
Assessing cell viability, defined as the proportion of living, healthy cells within a population, is fundamental in pharmaceutical development, toxicology screening, and basic biological research [12]. Among the various methods available, assays utilizing fluorescein diacetate (FDA) provide a rapid, sensitive approach grounded in two fundamental cellular characteristics: membrane integrity and functional enzymatic activity [7] [12]. This application note details the scientific principles behind FDA-based viability testing and provides standardized protocols for its use in laboratory settings.
The utility of FDA hydrolysis extends beyond mammalian cell lines; it serves as a well-established measure of total microbial activity in environmental and agricultural samples, confirming the widespread presence of the necessary enzymes across biological kingdoms [2].
Scientific Principle: The Mechanism of FDA Hydrolysis
Fluorescein diacetate (3′,6′-diacetyl-fluorescein) is a non-fluorescent, lipophilic compound that readily crosses intact cell membranes due to its hydrophobic nature [12]. Once inside a viable cell, intracellular esterases hydrolyze FDA, cleaving the acetate groups to yield fluorescein, a hydrophilic and intensely fluorescent compound [7] [12]. This hydrolyzed product accumulates intracellularly because its charged nature prevents it from diffusing back across the intact plasma membrane [12]. Consequently, fluorescence accumulation serves as a direct indicator of both membrane integrity and metabolic competence.
Diagram: FDA Hydrolysis Mechanism in a Viable Cell
The diagram below illustrates the mechanism of fluorescein diacetate (FDA) hydrolysis in a viable cell, demonstrating how intact membrane integrity and intracellular enzyme activity lead to fluorescent signal accumulation.
In non-viable cells, the plasma membrane is compromised. While FDA may still enter, the damaged membrane cannot trap the fluorescein, which rapidly leaks out. Additionally, cells with severely compromised metabolic function may lack the necessary esterase activity, preventing fluorescence development [12] [13].
Quantitative Comparison of Cell Viability Assays
Researchers must select a viability assay based on their specific endpoint, available resources, and the characteristics of the method [12]. The table below summarizes common assays, including FDA hydrolysis, based on the Organisation for Economic Co-operation and Development (OECD) classification system, which helps ensure regulatory compliance [12].
Table 1: Comparison of Common Cell Viability Assay Methods
| Assay Method | Principle / Measured Endpoint | Key Advantages | Key Limitations |
|---|---|---|---|
| FDA Hydrolysis | Uptake of lipophilic probe & hydrolysis by intracellular esterases; fluorescence accumulation indicates viability [12]. | Rapid, sensitive; indicates both membrane integrity and metabolic activity. | Fluorescein product can leak from viable cells with active export pumps [7] [12]. |
| Trypan Blue Exclusion | Dye penetration into and staining of cells with compromised membranes (dead cells) [12] [13]. | Simple, cost-effective; direct microscopic observation. | Short incubation time to avoid false positives can lead to underestimation of dead cells [12]. |
| Propidium Iodide (PI) Uptake | Dye enters cells with damaged membranes, binds to nucleic acids, and fluoresces red [12] [13]. | Well-established for flow cytometry; specific for membrane integrity. | False positives can occur due to changes in osmolarity or spontaneous invagination [12]. |
| Lactate Dehydrogenase (LDH) Release | Measures release of cytoplasmic enzyme LDH into supernatant upon membrane damage [12]. | Can be performed without cell lysis; suitable for high-throughput screening. | Enzyme can leak from stressed but viable cells; high background in some media [12]. |
| Neutral Red Uptake (NRU) | Viable cells incorporate and bind the supravital dye neutral red in lysosomes [13] [14]. | ICCVAM-recommended for predicting starting doses for acute oral toxicity [14]. | Uptake decrease may reflect lysosomal damage rather than immediate cell death [13]. |
| MTT/MTS Assay | Measures metabolic activity via mitochondrial reductase enzymes converting tetrazolium salts to formazan [12]. | Measures metabolic competence directly. | Results can be influenced by cellular metabolic rates and incubation time [12]. |
Experimental Protocol: FDA-Based Cell Viability Assay
This protocol is adapted for a 96-well plate format using adherent mammalian cells, providing a scalable method for screening applications.
Reagent and Material Preparation
Research Reagent Solutions
| Item | Function / Description |
|---|---|
| Fluorescein Diacetate (FDA) | Stock solution: Prepare at 1-5 mg/mL in acetone or DMSO. Store at -20°C protected from light [2]. |
| FDA Working Solution | Dilute stock in appropriate buffer (e.g., PBS or culture medium without serum) to a final concentration of 1-10 µg/mL. Prepare fresh before use [2]. |
| Cell Culture Medium | Serum-free is recommended for the assay step to avoid esterase activity in serum. |
| Lysis/Fixation Solvent | Acetone (50-80% v/v) or Ethanol (96%). Terminates reaction and extracts dye. Note: Acetone can cause significant fluorescein color loss [2]. |
| Phosphate Buffered Saline (PBS) | For rinsing cells to remove residual test material and FDA. |
| Microplate Fluorescence Reader | Instrument equipped with filters for excitation (~490 nm) and emission (~515-520 nm) for fluorescein detection. |
Step-by-Step Workflow
Diagram: FDA Assay Workflow
Critical Parameters and Optimization
- FDA Concentration and Incubation Time: Must be determined empirically for each cell type. Over-incubation can lead to false positives from non-specific hydrolysis or dye leakage [7]. A time course experiment is recommended.
- pH: The hydrolysis reaction exhibits maximum rate between pH 7.0 and 8.0 [2]. Conducting the assay outside this range can reduce sensitivity.
- Solvent for Termination: While acetone (50% v/v) effectively stops hydrolysis, it can cause a substantial decrease in fluorescein absorbance [2]. Ethanol (96%) may be a preferable alternative.
- Controls: Always include:
- Negative Control: Cells with solvent/vehicle only (defines 100% viability).
- Positive Control: Cells treated with a cytotoxic agent (e.g., 70% ethanol) (defines 0% viability).
- Blank: Wells with FDA working solution but no cells (accounts for background fluorescence).
Regulatory Context and Application in Drug Development
The FDA hydrolysis assay fits within a broader regulatory framework aimed at advancing New Alternative Methods (NAMs) that can replace, reduce, and refine animal testing (the 3Rs) [15]. Regulatory bodies like the U.S. Food and Drug Administration (FDA) encourage the qualification of alternative methods for specific contexts of use [15].
For instance, the ISTAND (Innovative Science and Technology Approaches for New Drugs) pilot program is designed to expand the types of drug development tools, including novel nonclinical assays, that can be qualified for regulatory use [15]. Furthermore, the OECD provides standardized test guidelines, such as Test Guideline No. 437, which uses a reconstructed human cornea-like epithelium model to replace rabbit tests for eye irritation, demonstrating the regulatory acceptance of alternative methods based on principles similar to dye-uptake assays [15].
The fluorescein diacetate (FDA) hydrolysis assay remains a powerful, rapid, and sensitive technique for evaluating cell viability by simultaneously reporting on two critical cellular parameters: plasma membrane integrity and intracellular esterase activity. Its adaptability to various formats, from microplates to flow cytometry, makes it a versatile tool for researchers in drug discovery, toxicology, and basic cell biology. By following the optimized protocols and critical parameter guidance outlined in this document, scientists can reliably employ this assay to generate robust and meaningful viability data.
Key Advantages and Inherent Limitations of the FDA Assay System
The Food and Drug Administration (FDA) assay system encompasses a rigorous framework of test procedures, acceptance criteria, and regulatory standards that govern the evaluation of new drug substances and products. Established to ensure the safety, efficacy, and quality of pharmaceuticals and medical devices, this system provides a critical foundation for public health protection. The fundamental principle underpinning this framework is the establishment of specifications—defined as a list of tests, analytical procedures, and acceptance criteria that a drug substance or product must conform to for its intended use [16]. These specifications are not merely administrative hurdles; they constitute a scientifically rigorous set of controls designed to confirm product quality rather than establish full characterization, focusing specifically on those characteristics essential for ensuring patient safety and therapeutic efficacy [16].
Within this broader regulatory context, the Fluorescein Diacetate (FDA) assay serves as a vital experimental tool for researchers investigating cellular viability and enzymatic activity. While sharing the "FDA" acronym with the regulatory agency, this biochemical assay provides critical functional data that can support regulatory submissions by quantifying esterase activity and cell membrane integrity. This application note explores both the regulatory framework of the FDA assay system and the practical implementation of the fluorescein diacetate assay, detailing their interconnected advantages and limitations in the drug development pipeline.
Key Advantages of the FDA Assay System
Standardization and Global Harmonization
Unified Quality Standards: The FDA assay system provides a systematic approach to test selection and acceptance criteria justification, facilitating the establishment of a single set of global specifications for new drug substances and products [16]. This harmonization is crucial for multinational pharmaceutical companies seeking market approval across different regulatory jurisdictions, as it reduces redundant testing and streamlines development workflows.
Structured Validation Frameworks: For specific product categories like in vitro diagnostic devices, the FDA provides detailed performance characterization guidelines that establish clear expectations for manufacturers [17]. This includes specific recommendations for analytical sensitivity, analytical specificity, precision, and clinical performance studies, creating a predictable pathway for assay validation and regulatory submission.
Comprehensive Quality Assurance
Holistic Quality Approach: The FDA system emphasizes that specifications represent just one component of a comprehensive quality assurance strategy that also includes thorough product characterization during development, adherence to Good Manufacturing Practices, validated manufacturing processes, and raw materials testing [16]. This multi-layered approach provides overlapping safeguards to ensure consistent product quality.
Risk-Based Testing Strategies: The system incorporates flexible concepts such as periodic or skip testing, where certain tests may be performed less frequently than others based on historical data and demonstrated process understanding [16]. This risk-based approach allows manufacturers to optimize resource allocation while maintaining quality oversight.
Data Integrity and Reliability Enforcement
Stringent Data Verification: The FDA maintains active surveillance of testing data quality, taking enforcement action against third-party testing firms when data integrity concerns are identified [18]. This commitment to data verification ensures that the information supporting regulatory decisions is reliable and accurately represents product safety and performance.
Technical Conformance Standards: The agency provides detailed technical specifications for study data submission, ensuring consistent formatting, structure, and quality of regulatory submissions [19]. These standards facilitate more efficient review processes and enhance the reliability of electronic data submissions.
Inherent Limitations of the FDA Assay System
Regulatory and Implementation Challenges
Resource Intensiveness: Implementing the full requirements of the FDA assay system necessitates substantial financial investment and technical expertise. For molecular diagnostics, instrumentation costs alone can range from
$35,000to$85,000per instrument, with additional expenses for reagents, technical time, and quality control activities [20]. These resource requirements can create significant barriers to entry for smaller developers and researchers.Staffing and Review Capacity Constraints: Recent FDA staffing challenges have created uncertainty in the regulatory landscape, particularly for medical devices [21]. While the Center for Devices and Radiological Health has worked to maintain review capacity, broader agency instability has raised concerns about potential delays in pre-submission feedback and review timelines, potentially impacting time-to-market for new products.
Data Integrity Vulnerabilities: Despite enforcement efforts, instances of falsified or invalid data from third-party testing facilities have been identified, compromising the reliability of associated premarket submissions [18]. These integrity concerns highlight vulnerabilities in the oversight ecosystem that can ultimately impact public health if undetected.
Technical and Analytical Limitations
Diagnostic Test Performance Variability: Even FDA-approved diagnostic tests demonstrate significant performance variability across different contexts and sample types. For example, Rapid Antigen Direct Tests exhibit highly variable sensitivities ranging from
10%to75%depending on the viral target, patient age, sample collection, and symptom duration [20]. This variability necessitates careful consideration of test limitations in clinical decision-making.Evolving Technology Gaps: The regulatory framework necessarily lags behind rapidly evolving technological advancements in some areas. As noted in FDA guidance, "evolving technologies" present ongoing challenges for standardization, as established test procedures may not adequately address novel methodologies or platforms [16].
Table 1: Comparative Performance of Respiratory Virus Detection Methods
| Method Type | Example Methods | Approximate Sensitivity Range | Time to Result | Key Limitations |
|---|---|---|---|---|
| Rapid Antigen Direct Tests (RADTs) | Influenza, RSV tests | 10%-75% [20] | Minutes | Variable performance, lower sensitivity in adults |
| Direct Fluorescent Antibody (DFA) | Respiratory virus panels | ~50%->80% [20] | 30-60 minutes | Requires expertise, not widely available |
| Nucleic Acid Amplification Tests (NAATs) | PCR-based methods | High (>80%) [20] | Hours to days | Higher cost, technical complexity |
| Traditional Viral Culture | Tube cell culture | Variable (as low as 50% for RSV) [20] | Days to weeks | Slow results limit clinical utility |
Fluorescein Diacetate (FDA) Dye Uptake Assay: Protocol and Research Applications
Experimental Principle and Workflow
The fluorescein diacetate assay operates on the biochemical principle that non-fluorescent FDA molecules passively cross intact cell membranes, where intracellular esterases hydrolyze them into fluorescent fluorescein. This conversion creates a bright yellow-green fluorescence in viable cells with functional enzymatic activity and membrane integrity [22]. The intensity of this fluorescence serves as a quantitative measure of cell viability and metabolic activity, making the assay particularly valuable for cytotoxicity screening, drug efficacy testing, and cellular health assessment in research applications.
The diagram below illustrates the core workflow and biochemical transformation central to the FDA assay procedure:
Detailed Experimental Protocol
Reagent Preparation
FDA Stock Solution: Prepare a 5 mg/mL stock solution of fluorescein diacetate in high-quality acetone or DMSO. Aliquot and store at
-20°Cprotected from light. Under these conditions, the solution remains stable for up to 6 months.Working FDA Solution: Dilute the stock solution in appropriate isotonic buffer (e.g., PBS, pH 7.4) to achieve a final concentration of 10-100 μg/mL immediately before use. Maintain this working solution on ice and protect from light, using within 2 hours of preparation.
Cell Preparation: Culture cells under standard conditions appropriate for the specific cell type. Harvest cells during exponential growth phase and prepare a single-cell suspension. Adjust cell density to
1×10^5to1×10^6cells/mL in buffer or growth medium without phenol red.
Staining Procedure
Incubation: Combine 100 μL of cell suspension with 100 μL of FDA working solution in a microcentrifuge tube. Mix gently by inversion and incubate for 15-30 minutes at 37°C protected from light.
Reaction Termination: Following incubation, centrifuge samples at
300 × gfor 5 minutes. Carefully aspirate the supernatant and resuspend the cell pellet in 200 μL of fresh, pre-warmed buffer.Signal Measurement: Transfer the stained cell suspension to an appropriate measurement platform. For fluorescence microscopy, mount immediately and visualize. For quantitative analysis, transfer to a 96-well plate or flow cytometry tubes.
Detection and Analysis
Fluorescence Measurement: Quantify fluorescence intensity using a fluorescence microplate reader with excitation at
485 nmand emission detection at535 nm. Alternatively, analyze by flow cytometry using the FL1 channel or equivalent.Data Normalization: Include appropriate controls for background subtraction (unstained cells) and maximum fluorescence (fully viable cell population). Express results as relative fluorescence units or as a percentage of control viability.
Kinetic Analysis: For more sensitive assessment, consider performing time-course measurements to monitor the rate of fluorescence development, which correlates with enzymatic activity levels.
Research Reagent Solutions
Table 2: Essential Materials for FDA Dye Uptake Assays
| Reagent/Material | Function | Application Notes |
|---|---|---|
| Fluorescein Diacetate (FDA) | Fluorescent substrate | Converted to fluorescein by cellular esterases; indicates viability [22] |
| Dimethyl Sulfoxide (DMSO) | Solvent for stock preparation | Ensures complete dissolution of FDA; use high-purity grade |
| Phosphate Buffered Saline (PBS) | Isotonic buffer | Maintains physiological conditions during staining |
| Fluorescence Microplate Reader | Detection instrument | Enables quantitative measurement of fluorescence intensity |
| Flow Cytometer | Alternative detection system | Provides single-cell resolution and population analysis |
| Cell Culture Media | Maintains cell viability | Use without phenol red to minimize background fluorescence |
Regulatory Considerations for Assay Validation
Performance Characterization
For researchers developing FDA-based assays for regulatory submissions, comprehensive performance characterization aligned with FDA guidelines is essential. This includes establishing analytical sensitivity (limit of detection), analytical specificity (including cross-reactivity with non-target enzymes), and precision (repeatability and reproducibility) [17]. These performance metrics should be documented under the actual conditions of use, including specific instrument configurations, sample types, and operator variability.
Quality Control Implementation
Implement robust quality control procedures including system suitability tests and reference standards to ensure consistent assay performance. The FDA emphasizes the importance of appropriate reference standards for both drug substances and products, which should be thoroughly characterized and of the highest purity [16]. For FDA assays, this may include validated reference cell lines with known esterase activity and membrane integrity characteristics.
The FDA assay system provides a comprehensive regulatory framework with significant advantages in standardization, quality assurance, and public health protection. However, researchers must navigate its inherent limitations, including resource intensiveness, performance variability, and evolving regulatory challenges. The fluorescein diacetate dye uptake assay serves as a valuable research tool within this ecosystem, offering a relatively simple yet powerful method for assessing cellular viability and enzymatic function. By implementing the detailed protocols outlined in this application note and adhering to regulatory requirements for assay validation, researchers can effectively utilize this methodology to generate robust, reproducible data suitable for both basic research and regulatory submissions.
Step-by-Step FDA Uptake and Release Assay Protocols
Fluorescein diacetate (FDA) is a membrane-permeant, non-fluorescent probe widely used in viability assessments for various cell types, from mammalian cells to bacteria and yeast. Its utility stems from a simple yet powerful mechanism: upon passive diffusion into cells with intact membranes, intracellular esterases hydrolyze FDA into fluorescein, a green fluorescent compound that is membrane-impermeant and thus accumulates in viable cells [23] [24] [25]. This process provides a direct readout of both enzymatic activity (a marker of metabolism) and membrane integrity, two key hallmarks of cell viability.
The detectEV assay is a prime example of a modern application that leverages this principle specifically for the functional characterization of extracellular vesicles (EVs). This assay uses FDA hydrolysis to assess the bioactivity of luminal cargo and the integrity of the EV membrane, serving as a crucial quality control metric for EV preparations intended for therapeutic use [23]. When developing a dye uptake assay using FDA, the preparation of consistent, high-quality stock solutions and the maintenance of healthy, reproducible cell cultures are foundational steps that dictate the success and reliability of the entire experiment. This protocol details these critical preparatory phases.
Reagent Preparation
Fluorescein Diacetate (FDA) Stock Solution
The core of the assay is a stable and reliable FDA stock solution.
- Preparation Procedure:
- Weigh out 10 mg of FDA powder (Molecular Weight: 416.38 g/mol).
- Transfer the powder to a dark glass vial or a microcentrifuge tube wrapped in aluminum foil to protect from light.
- Add 2.29 mL of high-grade, anhydrous dimethyl sulfoxide (DMSO). This will yield a 10 mM stock solution.
- Vortex vigorously for 1-2 minutes or until the powder is completely dissolved.
- Aliquot the stock solution into smaller volumes (e.g., 20-50 µL) to avoid repeated freeze-thaw cycles.
- Store the aliquots at -20 °C or below, protected from light and moisture. Under these conditions, the stock is stable for at least 6 months.
Table 1: Preparation of FDA Stock Solution
| Component | Quantity | Final Concentration | Solvent | Storage Conditions |
|---|---|---|---|---|
| FDA Powder | 10 mg | 10 mM | Anhydrous DMSO | -20°C, dark, aliquoted |
Preparation of Working Solution
The working solution is prepared fresh on the day of the experiment by diluting the stock into a suitable, serum-free buffer.
Standard Preparation:
- Thaw an aliquot of the 10 mM FDA stock solution at room temperature.
- Dilute the stock 1:1000 in Dulbecco's Phosphate Buffered Saline (DPBS) without calcium and magnesium. For example, add 5 µL of stock to 5 mL of DPBS to create a 10 µM working solution.
- Mix by gentle inversion. Protect from light and use within a few hours.
Critical Considerations:
- Solvent: DMSO is essential for creating a concentrated stock, but the final DMSO concentration in the working solution and, subsequently, in the cell culture must be kept low (typically <0.1-1.0%) to avoid cytotoxicity.
- Serum: The working dilution should be made in a serum-free buffer like DPBS or unsupplemented culture medium. Serum contains esterases that can hydrolyze FDA extracellularly, leading to high background fluorescence [24].
- Optimization: The final concentration of FDA used in the assay (e.g., 1-20 µM) must be optimized for each specific cell type and experimental setup.
Essential Reagents and Materials
Table 2: Key Research Reagent Solutions for FDA Uptake Assays
| Reagent/Material | Function/Description | Example/Note |
|---|---|---|
| Fluorescein Diacetate (FDA) | Fluorogenic substrate; precursor to fluorescein. | MW: 416.38 g/mol; Purity: ≥95% recommended. |
| Anhydrous Dimethyl Sulfoxide (DMSO) | Solvent for preparing concentrated, stable FDA stock. | Use high-purity, sterile-filtered grade. |
| DPBS (without Ca2+/Mg2+) | Diluent for preparing FDA working solution. | Prevents precipitation and serum-independent hydrolysis. |
| Cell Culture Medium | For maintaining cells pre- and post-assay. | Serum-free medium used during FDA incubation. |
| Trypan Blue or Propidium Iodide (PI) | Viability stain for counterstaining/correlation. | Membrane-impermeant dye stains dead cells [24]. |
| Trypsin-EDTA Solution | For adherent cell detachment. | Use appropriate concentration for cell line. |
Cell Culture Protocols
General Mammalian Cell Culture Maintenance
Robust and consistent cell culture is paramount for obtaining reliable FDA assay data.
- Protocol:
- Culture Conditions: Maintain adherent or suspension cells in their recommended growth medium (e.g., DMEM, RPMI-1640) supplemented with 10% Fetal Bovine Serum (FBS), 1% L-Glutamine, and 1% Penicillin-Streptomycin in a humidified incubator at 37 °C with 5% CO₂.
- Subculturing: Passage adherent cells at 70-90% confluence to prevent contact inhibition and maintain logarithmic growth.
- Aspirate the culture medium.
- Rinse gently with DPBS to remove residual serum and divalent cations.
- Add enough trypsin-EDTA solution to cover the monolayer (e.g., 1-2 mL for a T-75 flask) and incubate at 37°C for 2-5 minutes.
- Monitor detachment under a microscope and neutralize trypsin by adding a double volume of complete growth medium containing serum.
- Centrifuge the cell suspension at 300 x g for 5 minutes. Aspirate the supernatant and resuspend the cell pellet in fresh complete medium.
- Cell Counting and Seeding:
- Mix the cell suspension 1:1 with Trypan Blue solution (0.4%).
- Count viable (unstained) cells using a hemocytometer or automated cell counter.
- Seed cells at the desired density onto multi-well plates (e.g., 96-well black-walled plates for fluorescence reading) or glass coverslips for microscopy. Allow cells to adhere and grow for 24-48 hours prior to the assay to ensure they are in a logarithmic growth phase and have recovered from trypsinization.
Cell Preparation for FDA Assay
Proper preparation immediately before the assay is critical.
- Serum Starvation: On the day of the assay, gently aspirate the complete growth medium and wash the cells twice with pre-warmed (37°C) DPBS to thoroughly remove any residual serum esterases.
- Optional Serum-Free Incubation: Incubate cells in pre-warmed, serum-free medium for 30-60 minutes before adding the FDA working solution. This step further reduces background and can help synchronize the metabolic state of the cells.
- Health Assessment: Prior to proceeding, visually inspect the cells under a phase-contrast microscope. The monolayer should be healthy, with minimal rounding or detachment.
The detectEV Assay: An Application Example for EVs
The detectEV assay adapts the core FDA protocol for quality control of extracellular vesicles (EVs), which are nanoscale particles secreted by cells [23].
Workflow:
- EV Isolation: Isolate EVs from conditioned media or biofluiences using methods like differential ultracentrifugation (dUC) or tangential flow filtration (TFF).
- Reaction Setup: In a suitable container (e.g., a microcentrifuge tube), combine a small, quantified sample of the EV preparation with the FDA working solution.
- Incubation: Incubate the mixture at 37°C for a defined period (e.g., 30-60 minutes), protected from light.
- Signal Measurement: Transfer the mixture to a fluorescence-compatible plate or cuvette. Measure the fluorescence intensity using a microplate reader or fluorometer with excitation/emission wavelengths of ~485/535 nm.
Data Interpretation: An increase in fluorescence over a negative control (e.g., buffer alone) indicates the presence of EVs with intact membranes and active luminal esterases. This assay can detect batch-to-batch variations and differences in EV integrity under various storage conditions or after different isolation methods [23].
Visualization of the FDA Hydrolysis Mechanism and Workflow
The following diagrams illustrate the core principle of the FDA assay and the generalized workflow for its application.
FDA Hydrolysis Mechanism (Fig. 1): The non-fluorescent FDA diffuses into a cell with an intact membrane. Intracellular esterases hydrolyze it into fluorescein, which is charged and cannot diffuse out, accumulating and emitting fluorescence in viable cells.
FDA Assay Workflow (Fig. 2): The sequential steps of the assay, from cell culture and reagent preparation to the final fluorescence measurement.
This application note provides a detailed protocol for a Flow Cytometry-Based Fluorescein Diacetate (FDA) Uptake Assay, a functional method for assessing cellular metabolic activity and membrane integrity at the single-cell level. The assay serves as a critical tool for evaluating cell viability, physiological state, and enzymatic activity within heterogeneous populations, providing key quality control metrics for various research and pre-clinical applications [23] [25]. By measuring the hydrolysis of the non-fluorescent FDA into the fluorescent compound fluorescein by intracellular esterases, researchers can gain insights into the functional status of individual cells, which is essential in fields ranging from microbiology to immunology and drug development [25] [26].
Principle of the Assay
Fluorescein diacetate (3′,6′-diacetyl-fluorescein; FDA) is a non-polar, non-fluorescent, and membrane-permeant compound [25] [26]. Upon passive diffusion across an intact cell membrane, intracellular nonspecific esterases hydrolyze FDA, removing the acetate groups and yielding fluorescein [23] [25]. Fluorescein is a polar, green-fluorescent molecule that is generally membrane-impermeant and thus accumulates within cells with intact membranes and active metabolism [25]. The fluorescence intensity of the trapped fluorescein, which is proportional to the enzymatic activity and membrane integrity of the cell, can be quantified using a flow cytometer. This process is illustrated in the following diagram.
Key Research Reagent Solutions
The successful execution of this protocol relies on several key reagents and instruments. The table below details the essential materials and their functions.
Table 1: Essential Research Reagents and Materials
| Item | Function/Description |
|---|---|
| Fluorescein Diacetate (FDA) | Non-fluorescent, membrane-permeant substrate. Hydrolyzed by intracellular esterases to produce fluorescent fluorescein [25] [26]. |
| Dimethyl Sulfoxide (DMSO) | Organic solvent for preparing a stock solution of FDA [26]. |
| Phosphate Buffered Saline (PBS) | Physiological buffer for washing cells and diluting the FDA working solution. |
| Flow Cytometer | Analytical instrument for detecting fluorescein fluorescence in single-cell suspensions (e.g., instruments from BD, Beckman Coulter, or Cytek) [27] [28]. |
| Non-ionic Surfactant (e.g., Tween 20) | Optional additive to the assay buffer to prevent cell clumping and ensure a single-cell suspension for flow analysis. |
Materials and Equipment
Reagents
- Fluorescein diacetate (FDA) (e.g., Sigma-Aldrich, Cat# F7378)
- Anhydrous Dimethyl Sulfoxide (DMSO)
- Phosphate Buffered Saline (PBS), pH 7.4
- Appropriate cell culture media
- 70% ethanol for decontamination
Equipment
- Flow cytometer equipped with a 488 nm laser and a 530/30 nm bandpass filter (FITC/GFP channel) [27] [28]
- Centrifuge
- CO₂ incubator
- Biological safety cabinet
- Water bath
- Vortex mixer
- Micropipettes and sterile tips
- Sterile microcentrifuge tubes and flow cytometry tubes
Experimental Procedure
Preparation of FDA Stock and Working Solutions
- FDA Stock Solution (1-5 mM): Dissolve FDA in anhydrous DMSO to a final concentration of 1-5 mM. For example, to prepare a 2 mM solution, dissolve 0.4 mg of FDA in 1 mL of DMSO.
- FDA Working Solution (1-10 µM): Dilute the stock solution in pre-warmed PBS or appropriate assay buffer to the desired final concentration. For instance, a 1:200 dilution of a 2 mM stock will yield a 10 µM working solution.
- Note: Prepare the working solution immediately before use and protect it from light. The stock solution can be aliquoted and stored at -20°C for up to 6 months.
Cell Harvesting and Preparation
- Harvest adherent or suspension cells using standard methods.
- Wash the cell pellet twice with PBS by centrifuging at 300 × g for 5 minutes.
- Resuspend the cells in PBS or assay buffer at a density of 0.5-1 × 10⁶ cells/mL. Maintain cell suspension on ice until staining.
FDA Staining and Incubation
- Aliquot 1 mL of cell suspension (0.5-1 × 10⁶ cells) into a flow cytometry tube.
- Add the prepared FDA working solution to the cell suspension to achieve the desired final concentration (typically 1-10 µM). A vehicle control (DMSO only) must be included.
- Vortex gently and incubate the tubes for 15-60 minutes at 37°C in the dark. The optimal incubation time and concentration should be determined empirically for each cell type.
- After incubation, place the tubes on ice to halt the reaction.
Data Acquisition by Flow Cytometry
- Analyze the samples on a flow cytometer within 1 hour of staining.
- Use the 488 nm laser for excitation and collect fluorescein emission with a 530/30 nm bandpass filter.
- Acquire a minimum of 10,000 events per sample.
- For the vehicle control (DMSO-only stained cells), adjust the voltage on the FITC/GFP channel so that the population is in the first decade of the logarithmic plot.
The complete experimental workflow, from sample preparation to data analysis, is summarized in the following diagram.
Data Analysis and Interpretation
Gating Strategy and Quantification
- On a Forward Scatter (FSC-A) vs. Side Scatter (SSC-A) plot, draw a gate (P1) around the population of interest to exclude debris and aggregates.
- Create a histogram plot for the fluorescence intensity of the FITC/GFP channel.
- Apply the gated population (P1) to the histogram.
- Use the vehicle control (DMSO) to set a negative threshold. The majority (>99%) of cells in the control sample should appear negative.
- For the FDA-stained sample, the fluorescence-positive population indicates cells with esterase activity and an intact membrane.
Key Parameters
The following table outlines the critical experimental parameters that require optimization for different cell types.
Table 2: Key Experimental Parameters for Optimization
| Parameter | Recommended Range | Notes |
|---|---|---|
| FDA Final Concentration | 1 - 10 µM | Must be titrated for each cell type. High concentrations can cause quenching [25]. |
| Incubation Time | 15 - 60 minutes | Time-course studies are recommended to find the linear range of fluorescence accumulation [23]. |
| Cell Density | 0.5 - 1 x 10⁶ cells/mL | Too high density can lead to substrate depletion and signal loss. |
| Assay pH | 7.4 - 7.6 | Fluorescein fluorescence and enzyme activity are pH-sensitive [25] [26]. |
| Temperature | 37°C | Essential for optimal enzymatic activity. |
Applications and Context
This protocol is highly versatile and finds application in numerous fields:
- Cell Viability and Physiological State Assessment: The assay provides a functional measure of viability based on metabolic activity, complementing membrane exclusion dyes [25] [26].
- Quality Control for Biologics: As demonstrated in the
detectEVassay, FDA hydrolysis can be adapted to evaluate the membrane integrity and luminal enzyme activity of extracellular vesicle (EV) preparations, serving as a key quality control metric for cell-free therapies [23]. - Microbial Biology: The assay is widely used to study the metabolic activity of bacterial and fungal cells, including those in biofilms, and to detect viable but non-culturable (VBNC) bacteria [25] [26].
- Drug Screening: The impact of drug candidates on cellular metabolism can be monitored quantitatively in a high-throughput manner using flow cytometry.
Troubleshooting Guide
Table 3: Common Issues and Proposed Solutions
| Problem | Potential Cause | Solution |
|---|---|---|
| Low Fluorescence Signal | Incorrect FDA concentration; short incubation; low enzyme activity. | Titrate FDA concentration and optimize incubation time. Include a positive control with known viable cells. |
| High Background in Negative Control | Autofluorescence; FDA hydrolysis in buffer. | Ensure the use of fresh, properly prepared FDA working solution. Pass cells through a strainer to remove aggregates. |
| High Signal Quenching | FDA concentration is too high. | Reduce the final staining concentration of FDA [25]. |
| Poor Cell Viability Post-Staining | Toxicity from DMSO. | Ensure the final concentration of DMSO in the assay does not exceed 0.1-0.5%. |
The plate reader-based Fluorescein Diacetate (FDA)-release assay is a robust, high-throughput method for assessing cellular esterase activity and membrane integrity. This protocol is designed for rapid screening in applications such as drug discovery, toxicology, and cell viability studies, providing a quantitative and sensitive measure of functional cell status [23]. By leveraging the ubiquitous presence of esterases in living cells and the fluorescent properties of the hydrolysis product, this assay enables efficient evaluation of treatment effects across many experimental conditions [29] [23].
Principle of the Assay
Fluorescein diacetate (FDA) is a non-fluorescent, membrane-permeant compound. In viable cells with intact membranes, FDA passively diffuses across the plasma membrane. Once inside the cell, endogenous non-specific esterases hydrolyze FDA, releasing the fluorescent product, fluorescein. Because fluorescein is a charged, membrane-impermeant molecule, it is retained within cells with intact plasma membranes. The intensity of the green fluorescence signal, proportional to the intracellular esterase activity, is then quantified using a plate reader, serving as a indicator of cell viability and metabolic competence [23] [22].
Key Research Reagent Solutions
Table 1: Essential Reagents and Materials
| Item | Function/Description | Typical Working Concentration/Details |
|---|---|---|
| Fluorescein Diacetate (FDA) | Non-fluorescent substrate hydrolyzed by cellular esterases to fluorescent fluorescein [23]. | Prepare a stock solution in DMSO (e.g., 1-10 mg/mL); dilute in assay buffer for a final concentration of 1-10 µM [23] [22]. |
| Cell Culture Medium | Nutrient-supporting medium for maintaining cells during the assay. | Use phenol-red-free medium to minimize background fluorescence. |
| Phosphate Buffered Saline (PBS) | Physiological buffer for washing cells and preparing reagent solutions. | - |
| Dimethyl Sulfoxide (DMSO) | Solvent for preparing FDA stock solutions [23]. | Keep final concentration in culture ≤0.1-1.0% to avoid cytotoxicity. |
| Lysis Buffer (e.g., 1% Triton X-100) | Optional; used to lyse cells for total potential fluorescence determination. | - |
| 96-well or 384-well Microplates | Vessels for cell culture and high-throughput fluorescence reading. | Use plates with clear, flat bottoms optimized for fluorescence assays. |
| Plate Reader | Instrument for detecting and quantifying fluorescence intensity. | Equipped with filters for excitation ~485 nm and emission ~535 nm. |
Materials and Equipment
Reagents
- Cell line of interest
- Complete cell culture medium and supplements
- Trypsin-EDTA solution for cell detachment
- Reagents listed in Table 1
Equipment
- Multi-channel pipettes and reagent reservoirs
- Microplate centrifuge
- CO₂ incubator
- Plate reader with fluorescence detection capabilities
Step-by-Step Experimental Protocol
Cell Seeding and Treatment
- Seed cells in a 96-well or 384-well microplate at an optimal density (e.g., 5,000-20,000 cells/well for a 96-well plate) in complete culture medium. Include control wells: background (medium only), vehicle control, and a positive control for cytotoxicity (e.g., cells treated with 70% methanol).
- Incubate the plate for 24 hours (or as required by the experimental design) in a 37°C, 5% CO₂ incubator to allow cell attachment and recovery.
- Apply experimental treatments (e.g., drug compounds, toxins) to the cells for the desired duration.
FDA Staining and Incubation
- Prepare FDA working solution in pre-warmed, phenol-red-free assay buffer or medium immediately before use. Protect from light.
- Remove the treatment medium from the cell plate carefully to avoid disturbing the cell monolayer.
- Wash cells gently with PBS (optional, to reduce background).
- Add the prepared FDA working solution to each well. Ensure consistent volume across wells.
- Incubate the plate for 30-60 minutes at 37°C in the dark to allow for substrate hydrolysis.
Fluorescence Measurement
- Measure fluorescence directly using a plate reader. Standard filter sets for fluorescein are used: Excitation: 485 nm, Emission: 535 nm [23].
- Shake the plate briefly before reading if required by the instrument.
- Read the fluorescence from all wells.
Data Analysis and Interpretation
Calculation of Relative Viability
- Calculate the average fluorescence for the background control wells (medium + FDA, no cells).
- Subtract the average background fluorescence from the fluorescence value of all other sample wells.
- Normalize the data: Express the background-corrected fluorescence of treated wells as a percentage of the background-corrected fluorescence of the vehicle control wells.
Formula:
- % Viability = ( FluorescenceTreated - FluorescenceBackground ) / ( FluorescenceVehicle Control - FluorescenceBackground ) × 100
Key Analysis Parameters
Table 2: Quantitative Data Analysis and Expected Outcomes
| Parameter | Description & Calculation | Interpretation Guide |
|---|---|---|
| Raw Fluorescence Units (RFU) | Direct output from the plate reader for each well. | Higher RFU indicates greater esterase activity and cell viability. |
| Background-Corrected RFU | Sample RFU - Average Background RFU | Eliminates interference from assay reagents and plate. |
| Normalized Viability (%) | (Corrected RFUSample / Corrected RFUControl) * 100 | Direct measure of treatment effect relative to untreated cells. 100% = no effect. |
| Z'-Factor | 1 - [ (3σc+ + 3σc-) / |μc+ - μc-| ] Where σ=std. dev., μ=mean, c+=positive control, c-=negative control [30]. | Assesses assay quality for HTS. Z' > 0.5 indicates an excellent assay [30]. |
| IC₅₀ / EC₅₀ | Concentration causing 50% inhibition/effect, determined by non-linear regression of dose-response curves. | Quantifies compound potency. |
Applications in High-Throughput Screening
This protocol is particularly suited for:
- Drug Discovery: Primary screening of large compound libraries (e.g., FDA-approved drug repurposing libraries) to identify modulators of cell viability [30] [31].
- Toxicology Studies: Assessment of chemical cytotoxicity and environmental pollutants [29].
- Quality Control: Functional evaluation of biological preparations, such as extracellular vesicles (EVs), by measuring luminal esterase activity as a marker of membrane integrity and bioactivity [23]. The detectEV assay is one example that utilizes this principle for standardized EV qualification [23].
Fluorescein diacetate (FDA) hydrolysis is a widely adopted method for measuring total enzymatic activity (TEA) in various biological systems, from environmental biofilms to mammalian cell cultures [26]. The assay operates on the principle that FDA, a non-fluorescent pre-fluorophore, is hydrolyzed by a spectrum of non-specific enzymes—including esterases, proteases, and lipases—to release fluorescein, a product that exhibits a strong yellow-green color and fluorescence [26]. This reaction serves as a robust indicator of cellular metabolic activity and viability. For researchers and drug development professionals, optimizing the FDA assay is critical for generating reliable, reproducible, and high-quality data. The core parameters of incubation time, temperature, and dye concentration directly influence the kinetics of the hydrolysis reaction, the intensity of the signal, and the subsequent accuracy of the activity measurements. Within the broader context of dye uptake assays, a meticulously optimized FDA protocol ensures that observed fluorescence truly reflects the biological phenomenon under investigation, rather than artifacts of suboptimal experimental conditions.
Core Parameters for Optimization
The performance of an FDA hydrolysis assay is highly dependent on several interlinked chemical and physical parameters. Optimizing these factors is essential for achieving a strong, quantifiable signal that accurately reflects the true enzymatic activity of the sample while maintaining a low background.
Table 1: Critical Parameters for FDA Hydrolysis Assay Optimization
| Parameter | Typical Tested Range | Recommended Optimal Value | Key Considerations |
|---|---|---|---|
| FDA Concentration | 0.5 - 5 μM [32] | Solution-dependent | Higher concentrations may be needed for systems with high enzymatic activity or to overcome diffusion limitations. Must be balanced against potential background signal. |
| Incubation Time | 15 - 180 minutes [32] | 60 minutes [26] | Must be determined empirically to ensure the reaction is within the linear range. Too short a time gives a weak signal; too long can lead to product degradation or saturation. |
| Incubation Temperature | 20 - 37°C | 30°C [26] | A balance between enzyme activity kinetics and preserving cell viability. Temperature control is vital for reproducibility. |
| Buffer pH | 7.4 - 7.6 | 7.6 [26] | Optimal for the activity of many hydrolytic enzymes. Must be appropriate for the specific biological system under study. |
| Agitation | N/A | Orbital shaker, 130 rpm [26] | Crucial for assays with immobilized cells or biofilms to ensure uniform substrate distribution and minimize diffusion barriers. |
Biochemical Basis of Parameter Influence
The optimization parameters listed above directly control the reaction kinetics and efficiency of the hydrolysis process. Temperature governs the rate of the enzymatic reaction, with higher temperatures typically accelerating activity up to a point of protein denaturation. The pH of the buffer system must be maintained to ensure the hydrolytic enzymes and the resulting fluorescein product are in their active and detectable states, respectively. For instance, the recommended pH of 7.6 supports enzyme function and also keeps fluorescein in its ionized, highly fluorescent form [26]. Furthermore, the physical setup, such as agitation, is particularly critical when working with complex samples like biofilms or immobilized cells, as it facilitates mass transfer of the substrate to the cells embedded within the matrix [26].
Detailed Experimental Protocols
Protocol 1: Standard Microplate-based FDA Assay for Suspension Cells
This protocol is designed for quantifying total esterase activity in mammalian or bacterial cells in suspension, suitable for high-throughput screening applications.
Materials:
- Fluorescein diacetate (FDA) stock solution: Prepare a 1-5 mM stock in acetone or DMSO. Store at -20°C protected from light.
- Phosphate Buffer Saline (PBS), pH 7.4 - 7.6.
- Microplate reader capable of measuring absorbance or fluorescence (Ex/~490 nm, Em/~520 nm).
- Clear or black-walled 96-well or 384-well microplates.
Procedure:
- Cell Preparation: Seed cells in the microplate at a density determined during assay optimization (e.g., 10,000-50,000 cells per well for adherent cells). Culture for the desired period.
- FDA Working Solution: Dilute the FDA stock solution in pre-warmed PBS or culture medium to the desired final concentration (e.g., 0.5-5 μM). Protect from light and use immediately.
- Dye Application: Carefully remove the culture medium from the wells. Add 100 μL of the FDA working solution to each well.
- Incubation: Incubate the plate at the optimal temperature (e.g., 30°C or 37°C) for the determined time (e.g., 30-60 minutes). Agitation on an orbital shaker can improve uniformity.
- Signal Measurement: Measure the fluorescence or absorbance in the microplate reader without disturbing the plate. Fluorescein absorbance is measured at 490 nm.
- Data Analysis: Subtract the signal from negative controls (wells with FDA solution but no cells). Normalize the data to cell number or protein content as needed.
Protocol 2: Whole-Biofilm FDA Assay for Immobilized Systems
This protocol, adapted from research on immobilized Bacillus thuringiensis, allows for the sensitive evaluation of the physiological state of cells within a biofilm without the need for detachment, which can introduce error [26].
Materials:
- FDA stock solution (as in Protocol 1).
- Phosphate buffer, pH 7.6.
- Orbital shaker incubator.
- Carriers with immobilized biofilm (e.g., polyurethane foam cubes).
Procedure:
- Pre-incubation: Place the immobilized carrier (with biofilm) into a suitable container with a known volume of phosphate buffer. Pre-incubate on an orbital shaker for 15 minutes at the assay temperature (e.g., 30°C) to equilibrate the system [26].
- Substrate Application: Slowly inject the FDA stock solution directly into the middle of the immobilized carrier to ensure deep penetration of the substrate into the biofilm matrix [26].
- Hydrolysis Reaction: Incubate the carrier on an orbital shaker (e.g., 130 rpm) at 30°C for 1 hour. The shaking is critical for mass transfer [26].
- Reaction Termination & Measurement: Remove an aliquot of the buffer solution containing the hydrolyzed fluorescein product. Transfer to a microplate or cuvette and measure the absorbance at 490 nm.
- Adsorption Control: Account for potential adsorption of the fluorescein product onto the carrier material. As demonstrated with polyurethane foam, adsorption can be significant (e.g., ~8% for concentrations >2.5 μg/mL) and should be corrected for in final calculations [26].
- Normalization: Determine the biofilm dry mass by comparing the weight of the dried immobilized carrier with that of an unimmobilized carrier. Express Total Enzymatic Activity (TEA) as μg of fluorescein produced per hour per mg of dry biofilm mass.
The Scientist's Toolkit: Essential Reagent Solutions
Table 2: Key Research Reagents for FDA Assays
| Reagent / Material | Function & Application Notes |
|---|---|
| Fluorescein Diacetate (FDA) | Pre-fluorophore substrate; hydrolyzed by esterases and other hydrolases to yield fluorescent fluorescein. Stock solutions are prepared in acetone or DMSO [33]. |
| Phosphate Buffered Saline (PBS) | A standard physiological buffer (pH 7.4-7.6) used to maintain a stable pH optimal for hydrolytic enzyme activity during the assay [26]. |
| Polyurethane Foam (PUR) | A common carrier for cell immobilization in biofilm studies; noted for its good mechanical strength, large surface area, and low toxicity. Requires testing for dye adsorption [26]. |
| Dimethyl Sulfoxide (DMSO) | A polar aprotic solvent used for preparing concentrated stock solutions of FDA and many other water-insoluble dyes and compounds. |
| Fluorescein (Sodium Salt) | The fluorescent end-product of FDA hydrolysis. Used for generating standard curves for quantification and for testing adsorption to carrier materials [26]. |
Experimental Workflow and Biochemical Pathway
The following diagram illustrates the key procedural steps and the underlying biochemical reaction of the FDA hydrolysis assay, providing a visual guide for researchers.
FDA Assay Workflow and Mechanism
The diagram above outlines the core experimental workflow for an FDA assay, from sample preparation to data analysis, while the "Biochemical Pathway" inset illustrates the enzymatic conversion of non-fluorescent FDA into the highly fluorescent product, fluorescein.
The therapeutic application of extracellular vesicles (EVs) as innate effectors for cell-free therapy and bio-nanovehicles for drug delivery necessitates meticulous evaluation of their critical quality attributes [23]. Therapeutic efficacy depends on intrinsic EV properties, most notably membrane integrity and luminal cargo bioactivity [23]. Traditional methods that assess merely physicochemical features (e.g., size, concentration) provide insufficient information about functional potency. The detectEV assay addresses this gap through an enzymatic-based approach that simultaneously evaluates EV membrane integrity and luminal enzymatic bioactivity using fluorescein diacetate (FDA) as a core reagent [23] [34]. This method aligns with MISEV-2023 guidelines advocating for rigorous functional characterization to advance EV research and therapeutic development [23].
Principle of the detectEV Assay
Core Mechanism: Esterase Activity and Membrane Integrity
The detectEV assay leverages the ubiquitous presence of esterase enzymes within EV lumens across diverse biological sources, including mammalian cells, bacteria, plants, and microalgae [23]. The assay utilizes fluorescein diacetate (FDA), a non-fluorescent, lipophilic compound that passively diffuses across intact lipid bilayers [23] [25]. Once inside the EV lumen, nonspecific esterases hydrolyze FDA, removing acetate groups and converting it to fluorescein—a polar, green-fluorescent molecule membrane-impermeable and retained only within vesicles with intact membranes [23] [1]. The resulting fluorescence signal directly correlates with both functional enzymatic activity and structural membrane integrity.
Conceptual Advantages Over Traditional Methods
This single-step functional assay provides significant advantages for quality control in EV therapeutic development:
- Functional Assessment: Moves beyond physical characterization to directly measure bioactive potential [23].
- Batch-to-Batch Reprodubility: Efficiently detects variations in EV preparations using small sample volumes [23] [34].
- Predictive Capability: Correlates esterase activity with specific therapeutic functionalities (e.g., antioxidant activity) [23].
- Versatility: Applicable to EVs from diverse sources, including human-derived EVs and microalgae-derived nanoalgosomes [23].
Experimental Protocol for the detectEV Assay
EV Preparation and Characterization
Isolate EVs from your chosen source (e.g., cell culture supernatant, biofluids, microalgae) using preferred methods (differential ultracentrifugation, tangential flow filtration, or others) [23]. Characterize EVs according to MISEV-2023 guidelines, including:
- Nanoparticle Tracking Analysis (NTA) for particle concentration and size distribution [23].
- Transmission Electron Microscopy (TEM) for morphological assessment [23].
- Western Blot for specific EV marker detection [23].
detectEV Assay Workflow
The following workflow outlines the key procedural steps for implementing the detectEV assay:
Step-by-Step Procedure
EV Sample Preparation
- Thaw EV aliquots on ice if frozen.
- Dilute EVs in appropriate buffer (e.g., PBS) to desired concentration within linear range of detection.
- Prepare technical replicates for statistical analysis.
FDA Working Solution Preparation
Reaction Setup
- Combine 50-100 µL EV sample with equal volume FDA working solution in microplate wells.
- Include appropriate controls:
- Background Control: EVs with assay buffer only (no FDA).
- Substrate Control: FDA with buffer only (no EVs).
- Positive Control: EVs with known integrity (e.g., fresh preparation).
- Negative Control: Compromised EVs (e.g., detergent-treated, freeze-thaw damaged).
Incubation and Measurement
Data Analysis
- Subtract background fluorescence from all samples.
- Normalize fluorescence values to EV input (particle number or protein content).
- Calculate enzymatic activity units if quantified standards are included.
- Express results as relative fluorescence units (RFU) per µg EV protein or per particle count.
Optimization Notes
- pH Sensitivity: FDA hydrolysis product fluorescein is pH-sensitive, with fluorescence intensity declining in acidic environments [25]. Maintain consistent pH (7.0-7.4) throughout assay.
- Quenching Effects: High intravesicular fluorescein concentrations may cause quenching; optimize EV concentration to ensure linear detection range [25].
- Temperature Control: Conduct all steps at stable temperatures to minimize effects on enzyme kinetics and membrane fluidity.
- Time Course: For initial optimization, perform time-course experiments to identify linear reaction period.
Research Reagent Solutions
Table 1: Essential reagents and materials for implementing the detectEV assay
| Reagent/Material | Function in Assay | Specifications & Considerations |
|---|---|---|
| Fluorescein Diacetate (FDA) | Fluorogenic esterase substrate; membrane-permeable precursor | Core assay component. Prepare fresh stock solutions in DMSO; optimize concentration (1-25 µM) for specific EV type [23] [1]. |
| Extracellular Vesicles | Analytic of interest | Isolate using preferred method (dUC, TFF, SEC). Characterize particle count, size distribution, and marker expression before assay [23]. |
| Dimethyl Sulfoxide (DMSO) | Solvent for FDA stock solution | Use anhydrous, high-quality grade. Keep final concentration low (<0.5-1%) to maintain EV integrity [1]. |
| Assay Buffer (e.g., PBS) | Reaction medium | Maintain physiological pH and osmolarity. Avoid amine-containing buffers (e.g., Tris) if using crosslinking fixatives later. |
| Microplate Reader | Fluorescence detection | Capable of measuring ~492/517 nm (fluorescein spectra). Temperature control preferred for kinetic assays. |
| Detergents (Triton X-100) | Control reagent for membrane disruption | Use in negative controls (0.1-1%) to fully compromise membranes and confirm specificity of signal [23]. |
Data Interpretation and Quality Control
Quantitative Parameters and Benchmarks
Table 2: Key quantitative parameters and typical outcomes in detectEV assay applications
| Parameter | Typical Experimental Range | Significance & Interpretation |
|---|---|---|
| Detection Sensitivity | Small sample sizes (exact volume optimized) [23] | Demonstrates assay efficiency with limited biological material. |
| Batch-to-Batch Variation | Detectable significant differences between preparations [23] | Quality control metric for manufacturing consistency. |
| Storage Stability | Significant signal loss after inappropriate storage [23] | Informs optimal storage conditions (e.g., PBS-HAT buffer, -80°C) [23]. |
| Isolation Method Impact | Varies between dUC, TFF, SEC [23] | Guides selection of isolation methods that preserve functional integrity. |
| Functional Correlation | Predictive of antioxidant activity [23] | Validates assay as surrogate for therapeutic potency. |
Troubleshooting Common Issues
- Low Signal-to-Noise Ratio: Increase EV input concentration or extend incubation time within linear range; verify esterase presence in EV source.
- High Background Fluorescence: Ensure proper substrate handling to prevent premature hydrolysis; include substrate-only controls; centrifuge samples before reading if particulate matter present.
- Poor Reproducibility: Standardize EV isolation protocols; use fresh FDA preparations; control incubation temperature precisely.
- Incomplete Membrane Disruption in Negative Controls: Increase detergent concentration or pre-incubate EVs with detergent before adding FDA.
The detectEV assay represents a significant advancement in EV quality assessment by integrating functional enzymatic measurement with structural integrity evaluation in a single, rapid protocol. This method addresses the pressing need for standardized, predictive quality control metrics in therapeutic EV development, moving beyond purely physical characterization to functional potency assessment. By leveraging the well-established principle of FDA hydrolysis, the assay provides a cost-effective, quantifiable approach that enhances batch-to-batch reproducibility and facilitates clinical translation of EV-based therapies. Its demonstrated versatility across EV sources and ability to predict therapeutic functionality position the detectEV assay as an essential tool for researchers and drug development professionals working in the evolving field of extracellular vesicles.
In the realm of biochemical research, particularly in assays utilizing fluorescein diacetate (FDA), the accurate quantification of fluorescence is paramount for drawing meaningful biological conclusions. Two fundamental metrics for this purpose are Mean Fluorescence Intensity (MFI) and Relative Fluorescence Units (RFU). While often used interchangeably in casual conversation, they represent distinct concepts with specific applications. RFU refers to the raw, arbitrary unit of measurement obtained from fluorescence detectors, representing the intensity of the fluorescent signal detected [35] [36]. It is a unitless measure that is instrumental in analyses employing fluorescence detection, where higher quantities of a target, such as amplified DNA or enzymatic products, correspond to higher RFU values [35] [36].
MFI, on the other hand, is a more specific and derived metric, particularly crucial in flow cytometry and other cell-based assays. It represents the average brightness of a population of cells or particles and serves as a relative measure of antigen or target abundance [37]. In the context of a dye uptake assay using FDA, which measures intracellular esterase activity and thus cell viability, understanding the distinction and application of these two units is critical for robust data interpretation. This application note details the methodologies for their precise quantification within this research framework.
Key Concepts and Measurement Principles
Relative Fluorescence Units (RFU): The Raw Signal
The RFU is the fundamental output of fluorometers, plate readers, and flow cytometers. When a fluorophore like fluorescein is excited by a laser or light source, it emits photons of a higher wavelength. A detection system, such as a photomultiplier tube (PMT) or a charge-coupled device (CCD), captures these photons and converts them into a proportional voltage pulse or digital signal [35] [37] [36]. This signal, expressed in RFU, is arbitrary and specific to the instrument's configuration and sensitivity. For instance, different instrument models can produce different RFU readings for the same sample, underscoring the "relative" nature of the unit [36].
Mean Fluorescence Intensity (MFI): A Population Metric
MFI is a central parameter in flow cytometry and image-based analyses. As fluorescing cells or particles pass individually through a detector, the instrument measures the pulse area of the voltage signal for each event, which correlates directly with the fluorescence intensity for that cell [37]. The MFI is then calculated as the arithmetic mean of these intensities across the entire gated population. A key application is assessing brightness and relative antigen abundance; a shift in MFI between a negative control and a stained sample indicates specific marker expression [37].
Table 1: Core Differences Between RFU and MFI
| Feature | Relative Fluorescence Units (RFU) | Mean Fluorescence Intensity (MFI) |
|---|---|---|
| Definition | Raw, arbitrary signal intensity from a detector | Average fluorescence of a defined cell or particle population |
| Primary Application | Endpoint readings in plate readers, PCR, kinetic enzyme assays | Flow cytometry, quantitative image analysis |
| Represents | Total fluorescent signal from a well or sample | Relative abundance of a target per cell |
| Dependency | Instrument type, sensitivity, and settings [36] | Population homogeneity, gating strategy, and instrument settings [37] |
Critical Considerations for Accurate Quantification
Technical Variability and Standardization
A significant challenge in using raw MFI or RFU values is their inherent technical variability. Studies have demonstrated that MFI values can exhibit high intra- and inter-laboratory variability, with coefficients of variation (CV) reported around 15% or higher, even among expert laboratories following standardized procedures [38] [39]. This variability can stem from bead lots (in multiplex assays), instrument calibration, and user technique [38] [39]. Furthermore, RFU measurements can be affected by background fluorescence (autofluorescence) of cells and components, which must be accounted for by including appropriate negative controls [40].
The Ratio Approach for Longitudinal Studies
For time-course experiments, such as monitoring FDA dye uptake after drug treatment, relying on absolute MFI/RFU values can be misleading due to day-to-day assay variation. A robust solution is to use a ratio-based analysis [39]. This involves testing a baseline sample (e.g., pre-treatment) and a test sample in the same analytical run. The ratio of post-treatment MFI to pre-treatment MFI cancels out much of the technical noise, where a ratio >1 indicates an increase and a ratio <1 indicates a decrease in the target signal [39]. This method provides a more reliable assessment of biological changes than comparing raw MFI values across different runs.
Essential Reagent Solutions
A successful FDA dye uptake assay relies on a suite of carefully selected reagents and tools.
Table 2: Research Reagent Solutions for FDA Uptake and Fluorescence Analysis
| Reagent / Material | Function & Importance |
|---|---|
| Fluorescein Diacetate (FDA) | Cell-permeant substrate; hydrolyzed by intracellular esterases to release fluorescent fluorescein, indicating cell viability and metabolic activity [41] [42]. |
| Propidium Iodide (PI) | Cell-impermeant viability dye; excluded by live cells with intact membranes. Used as a counterstain to identify dead cells in a multiplexed assay with FDA [42]. |
| Dilution Buffer (e.g., PBS) | Used to resuspend and dilute cells to an optimal density for accurate counting and fluorescence measurement, preventing signal saturation [42]. |
| Validation Controls (FMO/Isotype) | Critical for flow cytometry. Fluorescence Minus One (FMO) controls help accurately gate populations and define positive signals in complex multicolor panels [40]. |
Experimental Protocol for FDA Dye Uptake Assay
The following protocol provides a detailed methodology for performing a dye uptake assay with FDA and quantifying the results via MFI in flow cytometry or RFU in a plate reader.
Sample Preparation and Staining
- Cell Harvesting: Gently dissociate adherent cells and prepare a single-cell suspension. Centrifuge the cells and resuspend the pellet in an appropriate dilution buffer, such as PBS [42].
- Density Adjustment: Dilute the cell suspension to a recommended density. For yeast and many mammalian cells, a 1:100 dilution in buffer is often appropriate to achieve a density suitable for analysis (e.g., ~2.5 x 10^7 cells/mL maximum for some instruments) [42].
- Staining Solution: Combine the cell suspension with the vital dyes. A typical reaction mix for a 20 µL total volume might include:
- 18 µL of cell sample
- 1 µL of FDA stock solution (e.g., from a 5 mg/mL acetone stock)
- 1 µL of Propidium Iodide (PI) stock solution [42].
- Incubation: Incubate the stained cell suspension for 10-15 minutes at room temperature, protected from light [41] [42].
Data Acquisition
Flow Cytometry (for MFI):
- Launch the instrument software and set up a protocol with channels for FITC (FDA, green fluorescence) and PE/Cy5 (PI, red fluorescence).
- Adjust the PMT voltages for the green and red channels so that the negative and positive populations are clearly distinguished and within the linear detection range. Use unstained and single-stained controls to set these voltages and for compensation [37] [40].
- Acquire data for thousands of events. Create a dot plot of FSC vs. SSC to gate on the primary cell population. Then, use a PI vs. FDA dot plot to gate on the viable (PI-negative, FDA-positive) population.
- The software will calculate and report the MFI of the FDA channel for the gated viable cell population [37].
Plate Reader (for RFU):
- After incubation, transfer the staining solution to a suitable microplate (e.g., black-walled, clear-bottom).
- Set the plate reader with excitation at ~485 nm and emission at ~535 nm for fluorescein.
- Read the plate. The output will be the RFU for each well.
Data Analysis and Interpretation
- Background Subtraction: Subtract the average RFU or MFI value from unstained control wells or cells from all test samples.
- Normalization: For plate reader data (RFU), normalize the signal to cell density or protein content if needed (e.g., RFU/µg protein). For flow cytometry data, the MFI is already a per-cell measurement.
- Ratio Calculation for Kinetic Studies: To analyze changes over time or after treatment, calculate the ratio of the normalized MFI (or RFU) of the test sample to the normalized MFI of the baseline/reference sample run in parallel [39].
Ratio = (MFI_post-treatment) / (MFI_pre-treatment)
Workflow and Data Analysis Diagrams
Experimental Workflow for FDA Assay
Data Analysis Logic Path
Solving Common Problems and Enhancing Assay Reproducibility
Addressing Background Fluorescence and Signal-to-Noise Issues
In dye uptake assays using fluorescein diacetate (FDA), achieving a high signal-to-noise ratio (SNR) is paramount for accurately assessing cell viability and metabolic activity. Background fluorescence and suboptimal SNR can obscure true positive signals, leading to inaccurate quantification of esterase activity and membrane integrity [43] [3]. This document outlines the primary sources of noise in FDA-based assays and provides detailed, actionable protocols for mitigating these issues, thereby enhancing the reliability and reproducibility of your data. The principles discussed are framed within the context of quantitative fluorescence microscopy and flow cytometry, which are central techniques in this analytical domain [44] [45].
A systematic approach to improving SNR requires an understanding of major noise contributors. The table below summarizes these sources and their corresponding solutions.
Table 1: Key Sources of Noise in FDA Assays and Their Mitigation Strategies
| Noise Source | Impact on Assay | Recommended Mitigation Strategy |
|---|---|---|
| Background Fluorescence | High background reduces contrast, masking the specific fluorescence from intracellular fluorescein [3]. | Use secondary emission and excitation filters to narrow the bandwidth of detected light [44]. |
| Out-of-Focus Light | Blurs image detail and increases background in microscopy, reducing spatial resolution [46]. | Implement background suppression algorithms (e.g., polarization modulation) to extract in-focus information [46]. |
| Instrument Noise | Camera readout noise and dark current add non-specific signal, compromising sensitivity, especially in low-light conditions [44]. | Characterize camera parameters (readout noise, dark current); introduce a wait time in the dark before acquisition [44]. |
| Suboptimal Staining | Incorrect FDA/PI concentration or incubation time leads to weak signal or excessive non-specific staining [3]. | Optimize dye dosage and incubation time for specific cell types. For M. aeruginosa, use 10 mg/L FDA with 14-21 min incubation [3]. |
| Sample Autofluorescence | Cellular components or medium can fluoresce in similar channels as fluorescein, raising background [43]. | Ensure the chemical and physical parameters (e.g., pH, trace elements) of the growth medium are controlled and consistent [43]. |
Experimental Protocols for SNR Enhancement
Protocol: Optimization of FDA Staining for Flow Cytometry
This protocol is adapted for the cyanobacteria Microcystis aeruginosa and should be re-optimized for other cell types [3].
1. Reagent Preparation:
- FDA Stock Solution: Prepare a stock solution of 1 mg/mL FDA in acetone or DMSO. Aliquot and store at -20°C.
- PI Stock Solution: Prepare a 1 mM stock solution of Propidium Iodide in water or PBS. Store in the dark at 4°C.
- Working Staining Solution: Dilute the stock solutions in your cell culture medium or buffer to the desired final concentration. For M. aeruginosa, the optimized concentrations are:
- FDA: 10 mg/L (from 1 mg/mL stock)
- PI: 10 µM (from 1 mM stock) [3]
2. Staining Procedure: 1. Harvest cells and prepare a suspension at a density of ~1×10⁶ cells/mL. 2. Add the appropriate volume of the FDA working solution to the cell suspension and mix gently by pipetting. 3. Incubate for 14-21 minutes at the culture temperature (e.g., 28°C) in the dark [3]. 4. Add the PI working solution and incubate for an additional 2-5 minutes in the dark. 5. Analyze immediately by flow cytometry.
3. Flow Cytometry Setup:
- Triggering: Use fluorescence triggering on the FITC channel (fluorescein) to avoid recording non-fluorescent debris.
- Detection: Collect fluorescence signals.
- FDA (Viable cells): FL1 channel (~530 nm)
- PI (Dead cells): FL2 or FL3 channel (>575 nm) [3]
- Controls: Always include unstained cells and single-stained controls (FDA only, PI only) for instrument compensation.
Protocol: Microscope Setup for Quantitative Fluorescence Imaging
Follow this protocol to maximize SNR in quantitative single-cell fluorescence microscopy (QSFM) [44].
1. Pre-Acquisition Setup:
- Dark Adaptation: Power on the microscope system and introduce a wait time of several minutes in the dark before starting fluorescence acquisition. This allows the camera to stabilize and reduces transient electronic noise [44].
- Filter Configuration: Enhance specificity by adding secondary emission and excitation filters. This narrows the bandwidth of light, effectively reducing scattered light and background noise [44].
2. Camera Calibration and Settings:
- Characterize Camera Noise: Determine your camera's key parameters, including readout noise, dark current, and clock-induced charge (CIC). This is critical for understanding the lower detection limit of your system [44].
- Maximize Dynamic Range: Set the acquisition time and gain to utilize the full dynamic range of the camera without saturating pixels.
3. Post-Acquisition Processing (Optional):
- For high-speed imaging, consider implementing a self-supervised denoising framework like FAST. This deep-learning method can enhance SNR in real-time (exceeding 1000 FPS) without requiring ground-truth data, preserving both structural fidelity and rapid signal dynamics [47].
The Scientist's Toolkit: Research Reagent Solutions
Table 2: Essential Reagents and Materials for FDA-based Dye Uptake Assays
| Item | Function/Description | Example Application |
|---|---|---|
| Fluorescein Diacetate (FDA) | Non-fluorescent, cell-permeant substrate hydrolyzed by intracellular esterases to produce fluorescent fluorescein, indicating metabolic activity [43] [3]. | Staining viable cells for viability and metabolic activity assays. |
| Propidium Iodide (PI) | Cell-impermeant DNA dye that only enters cells with compromised membranes, staining dead cells [43] [3]. | Distinguishing dead cells from the viable population in a double-staining setup with FDA. |
| Deuterated/Dephased Media | Growth media prepared with water of altered deuterium content to study isotopic effects on cell viability and dye sensitivity [43]. | Investigating the influence of subtle environmental changes on cellular metabolic activity. |
| Alamar Blue (Resazurin) | Redox indicator used for assessing metabolic activity, serving as an alternative or complementary metric to FDA hydrolysis [43]. | Confirming metabolic activity readings in parallel experiments. |
| Structured Illumination Microscopy (SIM) Reagents | Dyes and mounting media compatible with SIM, a technique that can be enhanced with background suppression algorithms [46]. | High-resolution, low-background imaging of cellular structures. |
Workflow and Pathway Visualizations
Experimental Workflow for FDA-PI Assay
SNR Enhancement Strategy
Fluorescein diacetate (FDA) hydrolysis serves as a fundamental assay for measuring total enzymatic activity (TEA) and evaluating cellular physiological status in various research contexts, from ecotoxicology to immobilized biocatalyst development. This assay leverages the conversion of the non-fluorescent FDA molecule into the highly fluorescent fluorescein product through the action of non-specific esterases, which are recognized markers of cellular health [32] [26]. The simplicity and sensitivity of this method make it widely applicable; however, obtaining reliable, reproducible data necessitates strict control over numerous biological and technical variables. This document provides detailed application notes and protocols, framed within a broader thesis on dye uptake assays, to guide researchers in standardizing the FDA hydrolysis assay for accurate assessment of esterase activity while accounting for cell physiology and mitigating non-specific hydrolysis.
Key Principles and Quantitative Parameters
The FDA hydrolysis assay is influenced by a defined set of interacting variables. The core principle involves the diffusion of FDA into a biological system, its enzymatic hydrolysis by active esterases to release fluorescein, and the subsequent quantification of fluorescence, which serves as a proxy for metabolic activity [26]. The relationship between these elements and key controlling variables can be visualized as follows:
The optimization of this assay requires careful consideration of quantitative parameters, which are summarized in the table below based on empirical studies.
Table 1: Key Quantitative Parameters for FDA Hydrolysis Assay Optimization
| Parameter | Optimal Range or Value | Biological or Technical Significance | Impact on Assay Output |
|---|---|---|---|
| FDA Concentration | Varies by system (e.g., 0.01–0.1 mg/mL [48]) | Balance between substrate saturation and signal-to-noise ratio. | Too low: insufficient signal; Too high: increased non-specific hydrolysis. |
| Incubation Time | 1 hour (for immobilized cells) [26] | Allows sufficient product accumulation within the linear reaction range. | Shorter times may miss weak activity; longer times can exceed linear phase. |
| Incubation Temperature | 30°C [26] or 37°C [48] | Maximizes enzyme activity while maintaining cell viability. | Lower temperatures reduce reaction rate; higher temperatures may denature enzymes. |
| pH of Buffer | pH 7.6 (Phosphate Buffer) [26] | Matches the optimal activity range for many non-specific esterases. | Sub-optimal pH can significantly reduce measured enzymatic activity. |
| Agitation (Shaking) | 130 rpm [26] | Ensures uniform substrate distribution, especially in biofilms. | Prevents signal gradient formation and improves reproducibility. |
| Fluorescein Adsorption | Up to 9% (PUR carrier) [26] | Loss of product signal due to interaction with experimental materials. | Can lead to underestimation of activity; must be quantified and corrected for. |
Detailed Experimental Protocols
Protocol for Total Enzymatic Activity (TEA) in Immobilized Biofilms
This optimized protocol allows for the measurement of esterase activity in a whole biofilm without detaching cells, thereby preserving the native physiological state and avoiding errors associated with incomplete cell recovery [26].
Materials:
- Immobilized Biocatalyst: Biofilm formed on a carrier (e.g., Polyurethane Foam, PUR).
- Substrate Solution: Fluorescein diacetate (FDA) dissolved in acetone or DMSO, diluted in phosphate buffer.
- Equipment: Orbital shaker, centrifuge, spectrophotometer or fluorescence plate reader.
Procedure:
- Pre-incubation: Place the immobilized carrier in a suitable vessel containing phosphate buffer (pH 7.6). Incubate on an orbital shaker at 130 rpm for 15 minutes at 30°C to equilibrate the system.
- Substrate Application: Slowly inject the FDA solution directly into the middle of the immobilized carrier to ensure local and deep penetration. Avoid surface application which can lead to uneven hydrolysis.
- Hydrolysis Reaction: Continue incubation on the orbital shaker (130 rpm, 30°C) for a defined period, typically 1 hour. Shaking is critical for mass transfer of the substrate and product within the biofilm matrix [26].
- Reaction Termination & Measurement: Remove an aliquot of the buffer solution. Clarify by centrifugation if necessary. Measure the fluorescence of the supernatant (Excitation: ~490 nm, Emission: ~520 nm).
- Biomass Quantification: Determine the dry mass of the biofilm by comparing the weight of the dried immobilized carrier with the weight of the unimmobilized, dried carrier.
- Adsorption Control: For new carrier materials, perform a control experiment by incubating sterile carriers with a known concentration of fluorescein. Calculate the percentage of adsorption and use this to correct your final activity measurements [26].
- Calculation: Express the Total Enzymatic Activity (TEA) as the amount of fluorescein produced per unit time per unit of biofilm dry mass.
Validation Using Reference Inhibitors and Environmental Contaminants
To confirm that the observed fluorescence signal is specifically linked to esterase activity, the assay should be validated using known esterase inhibitors.
Materials:
- Positive Controls: Esterase inhibitors such as Triphenyl phosphate and Netilmicin sulfate [32].
- Test Compounds: Environmental contaminants of interest (e.g., Methoxychlor, Lindane, Tributyltin chloride) [32].
- Model Organism: For example, the crustacean Daphnia magna.
Procedure:
- Exposure: Expose test organisms (e.g., D. magna juveniles) to a range of sublethal concentrations of the inhibitor or contaminant for a defined period (e.g., 24-48 hours).
- Staining & Imaging: Follow the optimized FDA staining protocol. For D. magna, this involves starvation to clear the gut, staining with FDA, anesthetization, and imaging via automated confocal microscopy [32].
- Quantification & Analysis: Quantify the fluorescence intensity from the images. Generate concentration-response curves. The effectiveness of an esterase inhibitor will be demonstrated by a significant reduction in fluorescence compared to the control, indicating suppressed esterase activity [32].
Troubleshooting and Data Interpretation
A major advantage of the FDA assay is its ability to reveal the physiological state of cells, but this is also a source of variability. The following workflow outlines a systematic approach to troubleshooting and interpreting experimental outcomes:
Key Considerations:
- Low Signal: This can indicate low esterase activity due to poor physiological state, toxicity from a test compound [32], incorrect assay pH, insufficient substrate concentration, or inadequate substrate penetration into cells/biofilms. Verify cell viability and optimize shaking and substrate delivery as per the protocol [26].
- High Background/Non-Specific Hydrolysis: FDA can undergo non-enzymatic hydrolysis, particularly if stored improperly or if the solution is old. Always prepare fresh FDA stock solutions and include no-cell controls to account for non-specific hydrolysis. Furthermore, always correct for fluorescein adsorption to the carrier material [26].
- Signal Variability: Inconsistent shaking or uneven application of the substrate, especially in biofilm assays, is a primary cause of high variability. The "slow injection" method combined with orbital shaking is designed to minimize this [26].
The Scientist's Toolkit: Research Reagent Solutions
Table 2: Essential Reagents and Materials for the FDA Hydrolysis Assay
| Item | Function / Role in the Assay | Examples / Notes |
|---|---|---|
| Fluorescein Diacetate (FDA) | Substrate; converted to fluorescent fluorescein by esterases. | Dissolve in acetone or DMSO for stock solutions. Prepare fresh. |
| Phosphate Buffer (pH 7.6) | Provides a stable, physiologically relevant pH for the reaction. | Ensures optimal esterase activity [26]. |
| Orbital Shaker | Ensures homogenous substrate distribution and product diffusion. | Critical for biofilm assays; use 130 rpm [26]. |
| Polyurethane Foam (PUR) | Carrier for cell immobilization. | Good mechanical strength, large surface area, low cost [26]. |
| Spectrofluorometer / Plate Reader | Precisely quantifies fluorescein fluorescence. | Excitation: ~490 nm, Emission: ~520 nm. |
| Esterase Inhibitors | Positive controls for assay validation. | Triphenyl phosphate, Netilmicin sulfate [32]. |
| Model Test Organisms | Representative biological systems for ecotoxicology. | Daphnia magna [32], Bacillus thuringiensis B1 [26]. |
Gating Strategies for Flow Cytometry to Exclude Debris and Dead Cells
Flow cytometry is a cornerstone technique for dissecting heterogeneous cell populations based on physical and biochemical properties. Central to its accuracy is gating—a systematic process to isolate target cell subsets while excluding noise from debris, dead cells, or technical artifacts [49]. In the specific context of dye uptake assays using fluorescein diacetate (FDA), a proper gating strategy is paramount. FDA is a cell-permeable, non-fluorescent compound that is hydrolyzed by intracellular esterases into the fluorescent product fluorescein, which is retained by living cells [24]. This protocol details a robust gating strategy to accurately identify this viable, FDA-positive population, ensuring reliable data for researchers and drug development professionals.
Principles of Gating for Viability Assays
Effective gating is performed in a logical, hierarchical manner, sequentially refining the cell population to focus on the cells of interest [49]. The core principles when working with FDA include:
- Signal-based Selection: Cells pass through the flow cytometer, scattering light and emitting fluorescence. Forward scatter (FSC) correlates with cell size, and side scatter (SSC) with internal complexity or granularity [49]. The fluorescence signal from hydrolyzed FDA indicates enzymatic activity and cell viability [24].
- Hierarchical Refinement: The analysis follows a stepwise approach: (1) exclusion of debris based on light scatter, (2) exclusion of dead cells often using a dead cell stain, (3) selection of single cells to remove aggregates, and finally, (4) identification of the target phenotype—in this case, the viable, FDA-positive population [49] [50].
Critical Controls for Assay Integrity
Incorporating appropriate controls is non-negotiable for obtaining robust and interpretable data.
- Viability Controls: While FDA marks live cells, using a complementary dead cell exclusion dye, such as propidium iodide (PI) or 7-AAD, is crucial [49] [51]. These dyes are typically impermeable to live cells but stain dead cells, providing a clear negative population for gating.
- Fluorescence Minus One (FMO) Controls: In multicolor experiments that include FDA and other markers, FMO controls (containing all antibodies except one) help define the true background and positive population for each channel, accounting for spectral spillover [49] [50] [51].
- Unstained and Biological Controls: Analyze an unstained sample to account for cellular autofluorescence [51], which can be particularly high in certain tissues like the brain [52]. A biological control (e.g., a heat-killed cell sample) can also validate the staining specificity of FDA and dead cell markers.
Step-by-Step Gating Protocol
The following workflow, summarized in the diagram below, outlines the sequential gating strategy to isolate viable, FDA-positive single cells.
Step 1: Exclude Debris and Dead Cells
The first critical step is to eliminate debris and dead cells from your analysis [49].
- Create a dot plot of Forward Scatter-Area (FSC-A) versus Side Scatter-Area (SSC-A).
- The main population of intact cells will typically appear in a distinct cloud. Draw a gate (e.g., P1) around this population, deliberately excluding events with low FSC and SSC signals that represent debris and small particles [49] [50].
- When performing viability assays, fluorescent dyes like PI or 7-AAD are used to mark dead cells, which exhibit high fluorescence in their respective channels, so that these can be gated out [49].
Step 2: Select Single Cells (Exclude Doublets)
After the initial exclusion, the next step is to focus on single cells, thereby removing any cell doublets or aggregates that can skew the data [49].
- Apply the P1 gate to a new plot of FSC-A versus FSC-Width (FSC-W).
- Single cells display a linear relationship between the total signal (area) and the signal width. In contrast, doublets or clumped cells appear as outliers due to their increased width [49] [50].
- Draw a gate (e.g., P2) around the linear cluster representing single cells.
Step 3: Define Viable, FDA-Positive Population
The final gating step involves delineating the viable cell population using FDA and a dead cell marker.
- Apply the P2 (singlets) gate to a new plot. This will typically be a bivariate plot of FDA Fluorescence (e.g., FITC channel) versus PI (or other dead dye) Fluorescence.
- The viable, FDA-positive population will be PI-negative and FDA-high.
- The dead cell population will be PI-positive and may show low FDA fluorescence due to the leakage of fluorescein from cells with compromised membranes [24].
- Draw a gate (e.g., P3) around the FDA+/PI- population for subsequent analysis.
Application-Specific Strategy: FDA-Based Viability and Activity
The mechanism of FDA and the resulting gating strategy for a dye uptake assay are visualized below.
Objective: Quantify the population of viable cells based on intracellular esterase activity and membrane integrity.
Key Parameters:
- FDA Fluorescence: Intensity indicates hydrolytic activity, a marker of cell viability and metabolic function [24].
- Propidium Iodide (PI) or 7-AAD Fluorescence: Intensity indicates loss of membrane integrity, a marker of cell death [49] [51].
Workflow:
- Debris and Singlet Exclusion: Follow Steps 1 and 2 of the main protocol to obtain a clean population of single, intact cells.
- Viability Gating:
- Create a plot of FDA fluorescence vs. PI fluorescence.
- Live, metabolically active cells: FDA+/PI- (intact membrane, high esterase activity).
- Dead cells: FDA-/PI+ or FDA-low/PI+ (compromised membrane, low activity).
- Analysis: The percentage of cells in the FDA+/PI- gate provides a quantitative measure of cell viability and metabolic health in the sample.
The Scientist's Toolkit: Research Reagent Solutions
Table 1: Essential reagents and materials for flow cytometry gating and FDA viability assays.
| Item | Function & Rationale |
|---|---|
| Fluorescein Diacetate (FDA) | Cell-permeable viability probe. Hydrolyzed by intracellular esterases in live cells to produce fluorescent fluorescein, which is retained [24]. |
| Propidium Iodide (PI) | Cell-impermeable DNA dye. Used to identify dead cells with compromised membranes. It is a common choice for counterstaining in viability assays [49] [51]. |
| 7-AAD | A cell-impermeable DNA dye similar to PI but with different spectral properties. Often used as an alternative to PI [49] [51]. |
| Fc Receptor Blocking Reagent | Reduces non-specific antibody binding by blocking Fc receptors on immune cells (e.g., monocytes, macrophages), improving signal-to-noise ratio [51]. |
| Compensation Beads | Synthetic beads that bind antibodies. Used with single-stained controls to accurately calculate and correct for spectral overlap (compensation) in multicolor experiments [50] [51]. |
| Isotype Controls | Antibodies with non-specific specificity, matching the host species, isotype, and conjugation of the primary antibody. They help assess the level of non-specific antibody binding [51]. |
Common Errors and Troubleshooting
Table 2: Common gating pitfalls and their solutions in FDA-based assays.
| Error | Impact | Solution |
|---|---|---|
| Inadequate Debris Exclusion | Overestimation of total event count; contamination of analysis with non-cellular events. | Strictly apply FSC vs. SSC gating; use a viability dye to help distinguish debris from dead cells [49]. |
| Failure to Exclude Doublets | Skewed data by falsely increasing event counts and fluorescence intensity measurements. | Apply strict FSC-A vs. FSC-W (or FSC-H) gating to isolate single cells [49] [50]. |
| Incorrect Compensation | False-positive or false-negative signals in multicolor panels due to spectral spillover. | Use single-stained controls or compensation beads for each fluorophore to recalibrate compensation [49] [50]. |
| High Autofluorescence | Masking of specific fluorescence signals, leading to an underestimation of positive populations. | Use an unstained control to set baselines; consider using fluorophores excitable by lasers other than 488 nm if autofluorescence is high (e.g., in brain samples) [52] [51]. |
Pro Tips for Success
- Backgating for Validation: After gating the FDA-positive population, backgate it onto the FSC vs. SSC plot to confirm its location aligns with the expected size and granularity of your live cells [49].
- Temperature Control: To minimize efflux of fluorescein from living cells after staining, keep the temperature low during and after staining [24].
- Panel Design: For multicolor experiments, choose fluorophores with minimal spectral overlap. FDA/fluorescein is typically detected in the FITC (green) channel, so plan other markers accordingly [50].
Detergents and membrane-disrupting agents are fundamental tools in cell biology research, employed for purposes ranging from cell lysis and organelle isolation to the permeabilization of live cells for intracellular access. Triton X-100, a non-ionic surfactant, is one of the most widely used agents for these applications [53] [54]. Its interaction with lipid bilayers disrupts hydrogen bonding within the membrane, compromising its integrity and altering permeability [54]. However, the effects of Triton X-100 are concentration-dependent, creating a critical balance between desired permeabilization and unacceptable cytotoxicity.
This application note details the impact of Triton X-100 on cell membrane integrity, using the fluorescein diacetate (FDA) uptake and release assay as a sensitive functional readout. FDA is a non-fluorescent, lipophilic compound that freely diffuses across intact membranes. Once inside the cell, endogenous esterases hydrolyze FDA into fluorescein, a charged, fluorescent molecule that is retained only in compartments with intact membranes [9] [23]. This property makes FDA an excellent probe for quantifying changes in membrane permeability.
Quantitative Effects of Triton X-100 on Membrane Permeability
The impact of Triton X-100 is highly concentration-dependent, with a narrow window between permeabilization and cell death. The tables below summarize key quantitative findings from the literature.
Table 1: Concentration-Dependent Effects of Triton X-100 on Mammalian Cells
| Triton X-100 Concentration | Observed Effect on Membrane | Cellular Viability / Consequence | Experimental System |
|---|---|---|---|
| ≤ 0.15 mM | No change in permeability to hydrophilic molecules (e.g., ferrocyanide) [54]. | Cells remain viable [54]. | HeLa cells, SECM [54]. |
| ~0.17 mM | Increased permeability to hydrophilic molecules; membrane permeability for ferrocyanide measured at 6.5 ± 2.0 × 10⁻⁶ m/s [54]. | Reversible permeabilization observed in some cells; recovery after 20-30 min [54]. | HeLa cells, SECM [54]. |
| 0.19 - 0.20 mM (Near CMC*) | Irreversible permeabilization; structural collapse of the membrane [54]. | Lethal to cells; loss of viability [54]. | HeLa cells, SECM [54]. |
| 10⁻³% (~0.016 mM) to 10⁻²% | Dose-dependent increase in membrane permeability, measured via FDA uptake and release [9]. | Significant membrane damage at higher concentrations [9]. | Renal cell lines (786-O, Caki-1, RC-124) [9]. |
*CMC: Critical Micelle Concentration
Table 2: FDA-Based Assay Signatures Under Different Membrane Conditions
| Membrane Status | FDA Uptake & Conversion | Fluorescein Retention | Experimental Readout |
|---|---|---|---|
| Intact Membrane | FDA enters and is hydrolyzed to fluorescein by intracellular esterases [9] [23]. | High; fluorescent signal is trapped inside the cell [9]. | High intracellular fluorescence (Flow Cytometry).Low extracellular fluorescence (Plate Reader). |
| Compromised Membrane (e.g., Triton X-100) | FDA enters freely; esterase activity may be affected at high detergent levels [9]. | Low; fluorescein leaks out through membrane pores [9]. | Reduced intracellular fluorescence (Flow Cytometry).High extracellular fluorescence (Plate Reader). |
Detailed Experimental Protocols
Protocol 1: FDA Uptake Assay by Flow Cytometry
This protocol measures the intracellular accumulation of fluorescein in single cells, suitable for heterogeneous cell populations [9].
Research Reagent Solutions
| Reagent | Function/Brief Explanation |
|---|---|
| Fluorescein Diacetate (FDA) | Membrane-permeant pro-fluorophore; measures esterase activity and membrane integrity [9]. |
| Triton X-100 | Non-ionic detergent; positive control for membrane disruption and permeabilizing agent [53] [9]. |
| Phosphate Buffered Saline (PBS) | Isotonic buffer to maintain cell physiology during assay. |
| Ethidium Bromide (EtBr) or Propidium Iodide (PI) | Membrane-impermeant DNA dyes; counterstain to identify dead cells with compromised membranes [9] [55]. |
Methodology:
- Cell Preparation: Harvest cells (e.g., renal cancer cell lines 786-O, Caki-1, or non-malignant RC-124) and adjust concentration to 1 × 10⁶ cells/mL in ice-cold PBS or appropriate buffer [9].
- Detergent Treatment: Mix 400 µL of cell suspension with 200 µL of PBS containing varying concentrations of Triton X-100 (e.g., from 10⁻⁵% to 10⁻²%) [9]. Include an untreated control.
- Staining: Add 200 µL of staining solution (120 µg/mL EtBr and 20 µg/mL FDA in PBS) to each tube [9].
- Incubation: Incubate the tubes on ice for 5 minutes in the dark.
- Washing: Add 2 mL of PBS, sediment cells by centrifugation (300 × g, 5 min, 4°C), and resuspend the pellet in 300 µL PBS [9].
- Analysis: Analyze samples immediately using a flow cytometer. Exclude cell debris and dead cells (EtBr-positive) by gating on forward and side scatter. Measure the mean fluorescence intensity (MFI) of the FDA (fluorescein) channel in the live cell population [9].
Data Interpretation: A decrease in intracellular FDA-derived fluorescence in Triton X-100-treated samples compared to the control indicates increased membrane permeability and leakage of the fluorescent product [9].
Protocol 2: FDA Release Assay by Fluorescence Plate Reader
This population-based assay quantifies the leakage of fluorescein from pre-loaded cells, directly reporting on membrane integrity [9].
Methodology:
- Cell Loading: Incubate cells (e.g., at a density of 10⁶ cells/mL) with 5 µg/mL FDA in PBS for 30 minutes in the dark on ice [9].
- Washing: Wash the cells three times with ice-cold PBS (centrifuge at 150 × g for 3 min) to remove all extracellular FDA [9].
- Treatment: Resuspend the FDA-loaded cells in buffer and treat with Triton X-100 (e.g., 10⁻³%) or other test agents [9].
- Sedimentation and Measurement: After a 20-minute incubation, sediment the cells (3 min, 27 × g, 4°C). Transfer 100 µL of the cell-free supernatant to a 96-well plate [9].
- Detection: Measure fluorescence in a plate reader using an excitation wavelength of 300 nm and an emission wavelength of 520 nm. Express data as Relative Fluorescence Units (RFU) [9].
Data Interpretation: An increase in fluorescence in the supernatant of treated samples relative to the untreated control is directly proportional to membrane disruption and fluorescein release [9].
Mechanistic Insights and Workflow
The following diagram illustrates the core mechanism of the FDA assay and the experimental decision workflow based on the two protocols.
Key Considerations for Experimental Design
- Critical Concentration Window: The narrow threshold for Triton X-100's effects necessitates careful optimization. Concentrations near 0.17 mM may achieve reversible permeabilization, while those at or above the CMC (0.19-0.24 mM) cause irreversible membrane collapse and cell death [54].
- Orthogonal Assay Validation: Relying on a single viability or permeability assay can be misleading. Combining the FDA uptake (intracellular signal) and release (extracellular signal) assays provides a more robust assessment of membrane integrity [9].
- Interference and Controls: Factors affecting cellular metabolism, such as other toxic compounds, can influence esterase activity and confound FDA assay results. Running appropriate controls, including cells without detergent and detergent without cells, is essential [9]. When studying surface receptors, avoid Triton X-100 permeabilization as it can destroy these targets and lead to false-negative results in immunofluorescence [53].
- Cell-Type Variability: Different cell lines (e.g., 786-O vs. RC-124) can exhibit varying susceptibility to membrane-disrupting agents, underscoring the need for protocol validation in your specific model system [9].
Triton X-100 is a potent modulator of membrane integrity whose effects are precisely quantifiable using FDA-based assays. The combination of FDA uptake and release protocols provides a comprehensive and reliable system for profiling the impact of detergents and other membrane-disrupting agents. Adherence to the optimized concentrations and validated protocols detailed herein will ensure accurate data interpretation in studies of cytotoxicity, drug mechanism of action, and membrane biology.
Best Practices for Sample Storage and Assay Linearity
Fluorescein diacetate (FDA) is a vital stain used to assess cell viability and metabolic activity in various biological applications, including dye uptake assays. The principle relies on the action of non-specific intracellular esterases in living, metabolically active cells. These enzymes hydrolyze the non-fluorescent FDA molecule, releasing the highly fluorescent compound, fluorescein. This fluorescence serves as a direct indicator of cell viability and enzymatic activity, making the FDA assay a powerful tool for research in drug development, toxicology, and microbiology [56] [24]. The accuracy and reliability of this assay, however, are profoundly influenced by two critical factors: the integrity of the stored biological samples and reagents, and the demonstrated linearity of the analytical procedure. This application note details established best practices for these key areas, providing a robust framework for generating high-quality, reproducible data in FDA-based research.
Best Practices for Sample and Reagent Storage
Maintaining sample viability and reagent stability is paramount for the success of any FDA assay. Implementing rigorous, evidence-based storage protocols ensures that the experimental results reflect true biological conditions rather than degradation artifacts.
Storage of FDA Reagents
The stability of FDA stock and working solutions is a cornerstone of assay reproducibility. Key considerations include:
- Stock Solution Storage: FDA stock solutions should be prepared in a suitable solvent, typically acetone, and stored at -20°C in airtight, light-protected containers. Under these conditions, stock solutions can remain stable for extended periods, up to 730 days [56].
- Working Solution Storage: FDA working solutions are often prepared in acetone or buffer and may include surfactants like Tween 80 to enhance stability. When stored at 4°C or -20°C, these working solutions can maintain their functionality for 1 to 7 days [56]. A study evaluating FDA for tuberculosis viability found that storing the FDA working solution at either 4°C or room temperature for up to 4 weeks had no significant effect on microscopy results, suggesting some flexibility under specific conditions [56].
- Handling: FDA solutions should be protected from light and allowed to equilibrate to room temperature before use, followed by gentle vortexing [42].
Storage of Biological Samples
The storage conditions for cells and spores significantly impact their viability and, consequently, the FDA assay result.
Table 1: Storage Methods and Viability Duration for Biological Samples
| Storage Method | Optimal Conditions | Expected Viability Duration | Key Considerations |
|---|---|---|---|
| Refrigerated Suspension | 2-8°C in sealed containers [57] | 3-12 months [57] | Suitable for short-term storage; potential for premature germination. |
| Dry Spore Prints | 4-10°C, 10-30% RH, oxygen-limited [57] | 1-2 years (optimal), decline to 40-60% by year 3-4 [57] | Vulnerability to humidity fluctuations; use double-envelope systems with desiccants. |
| Cryopreservation | -80°C in 10-15% glycerol [57] | 5+ years (80-95% viability retention) [57] | Requires controlled freezing rates and cryoprotectants; ideal for long-term preservation. |
| Lyophilization | Refrigerated (2-8°C) [57] | 7+ years [57] | Involves freeze-drying with protective additives like trehalose; provides room-temperature stability. |
For cells stained with FDA for immediate analysis, it is crucial to minimize efflux of the fluorescent product. Keeping the temperature low after staining helps retain fluorescein within living cells, as passive efflux is temperature-dependent [24].
Experimental Workflow: Sample Storage and Staining
The following diagram outlines a standardized workflow for sample storage and preparation for FDA staining, integrating the best practices detailed above.
Protocol for FDA Staining and Viability Assessment
This protocol is optimized for assessing yeast cell viability but can be adapted for other microbial or mammalian cells with appropriate modifications to growth media and handling.
Materials and Reagents
- FDA Stock Solution: 5 mg/mL FDA in acetone, stored at -20°C [56] [42].
- Propidium Iodide (PI) Stock Solution: 1 mg/mL in water, stored at 2-8°C and protected from light. PI stains dead cells with compromised membranes [42].
- Dilution Buffer: An appropriate isotonic buffer, such as phosphate-buffered saline (PBS) or a specific yeast dilution buffer [42].
- Cells: A well-mixed suspension of yeast or other target cells.
- Equipment: Microcentrifuge, vortex mixer, timer, fluorescence microscope or plate reader, and appropriate pipettes.
Step-by-Step Procedure
- Sample Preparation: Harvest cells by gentle centrifugation according to their specific requirements. Resuspend the cell pellet in dilution buffer to achieve an appropriate density. A 1:100 dilution is often a good starting point for concentrated yeast cultures [42].
- Staining Solution Preparation: Combine the cell suspension and dyes. A recommended mixture is:
- 18 µL of cell sample
- 1 µL of FDA stock solution
- 1 µL of PI stock solution [42]
- Gently vortex the mixture to ensure homogeneity.
- Incubation: Incubate the staining mixture for 15 minutes at room temperature in the dark to prevent photobleaching of the fluorophores [42].
- Analysis: Proceed with fluorescence microscopy, flow cytometry, or plate reader measurement. For microscopy, allow cells to settle on the slide before imaging. Adjust exposure settings to ensure cells are neither under- nor over-exposed [42].
Data Interpretation
- Viable Cells: Fluoresce green due to the intracellular hydrolysis of FDA to fluorescein by active esterases.
- Non-viable Cells: Fluoresce red because PI enters cells with damaged membranes and intercalates with nucleic acids. These cells typically lack metabolic activity and thus will not show green fluorescence.
- The percentage of viable cells can be calculated as: (Number of green-fluorescent cells / Total number of cells) × 100.
Validation of Assay Linearity
Linearity validation is essential to demonstrate that the FDA assay produces results that are directly proportional to the concentration of viable cells or the analyte of interest within a specified range. This ensures the assay is quantitative and reliable.
Principles of Linearity
According to the ICH Q2(R1) guideline, linearity is the ability of an analytical procedure to obtain test results that are directly proportional to the concentration (amount) of analyte in the sample [58]. For viability assays, the "analyte" can be considered the number of viable cells or their collective enzymatic activity. A linear relationship allows researchers to confidently compare results across different samples and dilutions. The Clinical and Laboratory Standards Institute (CLSI) defines linearity as the ability to provide results directly proportional to the concentration of the measurand, which is a fundamental property for comparing values in clinical and research settings [59].
Protocol for Establishing Assay Linearity
This protocol outlines the steps to validate the linearity of an FDA-based assay, using cell concentration as the variable.
- Prepare Serial Dilutions: Create a series of cell suspensions with known relative concentrations. A minimum of five concentration levels is recommended [58]. For a viability assay, a range from a low cell density (near the limit of detection) to a high, confluent density is appropriate.
- Stain and Measure: Subject each dilution to the standardized FDA staining protocol (Section 3.2) in replicate (e.g., n=3). Measure the fluorescence intensity using a plate reader or flow cytometer.
- Data Analysis:
- Plot the mean fluorescence intensity (Y-axis) against the relative cell concentration (X-axis).
- Perform linear regression analysis on the data to obtain the correlation coefficient (r), slope, and y-intercept.
- Calculate the %y-intercept (bias at 100%), which is (y-intercept / mean response at 100% concentration) × 100 [58].
Acceptance Criteria and Statistical Evaluation
For a linearity claim to be valid, specific statistical criteria should be met. While formal criteria for cell viability assays are less standardized than for drug assays, the principles from ICH Q2(R1) provide a robust framework.
Table 2: Linearity Evaluation Parameters and Example Criteria
| Parameter | Description | Recommended Acceptance Criteria |
|---|---|---|
| Correlation Coefficient (r) | Measures the strength of the linear relationship. | Should be ≥ 0.997 (for impurity methods) or ≥ 0.999 (for assay methods) as a benchmark [58]. |
| %y-intercept | Indicates the proportional bias at the target (100%) concentration. | Should be ≤ 5.0% (for impurity methods) or ≤ 2.0% (for assay methods) as a benchmark [58]. |
| Visual Inspection | Assessment of the residual plot from regression analysis. | Residuals should be randomly scattered around zero without a systematic pattern. |
Statistical evaluation should go beyond simply comparing point estimates to pre-defined limits. Inappropriate hypothesis formulation can inflate type I error rates. Proposed methods like the two one-sided tests (TOST) procedure or a corrected Kroll's procedure are more robust as they properly control for sampling error and set the proof of linearity as the alternative hypothesis [60].
Experimental Workflow: Linearity Validation
The following diagram illustrates the key stages in a linearity validation study for an FDA-based assay.
The Scientist's Toolkit: Essential Research Reagents
Table 3: Key Reagents for FDA-based Dye Uptake Assays
| Reagent / Material | Function | Storage & Handling |
|---|---|---|
| Fluorescein Diacetate (FDA) | Non-fluorescent substrate hydrolyzed by intracellular esterases to produce fluorescent fluorescein in viable cells. | Store stock solution at -20°C in airtight, light-proof vials. Working solutions are stable for days at 4°C [56] [42]. |
| Propidium Iodide (PI) | Membrane-impermeant DNA dye that stains nuclei of dead cells with compromised plasma membranes. | Store at 2-8°C and protect from light [42]. |
| Dilution Buffer (e.g., PBS) | Provides an isotonic environment for maintaining cell integrity during staining and washing procedures. | Room temperature or refrigerated. |
| Cryoprotectants (e.g., Glycerol) | Used for long-term cryopreservation of cell samples at ultra-low temperatures (-80°C) to maintain viability. | Room temperature or refrigerated [57]. |
| Desiccants | Used in dry storage of samples (e.g., spore prints) to maintain low relative humidity and prevent germination or degradation. | Regenerated/replaced as per manufacturer instructions [57]. |
Implementing rigorous sample storage protocols and validating the linearity of the FDA assay are non-negotiable practices for generating reliable and meaningful data in dye uptake research. Adherence to the detailed guidelines for storing FDA reagents and biological samples—whether for short-term experiments or long-term biobanking—preserves the physiological state of the samples. Furthermore, a systematic approach to linearity validation, following established statistical standards, ensures that the fluorescence readings accurately reflect the underlying biological activity. By integrating these best practices into their workflow, researchers and drug development professionals can enhance the precision, accuracy, and reproducibility of their findings, thereby strengthening the scientific conclusions drawn from FDA-based assays.
Ensuring Accuracy: Complementary Methods and Data Interpretation
Fluorescein diacetate (FDA) hydrolysis serves as a versatile, functional enzymatic assay for evaluating cellular and vesicular integrity, viability, and metabolic activity. This application note details the power of a paired analytical approach that separately quantifies the FDA-hydrolyzing activity of released enzymes and the FDA-uptake and hydrolysis by intact systems (cells, extracellular vesicles, or biofilms). By combining these two data streams, researchers can gain a nuanced understanding of physiological states, making this paired assay a sensitive tool for toxicological testing, drug development, and quality control of biological therapeutics. The protocols herein are framed within the broader context of optimizing dye-uptake assays to produce reliable, quantitative data for research and industry applications.
The fluorogenic compound fluorescein diacetate (3′,6′-diacetylfluorescein) is a non-fluorescent molecule that freely penetrates biological membranes. Inside a viable cell, organelle, or extracellular vesicle with an intact membrane, non-specific esterases hydrolyze FDA to release the green fluorescent product, fluorescein. The retention of this charged fluorescein molecule within a structure indicates membrane integrity [23] [61].
The "power of paired analysis" lies in performing two complementary assays on a sample:
- The FDA-Release (or Leakage) Assay: Measures the activity of enzymes that have been released from compromised or dead cells/vesicles into the surrounding medium. This indicates loss of membrane integrity and is a marker for non-viable or leaky entities [61].
- The FDA-Uptake (or Hydrolysis) Assay: Measures the enzymatic activity within the total population of cells, biofilms, or vesicles after direct exposure to FDA, reflecting the metabolic activity and membrane integrity of the entire sample [62] [26].
When used in tandem, these assays provide a complete picture. For instance, a high signal in the release assay coupled with a low signal in the uptake assay indicates widespread loss of membrane integrity and metabolic activity. Conversely, a low release signal and a high uptake signal suggest a healthy, intact population. This dual-measurement is crucial for accurate interpretation in toxicology, biomarker discovery, and assessing the quality of biocatalysts or therapeutic vesicles [23] [26].
Research Reagent Solutions
The following table details essential materials and reagents required for conducting the paired FDA analysis.
Table 1: Key Research Reagents and Their Functions in FDA Assays
| Reagent/Material | Function/Description |
|---|---|
| Fluorescein Diacetate (FDA) | A non-fluorescent, membrane-permeant fluorogenic substrate. Hydrolyzed by esterases to produce fluorescent fluorescein, serving as the core probe for both uptake and release assays [62] [23]. |
| Fluorescein (Sodium Salt) | The fluorescent end-product of FDA hydrolysis. Used for generating standard curves to quantify enzymatic activity in both assays [62] [26]. |
| Phosphate Buffered Saline (PBS), pH 7.6 | A common buffer for maintaining physiological pH during the hydrolysis reaction, optimizing enzyme activity [62] [26]. |
| Propidium Iodide | A membrane-impermeant DNA-binding fluorescent dye that selectively stains dead cells. Can be used for counterstaining or validating the FDA-release assay [61]. |
| SYTOX Green | A high-affinity, membrane-impermeant nucleic acid stain that brightly stains dead cells. Useful for multiplexing and confirming loss of membrane integrity [61]. |
| Polyurethane Foam (PUR) Cubes | A common, inert carrier material for the immobilization of cells or biofilms, allowing for enzymatic assays to be performed on the whole, intact structure [26]. |
The following table consolidates key quantitative parameters from optimized FDA hydrolysis assays across diverse sample types, providing a reference for protocol development.
Table 2: Summary of Optimized Assay Conditions from Literature
| Sample Type | Assay Type | Optimal pH | Optimal Temperature | Incubation Time | Key Measurement | Reference |
|---|---|---|---|---|---|---|
| Soil Samples | Hydrolysis (Activity) | 7.6 | Not Specified | 1-3 hours | Total Microbial Activity | [62] |
| Immobilized Bacterial Biofilm (Whole) | Uptake (Activity) | 7.6 | 30 °C | 1 hour | Total Enzymatic Activity (TEA) of intact biofilm | [26] |
| Extracellular Vesicles (EVs) | Uptake (Integrity/Bioactivity) | Not Specified | 37 °C | 30-60 minutes | Luminal esterase activity & membrane integrity | [23] |
| Eukaryotic Cells (in vitro) | Uptake (Viability) | Physiological (7.4) | 37 °C | 10-60 minutes | Cytoplasmic esterase activity & membrane integrity | [61] |
Experimental Protocols
Protocol A: FDA-Uptake Assay for Intact Systems
This protocol measures the metabolic activity and membrane integrity of intact cells, extracellular vesicles (EVs), or whole biofilms.
Materials:
- Fluorescein diacetate (FDA) stock solution (e.g., 2 mg/mL in acetone or DMSO)
- Assay buffer (e.g., phosphate buffer, pH 7.6)
- Sample: Cell suspension, EV preparation, or immobilized biofilm on a carrier
- Fluorescence microplate reader or spectrophotometer
- Platform shaker (for immobilized samples)
Method:
- Sample Preparation: Prepare your biological sample (cells, EVs, or carrier with biofilm) in a suitable vessel (e.g., microplate well, test tube).
- Reaction Setup: Add assay buffer to the sample. For immobilized biofilms, pre-incubate the carrier in buffer on an orbital shaker (130 rpm) for 15 minutes to equilibrate [26].
- Initiate Reaction: Add FDA stock solution directly to the sample. For biofilms, slow injection of FDA into the center of the carrier is recommended for efficient diffusion [26]. The final FDA concentration must be determined empirically (e.g., 10 µg/mL for soil, other concentrations for pure cultures) [62].
- Incubation: Incubate the reaction mixture under optimal conditions (e.g., 30-37°C). For shaken samples, use an orbital shaker at 130 rpm. A typical incubation time is 1 hour, but this should be optimized based on the sample's activity [26].
- Terminate Reaction: The reaction can be stopped by diluting the sample with ice-cold buffer or, for supernatants, by centrifugation.
- Detection: Transfer the supernatant (or the entire mixture for immobilized carriers) to a microplate. Measure fluorescence using 490 nm excitation and 520-530 nm emission wavelengths [26].
- Quantification: Generate a standard curve with known concentrations of fluorescein. Express the results as Total Enzymatic Activity (TEA) in units of fluorescein produced per time per biomass (e.g., µg fluorescein / h / mg dry weight) [26].
Protocol B: FDA-Release Assay for Membrane Integrity Assessment
This protocol measures the activity of enzymes that have leaked from systems with compromised membranes, serving as an indicator of non-viable or damaged components.
Materials:
- Materials listed in Protocol A
- Centrifuge (for pelleting cells/vesicles)
Method:
- Sample Preparation: Prepare a suspension of your sample (cells, EVs, or detached biofilm).
- Separation: Centrifuge the sample (e.g., at high speed for EVs, lower speed for cells) to pellet the intact structures.
- Collect Supernatant: Carefully collect the supernatant, which contains the enzymes released from compromised membranes.
- Reaction Setup: In a new tube or microplate well, mix the supernatant with assay buffer and FDA stock solution.
- Incubation and Detection: Follow steps 4 through 6 of Protocol A.
- Quantification: Use the fluorescein standard curve to quantify the released enzymatic activity. This value correlates with the proportion of the population that has lost membrane integrity.
Diagram 1: Experimental workflow for the paired FDA analysis.
Applications in Drug Development and Regulatory Science
The quantitative data from paired FDA analysis aligns with the growing emphasis on Model-Informed Drug Development (MIDD) and rigorous quality control (QC) in regulatory science.
- Toxicological Testing: The paired assay provides a sensitive, in vitro method for early toxicological screening of new chemical entities. It helps comply with the "fail early, fail cheap" principle by identifying compounds that adversely affect cell membrane integrity and metabolic activity, providing crucial data for predictive safety evaluation [63] [64].
- Quality Control for Advanced Therapeutics: For complex biologics like extracellular vesicles (EVs) used as therapeutics or drug delivery vehicles, the detectEV assay (an FDA-hydrolysis-based method) is a key QC metric. It assesses EV luminal cargo bioactivity and membrane integrity, ensuring batch-to-batch reproducibility and predicting therapeutic functionality [23].
- Informing MIDD Strategies: Data on cellular viability and integrity from these functional assays can populate quantitative systems pharmacology (QSP) or physiologically-based pharmacokinetic (PBBK) models. These models are central to the FDA's MIDD Paired Meeting Program, which aims to improve dose selection, clinical trial simulation, and mechanistic safety evaluation [65] [64].
Diagram 2: The role of paired FDA analysis in the drug development pipeline.
Correlating with Complementary Viability Assays (e.g., ATP, Ethidium Bromide)
Cell viability assessment is a cornerstone of cell-based research in pharmacology, toxicology, and drug development. No single assay can fully capture the complex physiological state of cells, as each method targets different cellular components or processes [29]. Correlative approaches using multiple, complementary assays provide a more accurate and comprehensive assessment of cell health, distinguishing between cytostatic, cytotoxic, and metabolic compromise states that might be misclassified with a single-parameter readout.
This application note focuses specifically on correlating fluorescein diacetate (FDA) uptake assays with two established complementary methods: ATP quantification assays and ethidium bromide (EtBr) exclusion assays. FDA measures intracellular esterase activity and membrane integrity, ATP assays quantify metabolic energy status, and EtBr assesses plasma membrane integrity. Used together, these assays provide orthogonal data points spanning enzymatic activity, metabolic capacity, and structural integrity, enabling researchers to characterize complex cell death mechanisms more accurately [29] [23] [66].
Principle of Assay Correlation
Biological Basis for Multi-Parameter Assessment
Cell death typically follows a context-dependent sequence of events rather than a fixed script. Early metabolic compromise leads to decline in cellular energy balance and mitochondrial potential, detectable by metabolic assays like ATP quantification. Subsequently, loss of membrane asymmetry and integrity occurs, detectable by dye exclusion methods like EtBr staining. FDA uptake occupies an intermediate position, requiring both functional esterases (metabolic component) and intact membranes to retain the fluorescent product [29].
This temporal progression means different assays provide snapshots of different stages of cell death:
- Metabolic assays (ATP): Detect earliest changes in energy status
- Enzymatic activity assays (FDA): Detect intermediate functional compromise
- Membrane integrity assays (EtBr): Detect late-stage loss of membrane function
Orthogonal Verification Strategy
Orthogonal validation (e.g., pairing metabolic with membrane-integrity readouts) is recommended as a best practice in cell viability assessment [29]. This approach minimizes the risk of false positives/negatives from assay-specific interferences:
- Redox interference: Some compounds interfere with MTT/Tetrazolium assays but not with ATP or dye-based assays
- Metabolic variability: Cells with different metabolic states may show differential assay responses
- Membrane permeability changes: Subtle permeability alterations may affect dye uptake without complete loss of viability
Experimental Protocols
Fluorescein Diacetate (FDA) Uptake Assay
Principle: FDA, a non-fluorescent membrane-permeant compound, crosses intact membranes and is hydrolyzed by intracellular esterases to produce fluorescent fluorescein, which is retained in cells with intact membranes [23].
Materials:
- Fluorescein diacetate stock solution (1 mg/mL in acetone or DMSO)
- Phosphate-buffered saline (PBS), pH 7.4
- Cell culture plates with test samples
- Fluorescence microplate reader or flow cytometer
- Incubator maintained at 37°C
Procedure:
- Cell Preparation: Seed cells in appropriate multi-well plates and apply experimental treatments. Include vehicle controls and appropriate positive controls (e.g., cells treated with 70% methanol for 10 minutes for dead cell controls).
- FDA Working Solution: Prepare fresh FDA working solution in PBS or culture medium at 1-10 μg/mL final concentration from stock solution.
- Staining: Remove culture medium from wells and carefully wash cells with pre-warmed PBS. Add FDA working solution to cover cells completely.
- Incubation: Incubate plates at 37°C for 15-30 minutes protected from light.
- Measurement:
- For fluorescence plate readers: Measure fluorescence at excitation/emission of 485/535 nm.
- For flow cytometry: Analyze 10,000 events per sample using FL1 detector (530/30 nm bandpass filter).
- Data Analysis: Calculate viability as percentage of fluorescence intensity relative to untreated controls.
Technical Notes:
- FDA stock solutions should be prepared fresh monthly and stored at -20°C protected from light.
- Optimize incubation time and FDA concentration for each cell type to avoid signal saturation.
- Include esterase inhibition controls (e.g., phenylmethylsulfonyl fluoride) to confirm specificity.
ATP Quantification Assay
Principle: This assay quantifies cellular ATP levels using luciferase enzyme, which produces light proportional to ATP concentration, indicating metabolically active cells [29].
Materials:
- Commercial ATP assay kit (e.g., CellTiter-Glo)
- White-walled multiwell plates
- Luminescence plate reader
- Cell lysis compatible reagents
Procedure:
- Cell Preparation: Plate cells in white-walled 96-well plates to facilitate luminescence detection. Include background control wells without cells.
- Equilibration: Equilibrate plate and ATP assay reagents to room temperature for approximately 30 minutes.
- Reagent Addition: Add equal volume of ATP detection reagent to each well containing cells in culture medium.
- Lysing: Mix contents for 2 minutes on an orbital shaker to induce cell lysis.
- Incubation: Incubate plate at room temperature for 10 minutes to stabilize luminescent signal.
- Measurement: Record luminescence using integration time of 0.25-1 second per well.
- Data Analysis: Normalize raw luminescence values to untreated controls and calculate ATP-dependent viability.
Technical Notes:
- Avoid repeated freeze-thaw cycles of ATP standard solutions.
- Assay linearity typically ranges from 10-10,000 cells/well depending on cell type metabolic activity.
- Detergents or colored compounds in test samples may interfere with luminescence readings.
Ethidium Bromide Exclusion Assay
Principle: Ethidium bromide (EtBr) is a membrane-impermeant DNA-binding dye that is excluded by viable cells with intact membranes but enters dead cells with compromised membranes, producing red fluorescence [66].
Materials:
- Ethidium bromide stock solution (100 μg/mL in PBS)
- PBS or appropriate staining buffer
- Fluorescence microscope or flow cytometer
- Optional: Hoechst 33342 or other viability counterstains
Procedure:
- Cell Preparation: Harvest adherent cells using gentle, non-enzymatic dissociation methods to preserve membrane integrity. Keep samples on ice throughout processing.
- Staining Solution: Prepare EtBr working solution at 1-5 μg/mL final concentration in PBS or culture medium.
- Staining: Add EtBr solution to cell suspension at 1:1 ratio (v/v) and mix gently.
- Incubation: Incubate for 5-15 minutes at room temperature protected from light.
- Measurement:
- For microscopy: Visualize using rhodamine/TRITC filter sets (excitation/emission ~510/590 nm).
- For flow cytometry: Use FL2 or FL3 detectors (575 nm or >600 nm bandpass filters).
- Data Analysis: Calculate percentage of EtBr-positive (dead) cells relative to total cell population.
Technical Notes:
- EtBr is a known mutagen; use appropriate personal protective equipment and disposal methods.
- Concentration and incubation time should be optimized to minimize dye uptake by healthy cells.
- Combine with membrane-permeant nuclear stains (e.g., Hoechst 33342) for total cell counting.
Data Presentation and Analysis
Comparative Assay Performance Table
Table 1: Key Characteristics of Complementary Viability Assays
| Parameter | FDA Uptake | ATP Quantification | Ethidium Bromide |
|---|---|---|---|
| Cellular Target | Intracellular esterases | ATP molecules | Nuclear DNA |
| Measured Parameter | Enzymatic activity + membrane integrity | Metabolic capacity | Membrane integrity |
| Detection Method | Fluorescence (Ex/Em: 485/535 nm) | Luminescence | Fluorescence (Ex/Em: 510/590 nm) |
| Assay Time | 30-60 minutes | 30-45 minutes | 15-30 minutes |
| Sensitivity | Moderate | High (detects <10 cells) | Moderate |
| Key Advantages | Simple, cost-effective, single-cell resolution | Highly sensitive, quantitative, automated | Simple, distinguishes necrotic cells |
| Key Limitations | Affected by esterase inhibitors, photobleaching | Requires cell lysis, equipment-specific | Toxic reagent, membrane status only |
| Optimal Application | Early apoptosis screening, rapid assessment | High-throughput screening, kinetic studies | Necrosis detection, flow cytometry |
Correlation Data Analysis
Table 2: Representative Data from Combined Assay Approach (72h Drug Treatment)
| Treatment Condition | FDA Viability (%) | ATP Viability (%) | EtBr Positivity (%) | Interpretation |
|---|---|---|---|---|
| Vehicle Control | 100.0 ± 3.2 | 100.0 ± 4.1 | 4.5 ± 1.2 | Healthy cell population |
| Cytotoxic Drug A | 25.3 ± 2.8 | 18.7 ± 3.5 | 79.2 ± 5.1 | Late-stage apoptosis/necrosis |
| Metabolic Inhibitor B | 68.4 ± 4.1 | 32.6 ± 2.9 | 21.7 ± 3.3 | Early metabolic compromise |
| Membrane Toxin C | 45.2 ± 3.7 | 88.5 ± 4.3 | 52.8 ± 4.6 | Selective membrane damage |
| Cytostatic Drug D | 85.7 ± 3.9 | 92.3 ± 3.7 | 8.9 ± 1.8 | Growth arrest without death |
Data Interpretation Guidelines:
- Concordant decreases in FDA/ATP with increased EtBr: Classic cytotoxicity pattern
- Significant ATP decrease with moderate FDA decrease and low EtBr: Early metabolic dysfunction
- FDA decrease with maintained ATP and increased EtBr: Specific esterase inhibition or membrane damage
- Minimal changes across all assays: Non-cytotoxic treatment or cytostatic effect
Workflow Visualization
Figure 1: Experimental Workflow for Correlative Viability Assessment. This workflow illustrates the parallel processing of cell samples through three complementary viability assays for comprehensive assessment.
Figure 2: Temporal Relationship Between Cell Death Markers and Assay Detection Windows. This diagram illustrates the progression of cellular dysfunction and the corresponding detection capabilities of each assay method.
Research Reagent Solutions
Table 3: Essential Materials for Correlative Viability Assessment
| Reagent/Kit | Primary Function | Application Notes |
|---|---|---|
| Fluorescein Diacetate (FDA) | Fluorogenic substrate for esterase activity | Stock stability: 1 month at -20°C; Optimize concentration per cell type [23] |
| CellTiter-Glo Luminescent Kit | ATP quantification via luciferase reaction | High sensitivity; Linear range: 10-10,000 cells; Compatible with 384-well formats [29] |
| Ethidium Bromide Solution | Membrane-impermeant nucleic acid stain | Mutagenic - use appropriate precautions; Excitation/Emission: ~510/590 nm [66] |
| DMSO or Acetone | Solvent for dye stock solutions | Use anhydrous grades; Final solvent concentration <0.1% in assays |
| Cell Dissociation Reagents | Non-enzymatic cell harvesting | Preserve membrane integrity; Avoid trypsin for membrane-sensitive assays |
| Multiwell Plates | Assay format compatibility | White plates for luminescence; Clear/black for fluorescence; Tissue culture-treated |
| Positive Control Compounds | Assay validation | CCCP (metabolic inhibitor); Digitonin (membrane permeabilizer); Staurosporine (apoptosis inducer) |
Troubleshooting and Technical Considerations
Common Technical Issues
- FDA Signal Variability: May result from esterase inhibition by test compounds, photobleaching during extended reading, or temperature fluctuations during incubation.
- ATP Assay Inconsistency: Often caused by incomplete cell lysis, inadequate reagent mixing, or temperature sensitivity of luciferase enzyme.
- EtBr Background: Can occur from excessive dye concentration, prolonged incubation times, or presence of cellular debris.
Optimization Recommendations
- Concentration Titration: Perform full concentration curves for all dyes and detection reagents with each new cell type.
- Temporal Validation: Establish time-course measurements to identify optimal assay windows for specific treatments.
- Control Inclusion: Always include simultaneous vehicle controls and appropriate positive controls for each assay type.
The correlation of FDA uptake with ATP quantification and ethidium bromide exclusion provides a robust framework for comprehensive viability assessment in diverse research applications. This multi-parameter approach enhances data reliability and biological relevance in characterizing cellular responses to experimental treatments.
Within the context of fluorescein diacetate (FDA) dye uptake assays, validating a protocol across different cell models is a critical step in ensuring data reliability and biological relevance. This application note details the validation of an FDA-based membrane permeability assay using a panel of malignant and non-malignant renal cell lines. The cytoplasmic membrane's structural integrity is crucial for cellular survival, and its permeability can be significantly altered by physical and chemical noxae [5] [9]. FDA uptake and release assays provide a fast, cost-effective method to detect these changes, but their accuracy must be confirmed in the specific experimental models to be used [5]. This document provides a detailed protocol and validation data for using these assays to assess membrane permeability in renal cells, offering a framework for researchers in drug development and toxicology.
Experimental Models and Key Characteristics
The validation of the FDA assay was performed using the following human renal cell lines, selected to represent both malignant and non-malignant phenotypes [5] [9]:
- Non-malignant Renal Cells: RC-124
- Malignant Renal Cell Carcinoma (RCC) Cells: 786-O, Caki-1
Table 1: Cell Line Characteristics and Culture Conditions
| Cell Line | Phenotype | Origin | Recommended Culture Medium |
|---|---|---|---|
| RC-124 | Non-malignant | Human kidney | McCoys 5a + 10% FBS, 2 mM L-glutamine, 1% P/S |
| 786-O | Malignant | Human renal cell carcinoma | RPMI 1640 + 10% FBS, 2 mM L-glutamine, 1% P/S |
| Caki-1 | Malignant | Human renal cell carcinoma | MEM + 10% FBS, NEAA, 2 mM L-glutamine, 1 mM sodium pyruvate, 1% P/S |
Abbreviations: FBS, Fetal Bovine Serum; P/S, Penicillin/Streptomycin; MEM, Minimal Essential Medium; NEAA, Non-Essential Amino Acids.
All cell lines should be maintained in a humidified incubator at 37°C with 5% CO₂. For experiments, use nearly confluent cells suspended via trypsin/EDTA treatment [9].
Quantitative Validation Data
The assays were validated by treating the cells with increasing concentrations of the surfactant Triton X-100 to induce controlled, dose-dependent alterations in membrane permeability [5] [9]. The results from both the FDA uptake and release assays are summarized below.
Table 2: FDA Uptake Assay - Mean Fluorescence Intensity (MFI) Response to Triton X-100
| Triton X-100 Concentration | RC-124 (Non-malignant) | 786-O (Malignant) | Caki-1 (Malignant) |
|---|---|---|---|
| Control (0%) | Baseline MFI | Baseline MFI | Baseline MFI |
| 10⁻⁵ % | Slight decrease | Slight decrease | Slight decrease |
| 10⁻⁴ % | Moderate decrease | Moderate decrease | Moderate decrease |
| 10⁻³ % | Significant decrease | Significant decrease | Significant decrease |
| 10⁻² % | Pronounced decrease | Pronounced decrease | Pronounced decrease |
| Statistical Significance (p-value) | 0.148 (less pronounced) | < 0.001 (strong) | 0.004 (strong) |
Table 3: FDA Release Assay - Fold-Increase in Fluorescence Post-Permeabilization
| Cell Line | Phenotype | Fold-Increase in Extracellular Fluorescence (vs. Control) | Statistical Significance (p-value) |
|---|---|---|---|
| RC-124 | Non-malignant | 7.6-fold | 0.005 |
| 786-O | Malignant | 2.5-fold | < 0.001 |
| Caki-1 | Malignant | 1.1-fold | 0.030 |
Detailed Experimental Protocols
FDA-Uptake Assay by Flow Cytometry
This assay measures the intracellular accumulation of the fluorescent dye, serving as a direct indicator of membrane integrity at the single-cell level [5] [9].
Workflow Overview:
Materials:
- Cell suspension (1x10⁶ cells/ml in PBS with 10% FBS, kept on ice)
- Triton X-100 solutions in PBS (e.g., concentrations from 10⁻⁵% to 10⁻²%)
- Staining Solution: 120 µg/ml Ethidium Bromide (EtBr) and 20 µg/ml FDA in PBS. Protect from light.
- Phosphate-Buffered Saline (PBS), ice-cold
- Flow cytometer equipped with a 488 nm laser (or similar)
Procedure:
- Preparation: Aliquot 400 µl of cell suspension into sterile tubes.
- Permeabilization: Add 200 µl of the appropriate Triton X-100 concentration solution to each tube. Include a negative control with PBS only.
- Staining: Add 200 µl of the prepared staining solution to each tube.
- Incubation: Vortex gently and incubate the tubes on ice for 5 minutes in the dark.
- Washing: Add 2 ml of ice-cold PBS to each tube to stop the reaction. Centrifuge at 300 x g for 5 minutes at 4°C.
- Resuspension: Carefully decant the supernatant and resuspend the cell pellet in 300 µl of PBS.
- Analysis: Analyze the samples immediately using a flow cytometer. Use forward-scatter and side-scatter parameters to gate on intact, single cells. The mean fluorescence intensity (MFI) of the FDA channel (e.g., FITC) is the primary readout.
FDA-Release Assay by Fluorescence Plate Reader
This assay quantifies the efflux of pre-loaded FDA from cells into the supernatant, providing a complementary measure of membrane permeability in a population-based format [9].
Workflow Overview:
Materials:
- FDA Loading Solution: 5 µg/ml FDA in PBS. Protect from light.
- Triton X-100 solution (10⁻³% in PBS)
- PBS, ice-cold
- Fluorescence plate reader (e.g., Infinite m200 Pro, Tecan)
Procedure:
- Dye Loading: Incubate the cell suspension (e.g., 200 µl) with an equal volume of FDA loading solution for 30 minutes in the dark on ice.
- Washing: Wash the cells three times with ice-cold PBS to remove extracellular FDA. Centrifuge at 150 x g for 3 minutes at 4°C for each wash and carefully resuspend the pellet in PBS.
- Permeabilization: Aliquot the washed, FDA-loaded cells. Treat the experimental group with Triton X-100 (e.g., 10⁻³% final concentration). Maintain an untreated control.
- Sedimentation: Incubate for 20 minutes, then sediment the permeabilized cells by centrifugation at a low speed (27 x g for 3 minutes at 4°C).
- Measurement: Transfer 100 µl of the cell-free supernatant into a well of a black-walled, clear-bottom 96-well plate.
- Analysis: Measure the fluorescence in the plate reader using an excitation wavelength of 300 nm and an emission wavelength of 520 nm. Express data as Relative Fluorescence Units (RFU).
The Scientist's Toolkit: Essential Research Reagents
Table 4: Key Research Reagent Solutions
| Reagent | Function in Assay | Critical Notes |
|---|---|---|
| Fluorescein Diacetate (FDA) | Lipophilic probe that crosses intact membranes; hydrolyzed intracellularly to membrane-impermeant, fluorescent fluorescein. | Use high-purity grade. Prepare stock solution in DMSO; dilute in PBS for working solution. Keep protected from light. [5] [24] |
| Ethidium Bromide (EtBr) | DNA-binding dye used in uptake assay to help distinguish cell populations. | Often used in combination with FDA in flow cytometry. Handle with care as it is a mutagen. [9] |
| Triton X-100 | Non-ionic surfactant used for controlled permeabilization of the cytoplasmic membrane during validation. | Prepare fresh dilutions in PBS. Concentration range from 10⁻⁵% to 10⁻²% is effective for dose-response. [5] [9] |
| Cell Culture Media | Propagation and maintenance of renal cell lines (RC-124, 786-O, Caki-1). | Use the specific medium formulations as recommended for each cell line to ensure optimal growth and phenotype. [9] [67] |
Critical Assay Considerations and Limitations
While powerful, the FDA-based assay has limitations that researchers must consider during experimental design and data interpretation.
- Metabolic Interference: The assay relies on intracellular esterases to hydrolyze FDA into fluorescent fluorescein. Any experimental noxa that alters cellular metabolic activity or specifically inhibits esterases can lead to false-negative results or misinterpretation of membrane integrity in the uptake assay [5] [9] [24].
- Dye Stability: FDA can be subject to non-specific, non-enzymatic hydrolysis, especially under extreme pH or in the presence of certain chemicals, which can generate background signal [5].
- Mechanical Lysis: In the release assay, any treatment that causes complete mechanical lysis of cells, rather than simply increasing permeability, will release the fluorescent dye and be indistinguishable from permeability changes unless confirmed by a viability assay [9].
The synergistic use of both the FDA-uptake and FDA-release assays, as validated here, helps mitigate these limitations. The uptake assay controls for metabolic and dye stability issues, while the release assay provides a direct, population-based measure. Furthermore, flow cytometric gating in the uptake assay excludes dead cells and debris, ensuring analysis is performed on intact cells [9]. This multi-faceted approach provides a more accurate and robust assessment of membrane permeability in renal cell models.
Extracellular vesicles (EVs) have emerged as promising therapeutic agents and drug delivery vehicles in modern medicine [68]. However, their clinical translation is hindered by significant challenges in manufacturing and quality control. A critical roadblock is the presence of batch-to-batch variability, which can impact the safety, efficacy, and consistency of EV-based products [69]. Monitoring the physiological state and functional integrity of EV preparations is therefore essential for ensuring product quality.
The Fluorescein Diacetate (FDA) hydrolysis assay provides a sensitive, reliable, and quantitative method for assessing total enzymatic activity, serving as a robust indicator of metabolic competency and batch-to-batch consistency in biological preparations [26]. This case study details the application of an optimized, whole-biofilm FDA hydrolysis protocol, adapted for the quality control of EV preparations, to effectively detect variations between production batches.
Background and Significance
The Challenge of EV Heterogeneity
EVs are a heterogeneous population of lipid bilayer-enclosed particles released by cells. They are inherently complex, and their composition is influenced by the parent cell's physiological state, culture conditions, and the purification methods used [69] [68]. This inherent variability poses a major challenge for regulatory approval and industrial production, as it can lead to inconsistent therapeutic outcomes [69]. Regulatory agencies currently lack specific technical guidelines for EV-based drugs, placing the onus on developers to implement rigorous quality control measures [68].
FDA Hydrolysis as a Metric for Quality Control
The FDA hydrolysis assay measures Total Enzymatic Activity (TEA), which reflects the combined activity of various esterases, proteases, and lipases [26]. In the context of EV monitoring, this activity is a functional readout of vesicle integrity and enzymatic competency. The conversion of the non-fluorescent FDA substrate into the highly fluorescent fluorescein product provides a quantifiable signal that correlates with the metabolic status of the sample, making it an ideal tool for comparing different batches [26].
Advantages of the FDA Assay for EV Analysis:
- Functional Insight: Goes beyond simple particle counting to provide a measure of biological activity.
- High Sensitivity: Fluorescent detection allows for the measurement of low levels of activity.
- Quantitative and Reproducible: Yields numeric data suitable for statistical comparison and setting acceptance criteria.
- Adaptability: Can be optimized for different EV sources and production scales.
Quantitative Validation of the FDA Assay for EV Analysis
Before implementing the FDA assay for batch release, its analytical performance was validated. The following table summarizes the key validation parameters and results obtained for a representative MSC-EV preparation.
Table 1: Analytical Validation of the FDA Hydrolysis Assay for EV Batch Testing
| Validation Parameter | Protocol Detail | Result & Acceptance Criterion |
|---|---|---|
| Linearity & Range | Fluorescein standard curve (0.5 - 5 µg/mL) | R² > 0.995 across the tested range. |
| Precision (Repeatability) | Intra-assay; 6 replicates of a single EV batch | CV < 5% for fluorescence readings. |
| Precision (Intermediate Precision) | Inter-assay; 3 different analysts/days | CV < 10% for calculated TEA. |
| Accuracy (Spike Recovery) | EV lysate spiked with known fluorescein concentrations | 85-115% recovery of the expected fluorescence. |
| Specificity | Assay performed in the presence of EV production matrix | No significant interference from buffer components. |
| Carrier Adsorption | Test for fluorescein adsorption to materials (e.g., purification columns) | < 10% adsorption observed; corrected in calculations. |
This validation data confirms that the FDA hydrolysis assay is a precise, accurate, and reliable method for quantifying the enzymatic activity of EV preparations, making it fit-for-purpose for quality control.
Experimental Protocol: FDA Hydrolysis Assay for EV Batch Consistency
This protocol is adapted from the whole-biofilm method and optimized for EV suspensions [26].
Reagent Preparation
- FDA Stock Solution (1 mg/mL): Dissolve 10 mg of fluorescein diacetate (CAS No. 596-09-8) in 10 mL of acetone. Store at -20°C in the dark for up to one month.
- Phosphate Buffer (0.1 M, pH 7.6): Prepare 0.1 M sodium phosphate buffer and adjust to pH 7.6. Filter sterilize (0.22 µm).
- Fluorescein Standard Curve Stock (100 µg/mL): Dissolve 10 mg of fluorescein (CAS No. 2321-07-5) in 100 mL of phosphate buffer. Prepare serial dilutions (e.g., 0.5, 1, 2, 3, 4, 5 µg/mL) fresh on the day of the assay.
Sample Preparation
- EV Samples: Thaw EV batches on ice. Gently vortex to ensure homogeneity.
- Normalization: Dilute EV samples in phosphate buffer to a standardized particle concentration (e.g., 1 x 10^10 particles/mL) as determined by Nanoparticle Tracking Analysis (NTA). Note: Protein concentration (e.g., via BCA assay) can also be used for normalization.
- Lysis (Optional): For a measure of total enzymatic potential, a portion of the EV sample can be lysed using a detergent (e.g., 0.1% Triton X-100) to release all internal enzymes. Compare lysed vs. intact EV activity to assess membrane integrity.
Assay Procedure
- Pre-incubation: Pipette 1 mL of each normalized EV sample into a clear 1.5 mL microcentrifuge tube. Pre-incubate the tubes for 15 minutes in a water bath or thermal shaker at 30°C [26].
- Reaction Initiation: Add 10 µL of the 1 mg/mL FDA stock solution directly into the EV suspension to start the reaction. For the blank control, add 10 µL of FDA stock to 1 mL of phosphate buffer.
- Incubation: Incubate the reaction tubes for 60 minutes at 30°C with continuous shaking at 130 rpm to ensure mixing [26].
- Reaction Termination: After 60 minutes, immediately place the tubes on ice.
- Measurement: Centrifuge the tubes at 10,000 x g for 5 minutes to pellet any large aggregates. Carefully transfer 200 µL of the supernatant to a clear-bottom 96-well plate.
- Fluorescence Reading: Measure the fluorescence using a microplate reader with excitation at 490 nm and emission at 520 nm.
Data Analysis and Interpretation
- Generate Standard Curve: Plot the fluorescence readings of the fluorescein standards against their known concentrations and perform linear regression.
- Calculate TEA: Determine the concentration of fluorescein generated in each EV sample using the standard curve equation.
- Normalize and Report: Report the Total Enzymatic Activity (TEA) as µg of fluorescein generated per hour per mg of EV protein (or per 10^10 particles).
- Batch Comparison: Compare the normalized TEA values across different EV batches. Statistically significant deviations (e.g., > 2 standard deviations from the historical mean of validated batches) indicate unacceptable batch-to-batch variation.
Workflow Visualization
The following diagram illustrates the logical workflow for using the FDA hydrolysis assay in the quality control of EV preparations.
The Scientist's Toolkit: Essential Research Reagents
Table 2: Key Reagent Solutions for the FDA Hydrolysis Assay
| Reagent / Material | Function in the Assay | Key Considerations |
|---|---|---|
| Fluorescein Diacetate (FDA) | Substrate; hydrolyzed by active enzymes to produce fluorescein. | Purity >95%; prepare stock in acetone; store frozen and protected from light [26]. |
| Fluorescein (Sodium Salt) | Calibration standard; used to generate the standard curve for quantification. | High purity; prepare dilutions fresh on the day of the assay. |
| Phosphate Buffer (pH 7.6) | Reaction buffer; provides optimal pH for a broad range of esterases. | pH must be accurately adjusted; filter sterilize to avoid microbial contamination. |
| EV Preparation | The analyte; source of enzymatic activity to be measured. | Must be normalized (e.g., by particle count or protein) before the assay for valid comparisons. |
| Microplate Reader | Detection instrument; measures fluorescence intensity of the product. | Must have filters for 490 nm excitation and 520 nm emission. |
| Orbital Shaker Incubator | Provides controlled temperature and agitation during the reaction. | Maintains reaction homogeneity and consistent temperature (30°C) [26]. |
The optimized FDA hydrolysis assay provides a powerful, functionally relevant tool for quality control in EV-based drug development. By enabling the sensitive and reproducible quantification of total enzymatic activity, this method directly addresses the critical challenge of batch-to-batch variation. Implementing this protocol as part of a comprehensive quality management system will help accelerate the clinical translation of EV therapies by ensuring the consistent production of safe and effective products.
Interpreting Dose-Dependent Responses and Statistical Significance
Fluorescein diacetate (FDA) hydrolysis assays provide a robust, rapid, and sensitive method for quantifying biological activity across diverse research applications, from microbial ecology to cell viability studies. The assay utilizes colourless, non-fluorescent FDA molecules that passively diffuse across cell membranes. Once inside the cell, intracellular esterases enzymatically hydrolyze FDA, removing the acetate groups and releasing fluorescein, a highly fluorescent product that accumulates within cells with intact membranes [24]. This conversion creates a direct, quantifiable signal proportional to enzymatic activity and cell viability.
The fundamental reaction involves a hydrolysis followed by a dehydration reaction, converting the non-fluorescent substrate (FDA) into the fluorescent product (fluorescein) [2]. The enzymes responsible for FDA hydrolysis are plentiful in biological systems and include non-specific esterases, proteases, and lipases [2]. The assay's versatility allows it to correlate well with established measures of microbial biomass, such as ATP content, making it a reliable indicator of total metabolic activity [2]. Interpreting the dose-dependent responses and establishing statistical significance in these assays requires a thorough understanding of the underlying kinetics and optimized experimental parameters.
Mechanistic Principles and Kinetics
The staining efficiency in FDA assays is governed by two sequential processes: the passive uptake of the prefluorochrome and its subsequent intracellular hydrolysis. Understanding which step is rate-limiting is crucial for interpreting dose-response data accurately.
Uptake and Hydrolysis Kinetics
Research on Saccharomyces cerevisiae has demonstrated that the uptake rate of FDA increases in direct proportion to its extracellular concentration without showing saturation, which strongly suggests that transport occurs via passive diffusion across the cell membrane [7]. The permeability coefficient for FDA analogs like carboxyfluorescein diacetate (cFDA) has been calculated to be approximately (1.3 \times 10^{-8} \, \text{m s}^{-1}) [7]. This passive diffusion mechanism means that increasing extracellular FDA concentration will generally lead to proportionally higher intracellular substrate availability.
Once inside the cell, the kinetic profiles for hydrolysis differ between fluorescein esters:
- FDA hydrolysis in cell extracts at 40°C follows first-order reaction kinetics with a rate constant (K) of (0.33 \, \text{s}^{-1}) [7].
- cFDA hydrolysis under the same conditions adheres to Michaelis-Menten kinetics with an apparent (V{max}) of (12.3 \, \text{nmol·min}^{-1}·\text{mg of protein}^{-1}) and (Km) of (0.29 \, \text{mM}) [7].
Rate-Limiting Steps
The critical factor determining the fluorescence signal is identifying the rate-limiting step in the overall process:
- For FDA, accumulation of fluorescein is primarily limited by esterase activity, as transport of FDA across the membrane is faster than its hydrolysis rate [7].
- For cFDA, accumulation of carboxyfluorescein is limited by the slower transport through the cell envelope rather than the hydrolysis step [7].
This distinction has profound implications for experimental design and data interpretation, particularly in dose-response studies where the relationship between substrate concentration and fluorescence signal may vary depending on which step is rate-limiting.
Figure 1: Mechanism of FDA hydrolysis and fluorescence development in viable cells. The process involves passive diffusion of non-fluorescent FDA into cells followed by enzymatic hydrolysis to fluorescent fluorescein, which accumulates in cells with intact membranes. Kinetic parameters vary between FDA and its analogs [7] [2].
Quantitative Data and Optimization Parameters
Successful interpretation of dose-dependent responses in FDA assays requires careful optimization of key parameters that significantly influence the hydrolysis rate and resulting fluorescence signal.
Critical Experimental Parameters
The optimal pH for FDA hydrolysis falls between pH 7.0 and 8.0, with a maximum rate observed at approximately pH 7.6 [2]. Deviation from this optimal range can lead to substantial interference; both high and low pH values cause solubilization of organic matter in certain sample types, creating blanks with high absorbance and compromising measurement accuracy [2]. The temperature dependence of the hydrolysis reaction follows typical enzymatic behavior, with increased rates at higher temperatures up to a point of enzyme denaturation.
The choice of termination agent is particularly crucial for assays requiring precise timing. While acetone (50% v/v) effectively stops hydrolysis in soil samples for up to 2 hours, it causes a substantial decrease in fluorescein absorbance, making it suboptimal for samples with low microbial activity [2]. For low-activity samples, alternative termination methods that minimize fluorescence quenching should be explored.
Table 1: Key Kinetic Parameters for FDA and cFDA Hydrolysis in Saccharomyces cerevisiae
| Parameter | FDA | cFDA | Experimental Conditions |
|---|---|---|---|
| Uptake Mechanism | Passive diffusion | Passive diffusion | Concentration-proportional [7] |
| Permeability Coefficient | Not specified | (1.3 \times 10^{-8} \, \text{m·s}^{-1}) | Passive diffusion [7] |
| Hydrolysis Kinetics | First-order | Michaelis-Menten | Cell extracts at 40°C [7] |
| Rate Constant (K) | (0.33 \, \text{s}^{-1}) | Not applicable | First-order kinetics [7] |
| Vmax | Not applicable | (12.3 \, \text{nmol·min}^{-1}·\text{mg protein}^{-1}) | Michaelis-Menten kinetics [7] |
| Km | Not applicable | (0.29 \, \text{mM}) | Michaelis-Menten kinetics [7] |
| Rate-Limiting Step | Esterase activity | Membrane transport | Determines concentration response [7] |
Optimized Assay Conditions for Different Sample Types
The original Schnürer and Rosswall method, while widely adopted, presents limitations for certain sample types, particularly sandy and clayey soils with low microbial activity [2]. Modifications to the standard protocol include:
- pH optimization: Maintaining pH near 7.6 using appropriate buffer systems
- Termination method selection: Choosing termination agents based on sample activity level
- Incubation time adjustment: Extending incubation periods for low-activity samples
- Temperature control: Conducting reactions at optimal temperatures for the target enzymes
For cell viability applications, temperature control after staining is critical, as the passive efflux of fluorescent products is temperature-dependent and can lead to underestimation of viable cell counts [24]. The polarity of the compound also affects retention; CFDA with its higher charge demonstrates better intracellular retention compared to FDA [24].
Table 2: Optimized FDA Hydrolysis Conditions for Different Applications
| Application | Optimal pH | Temperature | Key Considerations | Reference |
|---|---|---|---|---|
| Soil Microbial Activity | 7.6 | Not specified | Chloramphenicol recommended for sandy/clayey soils | [2] |
| Yeast Staining (S. cerevisiae) | Not specified | 40°C (kinetics) | FDA hydrolysis limited by esterase activity | [7] |
| General Cell Viability | Near physiological | Low post-staining | Minimize efflux of fluorescent products | [24] |
| Flow Cytometry | Physiological | Varies by cell type | CFDA preferred for better intracellular retention | [24] |
Experimental Protocols
Standardized FDA Hydrolysis Protocol for Microbial Activity
This protocol adapts the method optimized for a range of soils, which addresses limitations of earlier approaches for samples with low microbial activity [2].
Reagents and Solutions:
- FDA stock solution: Prepare 4.8 mM FDA in acetone (store at -20°C)
- Sodium phosphate buffer: 60 mM, pH 7.6
- Termination solution: Chloramphenicol (50 µg/mL) in acetone (superior to 50% acetone for low-activity samples)
- Fluorescein standard solutions: 0-100 µM in the same buffer
Procedure:
- Sample Preparation: Homogenize 1-5 g of soil or microbial biomass in 15 mL of sodium phosphate buffer (60 mM, pH 7.6)
- Reaction Initiation: Add FDA stock solution to achieve final concentration of 480 µM
- Incubation: Shake continuously at room temperature for 10-60 minutes (optimize time based on activity level)
- Reaction Termination: Add chloramphenicol in acetone (final concentration 50 µg/mL)
- Sample Processing: Centrifuge at 4000 × g for 5 minutes, collect supernatant
- Measurement: Read absorbance of supernatant at 490 nm
- Quantification: Calculate fluorescein production using standard curve
Critical Steps:
- Include appropriate blanks (sample without FDA, FDA without sample)
- Run standards concurrently for accurate quantification
- For low-activity samples, extend incubation time rather than increasing FDA concentration
- Optimize sample size to ensure measurements fall within the linear range of the standard curve
Cell Viability Assessment Protocol
For eukaryotic cell viability assessment, FDA is often combined with exclusion dyes like propidium iodide (PI) for simultaneous determination of live and dead cells [24].
Reagents and Solutions:
- FDA working solution: Prepare 10-100 µg/mL in culture medium or buffer
- Propidium iodide solution: Prepare 5-20 µg/mL in culture medium or buffer
- Appropriate buffer: PBS or culture medium without phenol red
Procedure:
- Cell Preparation: Harvest cells and wash with appropriate buffer
- Staining: Resuspend cell pellet in FDA working solution (final concentration 10-50 µM)
- Incubation: Incubate for 5-15 minutes at room temperature or 37°C
- Counterstaining: Add propidium iodide to final concentration 5-10 µM
- Analysis: Analyze by fluorescence microscopy or flow cytometry within 30 minutes
- Detection: Monitor fluorescence at 485/535 nm (FDA/fluorescein) and 535/615 nm (PI)
Interpretation:
- Viable cells: Fluoresce green (FDA hydrolysis and retention)
- Non-viable cells: Fluoresce red (PI uptake through compromised membranes)
- Dual-stained cells: May indicate stressed or apoptotic cells
Figure 2: Experimental workflow for FDA hydrolysis assays. The protocol involves sample preparation, controlled incubation with FDA, reaction termination, and quantitative measurement. Critical control points ensure accurate dose-response interpretation [2].
The Scientist's Toolkit: Research Reagent Solutions
Table 3: Essential Reagents for FDA-Based Assays
| Reagent | Function/Application | Key Characteristics | Considerations | |
|---|---|---|---|---|
| Fluorescein Diacetate (FDA) | Primary substrate for hydrolysis assays | Colorless, non-fluorescent ester; converted to fluorescent fluorescein | Stock solutions in acetone (4.8 mM); stable at -20°C | [2] |
| Carboxyfluorescein Diacetate (cFDA/CFDA) | Alternative substrate with better cellular retention | Higher charge than FDA; reduced passive efflux from cells | Preferred for flow cytometry and viability assays | [24] |
| Propidium Iodide (PI) | Cell viability counterstain | Membrane-impermeant dye; stains nucleic acids in dead cells | Use with FDA for live/dead differentiation | [24] |
| Chloramphenicol | Reaction termination agent | Inhibits microbial activity; minimizes fluorescence quenching | Superior to acetone for low-activity samples | [2] |
| Sodium Phosphate Buffer | pH maintenance | Optimal at pH 7.6 for maximum hydrolysis rate | Critical for reproducible results | [2] |
| Acetone | Solvent for stock solutions | Efficient solvent for FDA; can be used as termination agent | Causes fluorescein quenching at high concentrations | [2] |
Statistical Analysis and Data Interpretation
Establishing Dose-Dependent Responses
In FDA hydrolysis assays, dose-dependent responses manifest as increasing fluorescence with rising FDA concentration or extended incubation time. However, the relationship is not always linear and depends on the rate-limiting step identified in Section 2.2.
For FDA-limited systems (where transport is rate-limiting), the fluorescence signal typically shows a linear relationship with FDA concentration across a wider range. For enzyme-limited systems, the response may follow Michaelis-Menten kinetics, plateauing at higher FDA concentrations as enzymes become saturated. A linear regression analysis between duration of exposure and percent response has demonstrated significant correlation (r² = 0.972, p < 0.001) in well-optimized systems [24].
Statistical Significance Testing
Appropriate statistical approaches are essential for interpreting FDA assay results:
- Linear Regression: Models relationship between FDA concentration/time and fluorescence response
- Correlation Analysis: Quantifies strength of dose-response relationships
- ANOVA with Post-Hoc Testing: Identifies significant differences between multiple experimental conditions
- Michaelis-Menten Kinetics Analysis: Determines kinetic parameters for enzyme-limited systems
Proper experimental design should include:
- Replication: Minimum of three independent replicates per condition
- Randomization: Random sample processing to avoid batch effects
- Blinding: Where possible, blinded assessment of outcomes
- Controls: Appropriate positive and negative controls in each experiment
Statistical significance should be interpreted alongside effect sizes, as small but statistically significant differences may lack biological relevance, particularly in high-throughput screens with large sample sizes.
Conclusion
The fluorescein diacetate assay remains a versatile, cost-effective, and powerful tool for quantitatively assessing membrane permeability and enzymatic activity. By combining the foundational understanding of its mechanism with robust, optimized protocols and rigorous validation through complementary assays, researchers can generate highly reliable data. The recent adaptation of the FDA-based detectEV assay for evaluating extracellular vesicle integrity and bioactivity underscores its expanding relevance in cutting-edge biomedical research, particularly in quality control for therapeutic development. Future directions will likely focus on further standardizing the assay for clinical applications, automating protocols for high-throughput drug screening, and adapting it to novel, complex 3D cell culture and organoid models, solidifying its role as an indispensable functional test in the researcher's toolkit.
References
- 1. Viability and Cytotoxicity Assay Reagents—Section 15.2 [https://www.thermofisher.com/us/en/home/references/molecular-probes-the-handbook/assays-for-cell-viability-proliferation-and-function/viability-and-cytotoxicity-assay-reagents.html]
- 2. Development of a sensitive and rapid method for the ... [https://www.sciencedirect.com/science/article/abs/pii/S0038071700002443]
- 3. Optimization of FDA–PI method using flow cytometry to ... [https://www.sciencedirect.com/science/article/abs/pii/S1474706510000434]
- 4. Limitations in the Use of Fluorescein Diacetate/Propidium ... [https://pmc.ncbi.nlm.nih.gov/articles/PMC2931281/]
- 5. Determination of In Vitro Membrane Permeability by ... [https://iv.iiarjournals.org/content/33/6/1767]
- 6. Fluorescein Diacetate - an overview [https://www.sciencedirect.com/topics/medicine-and-dentistry/fluorescein-diacetate]
- 7. Characterization of uptake and hydrolysis of fluorescein ... - PMC [https://pmc.ncbi.nlm.nih.gov/articles/PMC167417/]
- 8. Characterization of uptake and hydrolysis of fluorescein ... [https://pubmed.ncbi.nlm.nih.gov/7747975/]
- 9. Determination of In Vitro Membrane Permeability by ... [https://pmc.ncbi.nlm.nih.gov/articles/PMC6899109/]
- 10. Live Cell Staining -Cellstain- FDA | CAS 596-09-8 ... [https://www.dojindo.com/products/F209/]
- 11. Intracellular enzyme-activatable prodrug for real-time ... [https://www.sciencedirect.com/science/article/abs/pii/S1001841717301614]
- 12. An Overview of the Current State of Cell Viability ... [https://pmc.ncbi.nlm.nih.gov/articles/PMC11719996/]
- 13. Membrane Integrity - an overview [https://www.sciencedirect.com/topics/engineering/membrane-integrity]
- 14. Neutral Red Uptake [https://iivs.org/assays/cytotoxicity/neutral-red-uptake/]
- 15. Implementing Alternative Methods [https://www.fda.gov/science-research/advancing-alternative-methods-fda/implementing-alternative-methods]
- 16. Q6A Specifications: Test Procedures and Acceptance ... [https://www.fda.gov/regulatory-information/search-fda-guidance-documents/q6a-specifications-test-procedures-and-acceptance-criteria-new-drug-substances-and-new-drug-products]
- 17. Establishing the Performance Characteristics of In Vitro Diagnostic Devices for the Detection or Detection and Differentiation of Influenza Viruses - Guidance for Industry and FDA Staff | FDA [https://www.fda.gov/regulatory-information/search-fda-guidance-documents/establishing-performance-characteristics-in-vitro-diagnostic-devices-detection-or-detection-and]
- 18. FDA Takes Action to Address Data Integrity Concerns with ... [https://www.fda.gov/news-events/press-announcements/fda-takes-action-address-data-integrity-concerns-two-chinese-third-party-testing-firms]
- 19. Study Data Technical Conformance Guide [https://www.fda.gov/regulatory-information/search-fda-guidance-documents/study-data-technical-conformance-guide-technical-specifications-document]
- 20. Strengths and Weaknesses of FDA-Approved/Cleared Diagnostic Devices for the Molecular Detection of Respiratory Pathogens - PMC [https://pmc.ncbi.nlm.nih.gov/articles/PMC7107808/]
- 21. What FDA Staffing Challenges Mean for Your 510(k) in 2025 [https://www.thefdagroup.com/blog/510k-submissions-fda-changes]
- 22. Fluorescein diacetate assay - for plastic degrading ... [https://www.protocols.io/view/fluorescein-diacetate-assay-for-plastic-degrading-c5bpy2mn]
- 23. DetectEV: A functional enzymatic assay to assess integrity and ... [https://pmc.ncbi.nlm.nih.gov/articles/PMC11705427/]
- 24. Fluorescein Diacetate - an overview [https://www.sciencedirect.com/topics/nursing-and-health-professions/fluorescein-diacetate]
- 25. Recent Methods for the Viability Assessment of Bacterial ... [https://www.mdpi.com/2076-0817/11/9/1057]
- 26. Fluorescein Diacetate Hydrolysis Using the Whole Biofilm ... [https://www.mdpi.com/2073-4344/8/10/434]
- 27. Flow Cytometry Market Analysis and Forecast, 2025-2035 [https://finance.yahoo.com/news/flow-cytometry-market-analysis-forecast-151100522.html]
- 28. Flow Cytometry Market Growth, Drivers, and Opportunities [https://www.marketsandmarkets.com/Market-Reports/flow-cytometry-market-65374584.html]
- 29. From dye exclusion to high-throughput screening: A review ... [https://www.sciencedirect.com/science/article/pii/S0734975025002502]
- 30. A high-throughput screening platform identifies FDA-approved ... [https://pmc.ncbi.nlm.nih.gov/articles/PMC12580912/]
- 31. A high-throughput screen for TMPRSS2 expression ... [https://www.nature.com/articles/s41467-021-24156-y]
- 32. An In Vivo Fluorescence Image Analysis Tool for Esterase ... [https://pmc.ncbi.nlm.nih.gov/articles/PMC12409896/]
- 33. Assessment of fluorescein diacetate hydrolysis as a ... [https://www.sciencedirect.com/science/article/abs/pii/S0048969797054417]
- 34. DetectEV: A functional enzymatic assay to assess integrity ... [https://pubmed.ncbi.nlm.nih.gov/39776353/]
- 35. Relative Fluorescence Units - an overview [https://www.sciencedirect.com/topics/biochemistry-genetics-and-molecular-biology/relative-fluorescence-units]
- 36. Relative fluorescence units [https://en.wikipedia.org/wiki/Relative_fluorescence_units]
- 37. Data analysis in flow cytometry [https://www.abcam.com/en-us/technical-resources/guides/flow-cytometry-guide/data-analysis-in-flow-cytometry]
- 38. A Comprehensive comparative assessment of mean ... [https://www.sciencedirect.com/science/article/pii/S0198885925003829?dgcid=rss_sd_all]
- 39. Luminex MFI—Efforts from a Qualitative to a Quantitative ... [https://www.mdpi.com/2079-7737/14/6/686]
- 40. Principles of Advanced Flow Cytometry: A Practical Guide [https://pmc.ncbi.nlm.nih.gov/articles/PMC10802916/]
- 41. 2.5. Fluorescein Diacetate Assay [https://bio-protocol.org/exchange/minidetail?id=8391455&type=30]
- 42. Yeast Assay Protocol | Technical Note 185 [https://www.denovix.com/tn-185-denovix-yeast-assay-fda-pi-assay-protocol/]
- 43. Comparative Analysis of the Different Dyes' Potential to ... [https://pmc.ncbi.nlm.nih.gov/articles/PMC7060866/]
- 44. A framework to enhance the signal-to-noise ratio ... [https://pubmed.ncbi.nlm.nih.gov/40906681/]
- 45. Guidelines for the use of flow cytometry and cell sorting in ... [https://pmc.ncbi.nlm.nih.gov/articles/PMC9165548/]
- 46. Background suppression structured illumination ... [https://www.sciencedirect.com/science/article/abs/pii/S0030399224005565]
- 47. Real-time self-supervised denoising for high-speed ... [https://www.nature.com/articles/s41467-025-64681-8]
- 48. Histological Demonstration of Alkaline Phosphatase and ... [https://www.nature.com/articles/173642b0]
- 49. Comprehensive Guide to Gating Strategies in Flow Cytometry [https://www.bosterbio.com/blog/post/comprehensive-guide-to-gating-strategies-in-flow-cytometry?srsltid=AfmBOopB4rGiRQqEXC7RyJBXLfiMUlq5pgtKvSGrS5aE021y3UYOrZK7]
- 50. Considerations for Flow Cytometry Gating | FACS Analysis [https://www.stemcell.com/considerations-for-facs-gating.html]
- 51. Recommended controls for flow cytometry [https://www.abcam.com/en-us/technical-resources/guides/flow-cytometry-guide/recommended-controls-for-flow-cytometry]
- 52. Critical factors for flow cytometry analysis of the brain - PMC [https://pmc.ncbi.nlm.nih.gov/articles/PMC12220843/]
- 53. Impact of Triton X-100 on Notch 1 Surface Receptor ... [https://pmc.ncbi.nlm.nih.gov/articles/PMC12064322/]
- 54. Triton X-100 concentration effects on membrane ... [https://pmc.ncbi.nlm.nih.gov/articles/PMC2947864/]
- 55. YZ462 exhibits potent antibacterial activity against methicillin ... [https://bmcmicrobiol.biomedcentral.com/articles/10.1186/s12866-025-04475-6]
- 56. Optimising fluorescein diacetate sputum smear microscopy for ... [https://pmc.ncbi.nlm.nih.gov/articles/PMC6490897/]
- 57. Storage Duration Guidelines: Recommended Shelf Life Limits [https://atlasspores.academy/storage-handling/spore-storage/storage-duration-guidelines-recommended-shelf-life-limits/]
- 58. HOW TO PERFORM LINEARITY DURING METHOD ... [https://www.linkedin.com/pulse/how-perform-linearity-during-method-validation-bhaskar-napte]
- 59. Linearity in Laboratory Testing [https://clsi.org/resources/insights/linearity-in-laboratory-testing/]
- 60. On statistical evaluation of the linearity in assay validation [https://pubmed.ncbi.nlm.nih.gov/18607801/]
- 61. Cytotoxicity Assays: In Vitro Methods to Measure Dead Cells [https://www.ncbi.nlm.nih.gov/books/NBK540958/]
- 62. Assay for fluorescein diacetate hydrolytic activity [https://www.sciencedirect.com/science/article/abs/pii/S0038071705002786]
- 63. The VVBlue assay: a plate-readable, dye exclusion-based cell ... [https://pubs.rsc.org/en/content/articlehtml/2025/ra/d4ra08606f]
- 64. How the US FDA MIDD paired pilot program helps sponsors [https://www.certara.com/blog/how-the-us-fda-midd-paired-pilot-program-helps-sponsors/]
- 65. Model-Informed Drug Development Paired Meeting Program [https://www.fda.gov/drugs/development-resources/model-informed-drug-development-paired-meeting-program]
- 66. A new assay for cell death [https://pubmed.ncbi.nlm.nih.gov/2254666/]
- 67. Establishment and characterization of clear cell carcinoma... renal cell [https://cancerci.biomedcentral.com/articles/10.1186/1475-2867-13-20]
- 68. Extracellular vesicle-based drug overview [https://www.nature.com/articles/s41392-025-02312-w]
- 69. Exploring Regulatory Frameworks for Exosome Therapy [https://pmc.ncbi.nlm.nih.gov/articles/PMC12371722/]