High-Throughput Culturing of Stressed Bacteria: Advanced Techniques for Resilient Strain Isolation and Functional Discovery
This article provides a comprehensive overview of modern high-throughput (HT) culturing techniques specifically designed to isolate and study bacteria under various stress conditions.
High-Throughput Culturing of Stressed Bacteria: Advanced Techniques for Resilient Strain Isolation and Functional Discovery
Abstract
This article provides a comprehensive overview of modern high-throughput (HT) culturing techniques specifically designed to isolate and study bacteria under various stress conditions. Aimed at researchers, scientists, and drug development professionals, it covers the foundational principles of how bacterial phenotypes are shaped by microenvironmental stresses. The piece details cutting-edge methodological advances, including AI-guided robotics, microfluidic platforms, and automated biobanking, which dramatically increase the efficiency and diversity of bacterial isolation from complex ecosystems. Furthermore, it offers practical insights for troubleshooting and optimizing HT workflows and presents a comparative analysis of validation methods to ensure robust, reproducible results. The integration of these technologies is poised to accelerate the discovery of novel functional bacteria for biomedical research, drug discovery, and therapeutic development.
Understanding Bacterial Stress Responses and the High-Throughput Imperative
The Pressing Need for Advanced Models in Therapeutic Screening
The exploration of complex host-microbe interactions, particularly under stress conditions, is revolutionizing therapeutic discovery. A significant bottleneck in this field has been the low-throughput, labor-intensive nature of traditional methods for isolating and functionally characterizing bacterial strains. This application note details integrated, high-throughput protocols for constructing comprehensive bacterial biobanks from stressed animal models and subsequently screening them for therapeutic candidates. We demonstrate this pipeline through a specific use case: screening for γ-aminobutyric acid (GABA)-producing bacteria from a mouse model of chronic stress, linking gut microbiome dysbiosis directly to potential neuroactive metabolites [1] [2] [3].
High-Throughput Construction of a Species-Characterized Biobank
Protocol: Isolation and Culture from Stressed Mouse Models
Animal Model and Sample Collection:
- Chronic Unpredictable Mild Stress (CUMS) Model: Subject male adult C57BL/6 mice to a 4-week regimen of mild, unpredictable stressors to induce a depression-like phenotype. The protocol includes nine different stressors, such as food or water deprivation, tail pinch, restraint, and soiled cage environments, applied in a randomized order [1].
- Control Groups: Include both unstressed control mice and a "bedding exchange" group. The latter involves transferring bedding material from control mouse cages to the cages of stressed mice weekly, a method shown to reverse depressive-like behaviors by normalizing the gut microbiome [1].
- Behavioral Validation: Confirm the stress phenotype using behavioral tests like the Sucrose Preference Test (SPT) for anhedonia and the Forced Swim Test (FST) for behavioral despair [1].
- Fecal Sample Collection: Collect fecal samples from all groups post-CUMS, snap-freeze immediately in a sterile tube, and store at -80°C until processing [1].
High-Throughput Culturing and Isolation:
- Sample Plating: Thaw fecal samples and plate onto various enriched media. The use of antibiotic supplements (e.g., ciprofloxacin, trimethoprim, vancomycin) in separate media is recommended to selectively enrich for unique microbial subsets [4].
- Automated Colony Picking: Use an automated system (e.g., the CAMII platform) to image and pick thousands of bacterial colonies. Employ a machine learning-driven "smart picking" strategy that selects colonies based on maximized morphological diversity (e.g., size, circularity, color, density) rather than random selection. This approach significantly increases taxonomic diversity per number of isolates picked [4].
- Culture Storage: Grow picked isolates in 96-well plates containing appropriate broth media. Create a permanent biobank by combining bacterial culture with 50% glycerol and storing at -80°C [2] [5].
Protocol: Cost-Effective Species Identification via Nanopore Sequencing
16S rDNA Amplification and Barcoding:
- PCR Amplification: Perform high-throughput, one-step PCR amplification of the full-length 16S rDNA gene (using primers 27F and 1492R) directly from bacterial isolates in 96-well plates. Use a robustly optimized protocol to ensure uniform amplification across diverse bacterial species [2].
- Double-Ended Barcoding: Employ primers with 40-bp double-ended barcodes, allowing for the multiplexing of thousands of samples in a single sequencing run [2].
Library Preparation and Sequencing:
- Pooling and Clean-up: Pool all barcoded PCR products and purify them using magnetic beads [2].
- Sequencing: Load the pooled library onto a Nanopore PromethION flow cell for sequencing. This platform is chosen for its ability to generate long reads at a low cost, making it feasible for large-scale biobank projects [2].
Bioinformatic Analysis:
- Demultiplexing and Filtering: Use a customized bioinformatics pipeline to demultiplex sequences based on their unique barcodes and filter for quality [2].
- Species Identification: Classify sequences to the species level by comparing them to a reference database. Apply a "minimal purity threshold" (the percentage of reads supporting the top species call) to ensure identification accuracy. With this pipeline, species identification with 99% accuracy compared to Sanger sequencing can be achieved at a fraction of the cost [2].
Table 1: Quantitative Outcomes of High-Throughput Biobank Construction
| Parameter | Outcome | Methodology / Note |
|---|---|---|
| Isolation Throughput | 2,000 colonies/hour | Automated colony picking (CAMII) [4] |
| Isolation Efficiency | 30 unique ASVs from ~85 colonies | Machine-learning guided "smart picking" [4] |
| Species ID Accuracy | >99% | Benchmarking vs. Sanger sequencing [2] |
| Cost per Isolate (Species ID) | <10% of Sanger cost | Nanopore sequencing with double-ended barcodes [2] |
| Example Biobank Size | 15,337 - 26,997 isolates | From human gut and fermented food samples [4] [2] |
High-Throughput Functional Screening for Therapeutic Candidates
Protocol: Biosensor-Based Screening for GABA-Producing Bacteria
This protocol utilizes a modular, dual-plasmid biosensor system that decouples metabolite sensing from signal reporting, enabling rapid, cost-effective screening of thousands of isolates for GABA production [2].
Biosensor Design and Preparation:
- Sensor Plasmid: Contains a transcription factor (e.g., GabR from E. coli) that is naturally activated by GABA. Upon binding GABA, GabR activates the transcription of a reporter gene [2].
- Reporter Plasmid: Contains a strong promoter controlled by GabR, which drives the expression of a green fluorescent protein (GFP).
- Biosensor Strain: Co-transform a suitable host bacterium (e.g., E. coli) with both the sensor and reporter plasmids. Culture this strain and prepare competent cells for high-throughput transformation.
High-Throughput Screening Workflow:
- Culture Biobank Isolates: Inoculate the isolates from the biobank into 96-well deep-well plates containing production media conducive to GABA synthesis. Incubate with shaking for 24-48 hours [2].
- Metabolite Extraction: Centrifuge the plates to pellet bacterial cells. Transfer the metabolite-containing supernatant to a new 96-well plate.
- Biosensor Assay: Add the biosensor strain to the supernatant plate. Incubate to allow GFP expression induced by any GABA present in the supernatant.
- Fluorescence Detection: Measure fluorescence intensity in each well using a plate reader. Isolates producing high levels of GABA will yield supernatants that induce strong fluorescence [2].
- Hit Validation: Select hits (isolates with fluorescence signals significantly above background) for validation using traditional methods like High-Performance Liquid Chromatography (HPLC) [2].
Table 2: Key Research Reagent Solutions for Functional Screening
| Reagent / Material | Function | Application in Protocol |
|---|---|---|
| Dual-Plasmid Biosensor System | Decouples metabolite sensing from fluorescence reporting for modularity and optimization. | High-throughput detection of GABA in bacterial supernatants [2]. |
| GabR Transcription Factor | Native biological sensor that specifically binds GABA and activates transcription. | Core component of the sensor plasmid for GABA recognition [2]. |
| Green Fluorescent Protein (GFP) | Quantitative reporter molecule; fluorescence correlates with target metabolite concentration. | Expressed from the reporter plasmid for signal output [2]. |
| 96-/384-Well Assay Plates | Standardized format for liquid handling automation and high-throughput screening. | Culture of biobank isolates and execution of the biosensor assay [2] [5]. |
| Automated Liquid Handler | Enables precise, rapid transfer of liquids (cultures, reagents) across thousands of samples. | Entire functional screening workflow, from culture to biosensor assay setup [2]. |
Table 3: Quantitative Results from GABA-Producing Bacteria Screen
| Screening Metric | Result | Context |
|---|---|---|
| Isolates Screened | 1,740 | From a biobank of 15,337 isolates [2] |
| GABA-Producing Hits | 46 | Confirmed high-GABA producers [2] |
| Hit Rate | ~2.6% | Demonstration of screening efficiency [2] |
| Screening Throughput | >100,000 samples/day | Capability of biosensor-based detection [2] |
| Traditional Method (HPLC) | 50-100 samples/day | Highlights throughput advantage of biosensor [2] |
Integrated Workflow and Data Analysis
The power of this approach lies in the integration of the biobank construction and functional screening workflows into a single, streamlined pipeline managed by a high-throughput liquid handler platform.
Data Integration and Target Validation: The taxonomic data from the biobank allows for immediate phylogenetic analysis of functional hits. For instance, GABA-producing strains can be traced back to their origin (e.g., stressed vs. control mice, or specific sample types like fermented foods). This enables researchers to test specific hypotheses about the link between stress-induced dysbiosis and the loss or gain of beneficial microbes [1] [3]. Furthermore, the identification of specific species, such as those within the genus Ruminococcus, whose pre-stress abundance correlates with subsequent behavioral outcomes like social avoidance, provides high-value targets for focused screening and mechanistic studies [3].
Broader Implications: The modularity of the biosensor system means it can be adapted to screen for other therapeutically relevant metabolites by simply swapping the transcription factor in the sensor plasmid. This integrated platform, from stressed model to validated hit, dramatically accelerates the discovery of novel therapeutic bacteria and functional metabolites for a range of conditions.
The microenvironment is a complex, dynamic ecosystem that profoundly influences cellular behavior. In the context of stressed bacteria research, deconstructing this environment into its core components—biochemical, biophysical, and soluble cues—is essential for understanding microbial survival, adaptation, and resistance mechanisms. These cues do not act in isolation; instead, they form an integrated network that dictates phenotypic outcomes. High-throughput culturing techniques have emerged as powerful tools for systematically interrogating these interactions, allowing researchers to model complex environmental stresses and generate quantitative, predictive data. This Application Note provides a structured framework for employing these techniques to dissect the stressed bacterial microenvironment, complete with detailed protocols and analytical workflows tailored for researchers, scientists, and drug development professionals.
Core Components of the Stressed Microenvironment
The following table summarizes the three primary categories of cues that constitute a stressed microenvironment for bacteria, along with their cellular sensing mechanisms and key outcomes.
Table 1: Core Components of the Stressed Bacterial Microenvironment
| Cue Category | Description & Examples | Primary Cellular Sensors | Key Phenotypic Outcomes |
|---|---|---|---|
| Biochemical Cues | Chemical stressors: Antibiotics (e.g., oxytetracycline, amoxicillin), herbicides, pesticides, heavy metals (e.g., Cu²⁺, Cr⁶⁺) [6] [7] | Membrane receptors, stress response proteins, enzyme active sites | Growth inhibition, resistance gene upregulation, metabolic reprogramming, cell death [6] |
| Biophysical Cues | Physical properties: Substrate stiffness, topography, spatial confinement, fluid shear stress [8] [9] | Integrins, mechanosensitive ion channels, cytoskeleton | Altered adhesion, changes in morphology, collective vs. single-cell migration, biofilm formation [8] |
| Soluble Cues | Diffusible signals: Nutrients, metabolic byproducts, signaling molecules (e.g., autoinducers in quorum sensing), oxygen gradients [8] [10] | Transporters, transcription factors, membrane receptors | Modulated growth rates, expression of virulence factors, induction of persistence, heteroresistance [8] |
High-Throughput Screening Protocol for Multi-Stressor Interactions
This protocol is designed for the high-throughput characterization of bacterial responses to complex mixtures of chemical pollutants, adapting methodologies from recent research [6].
Research Reagent Solutions & Essential Materials
Table 2: Essential Materials for High-Throughput Stress Screening
| Item | Function/Description | Example |
|---|---|---|
| Chemical Stressors | Create complex microenvironments; include antibiotics, herbicides, fungicides, pesticides [6] | Oxytetracycline, Amoxicillin, Chlorothalonil, Glyphosate |
| Liquid Growth Media | Supports bacterial proliferation in microplates | Brain Heart Infusion (BHI) Broth, Lysogeny Broth (LB) |
| 96 or 384-Well Microplates | Platform for high-throughput culturing and assay setup | Clear, flat-bottom plates for optical density reading |
| Automated Liquid Handler | Enables precise, rapid dispensing of stressor combinations into microplates | - |
| Plate Reader (with shaking & temperature control) | Monitors bacterial growth kinetics in real-time via Optical Density (OD₆₀₀) | - |
| Bacterial Strains | Model and non-model environmental strains to assess generalizability [6] | E. coli, A. fischeri, P. baetica, A. humicola |
Experimental Workflow
Step 1: Stressor Stock Solution Preparation Prepare stock solutions of each chemical stressor in appropriate solvents (e.g., water, DMSO). Sterilize by filtration (0.2 µm). Create a master layout of all desired single stressors and combinations.
Step 2: Microplate Setup via Automation Using an automated liquid handler, aliquot growth media into all wells of a 96-well microplate. Subsequently, pipette the predetermined stressor combinations into the wells according to the master layout. A full factorial design for 8 stressors will generate 255 unique mixtures plus a stressor-free control [6].
Step 3: Inoculation and Incubation Dilute an overnight culture of the target bacterial strain to a standardized OD₆₀₀. Inoculate each well with an equal volume of the bacterial suspension. Seal the plate with a breathable membrane and incubate in the plate reader at the optimal growth temperature (e.g., 30°C) with continuous shaking.
Step 4: Growth Kinetics Measurement Measure the OD₆₀₀ of each well at regular intervals (e.g., every 15-30 minutes) for a defined period (e.g., 24-48 hours). The plate reader software will generate growth curves for each well.
Step 5: Data Analysis
- Calculate Growth Metrics: For each growth curve, calculate the Area Under the Curve (AUC) or maximum growth yield.
- Determine Relative Growth: Normalize the AUC from each stressed condition to the mean AUC of the stressor-free control to determine relative growth (G) [6].
- Identify Interactions: Use a multiplicative null model to classify interactions between stressors. The expected growth under a multiplicative model is the product of the relative growth values for each individual stressor in the mixture. Compare the observed growth to this expected value to identify significant synergistic (observed < expected) or antagonistic (observed > expected) interactions [6].
Protocol for Single-Cell Phenotypic Profiling via Raman Spectroscopy
This protocol details the use of "ramanome" analysis for label-free, rapid phenotyping of bacterial stress responses at the single-cell level [7].
Research Reagent Solutions & Essential Materials
- Raman Microspectrometer: Equipped with a laser (e.g., 532 nm or 785 nm), microscope, and sensitive CCD detector.
- Microscopic Slides or Anopore Strips: For mounting bacterial cells [11] [7].
- SYTO-9 Green Fluorescent Nucleic Acid Stain: For viability assessment and cell localization (optional) [11].
- Chemically Defined Stress Media: To expose cells to specific stressors.
Experimental Workflow
Step 1: Stress Exposure Grow bacterial cells to mid-log phase. Divide the culture and expose the experimental group to the desired stressor (e.g., 5% v/v ethanol [7]) for a defined duration (from minutes to hours). Maintain a control group without stress.
Step 2: Sample Preparation for Raman
- Harvest cells by gentle centrifugation and wash with a saline buffer (e.g., phosphate-buffered saline) to remove residual media.
- Concentrate the cell pellet and deposit a small volume (~2 µL) onto an aluminum-coated microscope slide or Anopore strip [11]. Allow to air-dry briefly.
Step 3: Raman Spectra Acquisition
- Using the Raman microspectrometer, focus the laser beam on a single cell.
- Collect Single-cell Raman Spectra (SCRS) with appropriate laser power and integration time to obtain a high signal-to-noise ratio without damaging the cell.
- Randomly sample a sufficient number of cells (e.g., n ≥ 20 per condition) to build a representative "ramanome" for both the control and stressed populations [7].
Step 4: Data Processing and Analysis
- Pre-process the raw SCRS (background subtraction, cosmic ray removal, vector normalization).
- Subject the processed ramanomes to multivariate statistical analysis, such as Principal Component Analysis (PCA) or Linear Discriminant Analysis (LDA), to identify spectral features that distinguish stressed from control cells.
- Identify specific "marker" Raman bands that show significant intensity changes, which correspond to alterations in cellular biochemistry (e.g., nucleic acids, proteins, lipids) [7].
Diagram 1: Integrated cellular response to microenvironmental stress cues, showing how different cue categories are sensed and transduced into phenotypic outcomes, which in turn alter the microenvironment in a feedback loop.
Data Analysis and Integration
Quantitative Analysis of Population Heterogeneity
Direct imaging and microcolony analysis on substrates like Anopore strips can quantify population heterogeneity [11]. After stress exposure and incubation, microcolony areas are measured. Under severe stress, the distribution of microcolony sizes often becomes bimodal, revealing distinct subpopulations of growing and non-growing cells. This heterogeneity can be quantified by fitting statistical distributions to the log-transformed microcolony area data [11].
Modeling Higher-Order Interactions
When analyzing complex mixture screens, it is critical to test for higher-order interactions (HOIs). A full factorial design allows for the quantification of "net" interactions (the overall deviation from the multiplicative null model for a mixture) and "emergent" interactions (the specific effect attributable to the combination of three or more stressors that cannot be explained by lower-order interactions) [6]. Bootstrapping methods can be used to determine the significance of these interactions.
Diagram 2: A high-level workflow for deconstructing the stressed microenvironment, integrating high-throughput screening with single-cell phenotyping to generate a predictive model.
The methodologies outlined in this Application Note provide a robust framework for deconstructing the multifaceted stressed microenvironment of bacteria. The synergistic use of high-throughput screening, which captures population-level responses to complex cue combinations [6], with single-cell phenotyping techniques like ramanome, which reveals underlying biochemical heterogeneity and rapid adaptive responses [7], is paramount. This integrated approach enables researchers to move beyond simplistic, single-stressor models and build predictive frameworks for how bacteria survive and adapt in complex, stressful environments. This knowledge is directly applicable to advancing research in antimicrobial drug development, combating antibiotic resistance, and managing microbial contamination.
In stressed bacteria research, cellular phenotypes and functional responses are modulated by a complex combination of signals present in the microenvironment [12]. These include extracellular matrix components, soluble signals, nutrients, cell-cell interactions, and critical physical parameters such as tissue mechanical properties [12]. High-throughput screening (HTS) represents a transformative methodology that enables researchers to systematically probe these multifactorial conditions, deconstruct the influence of individual components, and understand their combined effects on bacterial stress responses [12]. This approach is particularly valuable for investigating bacterial adaptation mechanisms, such as the morphological changes bacteria employ to increase fitness during antibiotic stress [13] or the dynamic metabolic exchanges that emerge under acid stress conditions [14]. The core principle of systematically varying multiple parameters in parallel allows for the extraction of robust datasets from individual experiments, screening large condition libraries for potential hits, and better qualifying predictive responses for preclinical applications while reducing reliance on animal studies [12].
Key High-Throughput Platforms and Their Applications
High-throughput methodologies in microbiology have evolved significantly, ranging from established microplate-based systems to cutting-edge automated platforms that integrate robotics and machine learning. These systems share common requirements for uniformity, assay miniaturization, specific target identification, and process simplification [12]. The table below summarizes the primary platforms and their specific applications in stressed bacteria research.
Table 1: High-Throughput Platforms for Bacterial Culturing and Applications
| Platform/Technique | Key Features | Applications in Stressed Bacteria Research | Throughput Capacity |
|---|---|---|---|
| Multiwell Microplates [12] | 96-, 384-, or 1536-well formats; reagent volume reduction; supported by automated liquid handling and imaging. | Cytotoxicity screening [12]; quantification of antifungal potency via cocultivation [15]. | Variable, up to thousands of conditions per experiment. |
| Automated Robotic Culturomics [4] | Integrated imaging, picking, and processing; machine learning for colony selection; housed in controlled atmospheric chambers. | Generation of personalized isolate biobanks; analysis of cogrowth patterns under stress [4]. | ~2,000 colonies picked/hour; 12,000 colonies per run [4]. |
| Microfluidic Systems [12] | Culture in nanoliter reactors; precise control over microenvironments and gradients. | Studying bacterial migration [12] and growth in nanoliter reactors [4]. | High, though clonal extraction can be challenging [4]. |
| Quantitative Cocultivation Screening [15] | Direct coinoculation of bacterial dilutions with fungal spores in microplates; determines Minimal Inhibitory Cell Concentration (MICC). | Quantifying bacterial antagonistic capacity under biotic stress [15]. | Screening of >1,000 bacterial strains per week [15]. |
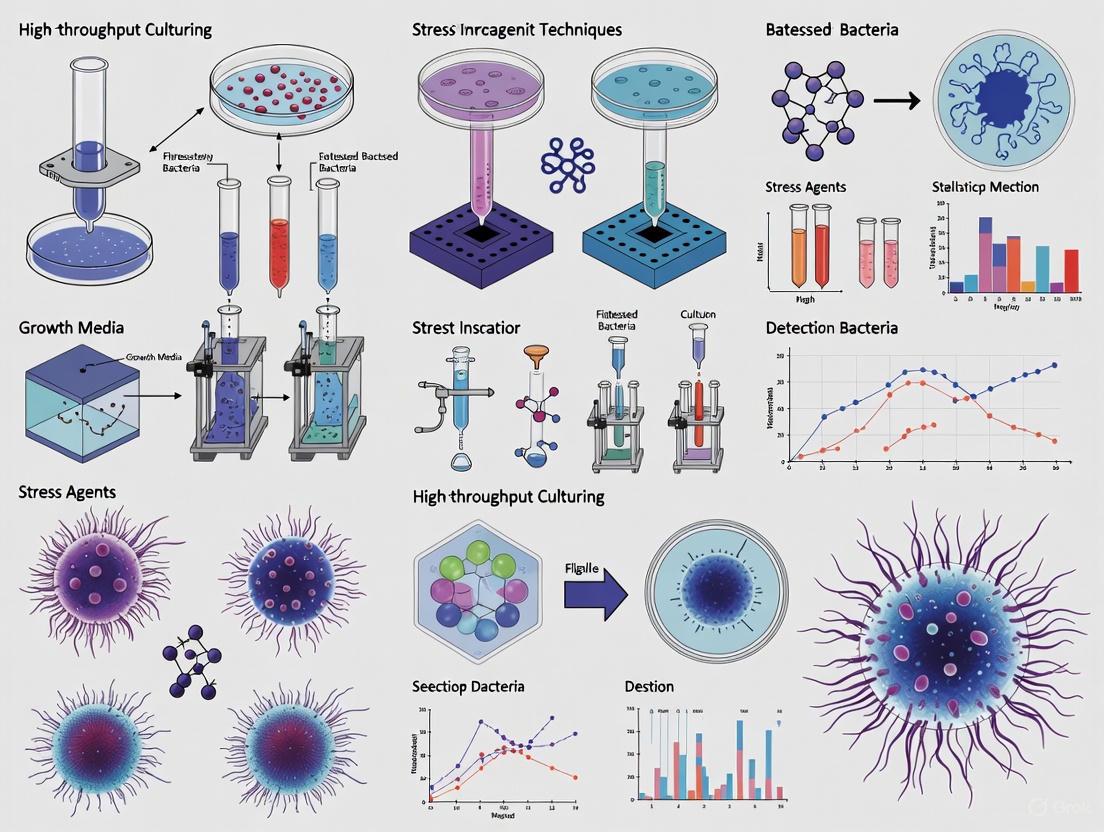
Visualizing the High-Throughput Workflow for Stressed Bacteria
The following diagram illustrates the integrated, cyclical workflow for constructing a biobank and conducting functional screens, demonstrating the core principle of systematic interrogation.
Experimental Protocols for Stress Research
Protocol: Quantitative Antagonistic Cocultivation to Measure Bacterial Fitness Under Biotic Stress
This protocol quantifies the inhibitory capacity of bacterial biocontrol candidates against fungal phytopathogens, measuring a direct bacterial-fungal interaction under stress [15].
Key Reagents & Materials:
- Fungal phytopathogen spores (e.g., Fusarium culmorum)
- Bacterial overnight cultures (test strains)
- 48-well microtiter plates
- Appropriate agar medium for fungal cultivation
- Sterile phosphate-buffered saline (PBS) for dilutions
Methodology:
- Prepare Bacterial Dilutions: Normalize bacterial overnight cultures to the same OD₆₀₀. Prepare a 5-fold serial dilution series in a 96-well plate, down to a theoretical concentration of approximately 300-500 bacterial cells [15].
- Prepare Fungal Spore Suspension: Harvest fungal spores and suspend in sterile diluent. Mix thoroughly to ensure a homogeneous distribution. Adjust concentration to a standardized level (e.g., 10⁴ spores/mL).
- Coinoculation: In a 48-well plate, combine each bacterial dilution with a fixed quantity of the fungal spore suspension. Include controls: fungus only (negative control) and bacterium only (background control).
- Incubation and Monitoring: Incubate plates for 3-5 days at room temperature. Visually monitor fungal growth daily.
- Scoring and Analysis: Score fungal growth in each well as: (3) positive growth, (2) weak growth, or (1) no growth. Determine the Minimal Inhibitory Cell Concentration (MICC)—the lowest bacterial cell concentration that abolishes fungal growth. Calculate a numerical inhibition score for each strain to enable quantitative comparison [15].
Protocol: Investigating Inter-Species Stress Resistance via Metabolic Cross-Feeding
This protocol characterizes the dynamic, stress-induced metabolic exchanges between bacterial species with complementary metabolisms, such as an acid producer and an acid consumer [14].
Key Reagents & Materials:
- Complementary bacterial strains (e.g., glycolytic and gluconeogenic)
- Defined minimal medium with a single carbon/nitrogen source (e.g., GlcNAc)
- Strong (e.g., 40 mM HEPES, pH 8) and weak (e.g., 2 mM bicarbonate) buffers
- HPLC system for metabolite analysis (e.g., acetate, ammonium)
Methodology:
- Culture Setup: Inoculate monocultures and co-cultures in both strongly-buffered and weakly-buffered media.
- Growth-Dilution Cycles: Grow cultures for a set period (e.g., 24 h), then dilute 40-fold into fresh medium. Repeat for several cycles to observe stable dynamics [14].
- Monitoring: Track culture density (OD), medium pH, and substrate/metabolite concentrations (via HPLC) throughout the growth cycles.
- Analysis: In strong buffer, observe simple commensalism. In weak buffer, observe the progression through distinct phases: exponential growth, acidification-triggered growth arrest, collaborative deacidification, and growth recovery. This reveals the syntrophic relationship essential for stress relief [14].
The Scientist's Toolkit: Essential Research Reagents and Materials
Table 2: Key Reagent Solutions for High-Throughput Stressed Bacteria Research
| Reagent/Material | Function/Description | Application Example |
|---|---|---|
| Double-Barcoded Primers [2] | Enable multiplexed, pooled sequencing of thousands of 16S rDNA amplicons by providing a unique identifier for each sample. | Cost-effective species identification in large bacterial biobanks [2]. |
| Modular Biosensor System [2] | A dual-plasmid system that decouples metabolite sensing from signal reporting (e.g., fluorescence) for high-throughput functional screening. | Screening bacterial biobanks for high production of specific metabolites (e.g., GABA) under stress [2]. |
| Specialized Growth Media [4] | Media supplemented with specific stressors (e.g., antibiotics, weak organic acids) or nutrients to enrich for unique microbial subsets. | Selective cultivation to increase taxonomic diversity and study stress resistance mechanisms [4]. |
| Automated Liquid Handler [2] | Robotics platform for precise, high-throughput pipetting in 96-well or 384-well formats, enabling process miniaturization and standardization. | PCR amplification, culture setup, and biosensor-based screening, increasing throughput to ~2,500 samples per day [2]. |
| Antibiotic Supplements [4] | Compounds with different mechanisms of action (e.g., ciprofloxacin, trimethoprim, vancomycin) applied to exert selective pressure. | Creating distinct enrichment cultures to isolate rare species and study antibiotic resistance and shape-shifting [4] [13]. |
Visualizing Bacterial Stress Response and Inter-Species Collaboration
The metabolic and morphological adaptations of bacteria under stress are central to understanding resistance mechanisms. The diagram below delineates the pathway of inter-species stress resistance and the strategy of shape-shifting.
High-Throughput Screening (HTS) represents a foundational technology platform in modern microbiology and drug discovery, enabling the rapid and automated testing of hundreds of thousands of compounds against biological targets. This approach allows researchers to quickly identify potential "hits" – compounds showing desired biological activity – from extensive chemical libraries. In microbiology, HTS has become indispensable for antibacterial drug discovery, understanding microbial responses to environmental stressors, and characterizing compound effects on gut microbiota, ultimately contributing to reduced reliance on traditional animal models [16] [17].
The core principle of HTS involves miniaturized, automated assay systems that can process large compound collections efficiently. As a global leader in HTS services, Evotec has invested over €12 million in their HTS facilities in the past five years, maintaining a screening collection of >850,000 carefully curated compounds selected for drug-likeness and chemical tractability. This massive scale enables researchers to explore vast chemical spaces that would be impractical with conventional methods [16].
Applications in Stressed Bacteria Research
High-throughput screening approaches have proven particularly valuable for studying bacterial responses to environmental stressors, including chemical pollutants, antibiotics, and other xenobiotics. Recent research has leveraged HTS to understand how microbes respond to complex mixtures of chemical pollutants, moving beyond traditional single-stressor studies to better replicate real-world conditions [6].
Key Studies of Bacterial Stress Responses
Table 1: Representative HTS Studies in Bacterial Stress Research
| Study Focus | Experimental Scale | Key Findings | Reference |
|---|---|---|---|
| Bacterial responses to chemical pollutant mixtures | 255 combinations of 8 chemical stressors across 12 bacterial strains | Increasingly complex chemical mixtures were more likely to negatively impact bacterial growth in monoculture and reveal net interactive effects | [6] |
| Antibiotic collateral damage on gut bacteria | High-throughput anaerobic screening of thousands of compounds | Protocol enables testing of ~5,000 compounds on target gut species under strict anaerobic conditions within 5 days | [18] |
| Impact of non-antibiotic drugs on human gut bacteria | Screening of >1,000 drugs against 40 gut bacterial strains | Revealed extensive impact of human-targeted drugs on gut bacterial growth | [18] |
Experimental Design Considerations
When designing HTS campaigns for stressed bacteria research, several critical factors must be addressed:
- Anaerobic Requirements: Many gut bacteria require strict anaerobic conditions, necessitating specialized equipment and protocols [18].
- Chemical Complexity: Real-world stressor mixtures involve multiple simultaneous chemicals, requiring experimental designs that can test higher-order interactions [6].
- Strain Selection: Including both model organisms and environmentally relevant strains provides broader biological relevance beyond laboratory adaptations [6].
- Community vs. Monoculture: Bacterial responses in mixed cultures often differ significantly from monocultures, with mixed cultures proving more resilient to complex chemical mixtures [6].
Detailed HTS Protocols for Microbiological Applications
High-Throughput Anaerobic Screening Protocol
This protocol enables testing compound effects on anaerobic gut bacteria in monocultures or communities, addressing the technical challenge of maintaining anaerobic conditions throughout screening [18].
Timeframe: 5 days for testing up to 5,000 compounds on a target gut species
Key Requirements:
- Anaerobic chamber with H2-controlled atmosphere (typically <10 ppm O2)
- Automated liquid handling systems compatible with anaerobic work
- Pre-reduced anaerobically sterilized (PRAS) media and reagents
- 96- or 384-well plates suitable for anaerobic growth
Procedure:
Day 1: Bacterial Culture Preparation
- Inoculate target bacterial strain(s) in pre-reduced media under anaerobic conditions
- Incubate at 37°C for 16-24 hours to reach mid-logarithmic growth phase
Day 2: Compound Library Preparation
- Prepare compound plates using automated liquid handling in anaerobic chamber
- Use DMSO concentrations ≤0.5% to avoid solvent toxicity
- Include appropriate controls (media only, vehicle, growth controls)
Day 2: Assay Plate Setup
- Dilute bacterial cultures to standardized OD600 in fresh pre-reduced media
- Dispense bacterial suspension to compound plates using automated systems
- Seal plates with breathable membranes to maintain anaerobiosis
Days 2-5: Growth Monitoring and Data Collection
- Measure optical density (OD600) at regular intervals (every 2-4 hours)
- Maintain anaerobic conditions throughout incubation
- Calculate growth parameters (area under curve, maximum growth rate, final density)
Data Analysis
- Normalize growth to positive and negative controls
- Calculate inhibition percentages for each compound
- Apply quality control metrics (Z'-factor >0.5)
UV-Vis Spectrophotometry for Bacterial Culture Analysis
This high-throughput protocol enables measurement of solution pH in bacterial cultures using UV-Vis absorption spectrophotometry with pH indicator dyes, providing insights into bacterial metabolic activity and environmental modifications [19].
Key Applications:
- Monitoring bacterial acidification/alkalinization of media
- Assessing metabolic responses to compound treatments
- Characterizing bacterial stress responses through pH changes
Workflow:
- Culture bacteria under appropriate conditions
- Collect cell-free supernatant by centrifugation
- Add pH indicator dye (e.g., litmus)
- Measure UV-Vis absorbance spectrum
- Calculate pH using standard calibration curve
HTS Workflow and Impact on Animal Model Reduction
The implementation of robust HTS systems directly supports the replacement, reduction, and refinement (3Rs) of animal use in research by providing more human-relevant data earlier in the discovery pipeline, eliminating compounds with poor efficacy or toxicity before animal testing [20] [21].
Diagram 1: HTS workflow from screening to reduced animal testing. The process begins with extensive compound libraries and progresses through increasingly refined screening stages, resulting in better candidate selection and reduced animal testing.
Strategic Framework for Animal Model Replacement
Governments and regulatory agencies worldwide are implementing strategies to accelerate the replacement of animals in science. The UK government's 2025 strategy outlines a comprehensive approach with six key objectives [21]:
- Accelerate replacement of animals in science to phase out their use
- Achieve equal or better research outcomes using alternative methods
- Drive private investment in alternative methods to boost innovation
- Improve regulatory confidence and acceptance of alternative methods
- Create infrastructure and partnerships to unlock value from UK data
- Position the UK as a global leader in alternative methods
This strategic alignment between technological capabilities, regulatory frameworks, and scientific advances creates a tipping point for transitioning toward animal-free research methodologies [21].
Research Reagent Solutions for HTS in Microbiology
Table 2: Essential Research Reagents for HTS in Microbiology
| Reagent Category | Specific Examples | Function in HTS | Considerations |
|---|---|---|---|
| Compound Libraries | Diverse chemical collections (>850,000 compounds), Fragment libraries (25,000 compounds), Natural products (30,000 compounds) | Source of chemical diversity for screening campaigns | Quality, diversity, drug-likeness, chemical tractability [16] |
| Detection Reagents | Fluorescent probes, Luminescent substrates, pH indicators (litmus) | Enable detection of biological activity or compound effects | Compatibility with automation, miniaturization, interference potential [16] [19] |
| Cell Culture Components | Pre-reduced anaerobically sterilized (PRAS) media, Bacterial growth supplements | Support microbial growth under screening conditions | Oxygen sensitivity, nutrient composition, compatibility with detection methods [18] |
| Assay Platforms | Biochemical assay reagents, Cell-based assay systems, Reporter gene constructs | Create biological context for screening | Relevance to biological target, robustness, reproducibility [16] [17] |
Integration with Alternative Methods and Future Directions
The combination of HTS with emerging technologies creates powerful synergies for advancing microbiology research while further reducing animal reliance:
Advanced Analytics and In Silico Technologies
Modern HTS campaigns generate enormous datasets requiring sophisticated analysis approaches [16]:
- Advanced Data Analytics: Identify patterns, outliers, and historical trends in screening data
- Structure-Based Virtual Screening: Computer-aided drug design to identify focused compound subsets
- AI/ML-Enabled Hit Expansion: Train models on screening data to identify additional hits
- Hit Prioritization: Rank compounds based on predicted activity, off-target effects, and drug-likeness
Mechanism-Informed Phenotypic Screening
Newer HTS strategies move beyond simple growth inhibition to provide mechanistic insights [17]:
- Reporter Gene Assays: Monitor specific signaling pathway interactions
- Imaging-Based HTS: Identify antibacterial agents based on film formation ability
- Virulence Factor Targeting: Screen for quorum-sensing inhibitors
- Membrane Interaction Reporters: Fluorescence anisotropy to detect lipid-targeting compounds
Diagram 2: Comparison of traditional versus HTS-enabled drug discovery pipelines. The HTS-based approach front-loads testing with human-relevant in vitro systems, significantly reducing and delaying animal model use.
The integration of high-throughput screening methodologies into microbiology research represents a paradigm shift in how we approach bacterial stress response studies and antibacterial drug discovery. By providing more human-relevant data earlier in the research pipeline, HTS enables better candidate selection, reduces late-stage failures, and minimizes reliance on animal models. As technological advances in automation, detection methodologies, and data analytics continue to evolve, HTS platforms will play an increasingly central role in understanding microbial systems and developing novel therapeutic interventions while advancing the goals of humane science.
Within the framework of advanced high-throughput culturing techniques for stressed bacteria research, this application note presents a detailed protocol for investigating how cadmium (Cd) stress reshapes endophytic bacterial communities in plants. Focusing on the model system of soybean seedlings inoculated with a Cd-tolerant plant growth-promoting rhizobacterium (PGPR), Pseudomonas sp. KM25 [22], we provide a quantitative analysis of the resulting physiological, biochemical, and microbial population changes. The methods and data presented here serve as a replicable template for high-throughput screening of bacterial isolates and their role in mitigating abiotic stress in plants.
Quantitative Data Analysis
The following tables summarize key quantitative data from the case study, demonstrating the efficacy of KM25 inoculation in alleviating Cd stress in soybean seedlings.
Table 1: Plant Growth and Physiological Parameters under Cd Stress with KM25 Inoculation
| Parameter | Control (No Cd, No KM25) | Cd Stress Only | Cd Stress + KM25 Inoculation | Reference/Unit |
|---|---|---|---|---|
| Shoot Height | Baseline | Significantly inhibited | Significantly increased vs. Cd-only | [22] |
| Shoot Dry Weight | Baseline | Significantly inhibited | Significantly increased vs. Cd-only | [22] |
| Root Dry Weight | Baseline | Significantly inhibited | Significantly increased vs. Cd-only | [22] |
| Chlorophyll a Content | ~100% | N/A | Increased by 71.98% | [23] |
| Quantum Yield of PSII (ΦPSII) | ~100% | N/A | Increased by 27.96% | [23] |
| Max Photochemical Efficiency (Fv/Fm) | ~100% | N/A | Increased by 14.17% | [23] |
Table 2: Antioxidant Enzyme Activities and Oxidative Stress Markers
| Parameter | Control (No Cd, No KM25) | Cd Stress Only | Cd Stress + KM25 Inoculation | Reference/Unit |
|---|---|---|---|---|
| Superoxide Dismutase (SOD) | Baseline level | Likely elevated | Significantly increased | [22] |
| Peroxidase (POD) | Baseline level | Likely elevated | Significantly increased | [22] |
| Catalase (CAT) | Baseline level | Likely elevated | Significantly increased | [22] |
| Malondialdehyde (MDA) | Baseline level | Significantly increased | Significantly reduced | [22] |
Table 3: Shifts in Root Endophytic Bacterial Community Relative Abundance
| Bacterial Taxon | Cd Stress Only | Cd Stress + KM25 Inoculation | Change | Reference |
|---|---|---|---|---|
| Proteobacteria | Baseline | Increased | ↑ | [22] |
| Bacteroidetes | Baseline | Increased | ↑ | [22] |
| Sphingomonas | Baseline | Increased | ↑ | [22] |
| Rhizobium | Baseline | Increased | ↑ | [22] |
| Pseudomonas | Baseline | Increased | ↑ | [22] |
Experimental Protocols
Protocol 1: Isolation and Screening of Cd-Tolerant PGPR from Plant Nodules
- Sample Collection: Surface-sterilize root nodules from a host plant (e.g., semi-wild soybean) using sequential washes with 70% ethanol and sodium hypochlorite solution, followed by rinsing with sterile distilled water [22].
- Bacterial Isolation: Homogenize the nodules in sterile saline. Spread the homogenate onto solid growth media (e.g., Tryptic Soy Agar) and incubate at 28°C until colonies appear [22].
- Heavy Metal Tolerance Screening: Purify colonies and streak them onto media supplemented with a gradient of CdCl₂ concentrations (e.g., 0, 50, 150, 250, 300 μg/mL). Incubate and measure growth (e.g., optical density) to identify strains with high Cd tolerance [22].
- PGP Trait Characterization:
- IAA Production: Grow the isolate in broth supplemented with tryptophan. After incubation, mix the supernatant with Salkowski's reagent; a pink color indicates IAA production [22].
- Siderophore Production: Spot the isolate on Chrome Azurol S (CAS) agar. Formation of an orange halo after incubation indicates siderophore production [22].
- ACC Deaminase Activity: Grow the isolate in minimal media with ACC as the sole nitrogen source. Growth indicates ACC deaminase activity [22].
- Strain Identification: Amplify the 16S rRNA gene from the selected isolate using universal primers and perform Sanger sequencing. Identify the strain by comparing the sequence to a database like GenBank [22].
Protocol 2: Plant Inoculation and Cadmium Stress Assay
- Bacterial Inoculum Preparation: Grow the selected PGPR strain (e.g., KM25) in liquid broth to the late logarithmic phase. Centrifuge, wash, and resuspend the cells in sterile saline to a standardized density (e.g., ~10⁸ CFU/mL) [22].
- Plant Growth and Inoculation: Surface-sterilize and germinate plant seeds (e.g., soybean). For inoculation, immerse the roots of seedlings in the bacterial suspension for a defined period before transplanting [22].
- Cadmium Stress Application: After a recovery period, subject the potted seedlings to Cd stress by watering with a solution of CdCl₂ at the desired concentration (e.g., 1×10⁻⁵ mol/L) [22] [23].
- Harvest and Analysis: Harvest plants after a predetermined growth period.
- Biometric Data: Measure shoot height, root length, and fresh/dry weight of shoots and roots [22].
- Chlorophyll Fluorescence: Use a PAM fluorimeter on dark-adapted leaves to measure parameters like Fv/Fm and ΦPSII [23].
- Antioxidant Enzymes: Assay SOD, POD, and CAT activities from plant leaf extracts using standard spectrophotometric methods [22].
- Metal Content: Determine Cd content in roots and shoots using Inductively Coupled Plasma Mass Spectrometry (ICP-MS) after acid digestion [22].
Protocol 3: High-Throughput Analysis of Endophytic Communities
- DNA Extraction: Surface-sterilize root samples thoroughly. Extract total genomic DNA from the ground root tissue using a commercial kit designed for soil or plant samples [22].
- 16S rRNA Gene Amplification and Sequencing: Amplify the hypervariable regions of the bacterial 16S rRNA gene (e.g., V3-V4) using barcoded primers. Purify the amplicons and perform high-throughput sequencing on a platform such as Illumina MiSeq [22].
- Bioinformatic Analysis:
- Process raw sequences using QIIME 2 or Mothur to filter, denoise, and cluster sequences into Amplicon Sequence Variants (ASVs) [22].
- Classify taxa against a reference database (e.g., SILVA or Greengenes).
- Perform statistical analyses to compare alpha-diversity (within-sample diversity) and beta-diversity (between-sample compositional differences) across treatment groups [22].
- Use tools like Weighted Gene Co-expression Network Analysis (WGCNA) to identify microbial modules correlated with specific plant physiological parameters [23].
Pathway and Workflow Visualizations
Diagram 1: Bacterial mitigation of cadmium stress in plants.
Diagram 2: High-throughput workflow for stress bacteria research.
The Scientist's Toolkit: Research Reagent Solutions
Table 4: Essential Reagents and Kits for Endophytic Community Research under Cd Stress
| Research Reagent / Material | Function in the Experiment |
|---|---|
| Cadmium Chloride (CdCl₂) | Used to prepare stock solutions for applying controlled, precise cadmium stress to plants in a laboratory setting [22]. |
| Tryptic Soy Agar/Broth | A general, nutrient-rich growth medium used for the initial isolation and cultivation of diverse bacterial endophytes from plant tissues [22]. |
| Chrome Azurol S (CAS) Agar | A specialized chromogenic medium used to screen and qualitatively confirm bacterial siderophore production, a key plant growth-promoting trait [22]. |
| Salkowski's Reagent | A chemical reagent used in a colorimetric assay to detect the production of indole-3-acetic acid (IAA) by bacterial isolates [22]. |
| 1-Aminocyclopropane-1-carboxylate (ACC) | A substrate used in growth assays to screen for and quantify the activity of the ACC deaminase enzyme in bacteria, which helps reduce plant stress ethylene levels [22]. |
| DNA Extraction Kit (for Soil/Stool) | Commercial kits optimized to efficiently lyse robust microbial cell walls and isolate high-purity, inhibitor-free genomic DNA from complex matrices like plant root tissues [22]. |
| 16S rRNA Gene Primers (e.g., 515F/806R) | Short, specific DNA sequences designed to amplify hypervariable regions of the bacterial 16S rRNA gene, enabling taxonomic profiling via high-throughput sequencing [22]. |
| Plant Growth Promoters (e.g., Pseudomonas sp. KM25) | Characterized, Cd-tolerant bacterial strains used as inoculants to study their direct and indirect (via community reshaping) protective effects on plants under heavy metal stress [22]. |
Cutting-Edge Platforms for Isolation and Cultivation under Stress
Culturomics, the large-scale cultivation and characterization of microorganisms, faces a fundamental challenge: traditional methods for isolating bacterial strains from complex microbial ecosystems are labor-intensive, difficult to scale, and lack integration between phenotypic and genotypic data [24]. This bottleneck severely limits the pace of microbiological research, particularly for investigating bacterial responses to environmental stressors [6]. The Culturomics by Automated Microbiome Imaging and Isolation (CAMII) platform addresses these limitations by deploying an artificial intelligence (AI) framework that leverages colony morphology to guide the isolation process [24]. This application note details the protocols for implementing this phenotype-guided picking strategy, providing researchers with a methodology to systematically build diverse, representative microbial biobanks from stressed communities.
The CAMII platform integrates an automated imaging system, a colony-picking robot, and a machine learning algorithm within an environmentally controlled chamber [24]. Its core function is to convert visual characteristics of bacterial colonies into quantitative data that predicts phylogenetic diversity, enabling intelligent selection of which colonies to isolate.
Table 1: Key Technical Specifications of the CAMII Platform [24]
| Component | Specification | Performance Metric |
|---|---|---|
| Overall System | Housed in an anaerobic chamber | Controls temperature, humidity, and O₂ levels |
| Isolation Throughput | Automated colony-picking robot | ~2,000 colonies per hour |
| Run Capacity | Handles multiple source plates | Up to 12,000 colonies per run |
| Imaging System | Transillumination and epi-illumination | Captures morphology, height, color, and texture |
| Sequencing Cost | High-throughput, low-cost pipeline | ~$6.37 per isolate for >60x WGS coverage |
The Scientist's Toolkit: Research Reagent Solutions
The following table lists essential materials and reagents for establishing a phenotype-guided culturomics workflow, based on the methodologies employed by the CAMII platform and related stress response research.
Table 2: Essential Research Reagents and Materials for Phenotype-Guided Culturomics
| Item | Function/Application | Example/Note |
|---|---|---|
| Modified GAM Agar (mGAM) | General growth medium for gut microbiota [24] | Serves as a standard medium for plating. |
| Antibiotic Supplements | Selective enrichment for rare or stress-resistant taxa [24] | Ciprofloxacin, Trimethoprim, Vancomycin. |
| Chemical Stressors | Studying microbial responses to complex pollutant mixtures [6] | Herbicides, fungicides, pesticides (e.g., Chlorothalonil, Tebuconazole). |
| DNA Extraction Kits | High-throughput genomic DNA preparation for WGS and 16S rRNA sequencing [24] | Automated for 384-well plates. |
| 16S rRNA Sequencing Primers | Taxonomic identification of isolates (e.g., V4 region) [24] | Clustered into Amplicon Sequence Variants (ASVs). |
Experimental Protocol: Phenotype-Guided Isolation from Stressed Communities
Sample Preparation and Plating
- Sample Source: Begin with a complex microbial sample (e.g., human fecal material, soil, or stressed environmental sample).
- Stress Exposure (Optional): To enrich for resilient strains, expose the sample to a defined cocktail of chemical stressors relevant to your research question. For instance, a mixture of antibiotics, herbicides, and fungicides can be used [6].
- Plating: Serially dilute the sample and plate it onto solid agar media (e.g., mGAM). To increase diversity, use media supplemented with different antibiotics at appropriate concentrations (e.g., Cip, Tmp, Van) to create distinct enrichment cultures [24].
- Incubation: Incubate plates under required atmospheric conditions (e.g., anaerobiosis for gut microbes) until well-defined colonies appear.
Automated Imaging and Morphological Feature Extraction
- Image Capture: Place the plates into the CAMII imaging system. The system automatically captures two types of images for each colony:
- Transilluminated images: Reveal physical dimensions like height, radius, and circularity.
- Epi-illuminated images: Reveal surface characteristics like color, wrinkling, and texture [24].
- Feature Segmentation: Execute the custom colony analysis pipeline. The software segments individual colonies and quantifies a multidimensional set of features, including:
- Size: Area, perimeter, mean radius.
- Shape: Circularity, convexity, inertia.
- Color & Texture: Pixel intensities and their variances in the Red, Green, and Blue (RGB) channels [24].
Machine Learning-Guided Colony Picking
- Data Embedding: The quantified features for all colonies are embedded into a multidimensional Euclidean space.
- Smart Picking Algorithm: Execute the "smart picking" strategy. The ML algorithm selects colonies that are maximally distant from each other in this morphological space, ensuring the selection of the most phenotypically diverse set [24].
- Targeted Picking (Optional): For targeting specific genera, a trained classifier can be employed. The model uses the morphological data to predict the taxonomic identity of colonies, and the picker is directed to isolate those matching the desired taxa.
- Automated Isolation: The robotic colony picker inoculates the selected colonies into 384-well culture plates containing liquid media, generating the initial isolate library.
Downstream Genotypic Validation and Biobanking
- Culture and DNA Extraction: Grow the isolates in 384-well plates and use an automated liquid handler to extract genomic DNA.
- Taxonomic Identification: Perform 16S rRNA gene sequencing (e.g., V4 region) on all isolates. Cluster sequences into Amplicon Sequence Variants (ASVs) for species-level identification [24].
- Whole-Genome Sequencing (WGS): For a subset of isolates, perform WGS to obtain high-quality draft genomes for detailed phylogenetic and functional analysis [24].
- Data Integration and Storage: Create a searchable digital biobank. Link each isolate's morphological data, 16S taxonomy, and genome sequence in a database. The physical isolates are stored frozen, creating a valuable resource for future studies [25].
Workflow Visualization
Application in Stressed Bacteria Research
The integration of phenotypic and genotypic data enables powerful analyses relevant to stress biology. Application of this platform to human gut samples has yielded personalized biobanks totaling 26,997 isolates, representing over 80% of all abundant taxa in the original samples [24]. The key applications include:
- Diversity Maximization: The ML-guided picking strategy significantly enhances the discovery of rare species. One study found that to obtain 30 unique ASVs, only 85 ± 11 colonies needed to be isolated using the smart picking strategy, compared to 410 ± 218 colonies with random selection [24].
- Decoding Microbial Interactions: Spatial analysis of over 100,000 colonies can reveal co-growth patterns between different bacterial families (e.g., Ruminococcaceae, Bacteroidaceae), suggesting critical microbial interactions that may be disrupted or strengthened under stress [24].
- Elucidating Stress Response Mechanisms: Comparative genomics of isolates from stressed communities can uncover signatures of horizontal gene transfer (HGT) and selection, identifying genetic elements responsible for resilience to specific chemical pollutants [24] [6].
The CAMII platform represents a transformative approach in modern culturomics, moving beyond random selection to a data-driven, hypothesis-generating methodology. By standardizing the linkage between colony phenotype and genotype, it provides researchers with an efficient and powerful tool to dissect complex microbial communities, especially those subjected to environmental stressors. The detailed protocols outlined herein empower scientists to implement this advanced framework, accelerating the discovery of novel microbes and the understanding of their adaptive responses.
The study of bacterial responses to environmental stress is fundamental to understanding microbial ecology, evolution, and developing robust industrial bioprocesses. However, traditional culturing techniques face significant limitations in probing these responses with sufficient resolution and throughput. The "Great Plate Count Anomaly"—the discrepancy between microscopic cell counts and viable colonies on agar plates—highlights that a substantial proportion of bacteria remain uncultivated and uncharacterized using conventional methods [26]. Furthermore, when studying stressed bacteria, researchers must address inherent cellular heterogeneity, where individual cells within a clonal population exhibit differential survival and adaptive capabilities [27].
The emergence of Digital Colony Pickers (DCP) represents a transformative advance in high-throughput culturing technology. By integrating microfluidics, microscopy, and artificial intelligence, DCP platforms enable single-cell resolution and dynamic phenotypic monitoring of thousands of microbial clones simultaneously under precisely controlled conditions [28]. This technological revolution is particularly valuable for stressed bacteria research, allowing scientists to move beyond population-level averages and capture rare phenotypic variants and subtle temporal adaptations that would be masked in bulk analyses.
Digital Colony Picker Technology: Core Principles and Advantages
System Architecture and Workflow
The AI-powered Digital Colony Picker is an integrated platform comprising four core modules: (1) a microfluidic chip module containing thousands of picoliter-scale microchambers, (2) an optical module for imaging and laser-induced export, (3) a droplet location module for precise positioning, and (4) a droplet export and collection module for retrieving selected clones [28].
The microfluidic chip typically contains 16,000 physically isolated microchambers fabricated in a three-layer structure (PDMS mold, metal film, and glass layer) [28] [29]. This design enables single-cell compartmentalization in aqueous environments separated by gas or oil phases, preventing cross-contamination while allowing flexible reagent exchange. Each microchamber functions as an independent picoliter-scale bioreactor, supporting microbial growth and metabolic activities while eliminating the droplet fusion issues common in conventional droplet-based microfluidics [28].
Table 1: Technical Specifications of a Representative Digital Colony Picker Platform
| Parameter | Specification | Research Advantage |
|---|---|---|
| Throughput | 16,000 microchambers per chip [28] [29] | Parallel screening of thousands of clones |
| Chamber Volume | Picoliter scale (e.g., ~300 pL) [28] | Mimics natural microenvironments; reduces reagent consumption |
| Cell Loading | Vacuum-assisted; ~30% single-cell occupancy at optimal concentration [28] | Ensures monoclonal colony formation |
| Imaging Capabilities | Brightfield and fluorescence (470 nm and 530 nm) [29] | Multi-modal phenotypic assessment (growth, morphology, metabolism) |
| Identification Speed | ~1,000 colonies/hour with AI-powered recognition [29] | Rapid screening based on complex phenotypic criteria |
| Clone Export | Contact-free laser-induced bubble (LIB) technique [28] | Selective retrieval without cross-contamination |
| Collection Format | 96-well microtiter plates [29] | Direct compatibility with downstream analyses |
Comparative Advantages Over Traditional Methods
The DCP platform addresses critical limitations of traditional strain screening methods:
Single-Cell Resolution vs. Population Averaging: While traditional colony-based plate assays rely on macroscopic measurements that mask cellular heterogeneity, DCP enables dynamic monitoring of single-cell morphology, proliferation, and metabolic activities with spatiotemporal resolution [28] [27].
Dynamic Phenotypic Monitoring vs. Endpoint Analysis: Unlike conventional methods that provide only endpoint measurements, DCP facilitates continuous, non-invasive observation of clone development throughout the incubation period, capturing transient phenotypes and growth dynamics [28].
Enhanced Throughput with Precision: The platform combines the throughput of droplet microfluidics with the precision of picking-and-choosing approaches, processing thousands of clones while maintaining the ability to selectively export specific targets based on multi-parametric criteria [28] [30].
Reduced Contamination Risk: The non-contact colony recovery and water-in-oil microdroplet collection minimize aerosol formation and cross-contamination compared to manual colony picking or traditional droplet sorting [28] [29].
Application Note: Investigating Bacterial Stress Responses Using DCP
Experimental Design for Stress Tolerance Screening
The following workflow demonstrates the application of DCP technology for identifying bacterial mutants with enhanced tolerance to metabolic stress, using lactate stress in Zymomonas mobilis as a model system [28].
Key Experimental Parameters
Table 2: Experimental Parameters for Lactate Stress Tolerance Screening in Z. mobilis
| Experimental Stage | Parameter | Specification | Rationale |
|---|---|---|---|
| Chip Loading | Cell concentration | ~1 × 10⁶ cells/mL [28] | Optimizes for ~30% single-cell occupancy (Poisson distribution) |
| Baseline Growth | Incubation conditions | 30°C, nutrient-rich medium [28] | Ensures robust initial growth before stress application |
| Stress Application | Lactate concentration | 30 g/L [28] | Industrially relevant stress level for microbial cell factories |
| Phenotypic Monitoring | Imaging frequency | Every 2-4 hours [28] | Captures growth dynamics and stress adaptation trajectories |
| Selection Criteria | AI-identified phenotypes | Increased growth rate & sustained metabolism under stress [28] | Multi-parametric selection for robust performers |
| Clone Export | Laser parameters | Optimized for bubble formation without cell damage [28] | Ensures viability of exported clones |
Expected Outcomes and Validation
When applied to a library of Z. mobilis mutants, this DCP screening protocol successfully identified a mutant with 19.7% increased lactate production and 77.0% enhanced growth under 30 g/L lactate stress compared to the parental strain [28]. Subsequent genomic analysis linked this superior phenotype to overexpression of ZMOp39x027, a canonical outer membrane autotransporter that promotes lactate transport and cell proliferation under stress conditions [28]. This demonstrates how DCP screening directly accelerates functional gene discovery by linking multi-modal phenotypic data to genomic information.
Essential Protocols
Protocol 1: Microfluidic Chip Preparation and Single-Cell Loading
Principle: Achieve optimal distribution of single cells across microchambers while maintaining viability and preventing multiple occupancy.
Materials:
- DCP platform with microfluidic chips [29]
- Sterile growth medium appropriate for target bacteria
- Bacterial culture in early exponential growth phase (OD₆₀₀ ≈ 0.3-0.5)
Procedure:
- Chip Priming: Introduce sterile culture medium through the chip inlet to remove air bubbles and condition the microchambers.
- Cell Suspension Preparation: Harvest bacterial cells by gentle centrifugation and resuspend in fresh medium to a concentration of approximately 1 × 10⁶ cells/mL [28].
- Vacuum-Assisted Loading:
- Pre-vacuum the chip to remove residual air from microchambers.
- Introduce the cell suspension into the main channel.
- Residual air in microchambers is absorbed by the PDMS layer, facilitating complete filling with cell suspension.
- Incubate the chip for 15-30 minutes to allow cell sedimentation into microchambers.
- Loading Verification: Use brightfield microscopy to confirm single-cell distribution. At the recommended concentration, approximately 30% of microchambers should contain a single cell, with only ~5% containing multiple cells [28].
Troubleshooting:
- Low occupancy: Increase cell concentration incrementally.
- High multiple occupancy: Decrease cell concentration or introduce additional dilution steps.
- Evaporation concerns: Place chip in a water-saturated environment (e.g., 50 mL centrifuge tube 10% filled with water) [28].
Protocol 2: Dynamic Stress Exposure and Phenotypic Monitoring
Principle: Apply controlled stress conditions while continuously monitoring phenotypic responses at single-cell resolution.
Materials:
- DCP platform with integrated environmental control
- Stressor solution (e.g., sodium lactate for acid stress, chemicals for oxidative stress)
- Fluorescent viability or metabolic dyes (optional)
Procedure:
- Baseline Monitoring:
- Incubate loaded chip at optimal growth temperature.
- Acquire baseline brightfield and fluorescence images every 2 hours for the first 8 hours.
- Establish individual growth curves for each microchamber.
- Stressor Application:
- For gradual stress application: Introduce medium containing sub-inhibitory stressor concentration through the chip inlet, using gas gaps between microchambers to enable complete medium exchange [28].
- For acute stress application: Completely replace medium with stressor-containing solution at target concentration.
- Continuous Phenotypic Monitoring:
- Continue time-lapse imaging every 2-4 hours throughout stress exposure.
- For metabolic activity assessment, include fluorescent reporters or dyes in the medium.
- Monitor key parameters: cell division rate, morphological changes, fluorescence intensity (if using metabolic reporters).
- Data Extraction:
- Use AI-driven image analysis to quantify growth kinetics and metabolic activities for each microchamber.
- Apply selection algorithms to identify clones with desired phenotypic profiles under stress conditions.
Protocol 3: AI-Powered Clone Selection and Laser-Induced Export
Principle: Identify and selectively export high-performing clones based on multi-parametric phenotypic analysis.
Materials:
- DCP platform with AI image analysis software and laser export module
- Sterile collection oil (fluorinated oil recommended)
- 96-well collection plates containing recovery medium
Procedure:
- Target Identification:
- Apply trained algorithms to identify microchambers containing clones with target phenotypes (e.g., sustained growth under stress, specific morphological features).
- The system automatically registers coordinates of target microchambers.
- System Preparation for Export:
- Inject oil phase into the chip to facilitate droplet collection.
- Verify laser alignment using test patterns.
- Position collection capillary at the chip outlet.
- Laser-Induced Export:
- The motion platform positions laser focus at the base of identified microchambers.
- Using the Laser-Induced Bubble (LIB) technique, generate microbubbles at the chip membrane interface to propel single-clone droplets toward the outlet [28].
- Monitor droplet formation and transfer to ensure successful export.
- Clone Collection:
- Collect individual droplets at the capillary tip.
- Transfer droplets to 96-well plates using a cross-surface microfluidic printing method [28].
- Adjust collection times in real-time based on droplet flow rates.
Validation:
- Confirm monoclonality by examining growth in collection plates.
- Verify phenotype stability through subsequent culturing under selective conditions.
The Scientist's Toolkit: Essential Research Reagents and Materials
Table 3: Key Research Reagent Solutions for DCP Experiments
| Item | Function | Application Notes |
|---|---|---|
| PDMS-Glass Hybrid Chips | Microchamber array substrate | 16,000 microchambers; gas-permeable; compatible with high-resolution imaging [28] |
| Fluorinated Oil | Aqueous phase containment | Prevents evaporation and cross-contamination during export [30] |
| Laser-Dye Pairs | Metabolic activity reporting | 470 nm (blue) and 530 nm (green) excitation; compatible with GFP and similar fluorophores [29] |
| Surface-Tuned Surfactants | Droplet stabilization | Critical for maintaining droplet integrity during thermal cycling [31] |
| Laser-Absorbing Metal Film | Bubble generation for export | Typically indium tin oxide (ITO) layer with >86% transparency for visualization [28] |
| Modular Biosensor Systems | Metabolite detection | Dual-plasmid systems can decouple metabolite sensing from signal reporting [2] |
Digital Colony Pickers represent a paradigm shift in high-throughput culturing for stressed bacteria research. By enabling single-cell resolution, dynamic phenotypic monitoring, and AI-powered selective export, this technology overcomes critical limitations of traditional methods that have constrained our understanding of microbial stress responses. The ability to monitor thousands of clones simultaneously under precisely controlled stress conditions while maintaining temporal resolution provides unprecedented insight into bacterial adaptation mechanisms.
For researchers investigating stressed bacteria, DCP technology offers a powerful platform for identifying rare tolerant variants, elucidating adaptive mechanisms, and accelerating the development of robust industrial strains. As microfluidic technologies continue to evolve and integrate with advanced biosensors and omics technologies, DCP platforms will undoubtedly become indispensable tools for probing the complexities of microbial responses to environmental challenges.
The isolation of resilient microorganisms is a cornerstone of environmental microbiology, with critical applications in bioremediation and drug discovery. The strategic use of selective pressures, particularly from antibiotics and heavy metals, enables the enrichment of rare taxa possessing unique resistance mechanisms and biotechnological potential. High-throughput culturing techniques have revolutionized this field by allowing for the systematic investigation of complex stressor combinations and their effects on microbial populations. This application note details protocols for designing and executing enrichment cultures that leverage the co-selective pressures of antibiotics and heavy metals, framed within the context of advanced high-throughput methodologies for stressed bacteria research. The principles outlined herein are supported by a growing body of evidence demonstrating that exposure to multiple stressors can select for microbial communities with enhanced resilience and functionality [6] [32].
Theoretical Framework: Co-Selection Mechanisms
The simultaneous use of antibiotics and heavy metals in enrichment cultures is underpinned by three primary genetic models of co-selection, which drive the evolution and selection of resistant microbial populations.
Genetic Models of Co-Selection
Co-resistance: Occurs when genes conferring resistance to multiple antimicrobials are located on the same mobile genetic element (e.g., plasmid, transposon). Selection for one resistance gene simultaneously selects for all linked genes on the element [33] [32]. For instance, genomic studies have revealed that bacitracin resistance genes frequently co-occur on plasmids with copper and zinc resistance genes [32].
Cross-resistance: Arises when a single cellular mechanism provides protection against multiple unrelated stressors. Efflux pumps such as those from the RND (Resistance-Nodulation-Division) family can export both antibiotics and heavy metals from bacterial cells, representing a classic cross-resistance mechanism [33] [34]. For example, the Czc system in Pseudomonas species mediates resistance to cadmium, zinc, and cobalt, while also contributing to antibiotic tolerance [33].
Co-regulation: Involves shared regulatory systems that coordinate the expression of multiple resistance determinants in response to specific stressors. Heavy metals like zinc and copper can induce regulatory networks that simultaneously upregulate both metal detoxification systems and antibiotic resistance mechanisms [33] [34]. This coordinated response creates a phenotypic linkage between resistance to metals and antibiotics, even when the genetic determinants are not physically linked.
Table 1: Molecular Mechanisms of Heavy Metal and Antibiotic Co-Selection in Bacteria
| Heavy Metal | Resistance Mechanisms | Linked Antibiotic Resistance | Genetic Basis |
|---|---|---|---|
| Copper (Cu) | Efflux pumps (CopA), sequestration | β-lactams, tetracyclines | Plasmid-borne cop genes co-located with ARGs [33] [32] |
| Zinc (Zn) | Efflux (ZntA), permeability barrier | Macrolides, aminoglycosides | Co-regulation with multidrug efflux pumps [33] [34] |
| Cadmium (Cd) | Efflux (CzcCBA), sequestration | Vancomycin, bacitracin | Cross-resistance via shared efflux systems [33] |
| Mercury (Hg) | Enzymatic detoxification (MerA) | β-lactams, chloramphenicol | Co-resistance on transposons and plasmids [33] [34] |
| Arsenic (As) | Efflux (ArsB), reduction | Tetracyclines, quinolones | Regulatory cross-talk with oxidative stress responses [34] |
Visualization of Co-Selection Mechanisms
The following diagram illustrates the interconnected molecular pathways through which heavy metals and antibiotics exert co-selective pressure on bacterial populations:
High-Throughput Enrichment Protocols
Experimental Design and Workflow
The following protocol outlines a systematic approach for establishing enrichment cultures under dual antibiotic and heavy metal stress, optimized for high-throughput screening applications.
Table 2: High-Throughput Enrichment Culture Protocol for Strained Bacteria
| Step | Procedure | Parameters | Quality Control |
|---|---|---|---|
| Sample Collection | Aseptically collect environmental samples (sediment, soil, water) | Arctic/Antarctic lakes, marine sediments, industrial sites, depth: 10-50 cm [35] [36] | Sterile containers, temperature maintenance (4°C), GPS documentation |
| Selective Media Preparation | Prepare basal medium amended with stressor cocktails | Marine Agar 2216 or Nutrient Agar; CuSO₄: 100-500 mg/L; Lincomycin: 100-300 mg/L [37] | Filter sterilization of metal stocks, pH verification (6.0-8.0), osmolarity adjustment |
| Enrichment Culture Setup | Inoculate 1g sample into 75mL sterile media with stressors | Incubation: 4-37°C, 60-255 days, aerobic conditions with shaking [35] [37] | Regular monitoring for contamination, OD600 measurements |
| High-Throughput Screening | Transfer aliquots to multi-well plates for stress profiling | 96-well format, fluorescence-based reporters (σE, Rcs, Cpx) [38] | Include control strains, measure growth kinetics (OD600) and fluorescence |
| Strain Isolation & Characterization | Streak on selective media, purify colonies | Subculture on increasing stressor concentrations (100-500 μg/mL) [39] [35] | Gram staining, biochemical tests (API, Biolog), 16S rRNA sequencing |
High-Throughput Screening Assay for Cell Envelope Stress
The following diagram illustrates a specialized high-throughput screening workflow for identifying compounds that target bacterial cell envelope integrity:
This screening approach leverages bacterial stress response pathways as biosensors for cell envelope damage. The σE response is activated by impaired outer membrane protein biogenesis, the Cpx system responds to periplasmic and inner membrane stress, and the Rcs system detects perturbations in peptidoglycan assembly and lipopolysaccharide integrity [38]. By interrogating all three stress reporters simultaneously, researchers can obtain unique stressor profiles that aid in target identification and validation.
Quantitative Data and Applications
Bacterial Tolerance and Resistance Profiles
Comprehensive tolerance profiling of isolated strains provides critical data for selecting appropriate organisms for specific applications.
Table 3: Heavy Metal Tolerance and Antibiotic Resistance Profiles of Environmental Isolates
| Bacterial Strain | Source | Heavy Metal Tolerance (MIC, μg/mL) | Antibiotic Resistance Profile | Applications |
|---|---|---|---|---|
| Rossellomorea sp. ZC255 | Marine sediments (Weihai, China) | Cu(II): 500; Pb(II): >400; Zn(II): >400 [37] | Resistant to 12 antibiotics (lincomycin, β-lactams) [37] | Bioremediation of co-contaminated sites |
| Pseudomonas spp. | Battery waste site (Lagelu, Nigeria) | Pb: >400; Zn: >400; Ni: >400 [39] | Multidrug-resistant (Amoxicillin, Ciprofloxacin) [39] | Environmental bioindicators of pollution |
| Bacillaceae family | Polar lacustrine sediments | Fe: 1000; Cu: 1000; Hg: 100 [35] | Not specified | Bioremediation in cold environments |
| Multi-strain co-culture | Pristine freshwater (Iceland) | Not specified | Increased resilience to 8-chemical mixtures [6] | Toxicological screening, ecosystem modeling |
Bioremediation Performance Metrics
The practical application of metal-resistant bacteria can be evaluated through their metal and antibiotic removal capabilities.
Table 4: Bioremediation Performance of Metal and Antibiotic Resistant Bacteria
| Strain | Pollutant Target | Removal Efficiency | Experimental Conditions | Mechanism |
|---|---|---|---|---|
| Rossellomorea sp. ZC255 | Cu(II) | 651 mg/g biomass [37] | 30°C, pH 7.0-8.0, 3% NaCl | Biosorption, bioaccumulation |
| Rossellomorea sp. ZC255 | Lincomycin | 32.5 mg/g biomass [37] | 30°C, pH 7.0-8.0, 3% NaCl | Biodegradation, sequestration |
| Heavy metal-tolerant consortia | Hg, Fe | Up to 14.2% sequestration [35] | 4°C, polar conditions | Enzymatic detoxification, precipitation |
The Scientist's Toolkit: Essential Research Reagents
Table 5: Key Research Reagents for Enrichment Culture Studies
| Reagent/Category | Specific Examples | Function/Application | Experimental Notes |
|---|---|---|---|
| Heavy Metal Salts | CuSO₄, HgCl₂, NiSO₄·H₂O, CH₄O₄Pb·3H₂O, CdCl₂·2½H₂O, ZnSO₄·7H₂O [39] [35] | Selective pressure in enrichment media | Filter sterilize (0.22μm) before adding to cooled media |
| Antibiotics | Lincomycin, Amoxicillin, Oxytetracycline, Ciprofloxacin, Sulfamethoxazole-trimethoprim [6] [39] [37] | Co-selective pressure, resistance profiling | Prepare fresh stocks, consider stability in aqueous solutions |
| Culture Media | Marine Agar 2216, Nutrient Agar, M9 minimal medium [35] [38] [37] | Baseline growth support | Adjust pH and osmolarity based on target environment |
| Reporter Plasmids | pUA66-PrprA-mNG, pUA66-PcpxP-mNG, σE-GFP constructs [38] | High-throughput stress response screening | Use compatible vectors with host strains, optimize expression |
| Detection Reagents | Fluorescent proteins (mNeonGreen, GFP), API test strips, Biolog GEN III MicroPlates [38] [37] | Strain characterization and identification | Validate signal intensity against controls, optimize detection parameters |
Technical Considerations and Optimization Strategies
Successful implementation of these enrichment protocols requires attention to several critical technical aspects. Bioavailability of heavy metals is profoundly influenced by environmental matrices, with factors such as pH, redox potential, and organic content significantly modulating metal toxicity and selective pressure [33]. Chemical interaction effects must be considered, as increasingly complex mixtures show non-additive effects on bacterial growth, with both synergistic and antagonistic interactions observed in multi-stressor experiments [6]. Incubation timeframe represents another crucial variable, with evidence indicating that extended enrichment periods (up to 255 days) select for more robust and useful isolates [37]. Additionally, the inoculum source determines initial diversity, with pristine environments often yielding novel resistant strains despite no prior exposure history [6] [35].
Optimization approaches should include stressor gradient establishment through systematic variation of metal and antibiotic concentrations to determine minimal inhibitory and selective concentrations [32]. Community resilience assessment is vital, as mixed co-cultures demonstrate greater resilience to complex chemical mixtures than monocultures, revealing fewer interaction effects in growth responses [6]. High-throughput validation using fluorescent reporter systems enables rapid screening of isolates under multiple stress conditions simultaneously [38]. Finally, molecular characterization through 16S rRNA sequencing and genome analysis helps establish phylogenetic relationships and identify potential resistance mechanisms [39] [35] [37].
The strategic application of combined antibiotic and heavy metal pressures in enrichment cultures represents a powerful approach for selecting microbial strains with enhanced biotechnological potential. The protocols outlined in this application note, when implemented within a high-throughput screening framework, enable researchers to efficiently probe microbial responses to complex stressor combinations and identify strains with superior resilience and functionality. As evidence continues to mount regarding the interconnected nature of metal and antibiotic resistance in environmental bacteria, these methodologies will play an increasingly important role in addressing challenges ranging from environmental bioremediation to the discovery of novel antimicrobial strategies.
Automated Construction of Species-Characterized Biobanks for Functional Screening
The exploration of bacterial diversity for biotechnology and therapeutic applications is fundamentally limited by traditional, low-throughput methods for isolating, identifying, and screening bacterial isolates. This protocol details an integrated, high-throughput platform for the automated construction of species-characterized bacterial biobanks and subsequent functional screening. The methodology is particularly valuable for research on stressed bacteria, enabling the systematic discovery of functional traits, such as metabolite production or stress resilience, within vast microbial collections. By combining double-ended barcoded sequencing with a modular biosensor system, this approach reduces the cost and time of biobank development while providing a reusable resource for high-throughput functional assays [40] [41].
Experimental Protocols
High-Throughput Construction of a Species-Characterized Biobank
Sample Collection and Bacterial Isolation
- Source Materials: Collect bacterial samples from relevant environmental or clinical sources. The demonstrated protocol utilized fermented foods and infant feces collected across China [40].
- Cultivation: Isolate single bacterial colonies and culture them in 96-well plates containing appropriate growth media. Employ a high-throughput liquid handler (e.g., Tecan Freedom EVO) to streamline this process, enabling a single operator to process up to 2,500 samples per day [40].
- Cultivation Media for Stressed Bacteria: For studies on stressed gut microbiota, use a modified anaerobic cultivation protocol. Employ a basal minimal medium, such as basal Yeast Casitone Fatty Acid (bYCFA) medium, within a 96-deepwell plate system inside an anaerobic chamber (e.g., with a gas phase of 10% CO₂, 5% H₂, and 85% N₂). The medium can be flexibly supplemented with specific stress-inducing compounds or supplements to simulate desired conditions [42].
DNA Extraction and 16S rDNA Amplification
- Cell Lysis: Perform high-throughput cell lysis and DNA extraction directly in 96-well plates using the liquid handler.
- Primer Design: Amplify the full-length 16S rDNA gene using primers 27F and 1492R. Employ a double-ended barcoding strategy, flanking the gene-specific sequences with 75 pairs of unique 40-bp barcodes. These barcodes should contain no homopolymers and possess less than 60% similarity to each other to minimize demultiplexing errors during sequencing [40].
- PCR Optimization: Utilize a robustly optimized one-step PCR protocol to ensure uniform amplification across diverse bacterial strains. The optimized protocol should achieve uniform band intensity for over 95% of samples in gel electrophoresis. This step is critical for the accurate representation of all samples in pooled sequencing [40].
Pooled Sequencing and Species Identification
- Sequencing Platform: Pool the barcoded PCR products from thousands of bacterial isolates and sequence them on a long-read platform, such as the Oxford Nanopore PromethION, which is cost-effective for full-length 16S sequencing.
- Bioinformatic Analysis: Demultiplex the sequencing reads using the double-ended barcodes and process them through a customized bioinformatics pipeline for taxonomic classification. This approach has demonstrated 99% accuracy compared to Sanger sequencing while reducing the per-sample cost for species identification to under 10% of traditional methods [40].
- Automated Taxonomic Description (Optional): For a comprehensive description of novel taxa, tools like Protologger can be employed. This tool automatically generates taxonomic, functional, and ecological readouts from a genome sequence, substantially reducing the time required to create a formal protologue [43].
High-Throughput Functional Screening Using a Dual-Plasmid Biosensor
Biosensor Design and Assembly
- System Architecture: Design a versatile, fluorescence-based biosensor system using dual plasmids to decouple metabolite sensing from signal reporting [40] [41].
- Sensor Plasmid: Contains a transcription factor (TF) that specifically binds the target metabolite (e.g., GABA). Upon binding, the TF undergoes a conformational change, enabling it to activate a promoter on the second plasmid.
- Reporter Plasmid: Harbors the promoter activated by the metabolite-bound TF, which drives the expression of a reporter gene, such as a fluorescent protein (e.g., GFP).
- Modularity: This framework is highly adaptable. By swapping the TF and its corresponding promoter, the biosensor can be re-engineered for detecting diverse metabolites of industrial or clinical significance [40].
Biosensor-Based Screening Workflow
- Strain Preparation: Inoculate the bacterial isolates from the biobank into 96-well deepwell plates containing appropriate growth medium. Culture them under conditions that promote the production of the target metabolite.
- Metabolite Detection: For intracellular metabolites, lyse the cells. The biosensor cells, containing the dual-plasmid system, are then exposed to the lysates or cell-free supernatants.
- Fluorescence Measurement: Quantify the resulting fluorescence, which is proportional to the concentration of the target metabolite, using a plate reader. This allows for the rapid screening of thousands of isolates [40].
- Validation: Confirm the hits using established analytical methods, such as High-Performance Liquid Chromatography (HPLC) [40].
Results and Data Presentation
Performance Metrics of the High-Throughput Identification Pipeline
Table 1: Comparison of sequencing platforms for 16S rDNA-based species identification in biobank construction.
| Platform | Read Length | Reported Accuracy | Primary Advantage | Reported Cost per Sample |
|---|---|---|---|---|
| Sanger | Full-length | Gold Standard | Highest accuracy | High (Reference) |
| Illumina | Short (V3/V4) | Species-level limited | Low cost, high throughput | Information Missing |
| Nanopore | Full-length | 99% (vs. Sanger) | Cost-effective full-length | <10% of Sanger [40] |
| PacBio HiFi | Full-length | >99% | High accuracy | Information Missing |
Outcomes of Functional Screening for GABA Production
Table 2: Summary of biosensor-based high-throughput screening results for GABA-producing bacteria.
| Screening Parameter | Result | Description |
|---|---|---|
| Biobank Size | 15,337 isolates | Derived from fermented food and infant feces [40] |
| Isolates Screened | 1,740 isolates | Subsample of the total biobank [40] [41] |
| High-GABA Producers Identified | 46 isolates | Confirmed hits with high GABA-producing capacity [40] [41] |
| Hit Rate | ~2.6% | Proportion of screened isolates identified as functional [40] |
The Scientist's Toolkit: Research Reagent Solutions
Table 3: Essential materials and reagents for automated biobank construction and screening.
| Item | Function/Description | Protocol Context |
|---|---|---|
| Double-Ended Barcoded Primers | 40bp barcodes flanking 16S primers (27F/1492R); enable multiplexing of thousands of samples [40]. | Species Identification |
| bYCFA Medium | Basal minimal medium for flexible, high-throughput anaerobic cultivation of gut microbiota [42]. | Cultivation of Stressed Bacteria |
| Dual-Plasmid Biosensor System | Modular system decoupling metabolite sensing from fluorescence reporting; adaptable to various targets [40] [41]. | Functional Screening |
| 96-/384-Well Plates | Standardized plates for high-throughput culturing, assays, and storage. | Entire Workflow |
| Automated Liquid Handler | (e.g., Tecan Freedom EVO) for reproducible, high-sample-volume processing [40]. | Automation |
| Nanopore Sequencer | (e.g., PromethION) for cost-effective, full-length 16S rDNA sequencing of pooled libraries [40]. | Species Identification |
| Automated -80°C Store | (e.g., arktic system) for secure, high-density, trackable long-term sample storage [44]. | Biobank Storage |
Workflow and Signaling Pathway Diagrams
Automated Biobanking and Screening Workflow
Dual-Plasmid Biosensor Signaling Logic
Implementation and Concluding Remarks
The protocols described herein provide a comprehensive roadmap for establishing an automated pipeline for bacterial biobank construction and functional screening. The integration of high-throughput liquid handling, cost-effective Nanopore sequencing, and modular biosensor technology makes this platform highly accessible and scalable. For research on stressed bacteria, the cultivation protocols can be adapted by incorporating relevant chemical stressors or culturing conditions into the modular medium system [42] [6]. The resulting species-characterized biobank serves as a permanent, reusable resource that can be rapidly screened for various functional traits, dramatically accelerating the discovery of novel bacterial strains for application in drug development, industrial biotechnology, and probiotic research [40] [41].
Phytoremediation, the use of plants to remove, contain, or render harmless environmental pollutants, represents a sustainable approach to addressing heavy metal contamination in soils. However, the efficiency of this process is often limited by the phytotoxicity of metals and the slow growth of hyperaccumulator plants. Metal-resistant endophytic bacteria—microorganisms that reside within plant tissues without causing disease—offer a powerful solution to these limitations by enhancing plant metal tolerance, growth, and accumulation capacity [45] [46]. These endophytes have developed sophisticated mechanisms to cope with metal stress, which they can extend to their host plants, making them invaluable partners in phytoremediation strategies [47] [48]. The integration of high-throughput culturing techniques enables researchers to systematically isolate and characterize these beneficial microorganisms, accelerating the development of effective microbial inoculants for field applications [42] [49].
Metal Resistance Mechanisms in Endophytic Bacteria
Endophytic bacteria employ diverse biochemical strategies to tolerate heavy metals, which can be harnessed to improve phytoremediation efficiency. These mechanisms often work in concert to reduce metal toxicity and enhance plant survival in contaminated environments.
Table 1: Heavy Metal Resistance Mechanisms in Endophytic Bacteria
| Mechanism | Description | Key Examples |
|---|---|---|
| Biosorption | Passive binding of metal ions to functional groups on the bacterial cell wall | Bacillus amyloliquefaciens RWL-1 adsorbs Cu ions on cell surfaces [45] |
| Methylation | Addition of methyl groups to metal ions to reduce toxicity | Desulfovibrio species catalyze mercury methylation [45] |
| Redox Reactions | Transformation between different oxidation states to alter metal toxicity | Endophytic bacterium W1-2B oxidizes As(III) to less toxic As(V) [45] |
| Bioleaching | Microbial oxidation and dissolution of metal ions from solids | Combined autotrophic and heterotrophic bacteria leach Zn, Mn, Cu, and Cd from sludge [45] |
| Bioprecipitation | Secretion of compounds that chelate metals to form insoluble precipitates | Plant-growth-promoting rhizobacteria secrete extracellular polymers [45] |
| Biosynthesis | Production of metal-binding proteins like metallothioneins and glutathione | Synthesis of heat-stable proteins that bind heavy metal ions [45] |
The following diagram illustrates the interconnected relationship between endophytic bacteria, their resistance mechanisms, and the benefits conferred to host plants:
High-Throughput Isolation and Cultivation Protocols
Advanced cultivation methods are essential for isolating novel metal-resistant endophytes that can enhance phytoremediation. The following protocol adapts high-throughput approaches for the specific selection of metal-tolerant bacterial strains.
Sample Collection and Preparation
Plant Material Collection: Collect healthy root and shoot tissues from hyperaccumulator plants growing in metal-contaminated sites. Suitable plant species include Sedum alfredii, Brassica juncea, and Pteris vittata [49] [50]. Surface-sterilize tissues using sequential washes with 70% ethanol (2 minutes), 2% sodium hypochlorite (5 minutes), and multiple rinses with sterile distilled water [49] [51].
Homogenization and Dilution: Aseptically macerate 1 g of surface-sterilized plant tissue in 9 mL of sterile phosphate buffer (pH 7.0) using a sterile pestle and mortar. Prepare serial dilutions (10⁻¹ to 10⁻⁴) in anaerobic phosphate buffer under sterile conditions [42].
High-Throughput Cultivation in Multi-Well Plates
Medium Preparation: Prepare a basal minimal medium such as modified YCFA (bYCFA) with the following composition per liter: 1 g amicase, 1.25 g yeast extract, 0.5 g meat extract, mineral solutions, 1 g L-cysteine HCl, 4 g NaHCO₃, vitamin solution, and volatile fatty acids [42]. Adjust pH to 6.8 after autoclaving based on predetermined titration curves.
Metal Stress Application: Supplement media with filter-sterilized heavy metal solutions at varying concentrations (e.g., 0.1-5 mM Cd, Pb, Zn, or Cu) to select for metal-resistant strains. Include control wells without metal stress [49] [51].
Inoculation and Incubation: Inoculate 96-deepwell plates containing metal-supplemented media with the tissue homogenate dilutions (1% v/v) in an anaerobic chamber (10% CO₂, 5% H₂, 85% N₂). Seal plates with breathable membranes and incubate at 30°C for 48-72 hours with continuous shaking [42].
Growth Monitoring: Monitor bacterial growth by measuring optical density (OD₆₀₀) at regular intervals using a plate reader. Calculate the area under the growth curve (AUC) to quantify growth responses to metal stress [6].
Strain Isolation and Characterization
Subculturing and Purification: After incubation, streak cultures from wells showing significant growth onto solid media containing the same metal concentrations. Repeat until pure colonies are obtained.
Functional Characterization: Screen isolates for plant growth-promoting traits including indole-3-acetic acid (IAA) production, ACC deaminase activity, siderophore secretion, phosphate solubilization, and nitrogen fixation [45] [49].
Table 2: High-Throughput Screening Approach for Metal-Resistant Endophytes
| Screening Phase | Method | Parameters Measured | Selection Criteria |
|---|---|---|---|
| Primary Screening | Growth in metal-supplemented 96-well plates | OD600, area under growth curve | Metal tolerance index > 0.8 compared to control [6] |
| Secondary Screening | Functional trait assays | IAA production, siderophore secretion, ACC deaminase activity | Multiple PGP traits with high activity levels [49] |
| Tertiary Screening | Plant inoculation tests | Plant biomass, metal uptake, stress markers | Significant improvement in plant growth and metal accumulation [51] |
The Scientist's Toolkit: Essential Research Reagents
Table 3: Key Research Reagent Solutions for Endophyte Isolation and Characterization
| Reagent/Culture Medium | Composition | Function in Protocol |
|---|---|---|
| Basal YCFA (bYCFA) Medium | 1 g/L amicase, 1.25 g/L yeast extract, 0.5 g/L meat extract, mineral solutions, 1 g/L L-cysteine HCl, 4 g/L NaHCO₃ [42] | Basal medium for anaerobic cultivation of endophytic bacteria |
| Metal Stock Solutions | 100 mM filter-sterilized CdCl₂, Pb(CH₃COO)₂, CuSO₄, ZnSO₄, NaAsO₂ | Selection pressure for metal-resistant endophytes |
| Surface Sterilization Solution | 70% ethanol, 2% sodium hypochlorite, sterile phosphate buffer (pH 7.0) | Removal of epiphytic microorganisms from plant tissues |
| Siderophore Detection Reagent | Chrome azurol S (CAS) solution with hexadecyltrimethylammonium bromide (HDTMA) | Detection of iron-chelating siderophores [45] |
| IAA Detection Reagent | Salkowski's reagent (0.5 M FeCl₃ in 35% HClO₄) | Quantification of indole-3-acetic acid production [49] |
| ACC Supplement | 1-Aminocyclopropane-1-carboxylic acid (3 mM) as nitrogen source | Assessment of ACC deaminase activity [49] |
Synthetic Community Construction for Enhanced Performance
Single-strain inoculants often face challenges in field applications due to competition with indigenous microbiota and varying environmental conditions. Constructing synthetic microbial communities (SynComs) provides a more robust solution by mimicking natural microbial consortia [49].
Workflow for SynCom Development
The following diagram outlines the comprehensive process for developing and applying synthetic endophyte communities:
Protocol for SynCom Assembly and Testing
Core Microbiome Identification: Analyze 16S rRNA sequencing data from hyperaccumulator plants grown in contaminated sites using network analysis to identify core bacterial taxa consistently associated with metal accumulation [49].
Strain Selection: Select cultivable representatives from key genera identified in the core microbiome. For example, SynCom-NS developed for Sedum alfredii included Leifsonia shinshuensis, Novosphingobium lindaniclasticum, Ochrobactrum anthropi, and Pseudomonas izuensis [49].
Community Assembly: Cultivate individual strains in LB medium at 30°C for 72 hours. Combine equal volumes (OD₆₀₀ = 1.0) of each strain to create the SynCom inoculum [49].
Compatibility Testing: Spot-test strains on agar plates to detect antagonistic interactions. Remove strains that inhibit growth of other community members [49].
Validation in Plant Systems: Inoculate surface-sterilized seeds or seedlings with the SynCom suspension and monitor plant growth parameters, metal accumulation, and gene expression responses under controlled conditions [49].
Molecular Mechanisms of Plant-Endophyte Interactions
Endophytic bacteria enhance phytoremediation through direct and indirect mechanisms that improve plant growth and metal accumulation capacity. Understanding these molecular interactions is crucial for optimizing phytoremediation systems.
Direct Plant Growth Promotion
Phytohormone Production: Endophytes such as Pseudomonas sp., Bacillus sp., and Methylobacterium oryzae produce auxins, cytokinins, and gibberellins that stimulate plant growth even under metal stress [45] [47].
Nutrient Solubilization: Phosphate-solubilizing bacteria (e.g., Pseudomonas spp., Bacillus spp.) increase phosphorus availability, while nitrogen-fixing bacteria (e.g., Rhizobium spp., Azospirillum spp.) provide nitrogen to support plant growth in nutrient-deficient contaminated soils [45] [52].
Siderophore Production: Metal-chelating siderophores secreted by endophytes such as Serratia nematodiphila LRE07 enhance iron uptake and sequester toxic metals, reducing their phytotoxicity [45].
Indirect Plant Growth Promotion
ACC Deaminase Activity: Endophytes expressing 1-aminocyclopropane-1-carboxylate (ACC) deaminase reduce ethylene levels in plants under metal stress, preventing stress-induced growth inhibition [48] [50].
Induced Systemic Resistance: Endophytes prime plant defense systems through jasmonic acid and ethylene signaling pathways, enhancing tolerance to multiple stressors including heavy metals [45] [52].
Modulation of Metal Transporters: SynCom-NS inoculation upregulates genes related to Cd transport, antioxidative defense, and phytohormone signaling pathways in host plants, enhancing metal uptake and detoxification [49].
The integration of high-throughput cultivation techniques with molecular ecology provides a powerful framework for isolating and characterizing metal-resistant endophytic bacteria for phytoremediation applications. The systematic approach outlined in this Application Note—from high-throughput isolation and functional characterization to synthetic community construction—enables researchers to develop effective microbial inoculants that significantly enhance phytoremediation efficiency. As research in this field advances, the combination of sophisticated culturing protocols with omics technologies will further unravel the complex interactions between plants and their endophytic partners, paving the way for more predictable and successful field applications in contaminated site restoration.
Gamma-aminobutyric acid (GABA) serves as the primary inhibitory neurotransmitter in the human brain and has garnered significant interest for its potential health benefits, including anxiolytic effects, sleep improvement, and stress resilience [53] [54]. The microbial biosynthesis of GABA by lactic acid bacteria (LAB) presents a promising pathway for developing functional foods and next-generation probiotics. This application note details high-throughput methodologies for the isolation, screening, and identification of probiotic bacteria with enhanced GABA-producing capabilities, framed within the context of advanced culturing techniques for stressed bacteria research.
High-Throughput Screening Workflow
The discovery of high-GABA-producing probiotics employs an integrated, high-throughput pipeline that merges traditional microbiology with modern synthetic biology and sequencing technologies. This workflow enables researchers to efficiently process thousands of bacterial isolates from complex environmental samples [2]. The following diagram illustrates the comprehensive screening workflow, from initial isolation to final strain validation:
Protocols for GABA-Producing Probiotic Screening
Isolation and Culture of GABA-Producing LAB
Principle: Lactic acid bacteria are selectively isolated from carbohydrate-rich materials such as fermented foods, using culture media supplemented with monosodium glutamate (MSG) as a substrate for GABA production [53].
Procedure:
- Sample Preparation: Homogenize 1 g of fermented food sample (e.g., fermented sausage, vegetables) in 9 mL of sterile normal saline solution (0.85% NaCl) [53].
- Selective Cultivation: Spread the sample suspension onto de Man, Rogosa and Sharpe (MRS) agar plates supplemented with 2% (w/v) monosodium glutamate (MRS-MSG). Incubate plates aerobically at 37°C for 24-48 hours [53].
- High-Throughput Workflow: For large-scale biobank construction, pick single colonies into 96-well plates containing MRS-MSG broth using an automated liquid handler. This enables processing of up to 2,500 samples per day [2].
- Pure Culture Preparation: Re-streak morphologically distinct colonies on fresh MRS-MSG agar to obtain pure cultures. Preserve isolates at -20°C or -80°C for long-term storage [53].
Primary Screening Using Thin-Layer Chromatography (TLC)
Principle: TLC provides a rapid, cost-effective method for preliminary identification of GABA in culture supernatants based on migration distance and specific color development with ninhydrin reagent [54].
Procedure:
- Sample Preparation: Inoculate candidate LAB strains in MRS-MSG broth and incubate at 37°C for 48 hours. Centrifuge culture broth at 9,744 × g for 10 minutes at 4°C to obtain cell-free supernatant [53].
- TLC Plate Spotting: Spot 1 μL of each supernatant sample on a TLC aluminum sheet silica gel 60 F254. Include a GABA standard (0.5-1 mg/mL) as a positive control [53].
- Chromatography Development: Develop TLC plate in a solvent system of n-butanol:acetic acid:distilled water (5:3:2 v/v) in a saturated chamber [53].
- Visualization: Spray developed TLC plate with 0.5% (w/v) ninhydrin solution and heat at 60°C for 30 minutes. GABA appears as a distinct red-purple spot with an Rf value matching the standard [53].
Quantitative GABA Analysis by HPLC
Principle: Reversed-phase high-performance liquid chromatography (RP-HPLC) with UV detection provides precise quantification of GABA concentration in bacterial culture supernatants following derivatization [53].
Procedure:
- Sample Derivatization:
- Lyophilize 1 mL of cell-free culture supernatant.
- Reconstitute in 1 mL of EtOH:DI water:triethylamine (2:2:1) mixture.
- Add 80 μL of EtOH:DI water:triethylamine:PITC (7:1:1:1) solution.
- Incubate at room temperature for 20 minutes [53].
- HPLC Analysis:
- Instrument: HPLC system with UV detector (e.g., Agilent 1200 series)
- Column: Intersil ODS-3 column (4.6 × 150 mm, 5 μm)
- Mobile Phase:
- Solution A: 1.4 mM sodium acetate, 0.1% trimethylamine, 6% acetonitrile, pH 6.1
- Solution B: 60% acetonitrile
- Gradient: 0-100% mobile phase B over 70 minutes
- Flow Rate: 1.0 mL/min
- Detection: UV at 254 nm [53]
- Quantification: Calculate GABA concentration using a standard curve generated with authentic GABA standard (y = 14.782x - 0.0408, R² = 0.9998) [53].
Advanced Screening Using GABA Biosensors
Principle: Genetically encoded biosensors enable high-throughput screening of GABA-producing strains by linking GABA concentration to fluorescent signals or growth restoration [2] [54]. The following diagram illustrates the molecular mechanisms of two primary biosensor types:
Biosensor Implementation:
- Transcription Factor-Based Biosensor:
- Host: Corynebacterium glutamicum with plasmid pPPro2 containing GabR regulator and GFP reporter
- Dynamic Range: 0-8 mM GABA with >2.9-fold fluorescence increase
- Encapsulate in nanoliter reactors (NLRs) for high-throughput screening [54]
Growth Factor-Based Biosensor:
- Host: Alanine auxotroph Escherichia coli expressing 4-aminobutyrate transaminase (GABA-T)
- Principle: GABA-T transfers amino group from GABA to pyruvate, forming alanine
- Growth recovery correlates with GABA concentration in medium [54]
Screening Protocol:
- Co-culture producer strains with biosensor cells in NLRs
- Incubate under anaerobic, gut-like conditions (SHIME medium)
- Monitor fluorescence or growth restoration
- Isolate high-GABA producers based on biosensor signal [54]
Data Presentation and Analysis
GABA Production by Selected Bacterial Strains
Table 1: GABA Production Capacity of Selected Probiotic Bacterial Strains
| Bacterial Strain | Source | GABA Production (mg/mL) | Screening Method | Reference |
|---|---|---|---|---|
| Levilactobacillus brevis F064A | Thai fermented sausage | 2.85 ± 0.10 | HPLC | [53] |
| Levilactobacillus brevis DSM 20054 | Culture collection | 2.56 | HPLC | [54] |
| Lactococcus lactis DS75843 | Culture collection | 2.94 | HPLC | [54] |
| Bifidobacterium adolescentis DSM 24849 | Culture collection | 1.71 | HPLC | [54] |
| Lactobacillus brevis F064A in fermented mulberry juice | Fermented mulberry juice | 3.31 ± 0.06 | HPLC | [53] |
Comparison of GABA Detection Methodologies
Table 2: Performance Comparison of GABA Detection Methods
| Method | Throughput | Cost per Sample | Time Required | Quantitative/Qualitative | Best Use Case |
|---|---|---|---|---|---|
| Thin-Layer Chromatography (TLC) | Medium | Low | 2-4 hours | Qualitative | Primary screening of large isolate collections [53] [54] |
| High-Performance Liquid Chromatography (HPLC) | Low | High | 30-70 minutes per sample | Quantitative | Validation and precise quantification [53] |
| Transcription Factor Biosensor | High (≥100,000 samples/day) | Very low | 12-24 hours | Semi-quantitative | High-throughput screening of mutant libraries [2] [54] |
| Growth Factor Biosensor | High (≥100,000 samples/day) | Very low | 12-24 hours | Semi-quantitative | High-throughput functional screening [2] |
The Scientist's Toolkit: Essential Research Reagents
Table 3: Essential Research Reagents for GABA-Producing Probiotic Screening
| Reagent/Category | Specific Examples | Function/Application | Reference |
|---|---|---|---|
| Culture Media | MRS broth + 2% MSG | Selective growth and GABA production by LAB | [53] |
| Molecular Biology Kits | Nanopore 16S Barcoding Kit | Species identification with full-length 16S sequencing | [2] |
| Analytical Standards | GABA analytical standard (Sigma-Aldrich) | HPLC calibration and TLC reference | [53] |
| Biosensor Components | pPPro2 plasmid (GabR-GFP), E. coli GABA-T construct | High-throughput GABA detection | [54] |
| Chromatography Supplies | TLC silica gel 60 F254, HPLC column (Intersil ODS-3) | GABA separation and analysis | [53] |
| Encapsulation Materials | Alginate for nanoliter reactors | High-throughput screening under gut-like conditions | [54] |
Validation and Probiotic Potential Assessment
Probiotic Properties of GABA-Producing Strains
Acid and Bile Tolerance:
- Assess probiotic potential by testing survival under simulated gastrointestinal conditions
- Incubate selected strains in acidic buffer (pH 2.5-3.0) for 1-2 hours to simulate gastric passage
- Transfer to MRS broth containing 0.3% bile salts for 4-8 hours to simulate intestinal passage
- L. brevis F064A demonstrated high tolerance to acidic pH and bile salts, indicating promising probiotic characteristics [53]
Gut-like Condition Screening:
- Use Simulator of the Human Intestinal Microbial Ecosystem (SHIME) medium
- Encapsulate producer strains and biosensors in nanoliter reactors (NLRs)
- Cultivate under static, anaerobic conditions for up to 5 days
- Monitor growth and GABA production under physiologically relevant conditions [54]
Advanced Identification Techniques
High-Throughput 16S Sequencing:
- Employ double-ended barcoding strategy for multiplexed Nanopore sequencing
- Achieve 99% accuracy compared to Sanger sequencing at <10% of the cost
- Process thousands of bacterial isolates simultaneously for species identification
- Customized bioinformatics pipeline for taxonomic classification [2]
This application note provides a comprehensive framework for screening high-GABA-producing probiotics using integrated high-throughput methodologies. The combination of traditional microbiological techniques with advanced biosensors and sequencing technologies enables rapid identification and validation of candidate strains with potential applications in functional foods and psychobiotic formulations. The detailed protocols and performance comparisons offer researchers a practical guide for implementing these methods in drug development and probiotic research contexts.
Overcoming Workflow Bottlenecks and Enhancing Cultivation Efficiency
Application Notes
This document provides detailed application notes and protocols for studying bacterial growth kinetics and product formation under stress, with an emphasis on ensuring reproducibility through automated, high-throughput tools. These methods are essential for research in drug development, where understanding microbial responses to stressors like antibiotics and chemicals is critical [6] [55].
The integration of automated culturing, imaging, and monitoring systems allows for the precise and reproducible quantification of bacterial stress responses. These tools are particularly powerful for investigating phenomena such as the Stress Gradient Hypothesis (SGH) in microbial communities, where interactions shift from competitive to facilitative as environmental stress increases [56]. The protocols below enable the generation of high-quality, reproducible data on growth kinetics and metabolic interactions under controlled stress conditions.
Equipment and Software
The following table summarizes the core tools and their functions in ensuring experimental reproducibility.
| Tool Name | Primary Function | Key Feature for Reproducibility |
|---|---|---|
| CAMII Platform [4] | Automated strain isolation & imaging | Standardizes colony picking based on quantitative morphology, minimizing operator bias. |
| Mini Bioreactor Array (MBRA) [57] | High-throughput continuous culturing | Enables parallel cultivation of multiple microbial communities under consistent environmental conditions. |
| High-Throughput Fully Automated Bacterial Growth Curve Monitor (HTFA-BGM) [58] | Real-time growth kinetic monitoring | Uses near-infrared laser scattering to avoid interference from colored compounds, providing objective, dynamic growth data. |
Experimental Protocol: Assessing Bacterial Stress Responses in a High-Throughput System
This protocol describes a method for using the MBRA system to investigate bacterial growth kinetics and interaction dynamics under chemical stress.
Pre-Assembly Preparation
- PTFE Etching and Epoxy Application: For each MBRA strip, cut twelve 25 mm lengths of PTFE tubing. Seal the ends of each tube with laboratory tape to protect the inner surfaces. Etch the exposed ~10 mm middle section by sequentially immersing the tubes in:
- Fluorocarbon etching solution for 1 minute (CAUTION: Corrosive; use PPE and a fume hood) [57].
- 100% Ethanol (EtOH) bath for 5-20 seconds.
- Heated distilled H₂O (70 °C) bath for 15-30 seconds.
- Heated H₂O + 2-5% Acetic Acid (70 °C) bath for 1 minute [57]. Allow tubes to dry overnight. Remove tape. Insert six of the etched tubes into threaded Luer connectors, align the etched surface, and apply a 1:1 mix of epoxy resin and hardener at the junction. Let cure for 24 hours. These will serve as the media pipettes and waste straws [57].
MBRA Assembly and Sterilization
- Assemble the 3D-printed MBRA strip by threading the epoxy-sealed pipettes and other fittings into the three ports of each of the six bioreactor chambers [57].
- Connect the feed lines (e.g., C-flex tubing) and waste lines to the respective ports. Use a 3D-printed tube rack to organize the setup compactly and minimize tangling [57].
- Sterilize the fully assembled MBRA system using an appropriate method, such as autoclaving or chemical sterilants, ensuring all fluidic paths are sterile [57].
Inoculation and Stress Exposure
- Place the sterilized MBRA system inside an anaerobic chamber to maintain appropriate conditions for gut microbiome or other oxygen-sensitive bacteria [57].
- Connect the feed lines to reservoirs containing the desired growth medium. Use a 24-channel peristaltic pump to control the medium flow rate. A working volume of 15 mL per chamber and a turnover rate of 0.09 to 15.63 hours are common starting points [57].
- Inoculate each bioreactor chamber with a defined microbial community (e.g., a personalized gut isolate biobank [4] or a co-culture of environmental strains [6]).
- To introduce stress, supplement the medium in selected reservoirs with chemical stressors. Prepare a matrix of conditions, such as all 255 combinations of 8 different chemical pollutants (e.g., antibiotics, herbicides, fungicides), to systematically probe higher-order interactive effects [6].
Real-Time Monitoring and Sampling
- Activate the magnetic stirring system within each chamber (e.g., at 1000 rpm) to ensure homogeneous mixing and prevent cell clumping [58].
- For real-time growth kinetics, use an instrument like the HTFA-BGM. This system automatically performs near-infrared laser scattering measurements at set intervals (e.g., 12 measurements per sample every 10 seconds), plots growth curves in real-time, and stores the data [58].
- Collect effluent or directly sample from chambers at predetermined time points for downstream analysis, such as 16S rRNA sequencing for taxonomy or whole-genome sequencing for identifying horizontal gene transfer events [4].
Data Analysis and Interpretation
Quantitative data from these protocols should be analyzed to extract robust, reproducible metrics.
Table 1: Quantitative Metrics for Growth and Interaction Analysis
| Metric | Description | Application Example |
|---|---|---|
| Area Under the Curve (AUC) [6] | Integrated measure of bacterial growth over time. | Quantifying the effect of a chemical mixture on growth relative to a stress-free control [6]. |
| Minimum Inhibitory Concentration (MIC) [58] | Lowest concentration of an antimicrobial that prevents visible growth. | Screening the efficacy of Traditional Chinese Medicine monomers against MRSA with a threshold of ≤10% turbidity change ratio [58]. |
| Net Interaction & Emergent Interaction [6] | Measures of how stressors interact (synergistically or antagonistically) in a mixture, compared to a multiplicative null model. | Determining if an eight-way chemical mixture produces a non-additive effect on bacterial growth that cannot be predicted from single-stressor data [6]. |
Signaling Pathways in Bacterial Stress Response
Bacterial stress responses are regulated by complex signaling networks. The following diagram summarizes the key regulatory pathways involved in the general stress response in Gram-negative bacteria, which can influence antibiotic resistance and virulence [55].
High-Throughput Experimental Workflow
The entire process, from sample preparation to data analysis, can be integrated into a streamlined and reproducible workflow, as illustrated below.
Research Reagent Solutions
The following table lists key materials and their functions for the experiments described.
| Research Reagent | Function in Protocol |
|---|---|
| Fluorocarbon Etchant [57] | Chemically modifies PTFE tubing surface to enable strong epoxy bonding for leak-free fluidic connections. |
| Epoxy Resin & Hardener [57] | Creates a permanent, sterile seal between etched PTFE tubing and Luer connectors in the MBRA assembly. |
| Chemical Stressors (e.g., Antibiotics, Herbicides) [6] | Applied in defined mixtures to create controlled abiotic stress conditions and probe bacterial interaction shifts. |
| Columbia Blood Agar Plates [58] | Used for standard resuscitation and activation of bacterial strains prior to inoculation in high-throughput systems. |
| PTFE Tubing [57] | Forms the fluidic pathways for media input and waste output in the MBRA; chosen for chemical inertness. |
| 3D Printing Polymer (Transparent, Waterproof) [57] | Material for fabricating the custom MBRA blocks, allowing for visualization and containing the culture chambers. |
Strategies for Uniform Amplification and Cost-Effective Species Identification
Within the field of modern microbiology research, particularly in the study of stressed bacteria, two significant challenges persist: the uniform amplification of bacterial populations for high-throughput analysis and the rapid, cost-effective identification of species. Stressed bacteria, often resulting from antibiotic exposure, nutrient deprivation, or environmental extremes, exhibit altered physiological states that complicate traditional culturing and identification methods. These challenges impede progress in critical areas such as antimicrobial resistance studies, drug discovery, and environmental microbiology. This Application Note details integrated strategies that address these bottlenecks through technological innovations in 3D culture systems, advanced imaging, and mass spectrometry. The protocols outlined herein are designed to provide researchers with standardized methodologies for enhancing reproducibility and efficiency in bacterial studies, ultimately accelerating research outcomes in both academic and industrial settings.
Uniform Amplification Strategies for High-Throughput Culturing
Microwell Chip-Based 3D Culture System
Principle: This method utilizes a polydimethylsiloxane (PDMS) chip with a uniform array of micropores to create spatially segregated microenvironments for controlled bacterial aggregate formation. The approach ensures high-throughput amplification while maintaining uniform morphology of bacterial clusters, which is particularly valuable for studying population dynamics and heterogeneity in stressed bacterial communities [59].
Protocol:
- Chip Preparation: Fabricate a PDMS microwell chip using soft lithography. The standard chip dimensions are 20 mm × 16 mm × 2.5 mm (Length × Width × Height) containing 841 (29 × 29) uniformly arranged micropores (diameter = 0.2 mm, volume = 1.26 × 10⁻³ mm³) [59].
- Cell Seeding: Add a specific concentration of bacterial suspension to the microwell chip, allowing cells to settle into the micropores via gravity.
- Washing: Slowly wash away excess cells from the chip surface using fresh culture medium to ensure only micropore-contained bacteria remain.
- Culture Initiation: Add sufficient culture medium to cover the chip surface and transfer to a 37°C incubator.
- Aggregate Formation: Allow bacteria in micropores to spontaneously form uniform aggregates (typically 24-48 hours).
- Scale-Up: Invert the microwell chip to release bacterial aggregates into a PDMS-coated stirred culture flask for large-scale, uniform amplification [59].
Table 1: Performance Metrics of Microwell Chip Amplification Method
| Parameter | Performance Value | Significance |
|---|---|---|
| Survival Rate | >95% | Maintains viability of stressed bacteria |
| Throughput | 841 aggregates per chip (standard) | Scalable design for higher throughput |
| Morphology Uniformity | High (controlled by micropore geometry) | Reduces experimental variability |
| Operation Simplicity | Easy medium exchange and sampling | Facilitates long-term culture studies |
| Reproducibility | High (reusable, sterilizable chips) | Ensures consistent experimental conditions |
Automated Continuous-Culture with Single-Cell Imaging
Principle: This approach combines continuous-culture devices (chemostats) with custom-built epi-fluorescence microscopes to monitor abundance dynamics in bacterial communities at single-cell resolution. The system enables precise quantification of microbial populations while maintaining constant environmental conditions, ideal for studying stress responses over extended periods [60].
Protocol:
- System Setup: Construct a continuous-culture device housing a 20 mL culture in a glass vial within a temperature-controlled aluminum block.
- Flow Control: Implement computer-controlled peristaltic pumps for adding fresh media and removing spent media/cells, maintaining a constant culture volume.
- Automated Sampling: Configure a third peristaltic pump to draw samples once per minute from the culture vial through a micron-scale glass capillary.
- Imaging: Utilize a custom epi-fluorescence microscope to image cells as they pass through the capillary before returning them to the culture vessel.
- Image Analysis: Segment images in real-time using difference of Gaussians filtering followed by local thresholding and region-growing techniques.
- Data Processing: Classify objects using a support vector machine trained on manually-classified cells and aggregate detection via global moments-preserving thresholding [60].
Cost-Effective Species Identification Methods
Direct MALDI-TOF MS from Positive Blood Cultures
Principle: Matrix-assisted laser desorption ionization-time of flight mass spectrometry (MALDI-TOF MS) enables rapid identification of microorganisms by comparing unique protein profiles generated from laser ionization against a reference database. The direct method bypasses the need for prior isolation on routine media, significantly reducing processing time and costs [61].
Protocol:
- Sample Collection: Obtain positive blood culture bottles flagged by automated systems (e.g., BD BACTEC FX40 or BacT/ALERT).
- Inclusion Criteria: Include only samples showing a single organism type in direct Gram-stained films.
- Sample Processing: Transfer 4.0 mL from positive blood culture bottles to tubes containing plasma separation gel and centrifuge at 3000 × g for 10 minutes.
- Wash Step: Discard supernatant and resuspend precipitate in 1.0 mL of deionized water.
- Target Preparation: Spot 1 µL of suspension in triplicate on a MALDI-TOF MS target plate.
- Matrix Application:
- For bacteria: Add 1 µL of alpha-cyano-4-hydroxycinnamic acid matrix solution to each spot and allow to dry completely within 30 minutes.
- For yeast: Add 0.5 µL of formic acid to the spot, allow evaporation, then add 1 µL of matrix solution.
- MS Analysis: Analyze target plate using Vitek MS V3.2 system with E. coli ATCC 8739 for quality control.
- Interpretation: Identify microorganisms using confidence scores: 95-99.9% for species-level, 90-94% for genus-level identification [61].
Table 2: Performance of Direct MALDI-TOF MS Identification
| Microorganism Category | Species-Level ID Rate | Genus-Level ID Rate | Misidentification Rate | No ID Rate |
|---|---|---|---|---|
| Gram-negative bacteria | 90.16% (55/61) | 3.28% (2/61) | Not specified | 6.56% (4/61) |
| Gram-positive bacteria | 69.1% (38/55) | 3.6% (2/55) | Not specified | 27.3% (15/55) |
| Yeast | 33.3% (4/12) | 8.3% (1/12) | Not specified | 41.7% (5/12) |
| Overall | 75.8% (97/128) | 3.1% (4/128) | 2.3% (3/128) | 18.8% (24/128) |
Deep Learning-Enhanced Coherent Imaging for Early Detection
Principle: This automated system combines time-lapse coherent imaging with deep neural networks to detect and classify bacterial growth on agar plates much earlier than traditional methods. The platform significantly reduces detection time while maintaining high sensitivity and specificity, providing a cost-effective alternative to conventional culture-based identification [62].
Protocol:
- Sample Preparation: Concentrate water samples via filtration and transfer to 60-mm-diameter chromogenic agar plates.
- System Initialization: Place agar plates in the lens-free imaging system with agar surface facing the CMOS image sensor.
- Automated Imaging: Program the system to capture holographic images of the entire agar plate every 30 minutes throughout the incubation period (typically 24 hours).
- Image Processing: Digitally stitch individual holograms and reconstruct to reveal bacterial growth patterns.
- Differential Analysis: Apply differential image analysis to extract regions of interest showing changes in amplitude and/or phase signatures over time.
- Neural Network Detection: Process time-lapse image stacks (4 consecutive frames = 2-hour windows) using a pseudo-3D DenseNet architecture to eliminate non-bacterial objects.
- Classification: Employ a second deep neural network to classify bacterial species based on spatiotemporal features from the coherent images [62].
Integrated Workflow for Stressed Bacteria Research
Integrated workflow for uniform amplification and identification of stressed bacteria
The Scientist's Toolkit: Essential Research Reagents and Materials
Table 3: Key Research Reagent Solutions for Stressed Bacteria Studies
| Item | Function/Application | Specifications/Alternatives |
|---|---|---|
| PDMS Microwell Chips | Creates uniform microenvironments for bacterial aggregate formation | RTV615 PDMS (Momentive), 841 micropores/chip (0.2 mm diameter) [59] |
| Chromogenic Agar Media | Selective differentiation of bacterial species | Specifically detects E. coli (blue) and other coliforms (mauve) [62] |
| MALDI-TOF MS Matrix | Enables protein profiling for bacterial identification | Alpha-cyano-4-hydroxycinnamic acid; Formic acid for yeast [61] |
| Plasma Separation Gel | Processes positive blood cultures for direct identification | Used in centrifugation step to separate bacteria from blood components [61] |
| ABIL EM 180 Surfactant | Stabilizes water-in-oil emulsions for single-cell analysis | 7% in isopropyl palmitate for monodispersed emulsion generation [63] |
| phi-29 Polymerase | Enables multiple displacement amplification for single-cell WGA | Used in emulsion MDA for whole-genome amplification [63] |
| Continuous-Culture System | Maintains constant growth conditions for stress studies | Custom apparatus with temperature control and automated pumping [60] |
The strategies detailed in this Application Note provide researchers with robust methodologies for overcoming key technical challenges in stressed bacteria research. The integration of uniform amplification systems with cost-effective, rapid identification technologies creates a powerful pipeline for high-throughput studies. Particularly for antimicrobial resistance research and drug development, these approaches enable more reproducible experimental outcomes and significantly reduced processing times compared to conventional methods. As microbial research continues to address increasingly complex biological questions, the standardized protocols and quantitative frameworks presented here will serve as valuable resources for advancing our understanding of bacterial behavior under stress conditions.
Mitigating Evaporation in Picoliter-Scale Microchambers
Evaporation control is a critical technical challenge in high-throughput culturing techniques for stressed bacteria research, particularly within picoliter-scale microchambers. In microfluidic systems designed for single-cell analysis, the high surface-area-to-volume ratio of these miniature bioreactors makes them exceptionally susceptible to minute fluid loss. Uncontrolled evaporation can rapidly alter osmolarity and concentrate metabolites and toxins, imposing unintended and severe secondary stresses on microbial cells [64] [65]. This is especially detrimental in studies of bacterial stress response, where the goal is to observe authentic phenotypic reactions to defined stressors, such as lactate in Zymomonas mobilis or antibiotics in other pathogens [64] [66]. Effectively mitigating evaporation is therefore not merely a technical detail but a fundamental prerequisite for obtaining reliable, reproducible data in single-cell, high-throughput phenotypic screening platforms like the Digital Colony Picker (DCP) [64].
Quantitative Analysis of Evaporation Impact and Mitigation
The table below summarizes the key challenges posed by evaporation and the corresponding efficacy of implemented solutions as demonstrated in the literature.
Table 1: Evaporation Challenges and Mitigation Efficacy in Microfluidic Cultivation
| Challenge/Parameter | Impact of Evaporation | Mitigation Strategy | Quantified Outcome / Efficacy |
|---|---|---|---|
| Analyte Concentration | Alters concentration of nutrients, metabolites, and toxins, compromising assay validity [64]. | Not directly quantified for analytes, but mitigation stabilizes the environment. | Stabilization of growth conditions, enabling reliable identification of mutants with 19.7% increased lactate production [64]. |
| Cultivation Stability | Disrupts single-cell cultivation and dynamic monitoring, preventing reliable phenotyping [64]. | Humidified incubation chamber (water-filled centrifuge tube) [64]. | Enabled stable incubation; individual cells grew into independent microscopic monoclones [64]. |
| System Throughput | Chamber failure due to evaporation reduces the number of viable analysis units. | Gas-phase isolation between microchambers to prevent cross-evaporation and fusion [64]. | System maintained integrity of 16,000 picoliter-scale microchambers for high-throughput operation [64]. |
| Experimental Flexibility | Limits the possibility of medium exchanges or additive introduction. | Use of gas gaps between microchambers to allow for dynamic liquid replacement [64]. | Supported multiple media exchanges and changes to culture conditions through the chip inlet [64]. |
Detailed Experimental Protocol for Evaporation Control
This protocol describes the procedure to implement and validate a humidified incubation system for a microfluidic chip with picoliter-scale microchambers, based on the method successfully used in the Digital Colony Picker platform [64].
Materials and Equipment
Research Reagent Solutions and Essential Materials
Table 2: Key Materials for Microchamber Evaporation Control
| Item Name | Function/Description | Specific Example / Note |
|---|---|---|
| PDMS-Microfluidic Chip | The core device housing the picoliter-scale microchambers for single-cell cultivation [64]. | Chip consists of a PDMS mold layer, a metal film layer (e.g., ITO), and a glass layer [64]. |
| Indium Tin Oxide (ITO) Coated Glass | Serves as a transparent, photoresponsive layer for laser-induced bubble droplet export [64]. | ITO is deposited on glass via magnetron sputtering with >86% transparency for clear imaging [64]. |
| Water-Jacketed Incubator | Provides a stable, temperature-controlled environment for cell cultivation. | A high-precision temperature-controlled incubator is recommended [64]. |
| Sealable Centrifuge Tube | Acts as a humidification chamber for the microfluidic chip during incubation [64]. | A 50 mL centrifuge tube is used, filled with a small amount of pure water. |
| Deionized Water | Creates a saturated humidity environment within the centrifuge tube to minimize evaporation from the microchambers [64]. | N/A |
| Immersion Oil | Injected post-incubation to replace gas intervals, transforming them into oil intervals to prevent evaporation during sorting [64]. | Ensures no interference between microchambers during the droplet export process. |
Step-by-Step Procedure
- Chip Preparation and Loading: After vacuum-assisted loading of the single-cell suspension into the microfluidic chip [64], ensure the main inlet and outlet ports are securely sealed with adhesive or compatible plugs to prevent gas exchange through these channels.
- Humid Chamber Assembly: Place a small volume (e.g., 1-2 mL) of deionized water at the bottom of a 50 mL centrifuge tube. Carefully position the sealed microfluidic chip inside the tube, ensuring it does not come into direct contact with the liquid water.
- Incubation: Tightly close the lid of the centrifuge tube. Place the entire assembly in a pre-warmed, temperature-stable incubator for the required cultivation period.
- Post-Incubation Oil Phase Introduction: Following incubation, remove the chip from the humid chamber. Connect a syringe containing a biocompatible immersion oil to the chip's inlet. Gently inject the oil phase into the chip. This step replaces the gas gaps between microchambers with oil, forming a stable, evaporation-proof environment for subsequent steps like AI-driven imaging and laser-induced export of target clones [64].
Validation and Troubleshooting
- Validation: Compare the initial volume of a subset of microchambers (estimated via microscopy) with their volume after the incubation period. Successful mitigation is indicated by negligible volume change.
- Troubleshooting: If evaporation is observed, verify the seal of the centrifuge tube and ensure the chip's ports are properly closed. Check that the incubator temperature is stable, as fluctuations can exacerbate evaporation.
Visualization of the Evaporation Mitigation Workflow
The following diagram illustrates the core workflow for operating a microfluidic chip with integrated evaporation control, from preparation to clone export.
Integration in High-Throughput Stress Research
The ability to maintain a stable fluidic environment in picoliter chambers is a foundational capability that unlocks advanced research into bacterial stress responses. Platforms like the AI-powered Digital Colony Picker leverage this stability to dynamically monitor single-cell morphology, proliferation, and metabolic activities with spatiotemporal resolution [64]. This allows for the precise identification and isolation of rare mutants, such as lactate-tolerant Zymomonas mobilis, which exhibited a 77.0% enhancement in growth under stress [64]. Robust evaporation control is equally critical for other high-throughput applications, including quantitative screening of bacterial biocontrol agents [15] and droplet-based antibiotic susceptibility testing at the single-cell level [65], ensuring that observed phenotypes are a true reflection of the applied genetic or chemical stressor and not an artifact of the cultivation system.
Optimizing Single-Cell Loading and Distribution in Microfluidic Devices
The precise loading and uniform distribution of individual bacterial cells into microfluidic cultivation chambers is a foundational step in high-throughput single-cell analysis. For research investigating bacterial responses to environmental stressors, the initial loading process must not only be efficient but also preserve cell viability and ensure representative sampling of the population. Optimization of this process is critical for obtaining biologically relevant data on heterogeneity in stress responses, as mechanical stresses during loading can induce unintended physiological changes that confound experimental results. This protocol details established methods for achieving high-efficiency, gentle single-cell loading, with particular emphasis on applications within stress response studies.
The core challenge lies in moving cells from a bulk suspension into confined micro-environmental niches without compromising their integrity or introducing bias. Vacuum-assisted cell loading has emerged as a particularly effective method for gentle cell positioning, using applied negative pressure to draw cells into dedicated trapping chambers while shielding them from the damaging shear forces present in the main perfusion channels [67]. This article provides a comparative analysis of primary loading techniques and a detailed, actionable protocol for implementing one of the most robust methods.
Comparative Loading Techniques
The choice of a loading method is dictated by experimental requirements for throughput, viability, and integration with downstream processes. The following table summarizes the key characteristics of prominent techniques.
Table 1: Comparison of Single-Cell Loading and Distribution Methods
| Method | Working Principle | Optimal Use Case | Throughput | Viability Impact | Key Advantages |
|---|---|---|---|---|---|
| Vacuum-Assisted Loading | Application of negative pressure to draw cells into dedicated traps adjacent to the main flow channel [67]. | Long-term culturing and dynamic stimulation of delicate cells (e.g., stressed bacteria). | Medium | High (Low Shear) | Excellent protection from shear stress; Compatible with long-term perfusion and media switching. |
| Hydrodynamic Trapping | Use of micro-fabricated structures (e.g., pillars, U-shaped traps) to physically capture cells from a flowing stream. | High-throughput trapping of robust bacterial cells. | High | Medium (Variable Shear) | Simple device design and operation; No external controllers needed beyond flow pumps. |
| Acoustic Focusing | Employing ultrasonic standing waves to position cells into specific flow streams or nodes without physical contact [68]. | Label-free sorting and gentle positioning of sensitive cells. | Medium-High | High (Minimal Contact) | Extremely gentle, preserves cell viability; Can be integrated with sorting. |
| Optical Tweezers | Using highly focused laser beams to trap and move individual cells with optical forces [69]. | Precise manipulation of single cells for cloning or isolation. | Low | High (Non-invasive) | Unmatched single-cell precision; Ideal for prototyping and low-throughput studies. |
Detailed Protocol: Vacuum-Assisted Cell Loading
This protocol describes the procedure for loading bacterial cells using a single-layer PDMS microfluidic device with an integrated vacuum-assisted system, optimized for studies requiring minimal cellular stress [67].
Research Reagent Solutions & Essential Materials
Table 2: Essential Materials and Reagents for Vacuum-Assisted Loading
| Item | Specification/Function | Example/Supplier |
|---|---|---|
| Microfluidic Device | Single-layer PDMS device with vacuum channels and cell-trapping chambers [67]. | Fabricated in-house or sourced commercially. |
| Cell Culture | Bacterial strain of interest, cultured in appropriate medium to mid-log phase. | E.g., E. coli, Pseudomonas baetica [6]. |
| Syringe Pumps | For precise control of medium and cell suspension flow rates. | AL-1000, World Precision Instruments [67]. |
| Vacuum Pump/Regulator | To apply and finely control negative pressure for cell loading. | – |
| Tubing & Connectors | Chemically inert tubing (e.g., Tygon) and interconnects for fluidics. | – |
| Microscope with Camera | For real-time monitoring of the loading process. | Inverted microscope (e.g., Leica DMi8) with CCD camera [67]. |
Step-by-Step Procedure
Device Priming:
- Connect the device's medium inlet to a syringe pump filled with sterile growth medium or phosphate-buffered saline (PBS).
- Connect the vacuum port to a regulated vacuum source. Critical: Ensure the vacuum line is closed initially.
- Activate the syringe pump at a high flow rate (e.g., 500-1000 µL/h) to prime the main flow channels and remove all air bubbles. Visually confirm that the device is fully wetted.
System Preparation for Loading:
- Switch the device inlet to a syringe containing the washed bacterial cell suspension (OD~600 ~ optimized for single-cell occupancy, typically diluted).
- Set the syringe pump to a low, constant flow rate for cell loading. A rate of 50-100 µL/h is a common starting point [67].
Loading and Trapping:
- Open the regulated vacuum source to apply a gentle negative pressure. The optimal pressure must be determined empirically but should be sufficient to pull cells from the main channel into the trapping chambers without causing deformation or damage.
- Monitor the process in real-time under the microscope. Cells flowing through the main channel will be drawn into the vacant trapping chambers.
- Continue loading until the desired number of traps are occupied. The trap geometry (e.g., a 200 µm x 200 µm opening adjoining a 360 µm x 360 µm chamber) is designed to protect captured cells from shear stress in the main channel [67].
Post-Loading Perfusion:
- Once loading is complete, close the vacuum line.
- Switch the device inlet back to the fresh medium syringe.
- Commence perfusion at the desired flow rate for long-term culture or stimulus application. The trapped cells remain stable in their niches, exposed to a continuous supply of fresh medium or defined stressor mixtures [67] [6].
Troubleshooting Guide
- Problem: Low cell trapping efficiency.
- Solution: Increase cell concentration in the loading suspension; verify that the vacuum pressure is applied and sufficient; check for clogged traps.
- Problem: Traps are occupied by multiple cells.
- Solution: Reduce the cell concentration in the loading suspension; optimize the flow rate and/or vacuum pressure to allow single cells to enter traps sequentially.
- Problem: Cells are lysed or show poor viability after loading.
- Solution: Significantly reduce the applied vacuum pressure. Ensure all steps, including medium and cell suspension preparation, are performed under sterile conditions.
Workflow Integration for Stress Research
Integrating optimized cell loading into a complete workflow is essential for high-throughput research on bacterial responses to chemical stressors. The following diagram illustrates the pathway from environmental sample to data acquisition, highlighting how gentle loading acts as a critical gateway to reliable single-cell analysis.
Workflow for Single-Cell Stress Response Analysis
Experimental Design for High-Throughput Characterization
To demonstrate the application of this optimized loading protocol in a high-throughput stress research context, consider a study design inspired by modern ecotoxicology [6].
- Objective: To characterize the growth responses of multiple naive bacterial strains to all possible combinations of 8 chemical pollutants (antibiotics, herbicides, pesticides).
- Device Requirements: A multi-channel microfluidic device capable of parallel culture and dynamic mixing of inputs, such as one integrating a micromixer with multiple culture chambers [67].
- Loading Protocol: Apply the vacuum-assisted loading method detailed in Section 3 to load each bacterial strain into multiple replicate chambers across the device.
- Stressor Application: After loading and stabilization, perfuse the chambers with the 255 unique combinations of the 8 stressors. Use software-controlled syringe pumps to dynamically mix inputs from different stock reservoirs [67] [6].
- Data Acquisition & Analysis:
- Acquire time-lapse phase-contrast images every 30 minutes for 24-72 hours to monitor growth.
- Use automated cell tracking software to extract single-cell growth curves.
- Quantify the growth response for each strain under each condition as the Area Under the Curve (AUC) relative to a no-stressor control [6].
- Analyze data for net interactive effects (synergistic/antagonistic) between chemicals on bacterial growth.
This integrated approach, from gentle loading to precise perturbation and analysis, enables unprecedented resolution in mapping the responses of individual bacteria to complex environmental challenges.
Standardizing Protocols and Embracing Digital Tools for Streamlined Operations
The pursuit of reproducible and efficient research in microbiology, particularly in the study of stressed bacteria, hinges on the standardization of protocols and the integration of advanced digital tools. High-throughput culturing techniques generate complex datasets that demand robust, automated methods for analysis and interpretation. This application note provides detailed methodologies and computational workflows designed to standardize bacterial burden quantification and species identification, thereby enhancing the reliability and throughput of research on stressed bacterial populations.
Standardized Protocol for Bacterial Burden Quantification (BBQ)
Accurate quantification of bacterial burden within host cells is a critical step in understanding host-pathogen interactions under stress conditions. The following protocol, adapted for high-throughput workflows, utilizes confocal microscopy and automated image analysis to provide reliable, unbiased data [70].
Materials and Reagents
- Cell Line: RAW264.7 macrophages or other relevant host cells.
- Bacterial Strain: Fluorescently tagged bacteria (e.g., YFP-expressing Salmonella enterica serovar Typhimurium or Mycobacterium tuberculosis) [70].
- Culture Medium: Appropriate medium for host cells (e.g., DMEM for RAW264.7) supplemented with serum and antibiotics as needed [71].
- Fixative: 4% Paraformaldehyde (PFA) in PBS.
- Stains: DAPI (4',6-diamidino-2-phenylindole) for nuclei staining [70].
- Imaging Dishes: Glass-bottom dishes or plates suitable for high-resolution confocal microscopy.
Detailed Experimental Methodology
Infection of Host Cells:
- Culture host cells to the desired confluence in appropriate tissue culture vessels.
- Infect cells with fluorescent bacteria at a pre-optimized Multiplicity of Infection (MOI). Centrifuge plates to synchronize infection if necessary.
- Incubate for the required infection period (e.g., 30 minutes to 2 hours), then wash cells with pre-warmed PBS to remove extracellular bacteria.
- Add fresh medium containing antibiotics (e.g., gentamicin) to kill any remaining extracellular bacteria.
- Incubate cells for the desired post-infection period to study bacterial stress responses and replication.
Sample Preparation for Imaging:
- At the designated time point, aspirate the medium and carefully wash the cells with PBS.
- Fix cells with 4% PFA for 15-20 minutes at room temperature.
- Wash cells three times with PBS to remove residual fixative.
- Permeabilize cells with 0.1% Triton X-100 in PBS for 5-10 minutes (optional, depending on intracellular stain requirements).
- Stain with DAPI (1 µg/mL in PBS) for 10 minutes to label nuclei.
- Perform a final wash with PBS and store in PBS at 4°C protected from light until imaging.
Image Acquisition:
- Acquire multi-channel, z-stack images using a confocal microscope with a high-numerical-aperture (NA) objective.
- Set imaging parameters (laser power, gain, pinhole size) using uninfected control cells to minimize background and avoid signal saturation.
- Ensure consistent imaging settings across all experimental conditions and replicates.
Computational Workflow for Image Analysis
The following automated workflow, implemented in a Python environment using PyImageJ and Cellpose, quantifies total bacterial fluorescence and volume per host cell [70].
Workflow Steps:
- Nuclei Channel Isolation and Cellpose Segmentation: The nuclei channel (DAPI) is isolated from the original z-stack and compressed into a maximum-intensity z-projection. The deep learning-based software Cellpose is used to detect and outline all nuclei, outputting the coordinates for Regions of Interest (ROIs) [70].
- Voronoi Segmentation: The nuclei ROIs are used to perform a Voronoi segmentation in ImageJ/Fiji. This partitions the image into cellular territories based on the proximity to each nucleus, approximating whole-cell boundaries [70].
- Alternative Whole-Cell Segmentation: If a Differential Interference Contrast (DIC) or phase-contrast channel is available, Cellpose can be trained to segment entire cells directly, providing a more accurate representation of the cell cytoplasm than Voronoi segmentation [70].
- Bacterial Signal Quantification: The bacterial fluorescence channel (e.g., YFP) is processed into a maximum-intensity z-projection. The total bacterial fluorescence intensity or the total bacterial volume is then measured within each defined cellular ROI from the previous steps [70].
High-Throughput Construction of Species-Characterized Biobanks
Screening stressed bacteria for novel functions requires a curated collection of well-characterized strains. This protocol outlines a cost-effective, high-throughput pipeline for constructing a bacterial biobank, leveraging Nanopore sequencing for accurate species identification [2].
Materials and Reagents
- Sample Sources: Environmental samples, fermented foods, or infant feces [2].
- Culture Media: A variety of rich and minimal media prepared in 96-well deep-well plates to support the growth of diverse bacterial species [2].
- Lysis Buffer: Solution for chemical or enzymatic lysis of bacterial cells (e.g., containing lysozyme).
- PCR Reagents: High-fidelity DNA polymerase, dNTPs, and double-ended barcoded primers targeting the full-length 16S rDNA gene (27F/1492R) [2].
- Purification Kits: Magnetic beads or spin columns for PCR product clean-up.
- Sequencing Kit: Oxford Nanopore Ligation Sequencing Kit for PromethION.
Detailed Experimental Methodology
Strain Isolation and Cultivation:
- Isolate single bacterial colonies from source samples and inoculate into 96-well plates containing different growth media.
- Incubate plates with shaking at appropriate temperatures (e.g., 30°C or 37°C) until sufficient growth is achieved.
High-Throughput DNA Extraction and 16S rDNA Amplification:
- Using a liquid handler, lyse bacterial cells directly in the 96-well culture plates.
- Perform PCR amplification of the full-length 16S rDNA gene using the barcoded primers. The protocol should be optimized for uniform amplification across diverse bacterial species to ensure equal representation in pooled sequencing [2].
- Purify the PCR products using a magnetic bead-based clean-up system.
Pooled Sequencing and Species Identification:
- Quantify the purified PCR products and pool them in equimolar ratios into a single library.
- Prepare the library for Nanopore sequencing using the Ligation Sequencing Kit and load it onto a PromethION flow cell [2].
- Sequence the pooled library to generate full-length 16S rDNA reads.
The sequencing and analysis workflow is summarized in the following diagram:
Data Analysis: A customized bioinformatics pipeline is used to demultiplex the sequencing reads by their barcodes and assign taxonomy to each bacterial isolate. The accuracy of species identification is optimized by setting a minimum threshold for read coverage and purity (the relative abundance of the most likely species call) [2].
Data Presentation and Analysis
Comparative Analysis of Sequencing Platforms for Biobank Identification
The choice of sequencing platform involves a trade-off between cost, throughput, and accuracy. The table below summarizes a comparative analysis for bacterial species identification in a biobank context [2].
Table 1: Comparison of Sequencing Platforms for 16S rDNA-Based Species Identification in Bacterial Biobanks
| Platform | Read Length | Approx. Cost per Sample | Key Advantages | Key Limitations | Suitability for High-Throughput Biobanking |
|---|---|---|---|---|---|
| Sanger | Full-length (~1500 bp) | High | Gold standard for accuracy | Low throughput, high cost | Low |
| Illumina (V3/V4) | Short (300-600 bp) | Medium | High throughput, low cost | Limited species-level resolution | Medium |
| PacBio HiFi | Full-length (~1500 bp) | High | Very high accuracy (>99.9%) | High per-run cost, center-operated | Medium |
| Nanopore | Full-length (~1500 bp) | Low (<10% of Sanger) | Real-time, long reads, portable | Higher raw error rate | High |
Quantitative Data from Bacterial Burden Quantification Assay
The automated BBQ workflows generate quantitative data on bacterial load at the single-cell level. The following table provides an example of how this data can be structured for analysis, comparing different bacterial strains or stress conditions.
Table 2: Example Data Structure from Bacterial Burden Quantification in Macrophages
| Cell ID | Treatment Condition | Nucleus Area (px²) | Cell Area (px²) | Total Bacterial Fluorescence | Total Bacterial Volume (µm³) | Bacteria per Cell |
|---|---|---|---|---|---|---|
| 1 | Control | 185 | 1425 | 55,250 | 12.5 | 8 |
| 2 | Control | 210 | 1610 | 48,100 | 10.8 | 7 |
| 3 | Antibiotic Stress | 195 | 1550 | 15,500 | 2.1 | 2 |
| 4 | Antibiotic Stress | 175 | 1380 | 12,200 | 1.8 | 2 |
| ... | ... | ... | ... | ... | ... | ... |
| Mean (Control) | 197.5 | 1517.5 | 51,675 | 11.65 | 7.5 | |
| Mean (Stress) | 185.0 | 1465.0 | 13,850 | 1.95 | 2.0 |
The Scientist's Toolkit: Research Reagent Solutions
The following table details key reagents and materials essential for implementing the high-throughput protocols described in this application note.
Table 3: Essential Research Reagents and Digital Tools for High-Throughput Microbial Workflows
| Item | Function/Application | Example/Note |
|---|---|---|
| LB Broth (Miller) | A general-purpose medium for the cultivation of various bacteria, including E. coli [71]. | Available as granules for fast dissolution; can be supplemented with antibiotics for selective growth [71]. |
| Double-Ended Barcoded Primers (27F/1492R) | Allows for multiplexed, pooled sequencing of full-length 16S rDNA from thousands of isolates [2]. | Critical for reducing per-sample sequencing costs in biobank construction [2]. |
| Fluorescent Protein Plasmids | For constitutive expression of fluorescent markers (e.g., YFP) in bacterial strains for microscopy-based quantification [70]. | Essential for visualizing and quantifying intracellular bacteria in BBQ assays [70]. |
| DAPI (4',6-diamidino-2-phenylindole) | A fluorescent stain that binds strongly to DNA, used to label host cell nuclei in fixed samples [70]. | Serves as the anchor for cell segmentation in the computational workflow [70]. |
| PyImageJ | A Python library that provides access to ImageJ/Fiji functionalities within a Python environment [70]. | Enables interoperability between ImageJ and Python-based tools like Cellpose for automated image analysis [70]. |
| Cellpose | A deep learning-based segmentation software for precisely outlining nuclei or whole cells in microscopy images [70]. | Its adaptability to different cell types improves the accuracy of single-cell analyses [70]. |
Assessing Fidelity: From Genotypic Validation to Technology Comparisons
High-throughput sequencing technologies have revolutionized microbial genetics by enabling the precise dissection of relationships between genetic makeup (genotype) and observable characteristics (phenotype). Within stress microbiology, these technologies provide an unparalleled capacity to understand how bacteria adapt to adverse conditions, such as exposure to complex chemical mixtures [6]. This understanding is critical for addressing pressing issues in drug development, including antibiotic resistance and the identification of novel therapeutic targets.
The transition from traditional, low-throughput culturing methods to advanced sequencing-based approaches has fundamentally transformed experimental capabilities. Where researchers were once limited to studying single stressors or a handful of genetic mutations, technologies like single-cell DNA-RNA sequencing (SDR-seq) [72] and genome-scale Perturb-seq [73] now allow for the simultaneous profiling of thousands of genetic perturbations and their phenotypic consequences. This scalability is particularly valuable for studying stressed bacteria, where adaptation mechanisms often involve complex, polygenic traits that cannot be understood through reductionist approaches.
This article details practical protocols and methodologies for applying high-throughput sequencing to validate genotype-phenotype links in stressed bacteria, providing researchers with actionable frameworks for implementing these approaches in drug discovery and basic research contexts.
Key High-Throughput Technologies and Their Applications
Table 1: High-throughput technologies for genotype-phenotype validation
| Technology | Key Capabilities | Applications in Stress Research | Throughput Scale |
|---|---|---|---|
| SDR-seq [72] | Simultaneous profiling of DNA variants and transcriptome in single cells | Linking mutational burden to stress response pathways; identifying rare resistant subpopulations | Thousands of cells, hundreds of loci |
| Perturb-seq [73] | CRISPR-based screening with single-cell RNA sequencing readouts | Genome-wide identification of genes essential for stress resilience | Millions of cells, thousands of genes |
| scRNA-seq for GPM [74] | Expression quantitative trait loci (eQTL) mapping at single-cell resolution | Understanding transcriptional regulation underlying stress adaptations | Thousands of segregants |
| Multi-stressor Phenotyping [6] | High-throughput growth profiling under complex chemical mixtures | Quantifying bacterial responses to pollutant combinations; identifying synergistic toxicity | 255+ chemical combinations |
Research Reagent Solutions
Table 2: Essential research reagents and their applications
| Reagent/Category | Specific Examples | Function in Experimental Workflow |
|---|---|---|
| CRISPR Tools | dCas9-KRAB, sgRNA libraries [73] | Targeted gene repression for functional genomics screens |
| Single-Cell Platforms | 10X Genomics Chromium, Tapestri [72] [74] | Partitioning individual cells for barcoding and parallel processing |
| Sequencing Reagents | Poly(dT) primers, UMIs, sample barcodes [72] | cDNA synthesis, molecule counting, and sample multiplexing |
| Culture Media | MRS broth, LB broth, specialized fermentation media [75] [76] | Supporting bacterial growth under controlled/stress conditions |
| Fixation Reagents | Paraformaldehyde, glyoxal [72] | Cell preservation for nucleic acid integrity during processing |
Experimental Protocols for Genotype-Phenotype Validation
Single-Cell DNA-RNA Sequencing (SDR-seq) for Stressed Bacteria
Protocol Overview: This protocol enables correlated detection of genomic DNA variants and transcriptome profiles in thousands of single bacterial cells, allowing direct linkage of mutations to stress-responsive gene expression programs [72].
Step-by-Step Workflow:
- Cell Preparation and Stress Exposure:
- Grow bacterial culture to mid-log phase in appropriate medium.
- Apply stressor (e.g., chemical pollutant mixture [6] at sublethal concentration for 2-4 generations.
- Include unstressed control culture for reference.
Cell Fixation and Permeabilization:
- Harvest approximately 10^6 cells by centrifugation.
- Resuspend in glyoxal-based fixative (superior for nucleic acid preservation) [72] for 15 minutes at room temperature.
- Wash with PBS and permeabilize with 0.1% Triton X-100 for 5 minutes.
In Situ Reverse Transcription:
- Prepare RT mix with custom poly(dT) primers containing UMIs and sample barcodes.
- Incubate fixed cells in RT mix for 45 minutes at 42°C.
- Terminate reaction and wash cells.
Droplet-Based Partitioning and Library Preparation:
- Load cells onto Tapestri platform (Mission Bio) for droplet encapsulation.
- Perform multiplexed PCR amplification using targeted panels for stress-relevant genes.
- Recover amplicons and prepare separate libraries for gDNA (full-length) and RNA (UMI-counted).
Sequencing and Data Analysis:
- Sequence gDNA library with high coverage for variant calling (>100x).
- Sequence RNA library with sufficient depth for transcript quantification.
- Use cell barcodes to correlate genotypes and phenotypes in single cells.
Troubleshooting Tips:
- Low RNA recovery: Increase permeabilization time or try alternative fixatives
- High doublet rate: Dilute cell suspension before loading
- Allelic dropout: Increase gDNA PCR cycles or optimize primer design
High-Throughput Chemical Stressor Profiling
Protocol Overview: This methodology assesses bacterial growth responses to complex chemical mixtures, identifying genetic determinants of resistance through systematic combination screening [6].
Step-by-Step Workflow:
- Stressor Preparation:
- Select 8 relevant chemical stressors (e.g., antibiotics, herbicides, pesticides)
- Prepare stock solutions at 100x final concentration in appropriate solvents
- Create all 255 possible combinations in 96-well plates using liquid handling robots
Bacterial Inoculation and Growth Monitoring:
- Dilute overnight bacterial cultures to standardized OD600 (∼0.01)
- Inoculate stressor plates with 5μL bacterial suspension per well
- Include control wells without stressors for normalization
- Incubate with continuous shaking at optimal growth temperature
- Monitor OD600 every 15 minutes for 24-48 hours
Data Processing and Interaction Analysis:
- Calculate area under growth curve (AUC) for each condition
- Normalize to stressor-free control growth (G = AUCstress/AUCcontrol)
- Apply multiplicative null model to identify synergistic/antagonistic interactions
- Use bootstrapping to determine statistical significance
Genomic Correlates Analysis:
- Sequence genomes of resistant and sensitive populations
- Perform genome-wide association studies (GWAS) for stress resilience
- Validate candidate mutations through targeted sequencing
Application Notes:
- For naive environmental isolates, include adaptation period to laboratory conditions
- Use mixed co-cultures to assess community-level resilience [6]
- Scale down to 384-well format for higher throughput when needed
Data Analysis Frameworks
RNA-Seq Analysis Pipeline for Stress Response Profiling
Protocol Overview: This standardized pipeline processes RNA sequencing data to identify differentially expressed genes and pathways under stress conditions, enabling correlation with genetic variants [77].
Step-by-Step Workflow:
- Quality Control and Trimming:
- Assess read quality with FastQC (per base sequence quality, adapter contamination)
- Trim adapters and low-quality bases using Trimmomatic or fastp
- Remove reads with average quality score <20 or length <50bp
Read Alignment and Quantification:
- Map cleaned reads to reference genome using STAR or HISAT2
- For transcript-level analysis, use pseudoalignment with Salmon
- Count reads per gene using featureCounts with GTFF annotation file
- Generate raw count matrix for downstream analysis
Differential Expression Analysis:
- Import counts into R/Bioconductor using DESeq2 or edgeR
- Apply normalization (e.g., TMM, median-of-ratios) to correct for library size
- Model counts with negative binomial distribution
- Test for significant expression changes (adjusted p-value < 0.05, |log2FC| > 1)
Pathway and Functional Enrichment:
- Perform Gene Set Enrichment Analysis (GSEA) on ranked gene lists
- Test for overrepresentation of stress-related pathways (KEGG, GO)
- Visualize results with volcano plots, heatmaps, and pathway diagrams
Implementation Considerations:
- Include at least 3-5 biological replicates per condition for adequate power [77]
- Sequence depth of 20-30 million reads per sample is generally sufficient
- Account for batch effects when processing multiple sequencing runs
Experimental Parameters for Stressed Bacteria Studies
Table 3: Key parameters for high-throughput stress studies
| Parameter | Recommended Specification | Rationale |
|---|---|---|
| Replicates | Minimum 3-5 biological replicates [77] | Enables robust statistical testing and variance estimation |
| Sequencing Depth | 20-30 million reads (RNA-seq); 100x coverage (DNA) [77] | Balances cost with detection sensitivity for most applications |
| Chemical Mixtures | 255 combinations of 8 stressors [6] | Comprehensive assessment of high-order interactions |
| Time Points | Multiple points during stress adaptation | Captures dynamic transcriptional responses |
| Stressor Concentration | Sublethal (IC10-IC30) | Reveals adaptive responses rather than outright toxicity |
Integration with Traditional Microbiology Approaches
While high-throughput sequencing provides unprecedented resolution, its power is magnified when integrated with established microbiological methods. Optimization of culture conditions using response surface methodology can significantly enhance bacterial growth and metabolite production, thereby improving the quality of starting material for sequencing [75] [76]. For instance, systematic optimization of pH, temperature, and media components increased the OD600 of Bacillus amyloliquefaciens fermentation broth by 72.79% [75].
Similarly, advanced culturing models such as three-dimensional (3D) cultures provide more physiologically relevant contexts for host-pathogen interaction studies [78]. These systems better mimic in vivo conditions and can be coupled with high-throughput sequencing to understand genetic responses during infection. The combination of 3D organoid models with single-cell RNA sequencing enables researchers to study bacterial gene expression in environments that recapitulate key aspects of host tissues.
This integrated approach – combining optimized culture conditions, advanced culturing models, and high-throughput sequencing – creates a powerful framework for validating genotype-phenotype links in stressed bacteria, with direct applications in antibiotic discovery and understanding resistance mechanisms.
High-throughput sequencing technologies have fundamentally transformed our ability to validate genotype-phenotype relationships in stressed bacteria, providing resolution from single nucleotides to population-level dynamics. The methodologies detailed herein – including SDR-seq for correlated genotype-transcriptome analysis, high-throughput chemical phenotyping, and integrated RNA-seq analysis pipelines – offer researchers comprehensive toolkits for unraveling bacterial adaptation mechanisms.
As these technologies continue to evolve, their integration with traditional microbiological approaches and advanced culturing models will further enhance their predictive power and biological relevance. For drug development professionals, these approaches enable systematic identification of resistance mechanisms and novel therapeutic targets, ultimately supporting the development of more effective antimicrobial strategies in an era of increasing antibiotic resistance.
Antimicrobial resistance (AMR) represents one of the most severe global health threats of the 21st century, projected to cause 10 million annual deaths by 2050 [79]. Within the framework of high-throughput culturing techniques for stressed bacteria research, accurate resistome profiling—the comprehensive characterization of antibiotic resistance genes (ARGs) and their associated mobile genetic elements (MGEs)—has become paramount for understanding resistance dissemination dynamics. Two principal high-throughput methodologies have emerged for environmental and clinical resistome monitoring: High-Throughput Quantitative Polymerase Chain Reaction (HT-qPCR) and Shotgun Metagenomic Sequencing (SMS) [80] [81].
HT-qPCR employs multiplexed primer sets in nanoliter-scale reactions to simultaneously quantify hundreds of predefined ARG targets, MGEs, and taxonomic markers [80] [82]. In contrast, SMS utilizes next-generation sequencing to provide untargeted, comprehensive access to the entire genetic material within a sample, enabling simultaneous resistome, microbiome, and functional profiling [83] [84]. This application note provides a detailed comparative assessment of these complementary approaches, offering structured protocols and analytical frameworks to guide researchers in selecting appropriate methodologies for stressed bacteria culturing and drug discovery pipelines.
Comparative Performance Analysis
Technical Capabilities and Detection Performance
Table 1: Comparative analysis of HT-qPCR and SMS methodological capabilities based on experimental data from multiple studies.
| Parameter | HT-qPCR | Shotgun Metagenomics |
|---|---|---|
| Detection Approach | Targeted (primers required) | Untargeted (sequence all DNA) |
| Typical ARGs Detected | 100-122 [80] | 402 [80] |
| MGEs/Integrons Detected | 18 MGEs, 5 integrons [80] | 1,567 plasmids, 168 integrons [80] |
| Quantification Capability | Absolute quantification [81] | Semi-quantitative [81] |
| Sensitivity | Highly sensitive for low-abundance targets [81] | May miss low-abundance genes (<10 copies) [80] |
| Unknown Gene Detection | Limited to primer design | Comprehensive, including novel genes [80] |
| Throughput | High (384+ targets simultaneously) [79] | Variable (depth-dependent) |
| Cost per Sample | Lower | Higher |
Correlation and Concordance Between Methods
Multiple studies have investigated the correlation between HT-qPCR and SMS for resistome profiling. In wastewater surveillance, a strong correlation of relative ARG abundance was observed for most antibiotic classes, including aminoglycosides, multidrug-resistance (MDR) genes, macrolide-lincosamide-streptogramin B (MLSB), tetracyclines, and beta-lactams [79]. However, discrepancies arise from methodological limitations—HT-qPCR may yield false negatives due to primer-target site mutations, while SMS may miss ARGs with incomplete or low coverage due to bioinformatic filtering parameters [79].
In sediment analysis, HT-qPCR identified approximately 100 ARGs, primarily conferring resistance to beta-lactams, aminoglycosides, tetracyclines, and MLSB antibiotics, along with 5 integrons and 18 MGEs [80]. SMS analysis of the same samples detected a substantially broader resistome, identifying 402 ARGs, 1,567 plasmid sequences, and 168 integrons [80]. This demonstrates SMS's superior capacity for capturing the full genetic context of resistance determinants.
Experimental Protocols
HT-qPCR Resistome Profiling Protocol
Sample Preparation and DNA Extraction
- Sample Collection: Collect environmental samples (e.g., 0.25 g sediment or 1.6 L water filtered through 0.22 μm membrane) [80] [82]. For stressed bacteria cultures, pellet cells by centrifugation (5,000 × g, 15 min).
- DNA Extraction: Use commercial kits (e.g., Qiagen PowerSoil Kit or FastDNA SPIN Kit) following manufacturer protocols with modifications [80] [82]. Include bead-beating step for comprehensive cell lysis (10 min vortexing at maximum speed).
- Quality Assessment: Verify DNA quality via agarose gel electrophoresis (0.8% gel, 100 V/cm, 45 min) and quantify using fluorometric methods (e.g., Qubit HS dsDNA assay) [80]. Store DNA at -20°C until analysis.
SmartChip HT-qPCR Analysis
- Primer Panels: Utilize comprehensive primer sets covering major ARG classes (typically 296-384 primer sets) including aminoglycosides, beta-lactams, MLSB, tetracyclines, vancomycin, phenicol, trimethoprim, sulfonamide, and quinolone resistance genes, plus MGEs and 16S rRNA genes [80] [79] [82].
- Reaction Setup: Prepare 100 nL reactions containing 1× SmartChip Green Gene Expression Master Mix, 300 nM primers, and 2 ng/μL DNA template [80].
- Nanodispensing and Amplification: Use automated SmartChip Multisample Nanodispenser to load 5184-well chips. Perform PCR on SmartChip Real-Time PCR System with parameters: 10 min at 95°C; 40 cycles of 95°C for 30 s and 60°C for 30 s [80] [82].
- Quality Control: Set detection threshold at CT < 27 [79]. Monitor amplification efficiencies (80-110% with R² > 0.99) and perform melting curve analysis to verify specificity [85] [82]. Exclude reactions failing quality criteria.
Data Analysis
- Relative Quantification: Calculate normalized abundance using the 2^(-ΔCT) method: ΔCT = CT(target gene) - CT(16S rRNA gene) [79].
- Absolute Quantification: For absolute copy numbers, apply the formula: Relative gene copy number = 10^((31-CT)(10/3)) [82].
- Risk Assessment: Implement novel risk assessment models incorporating absolute abundance, detection frequency, horizontal gene transfer potential, and host pathogenicity [81].
Shotgun Metagenomic Sequencing Protocol
Library Preparation and Sequencing
- DNA Quality Control: Verify high-molecular-weight DNA integrity via pulse-field gel electrophoresis or Bioanalyzer. Ensure sufficient quantity (≥10 ng/μL for most applications).
- Library Preparation: Use Illumina-compatible kits (e.g., Nextera XT or TruSeq DNA PCR-Free) following manufacturer protocols. For low-biomass samples, consider whole-genome amplification [79].
- Sequencing: Perform high-throughput sequencing on Illumina platforms (NovaSeq preferred for depth). Target 5-10 Gb reads per sample depending on complexity [84]. Include negative controls to identify contamination.
Bioinformatic Analysis
- Quality Control and Preprocessing: Use FastQC for quality assessment. Remove low-quality reads, adapters, and host DNA (if applicable) with Trimmomatic or similar tools [86].
- Taxonomic Profiling: Employ Kraken2 or MetaPhlAn for taxonomic classification [86]. Estimate abundance with Bracken.
- ARG Identification: Align reads to Comprehensive Antibiotic Resistance Database (CARD) using Resistance Gene Identifier (RGI) or similar tools [79] [86]. Apply thresholds (≥90% identity, ≥90% coverage, ≥20× depth) for confident detection [86].
- Assembly and Binning: For complex samples, perform de novo assembly with metaSPAdes [86]. Bin contigs with MaxBin2 or similar tools to reconstruct genomes and link ARGs to specific taxa.
- Functional Analysis: Annotate genes via KEGG, COG, or custom databases to determine functional potential and virulence factors [83] [84].
Table 2: Essential research reagents and solutions for resistome profiling
| Reagent/Solution | Application | Function | Example Product |
|---|---|---|---|
| PowerSoil DNA Isolation Kit | DNA Extraction | Inhibitor removal for complex environmental samples | Qiagen PowerSoil Kit |
| SmartChip Green Master Mix | HT-qPCR | Nanoscale qPCR amplification | WaferGen SmartChip |
| ARG Primers (384-plex) | HT-qPCR | Simultaneous detection of ARGs, MGEs, taxonomic markers | Resistomap HT-qPCR Array |
| NovaSeq Reagent Kits | SMS | High-throughput sequencing | Illumina NovaSeq 6000 |
| CARD Database | Bioinformatics | Reference database for ARG annotation | Comprehensive Antibiotic Resistance Database |
| MetaSPAdes | Bioinformatics | De novo assembly of metagenomic sequences | metaSPAdes Assembler |
Method Selection Guidelines
Application-Specific Recommendations
- Routine Monitoring and Quantification: Choose HT-qPCR for large-scale surveillance studies requiring absolute quantification of predefined ARG targets, especially when tracking specific resistance determinants over time or assessing intervention effectiveness [81].
- Comprehensive Resistome Discovery: Employ SMS when exploring novel resistance mechanisms, characterizing complex genetic contexts, or investigating interactions between resistome, microbiome, and functional pathways [80] [84].
- Regulatory and Risk Assessment: Combine both approaches—using HT-qPCR for quantitative risk assessment of priority ARGs and SMS for contextual understanding of transfer potential and emerging threats [81].
- Stressed Bacteria Research: For cultured isolates under stress conditions, HT-qPCR enables high-throughput screening of response genes, while SMS provides mechanistic insights into adaptation and resistance development.
Integrated Approaches for Enhanced Insight
Increasing evidence supports complementary use of both methodologies [79]. HT-qPCR provides sensitive, quantitative data on established ARG targets, while SMS reveals the broader genetic context, including novel resistance mechanisms and host associations. This integrated approach is particularly valuable for "One Health" initiatives addressing AMR dissemination across environmental, animal, and human compartments [80] [81].
Diagram 1: Experimental workflow for comparative resistome profiling showing parallel methodological pathways and integrated analytical outcomes.
HT-qPCR and Shotgun Metagenomic Sequencing represent complementary pillars in modern resistome profiling, each with distinct advantages and limitations. HT-qPCR excels in sensitive, absolute quantification of predefined ARG targets, making it ideal for large-scale monitoring and risk assessment studies. SMS provides unparalleled comprehensive discovery capabilities, revealing novel resistance mechanisms and genetic contexts. For stressed bacteria research and drug development applications, strategic selection or integrated implementation of these methodologies should be guided by specific research questions, resources, and desired outcomes. As AMR continues to pose grave public health threats, robust resistome profiling remains essential for understanding resistance dynamics and developing effective interventions.
The identification and profiling of microbial communities through 16S ribosomal RNA (rRNA) gene sequencing has become a cornerstone of modern microbiology research. For studies focusing on stressed bacteria—often characterized by reduced metabolic activity and difficult cultivation—selecting the appropriate sequencing technology is paramount. The choice between high-accuracy short-read and lower-accuracy long-read platforms involves critical trade-offs between taxonomic resolution, error rate, throughput, and cost. This application note provides a structured comparison of the dominant sequencing platforms—Illumina and Oxford Nanopore Technologies (ONT)—evaluating their performance and cost-efficiency for 16S rDNA identification within the context of high-throughput culturing techniques for stressed bacteria research. We present standardized experimental protocols, benchmarking data, and a decision framework to guide researchers in selecting the optimal platform for their specific applications.
Platform Performance Comparison
The fundamental trade-off in 16S rRNA sequencing lies between read length and base-calling accuracy. Illumina platforms (e.g., NextSeq, MiSeq) provide short reads (~300 bp) targeting hypervariable regions (e.g., V3-V4) with very high accuracy (<0.1% error rate), enabling reliable genus-level classification but limited species-level resolution [87]. In contrast, Oxford Nanopore Technologies platforms (e.g., MinION) generate full-length 16S rRNA reads (~1,500 bp) with higher error rates (5-15%), facilitating superior species-level and sometimes strain-level identification despite the increased sequence error [87] [88].
Table 1: Technical Specifications of Major Sequencing Platforms for 16S rRNA Profiling
| Platform | Read Length | Target Region | Reported Error Rate | Key Taxonomic Strength |
|---|---|---|---|---|
| Illumina NextSeq/MiSeq | ~300 bp | V3-V4 (hypervariable) | < 0.1% [87] | Genus-level classification |
| Oxford Nanopore (ONT) | ~1,500 bp (Full-length) | Full-length 16S rRNA gene | 5-15% [87] | Species-level resolution |
| PacBio | Full-length | Full-length 16S rRNA gene | <0.1% (with CCS) [89] | Species-level resolution |
Recent advancements have substantially improved ONT accuracy. Newer flow cells (R10.4.1) and basecalling algorithms have increased base accuracy to over 99%, with some reports of Q-scores close to Q28 (99.84% accuracy) [89]. However, the long-read advantage of ONT and PacBio remains their most significant benefit: the ability to sequence the entire 16S rRNA gene provides greater phylogenetic resolution, which is crucial for distinguishing between closely related species of stressed bacteria that may respond differently to cultivation conditions [88].
Impact on Diversity Metrics and Taxonomic Profiling
The choice of platform systematically influences downstream ecological analyses. Studies comparing Illumina and ONT for profiling respiratory microbial communities found that while Illumina often captured greater species richness, community evenness was comparable between platforms [87]. Beta diversity differences were more pronounced in complex microbiomes (e.g., pig samples) than in simpler human samples, highlighting that the platform effect is microbiome-dependent [87].
Taxonomic biases are significant. ONT has been shown to overrepresent certain taxa (e.g., Enterococcus, Klebsiella) while underrepresenting others (e.g., Prevotella, Bacteroides) compared to Illumina [87]. These platform-specific biases necessitate careful interpretation of taxonomic profiles, especially in studies of stressed bacteria where minor populations may be functionally important.
Cost and Operational Considerations
Cost structures for 16S rDNA sequencing vary significantly based on scale, service provider, and included analyses.
Table 2: Cost Comparison for 16S rRNA Sequencing Services
| Service Component | Cost (USD) | Platform/Provider | Notes |
|---|---|---|---|
| 16S rRNA Amplicon Sequencing | $55 per sample | Forsyth Microbiome Core [90] | Includes standard analysis |
| Bioinformatics Analysis | $20 per sample | Forsyth Microbiome Core [90] | When combined with sequencing service |
| 16S V4 Amplicon Library Prep | $5.50 per sample | MSU Genomics Core [91] | Plus a plate fee of $207; for 24-380 samples |
| AVITI/Illumina Library Prep + 3 Gbp Sequencing | $76 per sample | MSU Genomics Core [91] | Bundled flat-rate pricing |
For core facilities and individual laboratories, the total cost of ownership must account for instrument acquisition, reagent costs, and personnel time. While ONT platforms offer lower initial instrument costs and rapid, real-time sequencing capabilities, their higher per-sample error rates may necessitate greater sequencing depth or replication to achieve robust results, potentially offsetting some cost advantages. Illumina platforms, with their higher throughput and established protocols, often provide lower per-sample costs for large-scale studies where species-level resolution is not critical.
Experimental Protocols for Platform Benchmarking
Standardized DNA Extraction and Quality Control
Principle: Consistent, high-quality DNA extraction is critical for reliable cross-platform comparisons, especially for stressed bacteria which may have compromised cell walls.
Reagents and Equipment:
- Lysis Buffer: Contains surfactants and proteinases for cell wall disruption.
- Inhibition Removal Solution: Eliminates PCR inhibitors common in complex samples.
- DNA Binding Beads: Magnetic beads for nucleic acid purification.
- Elution Buffer: Low-ionic-strength solution for DNA elution (e.g., TE buffer).
- Quantitation Tools: Fluorometer (e.g., Qubit) for accurate DNA concentration measurement.
- Quality Assessment: Agarose gel electrophoresis or TapeStation for DNA integrity check.
Procedure:
- Sample Preparation: Resuspend bacterial pellets or culture samples in lysis buffer.
- Cell Lysis: Incubate at elevated temperature (e.g., 65°C for 30 minutes) with periodic vortexing.
- Inhibitor Removal: Add inhibition removal solution, vortex, and centrifuge.
- DNA Binding: Transfer supernatant to fresh tube containing DNA binding beads, incubate at room temperature.
- Washing: Perform two wash steps with wash buffer, fully removing supernatant each time.
- Elution: Add elution buffer (30-50 µL), incubate at 65°C for 5 minutes, and collect DNA-containing supernatant.
- Quality Control: Quantify DNA using fluorometer and assess integrity by electrophoresis.
Library Preparation for Illumina Sequencing (V3-V4 Region)
Principle: Amplification of the V3-V4 hypervariable regions of the 16S rRNA gene using tailed primers compatible with Illumina sequencing chemistry.
Protocol (based on QIAseq 16S/ITS Region Panel):
- Primary Amplification:
- Prepare PCR mix: 5 ng genomic DNA, 2× HiFi PCR Master Mix, 16S V3-V4 primer mix.
- Cycling conditions: 95°C for 5 min; 20-25 cycles of 95°C for 30s, 60°C for 30s, 72°C for 30s; final extension at 72°C for 5 min [87].
- Indexing PCR:
- Use 2 µL of primary PCR product as template with QIAseq 16S/ITS Index barcodes.
- Cycling conditions: 95°C for 3 min; 10-12 cycles of 95°C for 20s, 60°C for 20s, 72°C for 30s; final extension at 72°C for 1 min.
- Library Clean-up and Normalization:
- Purify amplified libraries using magnetic beads.
- Quantify libraries by fluorometry and pool in equimolar ratios.
- Sequencing: Dilute pooled library to appropriate concentration and sequence on Illumina NextSeq or MiSeq platform with 2×300 bp paired-end chemistry.
Library Preparation for Oxford Nanopore Sequencing (Full-Length 16S)
Principle: Amplification of the full-length 16S rRNA gene using barcoded primers compatible with Nanopore sequencing.
Protocol (based on ONT 16S Barcoding Kit):
- PCR Amplification:
- Prepare PCR mix: 50 ng genomic DNA, LongAmp Taq 2X Master Mix, ONT barcoded primers (27F/1492R).
- Cycling conditions: 94°C for 30s; 30 cycles of 94°C for 30s, 55°C for 30s, 65°C for 30s; final extension at 65°C for 10 min [88].
- Library Clean-up:
- Purify amplicons using magnetic beads (e.g., KAPA HyperPure Beads).
- Quantify purified DNA by fluorometry.
- Library Pooling and Adapter Ligation:
- Pool barcoded libraries in equimolar ratios.
- Incubate pooled library with Rapid Adapter per manufacturer's instructions.
- Sequencing:
- Load library onto MinION flow cell (R10.4.1 recommended).
- Sequence using MinKNOW software for up to 72 hours or until pore exhaustion.
Bioinformatics Processing Workflows
The accuracy of final taxonomic assignments depends heavily on the bioinformatics pipeline used. Different algorithms show varying performance characteristics.
Table 3: Comparison of Bioinformatics Approaches for 16S rRNA Data
| Bioinformatic Approach | Method | Best For | Key Characteristics |
|---|---|---|---|
| DADA2 | Denoising (ASVs) | Illumina data [88] | High resolution, suffers from over-splitting |
| Deblur | Denoising (ASVs) | Illumina data | Similar to DADA2, slightly different error model |
| UNOISE3 | Denoising (ASVs) | Illumina and ONT data | Efficient OTU reduction |
| UPARSE | Clustering (OTUs) | Both platforms [92] | Lower errors, but more over-merging |
| EPI2ME | Workflow (ONT) | Nanopore data [87] | User-friendly, integrated with ONT ecosystem |
| Emu | Relative abundance | Nanopore data [89] | Designed for long-read abundance estimation |
Benchmarking studies using complex mock communities (235 strains, 197 species) have revealed that ASV algorithms like DADA2 produce consistent outputs but may over-split biological sequences into multiple variants, while OTU algorithms like UPARSE achieve clusters with lower errors but with more over-merging of distinct sequences [92]. The selection of reference database (SILVA, GTDB, NCBI, GreenGenes) also significantly impacts taxonomic assignments, sometimes more than the choice of sequencing technology itself [88].
The Scientist's Toolkit: Essential Research Reagents and Materials
Table 4: Key Research Reagent Solutions for 16S rRNA Sequencing
| Item | Function | Example Products/Providers |
|---|---|---|
| DNA Extraction Kit | Isolation of high-quality genomic DNA from microbial samples | Quick-DNA Fecal/Soil Microbe Microprep Kit (Zymo Research) [89] |
| 16S Amplification Primers | Target-specific amplification of 16S rRNA regions | 341F-805R (Illumina V3-V4); 27F-1492R (ONT full-length) [88] [93] |
| Library Preparation Kit | Preparation of sequencing libraries with platform-specific adapters | QIAseq 16S/ITS Region Panel (Illumina); 16S Barcoding Kit (ONT) [87] [88] |
| Quantitation Standards | Accurate nucleic acid concentration measurement | Qubit dsDNA HS Assay Kit (Thermo Fisher) [87] [89] |
| Positive Control | Monitoring amplification and sequencing efficiency | ZymoBIOMICS Microbial Community Standard (Zymo Research) [89] [88] |
| Bioinformatics Tools | Processing raw data into taxonomic assignments | DADA2, QIIME2, EPI2ME, Emu [87] [89] [88] |
Application to High-Throughput Culturing of Stressed Bacteria
Research on stressed bacteria presents unique challenges including low biomass, compromised cell integrity, and irregular growth patterns. The integration of high-throughput culturing technologies—such as droplet microfluidics that encapsulate single cells in picoliter-sized droplets—with appropriate sequencing platforms enables comprehensive analysis of these difficult-to-culture organisms [94]. This approach provides individual microenvironments without nutrient competition, facilitating the growth of a wider range of microorganisms including rare and slow-growing species [94].
For screening diverse cultures from such systems, ONT's real-time sequencing capability offers a significant operational advantage, allowing rapid identification of isolates without waiting for full sequencing runs. However, for definitive taxonomic characterization of key isolates, especially at the species level, the full-length 16S sequencing provided by ONT or PacBio is superior [87] [93]. For large-scale diversity assessments of multiple culture conditions, Illumina's higher throughput and lower cost per sample may be more practical, despite its lower taxonomic resolution.
The benchmarking data presented herein demonstrates that platform selection between Illumina and Oxford Nanopore Technologies for 16S rDNA identification involves balancing multiple factors: taxonomic resolution requirements, error tolerance, throughput needs, and budget constraints. For high-throughput culturing studies of stressed bacteria, we recommend a hybrid approach: using ONT for rapid screening and species-level identification of key isolates, complemented by Illumina for large-scale diversity assessments across multiple culture conditions. As both technologies continue to evolve—with Illumina developing longer read lengths and ONT improving accuracy—this benchmarking framework provides researchers with a foundation for making informed decisions that align with their specific research objectives and experimental constraints.
Correlating Biomaterial Properties with Immune Cell Activation for Vaccine and Tissue Engineering
Application Note: High-Throughput Screening of Biomaterial-Immune Cell Interactions
The strategic design of biomaterials to direct immune cell activation is pivotal for advancing both vaccine development and regenerative medicine. This application note details a high-throughput methodology for correlating key biomaterial properties—such as chemical composition, stiffness, and topography—with specific immune cell responses, including macrophage polarization and T-cell activation. By integrating high-throughput culturing techniques, this platform enables the rapid screening of biomaterial libraries under controlled, reproducible conditions, facilitating the identification of lead candidates that elicit desired immunomodulatory outcomes [95] [96].
Key Biomaterial Classes and Their Immunomodulatory Functions
Biomaterial scaffolds provide a three-dimensional microenvironment that can be tuned to manipulate immune cell behavior. The table below summarizes major biomaterial categories used in immune engineering.
Table 1: Key Biomaterial Classes for Immune Cell Modulation
| Material Class | Specific Examples | Key Properties | Relevant Immune Applications |
|---|---|---|---|
| Natural Proteins | Silk fibroin, Collagen, Gelatin [95] | High biocompatibility, inherent cell-adhesion motifs, biodegradable | Tissue regeneration scaffolds, drug delivery systems [95] |
| Polysaccharides | Chitosan, Sodium alginate, Hyaluronic acid [95] [96] | Often injectable, can form hydrogels, mucoadhesive | Immunoprotective cell encapsulation, wound healing [95] |
| Synthetic Polymers | Polyethylene glycol (PEG), Polylactic acid (PLA), Polycaprolactone (PCL) [95] | Tunable mechanical properties, controlled degradation, high porosity | 3D-printed scaffolds, core-shell encapsulation structures [95] |
| Smart Biomaterials | pH- or enzyme-responsive polymers (e.g., PNIPAM) [96] | Dynamic responsiveness to microenvironmental cues (pH, enzymes) | Targeted drug release in inflamed or tumor tissues [96] |
Quantitative Correlations: Biomaterial Properties and Immune Outcomes
Systematic analysis of biomaterial properties against immune cell responses yields quantitative data essential for rational design. The following table consolidates key parameters and their measurable impacts.
Table 2: Correlating Biomaterial Properties with Immune Cell Activation Metrics
| Biomaterial Property | Measurement Technique | Immune Cell Response | Quantifiable Readout |
|---|---|---|---|
| Stiffness (Elastic Modulus) | Atomic Force Microscopy (AFM) | Macrophage Polarization | Ratio of M2 (CD206+) to M1 (iNOS+) cells [96] |
| Surface Chemistry | X-ray Photoelectron Spectroscopy (XPS) | Dendritic Cell Maturation | Expression levels of CD80, CD86, MHC-II (Mean Fluorescence Intensity) [97] |
| Porosity & Pore Size | Scanning Electron Microscopy (SEM) | T Cell Infiltration & Proliferation | Cell count in scaffold, CFSE dilution assay [95] |
| Degradation Rate | Mass Loss Measurement | Sustained Cytokine Release | Cytokine concentration (e.g., IL-2, IFN-γ) via ELISA over time [95] |
Protocol: High-Throughput Biomaterial Screening for Macrophage Polarization
Scope
This protocol provides a detailed methodology for fabricating a biomaterial library with varying stiffness and chemically functionalizing it in a 96-well format. It further describes the process for seeding macrophages, stimulating them, and quantitatively analyzing their polarization states using high-content imaging and flow cytometry, creating a pipeline suitable for screening under diverse cultural conditions [96] [2].
Materials and Reagents
Table 3: Research Reagent Solutions for High-Throughput Screening
| Item | Function/Description | Example Supplier/Catalog Number |
|---|---|---|
| Polyethylene Glycol (PEG)-based Hydrogel Kit | Base material for creating a library of substrates with tunable mechanical stiffness. | Sigma-Aldrich, PEGDA (MW 3400) |
| Arginine-Glycine-Aspartic Acid (RGD) Peptide | Chemically conjugated to hydrogel surfaces to promote integrin-mediated cell adhesion. | Tocris Bioscience, #3490 |
| Lipopolysaccharide (LPS) / Interleukin-4 (IL-4) | Used for in-vitro polarization of macrophages towards M1 (LPS) and M2 (IL-4) phenotypes. | Miltenyi Biotec, LPS; PeproTech, IL-4 |
| Anti-CD86 (APC) & Anti-CD206 (FITC) Antibodies | Cell surface markers for identifying M1 and M2 macrophages via flow cytometry. | BioLegend, #105812 (CD86), #141704 (CD206) |
| Cell Viability Stain (e.g., Calcein AM) | Fluorescent live-cell stain for high-content imaging and viability assessment. | Thermo Fisher Scientific, C3099 |
| High-Throughput Liquid Handler | Automated platform for consistent dispensing of cells, reagents, and biomaterials in multi-well plates. | Tecan Freedom EVO [2] |
Experimental Workflow
The following diagram outlines the comprehensive experimental pipeline from biomaterial preparation to data analysis.
Step-by-Step Procedure
Part A: Fabrication of Biomaterial Library in 96-Well Format
- Polymer Solution Preparation: Prepare a stock solution of 20% (w/v) PEG-DA in sterile PBS. For stiffness variation, prepare crosslinker solutions at different molar ratios as per manufacturer's instructions.
- Automated Dispensing: Using a high-throughput liquid handler, dispense 50 µL of each polymer-crosslinker combination into the wells of a black-walled, clear-bottom 96-well plate. Include replicates for each condition [2].
- UV Photopolymerization: Expose the plate to UV light (365 nm, 5-10 mW/cm²) for 5 minutes to crosslink the hydrogels.
- Surface Functionalization: Wash the polymerized hydrogels twice with PBS. Incubate with a 0.5 mM RGD peptide solution in PBS for 1 hour at 37°C to promote cell adhesion.
- Equilibration: Before cell seeding, equilibrate the functionalized hydrogels in complete cell culture medium for at least 2 hours.
Part B: Macrophage Culture, Stimulation, and Staining
- Cell Seeding: Harvest and count THP-1 derived macrophages or primary macrophages. Use the liquid handler to seed cells uniformly at a density of 50,000 cells per well in 100 µL of complete medium.
- Application of Stressors: To model a stressed microenvironment, add desired chemical or biological stressors to the culture medium at this stage, drawing from high-throughput culturing techniques for stressed bacteria [6] [2].
- Macrophage Polarization: After 24 hours, stimulate the cells to induce polarization.
- For M1 polarization: Add 100 ng/mL LPS.
- For M2 polarization: Add 20 ng/mL IL-4.
- Include an unstimulated control.
- High-Content Imaging (After 48 hours stimulation):
- Add Calcein AM viability dye (1 µM final concentration) and incubate for 30 minutes.
- Image using a high-content imaging system to capture cell morphology, adhesion, and viability.
- Cell Harvest and Staining for Flow Cytometry:
- Carefully aspirate the medium and wash the wells with PBS.
- Use a non-enzymatic cell dissociation buffer to gently detach cells. Transfer cells to a V-bottom 96-well plate.
- Centrifuge at 300 x g for 5 minutes and block with Fc receptor block for 10 minutes.
- Stain with anti-human CD86-APC and CD206-FITC antibodies for 30 minutes in the dark at 4°C.
- Wash twice with FACS buffer and resuspend in fixative solution.
- Flow Cytometry Acquisition: Acquire data on a flow cytometer equipped with a high-throughput sampler. Collect a minimum of 10,000 events per sample.
Data Analysis and Interpretation
- Flow Cytometry Gating: Identify the live cell population based on forward and side scatter. Within this population, create a dot plot of CD206 (M2) vs. CD86 (M1). Set quadrants based on isotype controls.
- Polarization Index Calculation: Calculate the percentage of cells in the M1 (CD86+ CD206-) and M2 (CD86- CD206+) quadrants. The M2/M1 ratio can be used as a primary metric for pro-regenerative potential.
- Correlation with Material Properties: Plot the M2/M1 ratio against the measured elastic modulus (stiffness) of each biomaterial formulation to establish a quantitative correlation.
Signaling Pathways in Biomaterial-Mediated Immune Modulation
Biomaterials influence immune cell fate by engaging specific receptor-mediated signaling pathways. The diagram below illustrates key pathways involved in macrophage polarization driven by biomaterial properties.
High-throughput (HT) culturing techniques have moved beyond simple automation to become sophisticated platforms that integrate robotics, imaging, and machine learning. These systems are fundamentally changing our approach to microbial culturomics, enabling the systematic construction of comprehensive biobanks and functional characterization of bacterial strains. For researchers investigating stressed bacteria—whether exposed to chemical pollutants, extreme environments, or clinical treatments—precisely defining success metrics is crucial for evaluating platform performance and biological insights. This application note establishes a standardized framework for quantifying three fundamental metrics in HT bacterial culturing: isolation throughput, diversity captured, and functional yield, with particular emphasis on their application in stress response research.
Quantitative Metrics for HT Culturing Platforms
Core Performance Metrics
Table 1: Key Performance Metrics for High-Throughput Culturing Platforms
| Metric Category | Specific Metric | Reported Values | Platform/Context |
|---|---|---|---|
| Isolation Throughput | Colonies picked/hour | 2,000 colonies/hour | CAMII Robotic Platform [4] |
| Colonies picked/run | 12,000 colonies/run | CAMII Robotic Platform [4] | |
| Samples processed/day (PCR) | 2,500 samples/day | Liquid Handler Platform [2] | |
| Diversity Captured | Genera cultivated vs. detected | 70-77.78% (Genera level) | Enhanced Cultivation [98] |
| Species cultivated vs. detected | 42.86% (Species level) | Enhanced Cultivation [98] | |
| Isolates needed for 30 unique ASVs | 85 (Smart Picking) vs. 410 (Random) | CAMII Platform [4] | |
| Novel species identified | 27.5% in activated sludge | Single-Cell Sequencing [99] | |
| Functional Yield | Growth conditions tested | 51 unique conditions | Enhanced Cultivation [98] |
| Isolates screened for GABA production | 1,740 isolates | Fluorescence Biosensor Screening [2] | |
| GABA-producing hits identified | 46 high producers | Functional Screening [2] | |
| Higher-order interactions in complex mixtures | 16% of two-way mixtures | Chemical Stressor Response [6] |
Interpretation of Metrics
The metrics in Table 1 demonstrate significant advances in HT culturing capabilities. The isolation throughput of modern platforms enables processing scales that were previously impractical with manual methods [4]. The diversity captured metrics reveal that systematic cultivation strategies can access a substantial proportion of microbial communities, including previously uncultivated taxa [98] [99]. Functional yield metrics highlight the importance of downstream applications, from identifying bacteria with specific metabolic capabilities [2] to quantifying ecological interactions under stress conditions [6].
Protocols for Metric Assessment
Protocol 1: HT Culturing and Diversity Assessment
Table 2: Essential Research Reagent Solutions for HT Culturing
| Reagent Category | Specific Examples | Function in Protocol |
|---|---|---|
| Growth Media | mGAM plates; M9 minimal medium; 51 unique growth conditions [98] | Expands cultivable diversity by providing varied nutritional and physical environments |
| Antibiotic Supplements | Ciprofloxacin, Trimethoprim, Vancomycin [4] | Selects for distinct microbial subsets; enriches rare taxa |
| Buffers and Solutions | Phosphate-buffered saline (PBS) [100] | Provides stable ionic environment for drug degradation assays |
| Molecular Biology Reagents | Double-ended barcoded PCR primers; Nanopore sequencing kits [2] | Enables cost-effective, high-throughput species identification |
Experimental Workflow:
Sample Preparation: Homogenize environmental samples (e.g., soil, water, fecal matter) in appropriate dilution buffer. For stress studies, consider pre-exposure to sub-lethal stress conditions to enrich for resilient populations.
Plating and Incubation: Distribute samples across diverse media formulations (Table 2) using automated spiral platers or liquid handlers. Incubate under appropriate atmospheric conditions (aerobic, anaerobic, microaerophilic) with precise control of temperature and humidity [4] [98].
Automated Imaging and Analysis: Capture high-resolution images of colony growth at regular intervals (e.g., 24h, 48h, 72h). Use systems like CAMII to quantify morphological features including:
- Size metrics: area, perimeter, mean radius
- Shape metrics: circularity, convexity, inertia
- Color metrics: pixel intensities in RGB channels [4]
Machine Learning-Guided Picking: Apply smart picking algorithms that select colonies based on maximal morphological dissimilarity in multidimensional feature space to maximize phylogenetic diversity [4].
Taxonomic Identification: Amplify full-length 16S rDNA using optimized PCR protocols with double-ended barcodes. Pool amplicons and sequence using cost-effective platforms (e.g., Nanopore). Classify isolates to species level using customized bioinformatics pipelines [2].
Metric Calculation:
- Isolation Throughput: Record colonies picked per unit time.
- Diversity Captured: Calculate cultivation efficiency as (number of genera or species cultured / number detected by metagenomics) × 100 [98].
- Diversity Gain: Plot cumulative unique ASVs versus number of isolates picked, comparing smart picking to random selection [4].
Protocol 2: Functional Screening for Stress Responses
Experimental Workflow:
Chemical Stressor Preparation: Prepare stock solutions of relevant chemical stressors (antibiotics, herbicides, pesticides, chemotherapeutics). For gemcitabine degradation assessment, use 25 mg/mL stock in water [100].
Monoculture vs. Co-culture Setup: Inoculate both single strains and defined co-cultures in multi-well plates. For chemical stress experiments, expose cultures to all possible combinations of stressors (e.g., 255 combinations of 8 chemicals) [6].
Growth Monitoring: Measure optical density at regular intervals to calculate Area Under the Curve (AUC) as a growth metric. Compare growth under stress conditions to control conditions (G = AUCstress/AUCcontrol) [6].
Functional Assays:
- Drug Degradation: Incubate test strains with target drug (e.g., gemcitabine) in PBS. Remove samples at set intervals, filter to remove bacteria, and add filtered supernatant to growth media containing a highly sensitive reporter strain. Monitor reporter growth as a proxy for residual drug concentration [100].
- Metabolite Production: For products like GABA, employ dual-plasmid biosensor systems with sensor and reporter plasmids. Use fluorescence output to quantify production levels across thousands of isolates [2].
Interaction Analysis: For multi-stressor experiments, calculate net interactions and emergent higher-order interactions using multiplicative null models. Significance testing via bootstrapping identifies synergistic or antagonistic interactions [6].
Metric Calculation:
- Functional Yield: Calculate as (number of functionally active isolates / total isolates screened) × 100.
- Stress Resilience: Quantify as relative growth (G) in stress versus control conditions.
- Interaction Prevalence: Determine percentage of chemical mixtures showing significant interactive effects [6].
Application to Stressed Bacteria Research
In stress response studies, these metrics enable systematic evaluation of how microbial communities adapt to challenging conditions. Research on bacterial responses to complex chemical pollutant mixtures demonstrates that increasingly complex mixtures are more likely to negatively impact bacterial growth in monoculture and reveal net interactive effects [6]. Interestingly, mixed co-cultures prove more resilient to complex mixtures and show fewer interactions in growth response, highlighting the importance of community context in stress resilience [6].
For stressed bacteria, functional yield extends beyond growth metrics to include specific stress response mechanisms like antibiotic resistance gene expression [101], drug degradation capabilities [100], and production of protective metabolites [2]. The isolation of "cultured but not sequenced" (CBNS) taxa [98] underscores that cultivation remains essential for discovering novel functions, even from well-studied environments.
The standardized metrics and protocols presented here provide a framework for quantitatively evaluating HT culturing platforms, particularly for stress response research. Isolation throughput, diversity captured, and functional yield collectively offer a comprehensive view of platform performance and biological discovery potential. As these technologies continue to evolve—with improvements in machine learning algorithms, single-cell sequencing, and biosensor design—these metrics will enable objective comparison across platforms and studies, ultimately accelerating our understanding of bacterial responses to stress and facilitating drug development efforts.
Conclusion
The integration of automation, microfluidics, and artificial intelligence is fundamentally transforming high-throughput culturing for stressed bacteria. These technologies enable researchers to move beyond traditional, low-throughput methods, allowing for the systematic deconstruction of complex stress microenvironments and the isolation of previously unculturable or rare strains. The synergy between AI-guided phenotypic selection and rapid genotypic validation creates a powerful discovery pipeline, essential for advancing fields from personalized medicine and drug discovery to environmental bioremediation. Future progress hinges on the continued refinement of integrated platforms that combine dynamic single-cell monitoring with automated biobanking and multi-omics analysis. This will not only deepen our understanding of bacterial stress responses but also unlock a vast reservoir of novel bacteria with unique functional properties for clinical and industrial applications.
References
- 1. Chronic stress in mice: how gut bacteria influence gene ... [https://www.nature.com/articles/s41398-025-03479-0]
- 2. High throughput construction of species characterized ... [https://www.frontiersin.org/journals/microbiology/articles/10.3389/fmicb.2025.1545877/full]
- 3. Social stress changes gut microbiome composition in male ... [https://www.sciencedirect.com/science/article/pii/S2666354625001966]
- 4. High-throughput microbial culturomics using automation ... [https://www.nature.com/articles/s41587-023-01674-2]
- 5. High-Throughput Co-Culture Assays for the Investigation of ... [https://pmc.ncbi.nlm.nih.gov/articles/PMC7380114/]
- 6. High-throughput characterization of bacterial responses to ... [https://www.nature.com/articles/s41564-024-01626-9]
- 7. Label-free, rapid and quantitative phenotyping of stress ... [https://www.nature.com/articles/srep34359]
- 8. how 3D culture microenvironments alter cellular cues - PMC [https://pmc.ncbi.nlm.nih.gov/articles/PMC3434846/]
- 9. The Role of Microenvironmental Cues and Mechanical ... [https://pmc.ncbi.nlm.nih.gov/articles/PMC7874074/]
- 10. Current developments in modelling the tumour ... [https://www.sciencedirect.com/science/article/pii/S2666102021000070]
- 11. Quantitative Analysis of Population Heterogeneity of the ... [https://pmc.ncbi.nlm.nih.gov/articles/PMC1951020/]
- 12. Advances in high throughput cell culture technologies for ... [https://pmc.ncbi.nlm.nih.gov/articles/PMC11135158/]
- 13. Antibiotic Resistance via Bacterial Cell Shape-Shifting - PMC [https://pmc.ncbi.nlm.nih.gov/articles/PMC9239207/]
- 14. Stress-induced metabolic exchanges between ... [https://www.nature.com/articles/s41467-023-38913-8]
- 15. Quantitative High-Throughput Screening Methods Designed ... [https://pmc.ncbi.nlm.nih.gov/articles/PMC9045326/]
- 16. High Throughput Screening (HTS) Services [https://www.evotec.com/solutions/drug-discovery-preclinical-development/discovery/hit-identification-services/high-throughput-screening-hts-services]
- 17. High-Throughput Screening of Natural Product and Synthetic ... [https://pmc.ncbi.nlm.nih.gov/articles/PMC10220967/]
- 18. High-throughput anaerobic screening for identifying ... [https://www.nature.com/articles/s41596-023-00926-4]
- 19. A high-throughput protocol for measuring solution pH of ... [https://pubmed.ncbi.nlm.nih.gov/37682718/]
- 20. Less is more: reducing the reliance on animal models for ... [https://pmc.ncbi.nlm.nih.gov/articles/PMC2737645/]
- 21. Replacing animals in science: A strategy to support the ... [https://www.gov.uk/government/publications/replacing-animals-in-science-strategy/replacing-animals-in-science-a-strategy-to-support-the-development-validation-and-uptake-of-alternative-methods]
- 22. Screening and Identification of Cadmium-Tolerant, Plant ... [https://pmc.ncbi.nlm.nih.gov/articles/PMC12348804/]
- 23. Endophytic bacterium Sphingomonas sp. SaMR12 ... [https://link.springer.com/article/10.1007/s11783-025-2067-7]
- 24. High-throughput microbial culturomics using automation and ... [https://pmc.ncbi.nlm.nih.gov/articles/PMC10567565/]
- 25. CAMII strain biobank [http://microbial-culturomics.com/]
- 26. Cultivation strategies for growth of uncultivated bacteria [https://pmc.ncbi.nlm.nih.gov/articles/PMC5382963/]
- 27. Microfluidics applications for high-throughput single cell ... [https://pmc.ncbi.nlm.nih.gov/articles/PMC8507141/]
- 28. AI-powered high-throughput digital colony picker platform ... [https://www.nature.com/articles/s41467-025-63929-7]
- 29. DCP Digital Colony Picker [https://www.ecytebio.com/product/info/8]
- 30. Smarter cell sorting: droplet microfluidics meets pick-and ... [https://pubs.rsc.org/en/content/articlehtml/2025/lc/d5lc00550g]
- 31. Digital PCR: from early developments to its future application ... [https://pubs.rsc.org/en/content/articlehtml/2025/lc/d5lc00055f]
- 32. Co-selection for antibiotic resistance by environmental ... [https://www.nature.com/articles/s44259-024-00026-7]
- 33. Unravelling the mechanisms of antibiotic and heavy metal ... [https://pmc.ncbi.nlm.nih.gov/articles/PMC11253441/]
- 34. Mechanistic Role of Heavy Metals in Driving Antimicrobial ... [https://www.mdpi.com/2673-8007/5/3/79]
- 35. Enrichment, Isolation and Characterization of Heavy Metal ... [https://pmc.ncbi.nlm.nih.gov/articles/PMC11858113/]
- 36. The Interactions Between Antibiotic Resistance Genes and ... [https://www.frontiersin.org/journals/chemistry/articles/10.3389/fchem.2021.691565/full]
- 37. Antibiotic and Heavy Metal Co-Resistant Strain Isolated ... [https://www.mdpi.com/2079-6382/12/9/1379]
- 38. Stress-Based High-Throughput Screening Assays to Identify ... [https://pmc.ncbi.nlm.nih.gov/articles/PMC7698014/]
- 39. Co-occurrence of heavy metals and antibiotics resistance in ... [https://pmc.ncbi.nlm.nih.gov/articles/PMC10834071/]
- 40. of species characterized High ... throughput construction bacterial [https://pmc.ncbi.nlm.nih.gov/articles/PMC11984947/]
- 41. demonstration with GABA-producing bacteria [https://pubmed.ncbi.nlm.nih.gov/40212379/]
- 42. A flexible high-throughput cultivation protocol to assess the ... [https://pmc.ncbi.nlm.nih.gov/articles/PMC10982853/]
- 43. analysis of genomic sequences facilitates... Automated [https://www.nature.com/articles/s43705-021-00017-z?error=cookies_not_supported]
- 44. Biobanking | SPT Labtech Automated [https://www.sptlabtech.com/applications/sample-management/automated-biobanking]
- 45. Endophytic Bacteria Improve Bio- and Phytoremediation of ... [https://pmc.ncbi.nlm.nih.gov/articles/PMC11597072/]
- 46. Phytoremediation: plant–endophyte partnerships take the ... [https://www.sciencedirect.com/science/article/abs/pii/S0958166909000238]
- 47. Trends in Harnessing Plant Endophytic Microbiome for ... [https://pmc.ncbi.nlm.nih.gov/articles/PMC10097340/]
- 48. Endophytic bacteria and their potential to enhance heavy ... [https://www.sciencedirect.com/science/article/abs/pii/S0045653509007553]
- 49. Synthetic communities derived from the core endophytic ... [https://microbiomejournal.biomedcentral.com/articles/10.1186/s40168-024-01959-x]
- 50. Microbial Contributions to Heavy Metal Phytoremediation ... [https://www.mdpi.com/2076-2607/12/10/1945]
- 51. Response of Plant Endophyte Communities to Heavy Metal ... [https://www.mdpi.com/2223-7747/13/19/2755]
- 52. Endophytes unleashed: natural allies for heavy metal ... [https://link.springer.com/article/10.1007/s44372-025-00137-z]
- 53. Screening of GABA-Producing Lactic Acid Bacteria from Thai ... [https://pmc.ncbi.nlm.nih.gov/articles/PMC7823765/]
- 54. Development of a workflow for the selection, identification ... [https://www.nature.com/articles/s41598-023-40808-z]
- 55. Bacterial Stress Responses as Potential Targets in ... [https://pmc.ncbi.nlm.nih.gov/articles/PMC9322497/]
- 56. Exploring Bacterial Interactions Under the Stress Gradient ... [https://pmc.ncbi.nlm.nih.gov/articles/PMC12413402/]
- 57. 用于组装和使用微型生物反应器阵列(MBRA) 的更新协议 [https://www.jove.com/cn/t/68788/updated-protocol-for-assembly-use-minibioreactor-array]
- 58. Research on the application of a high-throughput fully ... [https://pmc.ncbi.nlm.nih.gov/articles/PMC12548153/]
- 59. A High-Throughput and Uniform Amplification Method ... [https://pmc.ncbi.nlm.nih.gov/articles/PMC9607487/]
- 60. Quantitative high-throughput population dynamics in ... [https://www.nature.com/articles/srep33173]
- 61. Rapid and cost-effective identification of microorganisms ... [https://pmc.ncbi.nlm.nih.gov/articles/PMC12102807/]
- 62. Early detection and classification of live bacteria using time ... [https://www.nature.com/articles/s41377-020-00358-9]
- 63. High-throughput single-cell whole-genome amplification ... [https://www.nature.com/articles/s42003-019-0401-y]
- 64. AI-powered high-throughput digital colony picker platform ... [https://pmc.ncbi.nlm.nih.gov/articles/PMC12514280/]
- 65. Droplet-Based Microfluidics in Single-Bacterium Analysis [https://www.mdpi.com/2079-6374/15/8/535]
- 66. Merging multi-omics with proteome integral solubility ... [https://pmc.ncbi.nlm.nih.gov/articles/PMC11434622/]
- 67. A Novel Single-Layer Microfluidic Device for Dynamic ... [https://pmc.ncbi.nlm.nih.gov/articles/PMC12293461/]
- 68. Acoustofluidics: Cutting-Edge Techniques for Particle ... [https://elveflow.com/microfluidic-reviews/acoustofluidics-cutting-edge-techniques-for-microfluidic-particle-manipulation/]
- 69. Cell Isolation Methods 2025: Single-Cell Technologies Guide [https://semionics.com/cell-isolation-methods-2025-guide/]
- 70. BBQ methods: Streamlined workflows for Bacterial Burden ... [https://pmc.ncbi.nlm.nih.gov/articles/PMC10592879/]
- 71. Microbial Growth Protocols [https://www.sigmaaldrich.com/US/en/technical-documents/protocol/cell-culture-and-cell-culture-analysis/microbial-cell-culture/microbial-growth?srsltid=AfmBOoo01cp4H-59IEE3g-hdm5RgN6k_lXmIJZx0QGLqjotLWfaRuMWS]
- 72. Functional phenotyping of genomic variants using joint ... [https://www.nature.com/articles/s41592-025-02805-0]
- 73. Mapping information-rich genotype-phenotype landscapes ... [https://pmc.ncbi.nlm.nih.gov/articles/PMC9380471/]
- 74. Refining the resolution of the yeast genotype-phenotype ... [https://elifesciences.org/reviewed-preprints/93906v1/pdf]
- 75. Optimization of the fermentation culture conditions ... [https://www.frontiersin.org/journals/microbiology/articles/10.3389/fmicb.2025.1552645/full]
- 76. Optimization of Culture Conditions for Bacteriocin ... [https://www.mdpi.com/2311-5637/11/8/470]
- 77. From bench to bytes: a practical guide to RNA sequencing ... [https://www.frontiersin.org/journals/genetics/articles/10.3389/fgene.2025.1697922/full]
- 78. Applying 3D cultures and high-throughput technologies to ... [https://www.frontiersin.org/journals/immunology/articles/10.3389/fimmu.2025.1488699/full]
- 79. Comparison of qPCR and metagenomic sequencing methods ... [https://pmc.ncbi.nlm.nih.gov/articles/PMC10997137/]
- 80. A Comparative Assessment of High-Throughput ... [https://www.mdpi.com/2076-3417/13/20/11229]
- 81. Quantitative comparison of HT-qPCR/16S rRNA ... [https://www.sciencedirect.com/science/article/abs/pii/S0304389425028237]
- 82. High-throughput profiling of antibiotic resistance genes in ... [https://www.nature.com/articles/s41598-024-68699-8]
- 83. Shotgun Metagenomics Reveals Antibiotic Resistome ... [https://www.frontiersin.org/journals/microbiology/articles/10.3389/fmicb.2025.1626799/full]
- 84. High-Throughput Shotgun Metagenomics of Microbial ... [https://pmc.ncbi.nlm.nih.gov/articles/PMC11685326/]
- 85. MRG Chip: A High-Throughput qPCR-Based Tool for ... [https://pubmed.ncbi.nlm.nih.gov/35876052/]
- 86. Shotgun-metagenomics based prediction of antibiotic ... [https://www.nature.com/articles/s41598-021-00383-7]
- 87. Comparative analysis of illumina and oxford nanopore ... [https://www.nature.com/articles/s41598-025-18768-3]
- 88. Benchmarking 16S rRNA Gene-Based Approaches to ... [https://pmc.ncbi.nlm.nih.gov/articles/PMC12367389/]
- 89. Comparative evaluation of sequencing platforms [https://pmc.ncbi.nlm.nih.gov/articles/PMC12365774/]
- 90. Pricing - Forsyth Microbiome Core [https://microbiome.forsyth.org/pricing.php]
- 91. Pricing - rtsf@msu.edu [https://rtsf.natsci.msu.edu/genomics/pricing.aspx]
- 92. Unlocking Reliable 16S rRNA Analysis: A Benchmarking Gold ... [https://communities.springernature.com/posts/unlocking-reliable-16s-rrna-analysis-a-benchmarking-gold-standard-ground-truth]
- 93. Comparative analysis of full-length 16s ribosomal RNA ... [https://www.frontiersin.org/journals/cellular-and-infection-microbiology/articles/10.3389/fcimb.2025.1658615/full]
- 94. A droplet microfluidic strategy for cultivation, investigation, and ... [https://pmc.ncbi.nlm.nih.gov/articles/PMC12366301/]
- 95. Cell encapsulated biomaterials for translational medicine - PMC [https://pmc.ncbi.nlm.nih.gov/articles/PMC12596701/]
- 96. Smart biomaterials: as active immune modulators to shape ... [https://www.frontiersin.org/journals/cell-and-developmental-biology/articles/10.3389/fcell.2025.1669399/full]
- 97. Biomaterial-driven 3D scaffolds for immune cell expansion ... [https://www.sciencedirect.com/science/article/pii/S1742706125003514]
- 98. Enhanced bacterial cultivation supports the identification ... [https://www.sciencedirect.com/science/article/abs/pii/S2212429225006649]
- 99. High-throughput single-cell sequencing of activated sludge ... [https://www.sciencedirect.com/science/article/pii/S2666498424001078]
- 100. Functional Assay for Measuring Bacterial Degradation of ... [https://en.bio-protocol.org/en/bpdetail?id=4797&type=0]
- 101. High-throughput sequencing for the study of bacterial ... [https://pmc.ncbi.nlm.nih.gov/articles/PMC4150483/]