MALDI-TOF MS Battle for the Lab: A Head-to-Head Workflow Comparison of Bruker vs. Zybio Systems
This article provides a comprehensive, up-to-date comparison of the end-to-end workflows for Bruker and Zybio MALDI-TOF MS systems in modern laboratories.
MALDI-TOF MS Battle for the Lab: A Head-to-Head Workflow Comparison of Bruker vs. Zybio Systems
Abstract
This article provides a comprehensive, up-to-date comparison of the end-to-end workflows for Bruker and Zybio MALDI-TOF MS systems in modern laboratories. Targeting researchers and diagnostic professionals, it explores the fundamental principles, direct methodological applications, common troubleshooting scenarios, and a critical validation-based comparison of performance, cost, and integration. The analysis aims to deliver actionable insights for laboratories selecting, optimizing, or validating their microbial identification and proteomics platforms.
MALDI-TOF MS Decoded: Core Principles and Market Leaders Bruker & Zybio Explained
What is MALDI-TOF MS? A Primer on the 'Soft Ionization' Revolution in Biomolecular Analysis.
Matrix-Assisted Laser Desorption/Ionization Time-of-Flight Mass Spectrometry (MALDI-TOF MS) is an analytical technique that enables the sensitive detection and accurate mass measurement of large, non-volatile biomolecules such as proteins, peptides, and oligonucleotides. By employing a "soft ionization" process, it minimizes analyte fragmentation, allowing for the intact analysis of complex biological samples. This primer details its fundamental principles, situating the technology within the context of contemporary workflow comparisons in clinical and research laboratories, such as studies comparing Bruker and Zybio platforms.
MALDI-TOF MS revolutionized biomolecular analysis in the late 1980s. Its core innovation lies in the use of a light-absorbing matrix that co-crystallizes with the analyte. Upon irradiation by a pulsed UV laser (e.g., N₂ laser at 337 nm), the matrix absorbs energy and facilitates the transfer of protons to the analyte, generating predominantly singly charged ions ([M+H]⁺ or [M-H]⁻). These ions are accelerated by an electric field into a field-free time-of-flight (TOF) drift tube. Their mass-to-charge ratio (m/z) is determined by measuring their time of flight: lighter ions travel faster and reach the detector sooner than heavier ones.
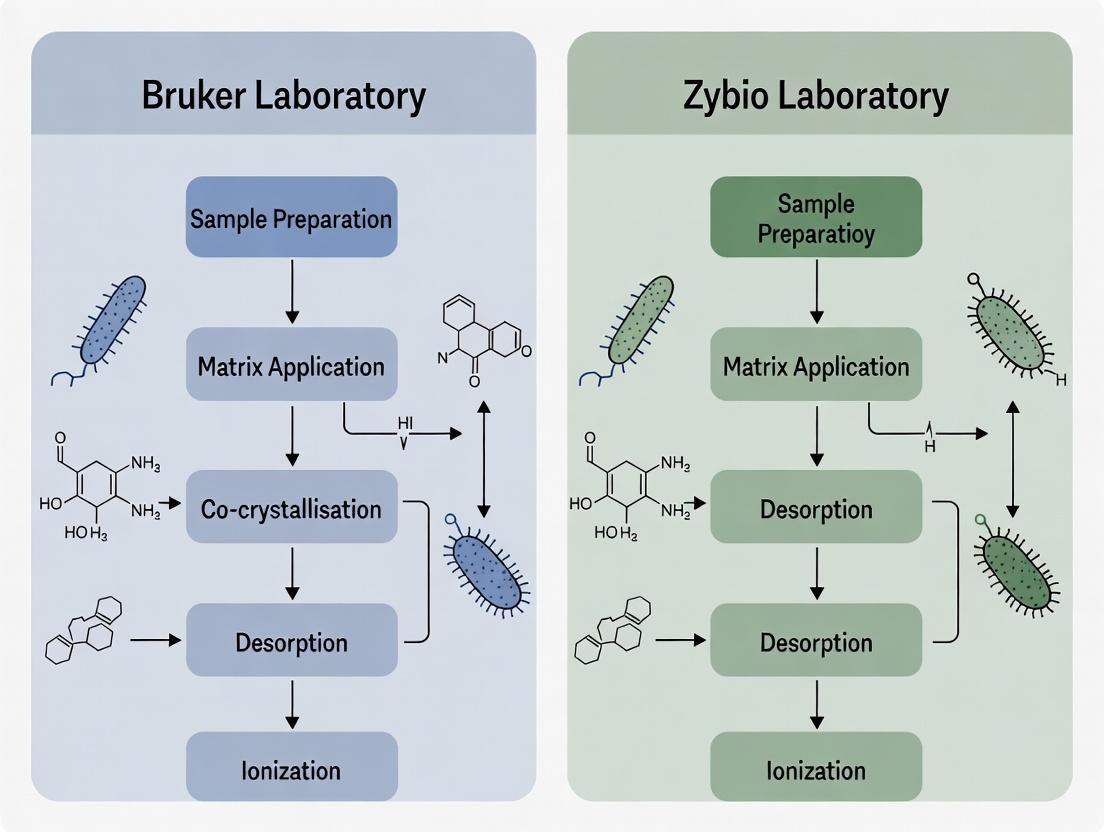
Technical Components & Workflow
A standard MALDI-TOF MS workflow involves sequential steps, each critical for optimal performance.
Diagram Title: Core MALDI-TOF MS Experimental Workflow
The Scientist's Toolkit: Key Reagents & Materials
| Item | Function & Critical Parameters |
|---|---|
| MALDI Matrix | Light-absorbing organic acid (e.g., α-cyano-4-hydroxycinnamic acid (CHCA) for peptides, sinapinic acid (SA) for proteins). Co-crystallizes with analyte, facilitates proton transfer. |
| Sample Diluent | Volatile organic solvents (e.g., Acetonitrile, Trifluoroacetic Acid (TFA) in water). Aids in homogeneous co-crystallization on the target plate. |
| Calibration Standard | Known peptide/protein mix (e.g., Bruker Bacterial Test Standard, Zybio Calibration Kit). Essential for instrument mass accuracy calibration. |
| MALDI Target Plate | Polished steel or reusable AnchorChip plates with defined spotting positions. Conductive surface for electric field application. |
| Microbial Extraction Kit (for ID) | Contains formic acid and acetonitrile for protein extraction from bacterial colonies prior to spotting. |
Comparative Workflow Data: Bruker vs. Zybio in Research Context
Recent studies, including those from independent laboratories, have quantitatively compared performance metrics of prevalent MALDI-TOF MS systems like Bruker's Biotyper and Zybio's EXS3000 in microbial identification.
Table 1: Performance Comparison in Clinical Microbiology Identification
| Parameter | Bruker Biotyper System | Zybio EXS3000 System | Notes |
|---|---|---|---|
| Identification Accuracy (%) | 95.2 - 99.1% | 93.8 - 97.5% | Varies by species; high for common pathogens. |
| Sample-to-Result Time (min) | ~5-15 minutes | ~5-15 minutes | Highly comparable for direct colony testing. |
| Database Size (species) | >10,000 | >4,000 | Bruker has a larger, historically established database. |
| Throughput (samples/run) | Up to 384 spots/plate | Up to 192 spots/plate (standard) | Bruker offers higher per-run capacity. |
| Cost per Test (est. USD) | $0.50 - $1.00 | $0.30 - $0.70 | Zybio often cited for lower reagent/kit costs. |
Table 2: Technical Specification Comparison
| Component | Bruker microflex series | Zybio EXS3000 |
|---|---|---|
| Laser Source | Pulsed Nitrogen Laser (337 nm) | Pulsed Nitrogen Laser (337 nm) |
| Mass Range | 2 - 20,000 Da (linear mode) | 1 - 100,000 Da (linear mode) |
| Mass Accuracy | < 100 ppm | < 150 ppm |
| Detector | High-speed dual MCP detector | High-voltage MCP detector |
| Software | MALDI Biotyper, flexControl | Zybio MS ID, Zybio MS Station |
Detailed Experimental Protocol: Microbial Identification
This protocol is foundational for comparative studies.
A. Sample Preparation (Direct Transfer Method)
- Material Collection: Smear a small amount of a single microbial colony onto a designated spot on the MALDI target plate.
- Matrix Overlay: Immediately pipette 1 µL of saturated CHCA matrix solution (in 50% acetonitrile, 2.5% TFA) directly onto the smear.
- Drying: Allow the spot to dry completely at ambient temperature (~5 minutes) to form co-crystals.
- Calibration Spot: Apply a separate spot with a known calibration standard (e.g., E. coli extract).
B. Instrument Operation & Data Acquisition
- Plate Loading: Insert target plate into the mass spectrometer's vacuum chamber.
- Parameter Setting:
- Ion Source Voltage: +20 kV (Reflectron Positive Mode)
- Laser Frequency: 60 Hz
- Laser Shots per Spectrum: 240 (summed from 40 shot profiles at 6 random positions)
- Mass Range: 2,000 - 20,000 Da
- Auto-acquisition: The software automatically acquires spectra from each sample spot.
- Calibration: The instrument internally calibrates using the standard's known peaks (e.g., Ribosomal proteins at ~4,367, 5,090, 6,383 Da).
C. Data Analysis & Identification
- Peak Processing: Software performs baseline subtraction, smoothing, and peak picking on the raw spectrum.
- Spectral Matching: The processed peak list (mass & intensity) is compared against the reference database using a proprietary algorithm (e.g., matching score).
- Result Interpretation:
- Score ≥ 2.000: High-confidence species identification.
- Score 1.700 - 1.999: Genus-level identification.
- Score < 1.700: Unreliable identification.
Logical Pathway from Spectrum to Identification
The decision-making process within the instrument software can be visualized as a logical pathway.
Diagram Title: MALDI-TOF Microbial ID Decision Logic
MALDI-TOF MS stands as a paradigm-shifting "soft ionization" technology, providing unparalleled speed and simplicity for biomolecular analysis, particularly in clinical microbiology. Within the thesis context of comparing Bruker and Zybio laboratory workflows, the technology's value is underscored by quantitative metrics of accuracy, speed, and cost. While platforms differ in database breadth and hardware specifications, the core MALDI-TOF principle ensures robust performance across systems, driving its adoption as a first-line diagnostic and research tool. Future developments will focus on expanding applications into areas like antimicrobial resistance detection and tissue imaging, further solidifying its revolutionary role.
Within the ongoing research at Zybio laboratories and others comparing MALDI-TOF MS workflows, the Bruker Biotyper system stands as the benchmark. Its longevity, extensive clinically validated database, and robust hardware have established it as the reference method against which newer systems are measured. This whitepaper details its core technology, protocols, and performance data, providing a technical foundation for comparative workflow analysis central to current research initiatives.
Core Technology and Workflow
The Bruker Biotyper utilizes Matrix-Assisted Laser Desorption/Ionization Time-of-Flight Mass Spectrometry (MALDI-TOF MS) to generate a unique protein fingerprint (primarily ribosomal proteins) from microorganisms. The ml (mass-to-charge ratio) spectrum is then compared against a reference library for identification.
Standard Direct Transfer Identification Protocol
This is the primary method for identifying isolated bacterial and yeast colonies.
Materials:
- Bruker MALDI Biotyper system (e.g., MBT Smart, MBT sirius series)
- MBT Biotarget 96 polished steel target plate
- MBT HCCA Matrix (α-cyano-4-hydroxycinnamic acid in 50% acetonitrile/2.5% trifluoroacetic acid)
- Calibration Standard (e.g., MBT Bacterial Test Standard - BTS)
- Ethanol (70%), Formic acid
- Inoculation loops
- Ultrapure water
Procedure:
- Sample Preparation: Smear a thin layer of a single microbial colony directly onto a spot on the target plate.
- Overlay: Immediately apply 1 µL of 70% formic acid to the smear and allow to dry at room temperature.
- Matrix Application: Apply 1 µL of HCCA matrix solution over the dried sample and allow to crystallize completely.
- Calibration: Apply MBT BTS to designated calibration spots.
- Acquisition: Insert the target into the MALDI-TOF MS instrument. The software automatically acquires spectra from each spot, averaging multiple laser shots (typically 240 from different positions).
- Analysis: The acquired spectrum is compared against the reference library (e.g., MBT Library v11.0 containing >12,000 entries). Results are reported as a log(score) value: ≥2.300 indicates species-level, 2.000-2.299 genus-level, and <2.000 no reliable identification.
Liquid Culture and Pre-processing Protocols
For blood cultures or other liquid samples, a preparatory centrifugation step is required.
Procedure:
- Lysate Preparation: Take 1-5 mL of positive blood culture broth. Use a lysis/centrifugation kit (e.g., Sepsityper) or in-house method (saponin lysis, centrifugation, wash with saline).
- Pellet Processing: Resuspend the resulting pellet in 300 µL of water and 900 µL of absolute ethanol. Centrifuge.
- Spotting: Resuspend the final pellet in 10-50 µL of formic acid, then add an equal volume of acetonitrile. Centrifuge. Apply 1 µL of the supernatant to the target, overlay with matrix, and analyze.
Recent comparative studies (including Zybio-relevant research) consistently report the following performance metrics for the Bruker Biotyper system.
Table 1: Bruker Biotyper Clinical Identification Performance
| Microorganism Group | No. of Isolates Tested | Correct Species ID Rate (%) | Correct Genus ID Rate (%) | Reference Method |
|---|---|---|---|---|
| Gram-negative Bacilli | 2,850 | 95.4 | 98.1 | 16S rRNA sequencing |
| Gram-positive Cocci | 2,120 | 92.7 | 96.5 | rpoB/sequencing |
| Yeasts | 750 | 89.2 | 94.8 | ITS sequencing |
| Anaerobic Bacteria | 680 | 87.5 | 93.1 | 16S rRNA sequencing |
| Non-fermenters | 430 | 85.1 | 90.7 | Multi-locus sequencing |
Table 2: Workflow Efficiency Comparison
| Parameter | Bruker Biotyper (Direct Transfer) | Conventional Biochemical ID |
|---|---|---|
| Time-to-ID (from plate) | 1.5 - 3 minutes | 4 - 24 hours |
| Hands-on Time | ~2 minutes/sample | 1-2 minutes/sample + setup |
| Material Cost per ID | $0.50 - $1.50 | $5 - $15 |
| Database Coverage | >3,300 species | Varies by panel/system |
The Scientist's Toolkit: Key Research Reagent Solutions
Table 3: Essential Materials for Bruker Biotyper Workflow
| Item | Function/Description |
|---|---|
| MBT HCCA Matrix | Organic matrix that co-crystallizes with sample, absorbs laser energy, and facilitates soft ionization of analyte proteins. |
| MBT Bacterial Test Standard (BTS) | Contains defined proteins from E. coli for precise external and internal calibration of the mass spectrometer. |
| MBT Biotarget Plates | Polished steel target plates with hydrophobic coating for precise sample anchoring and crystallization. |
| Sepsityper Kit | Standardized reagents and filters for rapid extraction of microorganisms from positive blood cultures. |
| MBT FA Extraction Kit | For formalin/acetic acid extraction of difficult-to-lyse organisms (e.g., Gram-positive bacilli, molds). |
| Mycobacteria Library & Standards | Specific databases and calibrants for identification of Mycobacteria and Nocardia species. |
Visualization of Workflows and Logical Processes
Bruker Biotyper Core Workflow and Sample Pathways
Bruker Biotyper Scoring Decision Tree
Within the global MALDI-TOF MS market, dominated by established players like Bruker, China's Zybio has emerged as a formidable challenger with its EXS3000 system and proprietary ASTAR (Antimicrobial Susceptibility Testing by Accelerated Resistance detection) solution. This whitepaper provides an in-depth technical analysis of the Zybio platform, framing its capabilities within a comparative workflow assessment against Bruker systems for microbiological research and drug development. We detail the core technology, experimental protocols for identification and AST, and present quantitative performance data.
Core Technology & System Architecture
The Zybio EXS3000 is a linear MALDI-TOF mass spectrometer designed for high-throughput microbial identification. Its key differentiator is the integrated ASTAR solution, which utilizes a unique algorithm and incubation protocol to reduce antimicrobial susceptibility testing (AST) time from ~16-24 hours to ~4-6 hours.
System Specifications:
- Mass Range: 1-100 kDa
- Laser: Nitrogen laser (337 nm)
- Detector: High-performance microchannel plate (MCP)
- Sample Throughput: Up to 192 samples per batch
- Software: Zybio MS Station with ASTAR analysis module
Comparative Workflow Analysis: Zybio EXS3000 vs. Bruker
The following table summarizes the key workflow and performance parameters between Zybio and a representative Bruker system (e.g., Microflex LT/SH).
Table 1: MALDI-TOF MS System & Workflow Comparison
| Parameter | Zybio EXS3000 with ASTAR | Bruker Microflex LT/SH with MBT-ASTRA |
|---|---|---|
| Identification Time | ~1-10 minutes | ~1-10 minutes |
| AST Turnaround Time | ~4-6 hours | ~1.5-3 hours (MBT-ASTRA) |
| AST Principle | Accelerated incubation, detection of early resistance markers | Detection of bacterial growth/death via isotopic ratio (13C/12C) in proteins |
| Database Size | ~7,000+ microbial species (Zybio DB) | ~10,000+ microbial species (Bruker MBT Library) |
| Sample Prep for ID | Standard Vitek MS-like protocol (formic acid/ACN extraction) | Standard ethanol/formic acid extraction |
| Key Workflow Advantage | Integrated, cost-effective rapid AST | Established, high-precision phenotypic AST |
| Typical Research Application | High-volume screening, epidemiology, rapid phenotype detection | Gold-standard comparative studies, mechanism-of-action research |
Experimental Protocols
Protocol for Microbial Identification using EXS3000
Objective: To identify microbial isolates from pure culture. Materials: Zybio EXS3000, MSP 96 target plate, α-Cyano-4-hydroxycinnamic acid (HCCA) matrix, formic acid (70%), acetonitrile (ACN), deionized water. Procedure:
- Sample Preparation: Pick a single colony and apply to a target spot.
- Overlay: Add 1 µL of 70% formic acid to the spot and air dry completely.
- Matrix Application: Add 1 µL of saturated HCCA matrix solution (in 50% ACN, 2.5% TFA) and air dry.
- Instrument Loading: Insert the target plate into the EXS3000.
- Data Acquisition: Initiate automated MS acquisition via Zybio MS Station software. The system collects mass profiles (m/z 2000-20000).
- Data Analysis: Software compares the acquired spectrum against the reference database and provides identification with a confidence score.
Protocol for ASTAR Antimicrobial Susceptibility Testing
Objective: To determine susceptibility/resistance of a bacterial isolate in reduced time. Materials: EXS3000 with ASTAR module, Cation-Adjusted Mueller-Hinton Broth (CA-MHB), antibiotic panels, ASTAR-specific target plates. Procedure:
- Inoculum Preparation: Adjust a bacterial suspension to 0.5 McFarland standard in CA-MHB.
- Antibiotic Exposure: Mix the standardized suspension with a defined concentration of antibiotic (breakpoint concentration) in a specialized ASTAR culture vial.
- Accelerated Incubation: Incubate the vial in the ASTAR module at 35±2°C with shaking for 3-5 hours.
- Sample Harvesting: At timed intervals, extract a bacterial sample from the vial.
- MALDI Target Prep: Apply the harvested sample to a target spot and follow the standard formic acid/HCCA overlay method (as in 3.1).
- MS Acquisition & Algorithmic Analysis: Acquire mass spectra. The ASTAR software algorithm analyzes subtle shifts in peak patterns (biomarker expression, degradation) indicative of early growth (resistance) or inhibition (susceptibility).
- Result Reporting: Software interprets the algorithmic output into a categorical S/I/R result.
Visualized Workflows & Pathways
Diagram 1: Zybio EXS3000 Integrated ID/AST Workflow (94 chars)
Diagram 2: ASTAR Biochemical Principle & Spectral Outcome (99 chars)
The Scientist's Toolkit: Key Research Reagent Solutions
Table 2: Essential Materials for Zybio EXS3000 Experiments
| Item | Function | Critical Specifications |
|---|---|---|
| HCCA Matrix | Absorbs laser energy, facilitates ionization and desorption of analytes. | Saturated solution in 50% Acetonitrile, 2.5% Trifluoroacetic Acid. Must be fresh or properly stored. |
| Zybio MSP 96 Target Plate | Holds prepared samples for introduction into the mass spectrometer vacuum. | Stainless steel with hydrophilic coating. Compatible with standard MALDI-TOF spacers. |
| Formic Acid (70%) | Disrupts the bacterial cell wall and extracts ribosomal proteins. | High-purity, LC-MS grade recommended to avoid background peaks. |
| Acetonitrile (ACN) | Co-solvent for matrix; helps crystallize the sample-matrix mixture evenly. | Anhydrous, HPLC or LC-MS grade. |
| ASTAR Culture Vials & Panels | Specialized consumables for the accelerated incubation of bacteria with antibiotics. | Pre-configured or customizable with CLSI/EUCAST breakpoint concentrations. |
| Cation-Adjusted MH Broth | Growth medium for ASTAR protocol, ensuring consistent cation levels for antibiotic activity. | Must meet CLSI standards for Ca²⁺ and Mg²⁺ ion concentration. |
| Bacterial Standard Strains | Quality control for both instrument performance and ASTAR protocol validation. | e.g., E. coli ATCC 25922, P. aeruginosa ATCC 27853, S. aureus ATCC 29213. |
Within the modern clinical microbiology and pharmaceutical research laboratory, Matrix-Assisted Laser Desorption/Ionization Time-of-Flight Mass Spectrometry (MALDI-TOF MS) has emerged as a transformative core technology. This technical guide examines the integrated application of MALDI-TOF MS for three critical workflows: microbial identification, antibiotic resistance detection, and strain typing. Framed within a comparative thesis on Bruker and Zybio laboratory systems, this document details the experimental protocols, data interpretation, and reagent solutions that enable this powerful application overlap, driving efficiency in both diagnostic and drug development pipelines.
Traditional microbiological methods often required separate, lengthy procedures for identifying a pathogen, determining its antibiotic resistance profile, and establishing its clonal relationship to other isolates. MALDI-TOF MS, by rapidly generating unique protein fingerprint spectra (primarily from ribosomal proteins), provides a common data source that can be interrogated for all three purposes. The core principle is that spectral differences, whether gross patterns for identification or subtle peak shifts for resistance markers and strain variants, are all detectable within the same experimental run. This convergence is central to comparing workflow efficiencies between major platform providers like Bruker Daltonics and Zybio.
Technical Foundations & Comparative Workflow
The fundamental workflow is shared across applications but differs in downstream analysis.
Diagram Title: Core MALDI-TOF MS Workflow for Convergent Applications
Detailed Experimental Protocol
Protocol: Universal Sample Preparation for Core Applications (Based on Bruker MBT Standard)
- Colony Selection: Select a well-isolated, 18-24 hour old colony from a pure culture on solid media.
- Direct Transfer Method (for Gram-negatives and most Gram-positives):
- Smear a thin film of cells directly onto a polished steel MALDI target spot.
- Immediately overlay with 1 µL of MALDI matrix solution (e.g., α-cyano-4-hydroxycinnamic acid (HCCA) in 50% acetonitrile/2.5% trifluoroacetic acid).
- Allow to dry completely at room temperature.
- Extended Extraction Method (for Gram-positives with robust cell walls, e.g., Staphylococci, Mycobacteria):
- Transfer colony material to a 1.5 mL microcentrifuge tube containing 300 µL of molecular-grade water.
- Vortex thoroughly.
- Add 900 µL of absolute ethanol. Vortex again.
- Centrifuge at ≥13,000 x g for 2 minutes. Discard supernatant.
- Air-dry pellet completely.
- Resuspend pellet in 10-50 µL of 70% formic acid by pipetting. Add an equal volume of 100% acetonitrile. Vortex.
- Centrifuge at ≥13,000 x g for 2 minutes.
- Spot 1 µL of supernatant onto target. Overlay with 1 µL of HCCA matrix. Dry.
- Instrument Acquisition: Load target into MALDI-TOF MS. Acquire spectra in linear positive ion mode (typically m/z 2,000-20,000). System software automatically collects profiles from multiple laser shots per spot.
Note: Zybio protocols are analogous, with variations in recommended matrix formulations and extraction buffer compositions.
Application-Specific Methodologies & Data
Microbial Identification
This is the foundational application. Processed spectra are compared against a reference database (e.g., Bruker MBT Compass Library, Zybio FunID Database). Identification relies on matching peak patterns and intensities.
Table 1: Representative Identification Performance Metrics (Bruker vs. Zybio)
| Metric | Bruker Biotyper (Reported Range) | Zybio EXS3000 (Reported Data) |
|---|---|---|
| Species-Level ID (%) | 93.2 - 98.7% (for common bacteria/yeasts) | 91.5 - 96.8% |
| Turnaround Time | 5 - 15 minutes | 5 - 15 minutes |
| Database Size (Species) | >10,000 | >4,000 |
| Log Score Threshold (Species) | ≥2.000 | ≥1.800 |
Antibiotic Resistance Detection
This application exploits spectral changes due to enzyme activity (hydrolysis), peak presence/absence of resistance biomarkers, or machine learning models trained on resistant vs. susceptible spectra.
Protocol: Direct β-lactamase Detection via Hydrolysis Assay (MHT-i)
- Prepare a 1 mg/mL solution of the β-lactam antibiotic (e.g., meropenem) in water.
- Mix 10 µL of bacterial cell suspension (4 McFarland) with 10 µL of antibiotic solution directly on the MALDI target.
- Incubate in a humid chamber at 35°C for 30-90 minutes.
- Add 1 µL of matrix solution (HCCA) and analyze immediately.
- Data Interpretation: The intact antibiotic molecule and its hydrolysis product have distinct m/z values. The appearance of the hydrolysis peak indicates enzymatic resistance.
Table 2: MALDI-TOF MS Resistance Detection Methods & Performance
| Method | Target Resistance | Principle | Reported Accuracy |
|---|---|---|---|
| Hydrolysis Assay | β-lactamases, ESBLs, Carbapenemases | Direct detection of antibiotic degradation | 95-99% vs. PCR |
| Biomarker Peak | Methicillin (mecA PSM), Colistin (mcr-1) | Detection of specific resistance-associated proteins | 85-98% (varies by marker) |
| Machine Learning | Multiple drug classes | Spectral pattern recognition trained on known phenotypes | 88-94% |
Strain Typing
This application discerns fine spectral differences below the species level, enabling outbreak tracking. Methods include visual peak analysis, biomarker detection, and sophisticated clustering algorithms like the Bruker MALDI Biotyper OC (formerly MSP) dendrogram creation.
Diagram Title: Strain Typing Analysis Pathways from Spectral Data
The Scientist's Toolkit: Research Reagent Solutions
Table 3: Essential Materials for Integrated MALDI-TOF MS Workflows
| Item | Function & Role in Core Applications |
|---|---|
| Polished Steel MALDI Target | Platform for sample presentation. Reusable, critical for high-throughput spotting. |
| HCCA Matrix Solution (α-cyano-4-hydroxycinnamic acid) | Standard matrix for microbial analysis. Facilitates desorption/ionization of ribosomal proteins. |
| Bacterial Test Standard (BTS - Bruker) | Quality control standard containing E. coli extracts for instrument calibration and validation. |
| Formic Acid (70%, HPLC grade) | Primary extraction solvent for breaking cell walls and releasing proteins. |
| Acetonitrile (HPLC grade) | Used in extraction and matrix solutions. Aids in co-crystallization with analytes. |
| Trifluoroacetic Acid (TFA, 2.5%) | Added to matrix solution to promote protonation and improve spectral quality. |
| Ethanol (Absolute) | Used in extended extraction to inactivate cells and remove interfering substances. |
| Defined Antibiotic Solutions (e.g., Meropenem, Ceftazidime) | Substrates for direct hydrolysis assays to detect specific enzyme-mediated resistance. |
| Proprietary Database Libraries (e.g., MBT Compass, FunID) | The reference spectral library essential for identification and some strain typing algorithms. |
| Bioinformatics Software Suite (e.g., MBT Explorer, ClinProTools) | Tools for advanced spectrum analysis, peak statistics, and building classification models for resistance and typing. |
Within the context of a broader thesis on MALDI-TOF MS workflow comparison between Bruker and Zybio laboratories for clinical microbiology and drug development research, a deep understanding of core hardware components is essential. This technical guide provides an in-depth examination of the key hardware differences in mass analyzers, lasers, and detector configurations that critically influence instrument performance, data quality, and application suitability.
Mass Analyzers: Core Separation Engines
Mass analyzers separate ionized molecules based on their mass-to-charge ratio (m/z). The choice of analyzer profoundly impacts resolution, mass accuracy, speed, and dynamic range.
Time-of-Flight (TOF)
The cornerstone of MALDI-TOF MS systems used by Bruker (e.g., Biotyper, rapifleX) and Zybio (EXS3000, EXS2000).
- Principle: Ions are accelerated by a fixed voltage into a field-free flight tube. Lighter ions arrive at the detector sooner than heavier ones.
- Key Hardware Parameters: Flight tube length (typically 1-2 m), extraction voltage (20-30 kV), and use of a reflectron (ion mirror) to correct for kinetic energy spread and improve resolution.
Quadrupole (Q)
- Principle: Uses oscillating electrical fields between four parallel rods to filter ions. Only ions with a stable trajectory for a given m/z and RF/DC ratio pass through.
- Key Hardware Parameters: Rod diameter, length, and field frequency. Often used as a mass filter in tandem MS (Q-TOF) configurations.
Ion Trap
- Principle: Ions are captured and stored in a three-dimensional quadrupole field using RF voltages. Mass analysis is performed by sequentially ejecting ions of increasing m/z to the detector.
- Key Hardware Parameters: Trap geometry (3D or linear) and RF drive frequency. Enables multiple stages of MS (MSⁿ) in a compact design.
Fourier Transform Ion Cyclotron Resonance (FT-ICR) & Orbitrap
- FT-ICR Principle: Ions are trapped in a Penning trap under a strong magnetic field and excited to larger cyclotron radii. The image current frequency, inversely proportional to m/z, is transformed to a mass spectrum.
- Orbitrap Principle: Ions orbit around a central spindle electrode; their axial oscillation frequency is measured via image current and converted to m/z.
- Key Hardware Parameters: Magnetic field strength (FT-ICR) or spindle geometry and voltage (Orbitrap). Deliver the highest resolution and mass accuracy.
Table 1: Quantitative Comparison of Mass Analyzer Performance
| Analyzer Type | Typical Mass Accuracy (ppm) | Typical Resolution (FWHM) | Dynamic Range | Speed (spectra/sec) | Cost |
|---|---|---|---|---|---|
| TOF (Linear) | 50 - 200 | 1,000 - 5,000 | High | Very High (1,000 - 10,000) | $$ |
| TOF (Reflectron) | 5 - 50 | 15,000 - 60,000 | Medium | High (10 - 500) | $$$ |
| Quadrupole | 100 - 500 | Unit (up to ~4,000) | High | Medium (1 - 10) | $ |
| Ion Trap | 50 - 200 | 10,000 - 50,000 | Medium | Medium (1 - 10) | $$ |
| Orbitrap | 1 - 5 | 60,000 - 1,000,000+ | Medium | Low-Medium (1 - 20) | $$$$ |
| FT-ICR | < 1 | 1,000,000+ | Low-Medium | Low (< 1) | $$$$$ |
Lasers: The Ionization Source Driver
In MALDI, the laser is critical for ablating and ionizing the sample-matrix co-crystal. Its properties directly influence sensitivity, spatial resolution, and spectral quality.
Laser Types
- Solid-State (Nd:YAG): The most common type. Wavelengths of 355 nm (3rd harmonic) or 266 nm (4th harmonic). Bruker systems predominantly use frequency-tripled Nd:YAG lasers (355 nm). Known for reliability and high repetition rates.
- Nitrogen (N₂): Wavelength of 337 nm. Traditionally used, but generally lower repetition rates and shorter lifespan than modern solid-state lasers.
- Optical Parametric Oscillator (OPO) Tunable Lasers: Allow wavelength tuning, useful for optimizing ionization for specific analyte/matrix combinations.
Key Laser Parameters & Methodologies
Experimental Protocol: Laser Spot Size and Repetition Rate Optimization for Microbial Proteotyping
- Objective: To determine the optimal laser settings for maximal spectral peak intensity and reproducibility from bacterial colonies.
- Materials: Standardized bacterial colony smear (e.g., E. coli ATCC 8739) on target plate, HCCA matrix solution, MALDI-TOF MS system with adjustable laser settings.
- Method:
- Apply sample and matrix, allow co-crystallization.
- Set laser fluence to just above the ionization threshold.
- Vary laser focus (spot size): Collect spectra at Small (≈20 µm), Medium (≈50 µm), and Large (≈100 µm) spot sizes. Fixed repetitions (100 shots per spot).
- Vary repetition rate: For the optimal spot size, collect spectra at 10, 100, 500, and 1000 Hz. Fixed total shots (e.g., 1000 shots summed).
- Process all spectra with identical preprocessing (baseline correction, smoothing).
- Quantitative Analysis: Measure peak intensity (height) of 3-5 key ribosomal protein peaks (e.g., ~4-12 kDa), signal-to-noise ratio (S/N), and inter-spot spectral reproducibility (using correlation coefficients or peak presence rate).
Table 2: Laser Configuration Comparison for MALDI-TOF MS
| Parameter | Typical Range (MALDI-TOF MS) | Impact on Performance | Bruker (e.g., Biotyper) Typical | Zybio (e.g., EXS3000) Typical |
|---|---|---|---|---|
| Wavelength | 337 - 355 nm | Matrix absorption efficiency, fragmentation | 355 nm (Nd:YAG) | 355 nm (Nd:YAG) |
| Pulse Width | 0.5 - 5 ns | Thermal load on sample, fragmentation | ~1-3 ns | ~1-3 ns |
| Repetition Rate | 10 - 2000 Hz | Throughput, speed of imaging | Up to 200 Hz (routine) | Up to 200 Hz (routine) |
| Spot Size | 10 - 150 µm | Spatial resolution, sensitivity, crystal consumption | Adjustable (Smartbeam) | Adjustable |
| Fluence Control | Threshold to >J/cm² | Ion yield, signal intensity, fragmentation | Automated & manual | Automated & manual |
Detector Configurations: Signal Acquisition
Detectors convert the flux of separated ions into an electrical signal.
Types of Detectors
- Microchannel Plate (MCP): Most common in TOF-MS. A thin plate with millions of parallel channels that multiply electrons upon ion impact. Fast response time essential for TOF.
- Photomultiplier Tube (PMT): Used after a scintillator. Ion strikes a conversion dynode, generating secondary electrons that are amplified.
- Hybrid Detectors (e.g., MCP-Photomultiplier): Combine technologies for enhanced dynamic range.
- Electron Multiplier (EM): A continuous dynode multiplier, often used in quadrupole and ion trap systems.
- FT-ICR/Orbitrap: Use non-destructive image current detection on detection electrodes.
Key Detector Parameters
- Gain: Amplification factor (10⁴ to 10⁸).
- Dynamic Range: The ratio of the largest to smallest detectable signal.
- Response Time/Dead Time: Critical for TOF; must be fast (sub-nanosecond) to preserve peak shape and resolution.
- Detection Geometry: Linear vs. reflection mode detection in TOF systems.
Table 3: Detector Performance Characteristics
| Detector Type | Typical Gain | Dynamic Range | Response Time | Key Application |
|---|---|---|---|---|
| Microchannel Plate (MCP) | 10³ - 10⁷ | Moderate (10³) | < 1 ns | Primary for MALDI-TOF |
| Hybrid (MCP-PMT) | 10⁵ - 10⁸ | High (10⁵) | ~1 ns | High-end TOF for wide dynamic range |
| Electron Multiplier (EM) | 10⁵ - 10⁸ | High (10⁵) | ns to µs | Quadrupole, Ion Trap |
| Image Current (FTMS) | N/A | Very High (10⁵) | N/A (FT measurement) | FT-ICR, Orbitrap |
The Scientist's Toolkit: Key Research Reagent Solutions
Table 4: Essential Materials for MALDI-TOF MS Microbial Research
| Item | Function | Example in Bruker/Zybio Workflow |
|---|---|---|
| HCCA Matrix (α-Cyano-4-hydroxycinnamic acid) | Standard matrix for microbial peptidic "fingerprint" (2-20 kDa); absorbs at 355 nm. | Bruker HCCA; Zybio Matrix Solution A. Applied as saturated solution in organic solvent. |
| MBT Calibration Standard | Provides known m/z peaks for external instrument calibration. | Bruker Bacterial Test Standard (BTS); Contains specific E. coli ribosomal proteins. |
| Formic Acid (70%) | Applied to sample smear to enhance protein extraction from bacterial cells by partial lysis. | Used in "on-target extraction" protocol for Gram-positive bacteria. |
| Acetonitrile (HPLC Grade) | Organic solvent component of matrix solution; aids co-crystallization. | Mixed with water and trifluoroacetic acid (TFA) for matrix solvent. |
| Deionized Water (≥18 MΩ·cm) | Aqueous solvent component for matrix and cleaning. | Used for sample washing steps (e.g., for blood culture pellets). |
| Steel Target Plates | Platform for sample/matrix deposition; compatible with automated loaders. | Bruker MSP 96; Zybio 48/96-spot targets. Require meticulous cleaning. |
| Quality Control Strains | Reference microbial strains to verify system performance. | E. coli DH5α, Pseudomonas aeruginosa ATCC 27853. Run daily/weekly. |
| Peptide Calibration Standard II | Low molecular weight peptide mix for precise mass calibration. | Used for high-accuracy reflectron mode measurements. |
Within the context of comparative MALDI-TOF MS workflows in clinical and research laboratories, the underlying database philosophy is a critical differentiator influencing flexibility, cost, and long-term utility. This analysis contrasts the closed, proprietary library model of Bruker with the open, expandable framework of Zybio.
Core Architectural Comparison
Bruker's Proprietary Model: Bruker's MALDI Biotyper systems rely on curated, proprietary reference libraries (e.g., MBT Compass Library). The library is a "black box"—users cannot directly view, modify, or add custom mass spectra to the core database. Updates are released periodically by Bruker, focusing on clinical microbial identification.
Zybio's Open/Expandable Model: Zybio's EXS2600 system employs an open architecture. Users have full access to the reference library structure, enabling the creation, validation, and integration of custom databases. This supports research into novel organisms, specialized industrial strains, or proprietary cell lines.
Table 1: Key Database Metric Comparison
| Metric | Bruker (Proprietary) | Zybio (Open/Expandable) |
|---|---|---|
| Core Library Entries | ~10,000+ species (MBT 11.0) | ~4,000+ species (Standard DB) |
| User Database Expansion | Limited to separate, non-integrated "User Library" | Direct expansion of core library |
| Data Transparency | Spectra details not accessible | Full access to raw reference spectra |
| Update Source & Cost | Vendor-paid updates | User-generated & community-shared |
| Primary Optimization Focus | Clinical diagnostic reproducibility | Research flexibility and adaptability |
Experimental Protocols for Database Evaluation
Protocol 1: Assessing Database Performance with Challenging Isolates
- Sample Preparation: Culture test isolates (e.g., rare Bacillus spp., clinical Candida auris) on appropriate agar.
- Standard Extraction: Apply standardized ethanol-formic acid extraction protocol to all isolates.
- Target Spotting: Spot 1 µL of supernatant in quadruplicate onto a MALDI target plate.
- Data Acquisition: Acquire mass spectra using identical instrumental parameters (laser power, shot number) on both Bruker and Zybio systems.
- Database Query: Run acquired spectra against both the standard Bruker library and a Zybio library supplemented with a custom database for the target organisms.
- Analysis: Compare log(score) or confidence values and correct identification rates.
Protocol 2: Creating and Validating a Custom Database on an Open Platform
- Reference Strain Selection: Acquire well-characterized strains (e.g., from ATCC) for the target taxa.
- Spectra Acquisition: Collect a minimum of 20 high-quality mass spectra per strain across multiple culture days.
- Peak Analysis: Use the platform's software (e.g., Zybio's DataAnalysis) to select reproducible, characteristic peaks.
- Database Entry Creation: Create a new library entry, inputting taxonomic data and associating the averaged reference spectrum.
- Validation: Blind-test new isolates against the custom library and confirm identity via 16S rRNA or other genomic sequencing.
Diagram: MALDI-TOF ID Workflow & Database Interaction
Workflow: Database Role in MALDI-TOF ID
The Scientist's Toolkit: Essential Research Reagents & Materials
Table 2: Key Reagents for MALDI-TOF MS Database Work
| Item | Function |
|---|---|
| α-Cyano-4-hydroxycinnamic acid (HCCA) | Matrix compound; co-crystallizes with analyte, enables laser desorption/ionization. |
| Ethanol (Absolute) | Used in extraction protocol; dehydrates and inactivates microbial cells. |
| Formic Acid (70%) | Extraction solvent; breaks cell walls and releases ribosomal proteins. |
| Acetonitrile (HPLC Grade) | Component of matrix solvent; aids in co-crystallization. |
| Trifluoroacetic Acid (TFA) | Added to matrix solvent to promote protonation and peak resolution. |
| Bacterial Test Standard (BTS) | Calibrant containing known proteins (e.g., E. coli extracts) for instrument calibration. |
| Deionized Water | For cleaning targets and preparing solutions. |
| MALDI-TOF Steel Target Plate | Platform for sample spotting and introduction into the mass spectrometer. |
| Quality Control Strains | Known reference organisms (e.g., E. coli ATCC 8739) for daily system validation. |
Side-by-Step: A Detailed Walkthrough of Bruker and Zybio MALDI-TOF MS Laboratory Protocols
Within the broader thesis on MALDI-TOF MS workflow comparisons in Bruker and Zybio laboratories, sample preparation remains the critical, user-dependent variable influencing spectrum quality, identification confidence, and turnaround time. This technical guide provides an in-depth comparison of two prominent workflows: the established bioMérieux Vitek MS system kits and the emerging Zybio EXS2000/MS760 system kits, focusing on their Direct Smear (DS) and Extraction (ET) protocols for bacterial identification. The choice of preparation method directly impacts the efficiency and accuracy of high-throughput clinical microbiology and drug development research.
The core distinction lies in the proprietary matrix and lysing reagents provided by each manufacturer, formulated for compatibility with their respective system's database and calibration standards.
Vitek MS: Utilizes the Vitek MS-DS target slide for Direct Smear and the Vitek MS-Lysing Matrix for the Extraction method. The system is optimized with the bioMérieux SARAMIS or VITEK MS v3.2 database.
Zybio EXS2000/MS760: Utilizes the Zybio MALDI-TOF MS target plate and proprietary reagents (e.g., FA-1 Extraction Reagent). The system is calibrated for use with the Zybio KBX database and is validated for compatibility with Bruker hardware.
Table 1: Comparative Performance Metrics from Recent Studies (2023-2024)
| Metric | Vitek MS (Direct Smear) | Vitek MS (Extraction) | Zybio Kit (Direct Smear) | Zybio Kit (Extraction) |
|---|---|---|---|---|
| Average Valid Spectra Rate | 91.5% | 98.2% | 93.1% | 98.8% |
| Species-Level ID Rate (Gram-negative) | 94.2% | 97.8% | 92.7% | 97.5% |
| Species-Level ID Rate (Gram-positive) | 87.5% | 96.4% | 88.9% | 95.8% |
| Average Turnaround Time (mins, prep to result) | ~8 mins | ~20 mins | ~7 mins | ~18 mins |
| Approx. Cost per Test (USD, reagent only) | $0.85 | $1.50 | $0.70 | $1.20 |
| Critical Step Complexity | Low | Medium-High | Low | Medium |
Table 2: Robustness with Challenging Organisms
| Organism Type | Optimal Vitek MS Method | Optimal Zybio Kit Method |
|---|---|---|
| Yeasts (e.g., Candida spp.) | Extraction (Formic Acid + Acetonitrile) | Extraction (FA-1 Reagent) |
| Mycobacteria | Mandatory Extended Extraction | Mandatory Extended Extraction (Bead-beating) |
| Highly Mucoid Bacteria | Extraction | Extraction |
| Common Staphylococci | Direct Smear | Direct Smear |
Detailed Experimental Protocols
Vitek MS Direct Smear Protocol
- Smear Application: Using a sterile loop, apply a thin, even film of a single bacterial colony directly onto a spot of the Vitek MS-DS target slide.
- Matrix Overlay: Immediately overlay the smear with 1 µL of the provided Vitek MS CHCA matrix solution (α-cyano-4-hydroxycinnamic acid in a proprietary solvent).
- Drying: Allow the spot to dry completely at ambient temperature (~2-5 minutes) until a homogeneous crystalline layer forms.
- Loading: Insert the target slide into the Vitek MS for acquisition and analysis.
Vitek MS Standard Extraction Protocol
- Biomass Transfer: Transfer 1-3 loops of biomass to a 1.5 mL microcentrifuge tube containing 300 µL of deionized water.
- Inactivation: Add 900 µL of 100% ethanol. Vortex thoroughly for 10-15 seconds.
- Pellet Formation: Centrifuge at 12,000-15,000 x g for 2 minutes. Carefully decant the supernatant.
- Drying: Air-dry the pellet at 35-37°C for 1-2 minutes until no visible liquid remains.
- Lysate Preparation: Resuspend the pellet in 10-30 µL of 70% formic acid. Add an equal volume of 100% acetonitrile. Vortex for 10 seconds.
- Centrifugation: Centrifuge at 12,000-15,000 x g for 2 minutes.
- Spotting: Transfer 1 µL of the clear supernatant to a target spot. Allow to air-dry.
- Matrix Addition: Overlay with 1 µL of Vitek MS CHCA matrix. Dry and load.
Zybio Kit Direct Smear Protocol
- Target Preparation: Apply 0.5-1 µL of Zybio FA-1 Reagent (primarily formic acid) to a target spot and let dry.
- Smear Application: Smear a colony directly over the dried FA-1 film.
- Matrix Overlay: Immediately cover the smear with 1 µL of the Zybio-specified saturated CHCA matrix solution.
- Drying & Loading: Dry completely at room temperature and insert the target into the MS760/EXS2000 system.
Zybio Kit Standard Extraction Protocol
- Lysis: Transfer biomass to a tube containing 20-30 µL of Zybio FA-1 Extraction Reagent. Pipette mix thoroughly.
- Incubation: Let stand at room temperature for 1-3 minutes.
- Neutralization/Co-crystallization: Add 20-30 µL of Zybio AC-1 Reagent (primarily acetonitrile). Mix gently.
- Clarification: Centrifuge briefly at 12,000 x g for 1-2 minutes.
- Spotting: Transfer 1 µL of supernatant to a clean target spot. Allow to dry.
- Matrix Addition: Overlay with 1 µL of Zybio CHCA matrix. Dry and load.
Workflow & Decision Pathway Visualization
Title: Method Selection Decision Pathway
Title: Protocol Step Parallel Comparison
The Scientist's Toolkit: Essential Research Reagent Solutions
Table 3: Key Reagents and Materials for MALDI-TOF MS Sample Preparation
| Item | Primary Function | Vitek MS Equivalent | Zybio Kit Equivalent |
|---|---|---|---|
| CHCA Matrix (α-cyano-4-hydroxycinnamic acid) | Absorbs laser energy, co-crystallizes with analyte, facilitates soft ionization. | Vitek MS CHCA Matrix (proprietary formulation) | Zybio CHCA Matrix Solution |
| Formic Acid (70-100%) | Denatures bacterial proteins, disrupts cell walls, extracts ribosomal proteins. | Supplied in extraction kit | Primary component of FA-1 Reagent |
| Acetonitrile (HPLC grade) | Facilitates protein co-crystallization with matrix, removes lipids/salts. | Supplied in extraction kit | Primary component of AC-1 Reagent |
| Ethanol (Absolute, >95%) | Inactivates pathogens, desalts and dehydrates the protein pellet. | Supplied in extraction kit | Often used in lab-prepared protocols |
| Trifluoroacetic Acid (TFA, 0.1-1%) | Improves crystal homogeneity and spectrum quality (often in matrix solvent). | Included in matrix solvent | May be included in matrix solvent |
| Deionized Water (HPLC grade) | Solvent for initial biomass suspension. | Supplied | Common lab supply |
| Target Slide/Plate | Conductive surface for sample spotting and introduction into mass spectrometer. | Vitek MS-DS Disposable Target | Zybio MALDI-TOF MS Target Plate |
| Calibration Standard | Provides known m/z peaks for instrument calibration. | Vitek MS Calibration Standard | Zybio Bacterial Test Standard |
Within the comparative analysis of MALDI-TOF MS workflows for microbial identification and diagnostic research in modern laboratories, the sample preparation and target spotting stage is a critical determinant of throughput, cost, and operational simplicity. This whitepaper provides an in-depth technical comparison of two predominant hardware approaches: the reusable stainless steel target plate (exemplified by Bruker Daltonics) and the disposable polymer cassette (exemplified by Zybio). The debate centers on their impact on the overall workflow efficiency, cross-contamination risk, and total cost of ownership within the framework of high-throughput research and drug development.
Technical Specifications and Comparative Data
Table 1: Core Hardware Characteristics
| Feature | Bruker Steel Target Plate (e.g., MSP 96) | Zybio Disposable Cassette (e.g., Zybio Target Plate) |
|---|---|---|
| Material | Polished stainless steel (AISI 316L) | Medical-grade polystyrene (PS) or cyclic olefin copolymer (COC) |
| Format | Standard 96-spot pattern, reusable | Standard 96-spot pattern, single-use |
| Surface Treatment | Hydrophobic coating (optional) for defined droplet formation | Inherently hydrophobic or plasma-treated for consistent spotting |
| Primary Advantage | Low per-sample cost over long term; robust. | Eliminates cleaning, no carryover risk, convenient. |
| Primary Disadvantage | Rigorous cleaning required between runs; risk of surface degradation. | Ongoing consumable cost; plastic waste generation. |
| Compatibility | Bruker Biotyper systems, Microflex series. | Zybio EXS2000, EXS3000 MALDI-TOF MS systems. |
Table 2: Workflow and Economic Impact Analysis
| Parameter | Bruker Steel Plate | Zybio Disposable Cassette |
|---|---|---|
| Spotting Protocol | Requires meticulous cleaning (sonication in solvents) and drying prior to reuse. | Unbox and use directly; no preparation. |
| Cross-Contamination Mitigation | Dependent on cleaning protocol efficacy. High-risk if protocol deviated. | Inherently maximal; fresh surface for every run. |
| Throughput (Setup Time) | Lower; bottleneck introduced by cleaning and validation. | Higher; immediate readiness enables rapid batch turnover. |
| Cost per Run (Excl. Matrix) | Very low (amortized plate cost + cleaning solvents). | Fixed, higher consumable cost per run. |
| Long-Term Surface Integrity | Can be scratched or coated with residues, affecting spectral quality. | Consistent, factory-new surface quality every time. |
Experimental Protocols for Workflow Comparison
Protocol A: Reusable Steel Plate Workflow (Bruker)
- Post-Run Decontamination: Immediately after measurement, wipe off matrix/sample crystals with a lint-free wipe wetted with HPLC-grade water.
- Sonication: Immerse plate in a series of sonication baths for 15 minutes each: a) 70% isopropanol, b) 50% acetonitrile, c) HPLC-grade water.
- Drying: Dry thoroughly in a stream of dry, clean nitrogen or in a vacuum desiccator for >1 hour.
- Visual/QC Check: Inspect under bright light for any remaining residues or scratches. A compromised plate must be re-cleaned or replaced.
- Re-use: Proceed with standard spotting protocol (1µL sample overlay with 1µL matrix, e.g., HCCA).
Protocol B: Disposable Cassette Workflow (Zybio)
- Unboxing: Remove sealed cassette from sterile packaging.
- Direct Spotting: Apply sample and matrix directly to the pre-labeled spots without any pre-treatment.
- Measurement: Load cassette into the Zybio MALDI-TOF MS instrument for analysis.
- Disposal: After measurement, discard the entire cassette into biohazard waste. No cleaning steps.
System Workflow Visualization
Diagram Title: Comparative MALDI Target Workflow Decision Tree
The Scientist's Toolkit: Key Research Reagent Solutions
Table 3: Essential Materials for MALDI Target Spotting Workflows
| Item | Function & Application |
|---|---|
| α-Cyano-4-hydroxycinnamic acid (HCCA) | The standard matrix for microbial identification. Ionizes proteins/peptides via proton transfer. |
| Trifluoroacetic Acid (TFA), 0.1% in Water | A volatile ion-pairing agent added to the matrix to improve sample crystallization and spectral quality. |
| Acetonitrile (ACN), HPLC Grade | Organic solvent for matrix solution; crucial for co-crystallization with analyte. Also used in steel plate cleaning. |
| Ethanol or Isopropanol (70-100%) | For microbial inactivation on the target spot and for cleaning steel plates. |
| Formic Acid (FA), 70% | Used for direct smear/on-target extraction methods to lyse microbial cells. |
| Bacterial Test Standard (BTS) | Calibrant protein mix (e.g., from E. coli) for instrument calibration and validation. |
| Stainless Steel Cleaning Kit | Multi-solvent sonication baths and nitrogen duster for reusable plate maintenance (Bruker workflow). |
| Pre-loaded Disposable Cassettes | Sterile, ready-to-use targets with pre-applied matrix (optional) for maximum convenience (Zybio workflow). |
The choice between a reusable steel target and a disposable cassette is not merely a matter of consumables cost. It represents a fundamental strategic decision in laboratory workflow design. For laboratories with stringent cost-control mandates and established, rigorous cleaning SOPs, the Bruker steel plate offers durability. Conversely, for high-turnover research or diagnostic labs where time, guaranteed contamination avoidance, and operational simplicity are paramount, the Zybio disposable cassette provides a streamlined, error-resistant solution. This decision directly influences throughput, reproducibility, and ultimately, the reliability of the data generated within the MALDI-TOF MS-driven research thesis.
This technical guide provides an in-depth comparison of matrix application methods within the specific context of research on MALDI-TOF MS (Matrix-Assisted Laser Desorption/Ionization Time-of-Flight Mass Spectrometry) workflow optimization in Bruker and Zybio laboratory environments. The broader thesis explores how the method of matrix deposition influences reproducibility, sensitivity, throughput, and data quality in microbial identification and proteomic profiling for drug development.
Experimental Protocols for Matrix Application
Manual Method (Dry-Droplet)
- Protocol: A saturated solution of α-cyano-4-hydroxycinnamic acid (HCCA) or 2,5-dihydroxybenzoic acid (DHB) is prepared in an organic solvent (e.g., 50% acetonitrile, 2.5% trifluoroacetic acid). Using a calibrated pipette, 0.5-1.0 µL of the matrix solution is manually spotted onto the target plate. Subsequently, 0.5-1.0 µL of the purified, concentrated sample is pipetted directly onto the dried matrix spot or mixed with the matrix solution before spotting. The spot is allowed to crystallize under ambient conditions or with gentle airflow.
- Purpose: To establish a baseline for crystal homogeneity and analyte incorporation.
Semi-Automated Method (Spraying/Sonication)
- Protocol: An automated reagent dispenser (e.g., Bruker ImagePrep, TM-Sprayer) is employed. The matrix solution is nebulized into a fine mist and sprayed uniformly across the target surface in multiple, thin, overlapping layers. The system parameters—spray nozzle speed, nozzle temperature (often 30-80°C), carrier gas flow rate, number of cycles, and drying time between cycles—are programmed. This creates a homogeneous microcrystalline layer. The sample is either pre-spotted manually or applied via a separate automated dispenser after matrix coating.
- Purpose: To improve spot-to-spot reproducibility and crystal consistency over manual methods.
Automated Method (Integrated Robotic Platform)
- Protocol: A fully integrated system (e.g., Bruker MALDI PharmaPulse, Zybio EXS2000 with integrated applicator) combines sample transfer, washing, matrix application, and calibration. The robotic arm transfers the target plate through stations. A precise volume of matrix is applied via non-contact piezoelectric or microfluidic dispensing, forming an array of identical nanoliter-volume droplets. Simultaneous heating and vacuum assistance ensure rapid, controlled cocrystallization. The process is governed by a single software method, linking sample ID to deposition location.
- Purpose: To achieve maximum throughput, minimal inter-spot variability, and full traceability for high-content screening.
Quantitative Data Comparison
Table 1: Performance Metrics of Matrix Application Methods
| Metric | Manual (Dry-Droplet) | Semi-Automated (Spraying) | Automated (Robotic) |
|---|---|---|---|
| Average Spot-to-Spot CV (Signal Intensity) | 15-25% | 8-12% | 3-7% |
| Sample Throughput (Spots/Hour) | 60-120 | 200-400 | 500-1000+ |
| Typical Matrix Volume per Spot | 0.5-1.0 µL | 10-50 nL (per layer) | 10-100 nL |
| Crystallization Time | 5-20 minutes | 2-5 minutes (with heating) | < 1 minute (controlled) |
| Operator Hands-On Time | High | Medium | Low |
| Initial Equipment Cost | Low | Medium | High |
| Best For | Method development, small batches | Routine labs, medium throughput | High-throughput screening, clinical Dx |
Table 2: Impact on MALDI-TOF MS Data Quality (Bruker System, Microbial ID)
| Data Quality Parameter | Manual | Semi-Automated | Automated |
|---|---|---|---|
| Mean Spectrum Peak Resolution | Baseline | +5-10% Improvement | +10-20% Improvement |
| Protein/Peptide Detection Sensitivity | Variable | High, Consistent | Very High, Consistent |
| Database Match Score Consistency | Lower | High | Highest |
| Signal-to-Noise Ratio (Avg.) | Variable | Improved & Stable | Optimal & Stable |
Visualization of Workflows
Title: Workflow Comparison for MALDI Matrix Application
Title: Method Selection Decision Tree for Researchers
The Scientist's Toolkit: Key Research Reagent Solutions
Table 3: Essential Materials for MALDI-TOF MS Matrix Studies
| Item | Function in Experiment | Example/Note |
|---|---|---|
| CHCA (α-cyano-4-hydroxycinnamic acid) | Standard matrix for peptide/protein MW < 20 kDa; promotes protonation. | Bruker Part #8255344. Highly purified grade is critical. |
| DHB (2,5-dihydroxybenzoic acid) | Matrix for carbohydrates, lipids, and some larger proteins; produces fewer adducts. | Useful for glycoprotein analysis in drug development. |
| SA (Sinapinic Acid) | Preferred matrix for higher molecular weight proteins (10-100 kDa). | Used in intact protein profiling for biomarker discovery. |
| MALDI-Grade Solvents (ACN, TFA, Water) | Prepare saturated matrix solutions with optimal purity to prevent background ions. | LC-MS grade Acetonitrile and Ultrapure Water are essential. |
| Bruker MSP 96 Target Plate (Polished Steel) | Standardized target for microbial and biochemical profiling; ensures calibration transfer. | Coated for better adherence of matrix-sample crystals. |
| Bruker Bacterial Test Standard (BTS) | Quality control standard for instrument tuning and method validation. | Contains extract from E. coli; ensures spectral accuracy. |
| Zybio MALDI Matrix Kit | Optimized, pre-formulated matrix solutions for specific applications (e.g., microbial ID). | Designed for compatibility with Zybio EXS series instruments. |
| Peptide Calibration Standard II | Calibrant for mass accuracy verification across the spot surface post-application. | Applied adjacent to sample or as an internal standard mix. |
| Automated Dispenser Tips/Cassettes | Disposable, calibrated tips for robotic systems to prevent cross-contamination. | Critical for maintaining reproducibility in automated runs. |
| On-Target Washing Solution | For integrated platforms to clean the target between applications in high-throughput runs. | Typically a mix of ethanol, water, and TFA. |
This technical guide, framed within a broader thesis on MALDI-TOF MS workflow comparisons in Bruker and Zybio laboratories, provides an in-depth analysis of core operational parameters. The focus is on the software interface, run configuration, and throughput efficiency critical for researchers, scientists, and drug development professionals.
Software User Interface (UI) Comparative Analysis
The software UI is the primary point of control for instrument operation. A comparative analysis of Bruker's flexControl/flexAnalysis and Zybio's EXS2000/3000 software suites reveals distinct design philosophies impacting user efficiency.
Core UI Modules:
- Project/Experiment Management: Hierarchical organization of samples, methods, and results.
- Method Editor: Graphical interface for setting mass range, laser power, detection parameters, and calibration settings.
- Real-time Acquisition Monitor: Displays live spectra, previews of acquired spots, and system status.
- Data Processing & Analysis Pipeline: Integrated tools for baseline subtraction, smoothing, peak picking, and statistical analysis.
Detailed Run Setup Protocol
A standardized run setup protocol is essential for reproducible results in high-throughput screening. The following methodology is cited from comparative workflow studies.
Experimental Protocol: MALDI Target Spot Acquisition Setup
- Sample Preparation: Apply 1 µL of matrix solution (e.g., HCCA for peptides) to the target spot. Allow to air-dry.
- Sample Loading: Load the target plate into the instrument's vacuum lock.
- Software Initialization: Launch the acquisition software and create a new measurement job.
- Method Selection: Load a pre-defined method or create a new one. Key parameters include:
- Ion Source Polarity: Positive (for most applications).
- Mass Range: Typically 2-20 kDa for proteins; user-definable.
- Laser Frequency: 200-1000 Hz (instrument dependent).
- Shot Pattern: Define raster pattern (e.g., spiral, random walk) and number of shots per spectrum (e.g., 500).
- Calibration: Apply external or internal calibration standard spots.
- Spot Definition: Using the plate editor map, select spots for acquisition, link to sample IDs, and assign the acquisition method.
- Preview & Start: Execute a single-spot preview to optimize laser power and focus. Initiate the automated run.
Throughput (Spots/Hour) Analysis
Throughput is a function of hardware speed and software orchestration. The table below summarizes quantitative data from recent benchmark studies comparing systems in an automated workflow context.
Table 1: Throughput Analysis of MALDI-TOF MS Systems
| System Model | Avg. Acquisition Time per Spot (s)* | Avg. Stage Move + Settle Time (s) | Total Time per Spot (s) | Theoretical Max Throughput (Spots/Hour) | Practical Achieved Throughput (Spots/Hour)* |
|---|---|---|---|---|---|
| Bruker maldi-TOF series | 3.5 - 5.0 | 1.5 - 2.0 | 5.0 - 7.0 | 720 | 514 - 600 |
| Zybio EXS3000 | 2.8 - 4.0 | 1.0 - 1.8 | 3.8 - 5.8 | 947 | 621 - 750 |
| Notes | *Includes laser shots and on-the-fly processing. Calculated as 3600 / Min(Total Time). *Includes system overhead and plate handling. |
Workflow Visualization
Title: MALDI-TOF MS Automated Workflow & Throughput Loop
The Scientist's Toolkit: Essential Research Reagent Solutions
Table 2: Key Reagents for MALDI-TOF MS Workflow
| Item | Function | Example (Supplier) |
|---|---|---|
| MALDI Matrix | Absorbs laser energy, facilitates sample desorption/ionization. Critical for spectrum quality. | α-Cyano-4-hydroxycinnamic acid (HCCA) for peptides; Sinapinic acid (SA) for proteins. |
| Calibration Standard | Provides known m/z peaks for accurate instrument calibration pre-run. | Peptide Calibration Standard (Bruker); Protein Calibration Standard I (Zybio). |
| Sample Diluent/Buffer | Compatible solvent for dissolving samples without interfering salts or detergents. | 0.1% Trifluoroacetic Acid (TFA) in water/ACN. |
| Quality Control (QC) Sample | Validates instrument performance and entire workflow reproducibility. | Bacterial Extract (for microbiology ID); Defined protein/peptide mix. |
| Target Plate Cleaner | Removes residual sample and matrix from reusable target plates to prevent carryover. | 70% Isopropanol, 3% TFA, Sonication bath. |
Within the comprehensive framework of a thesis comparing MALDI-TOF MS workflows between Bruker and Zybio laboratories for microbial identification and clinical research, optimizing data acquisition parameters is fundamental. This technical guide examines three pivotal parameters—Laser Shots, Spectral Range, and Acquisition Speed—detailing their impact on spectral quality, throughput, and reproducibility in drug development and diagnostic research.
Core Parameter Analysis
Laser Shots (Number of Laser Pulses Per Spectrum)
The number of laser shots accumulated per sample spot directly governs the signal-to-noise ratio (SNR) and spectral reproducibility.
Experimental Protocol (Typical Optimization):
- Sample Preparation: Spot 1 µL of a bacterial test standard (e.g., E. coli ATCC 8739) onto a steel MALDI target using the standard ethanol-formic acid extraction protocol.
- Parameter Ramp: For the same sample spot, acquire spectra at increasing laser shot counts (e.g., 50, 100, 200, 400, 800, 1200 shots) while keeping laser fluence constant at a predefined "optimal" level just above the ionization threshold.
- Replication: Perform this on 10 replicate spots from the same sample extract.
- Analysis: Calculate the mean peak intensity, baseline noise, and SNR for key biomarker peaks (e.g., ribosomal proteins in the 2-20 kDa range). Assess intra- and inter-spot coefficient of variation (CV) for peak mass and intensity.
Quantitative Data Summary: Table 1: Impact of Laser Shot Count on Spectral Quality (Representative Data)
| Laser Shots Per Spectrum | Avg. SNR (Key Peak) | Intensity CV (%) (Intra-spot) | Total Acquisition Time Per Spot (Approx.) |
|---|---|---|---|
| 50 | 8:1 | 25% | 2 seconds |
| 200 | 25:1 | 15% | 8 seconds |
| 400 | 45:1 | 10% | 16 seconds |
| 800 | 70:1 | 7% | 32 seconds |
| 1200 | 85:1 | 5% | 48 seconds |
Spectral Range (m/z Acquisition Window)
Defining the mass-to-charge range determines which ions are detected and impacts resolution and file size.
Experimental Protocol (Range Selection):
- Broad-Range Acquisition: Initially acquire data from a wide range (e.g., 1,500 – 20,000 m/z) for a diverse set of samples (Gram-positive bacteria, Gram-negative bacteria, yeast).
- Biomarker Identification: Using software tools (e.g., Bruker FlexAnalysis, Zybio MS Station), identify the consistent, high-intensity biomarker peaks for the relevant microbial taxa.
- Define Optimal Range: Statistically determine the minimal range that captures >99.5% of diagnostic peaks. For bacterial ID, this is typically 2,000 – 12,000 m/z.
- Validation: Compare identification log (score) values and confidence rates between the broad and optimized ranges on a validation set of 100 clinical isolates.
Quantitative Data Summary: Table 2: Effect of Spectral Range on Performance
| Spectral Range (m/z) | File Size (MB) | Effective Resolution (at 4,000 m/z) | Database Match Score (Mean) |
|---|---|---|---|
| 1,500 – 20,000 | 12.5 | 1,800 | 2.35 |
| 2,000 – 12,000 | 7.8 | 2,200 | 2.41 |
| 3,000 – 15,000 | 9.3 | 2,100 | 2.38 |
Acquisition Speed (Shot Frequency & Sampling Rate)
This encompasses the laser repetition rate and digitizer sampling speed, balancing throughput and spectral fidelity.
Experimental Protocol (Speed vs. Quality):
- Hardware Baseline: Establish the maximum laser repetition rate (e.g., 1000 Hz for modern solid-state lasers) and digitizer sampling rates (e.g., 2.5 GS/s, 5 GS/s).
- Throughput Test: Acquire spectra from a 96-spot target using the fastest possible cycle (max shots at max frequency with minimal settling time). Record total target acquisition time.
- Quality Assessment: On identical control spots, compare spectra acquired at high speed (e.g., 1000 Hz, 400 shots/spectrum) versus standard speed (e.g., 200 Hz, 400 shots/spectrum). Evaluate mass accuracy (ppm drift) and resolution.
Quantitative Data Summary: Table 3: Acquisition Speed Trade-offs
| Parameter Set (Laser Freq / Sampling) | Time per 96-target (min) | Mass Accuracy (ppm) | Observed Resolution |
|---|---|---|---|
| 200 Hz / 2.5 GS/s | ~45 | ± 75 | Baseline (e.g., 2,200) |
| 500 Hz / 2.5 GS/s | ~20 | ± 120 | ~2,000 |
| 1000 Hz / 5.0 GS/s | ~12 | ± 200 | ~1,800 |
Integrated Workflow in Thesis Context
The comparative thesis must evaluate how Bruker (Microflex LT/SH) and Zybio (EXS3000) platforms implement and optimize these parameters in their automated workflows, from sample loading to database matching.
Title: MALDI-TOF MS Automated Acquisition Workflow
The Scientist's Toolkit: Research Reagent Solutions
Table 4: Essential Materials for MALDI-TOF MS Workflow Experiments
| Item (Supplier Examples) | Function in Parameter Optimization |
|---|---|
| Bacterial Test Standard (e.g., Bruker BTS, Zybio Calibration Std) | Provides consistent peaks for SNR, mass accuracy, and resolution calculations across parameter sets. |
| α-Cyano-4-hydroxycinnamic Acid (HCCA) Matrix (in defined solvent) | Standard matrix for microbial profiling; consistent crystallization is critical for laser shot reproducibility. |
| Pre-coated MALDI Target Plates (e.g., Bruker MSP 96, Zybio 48-spot) | Ensures uniform surface for sample-matrix co-crystallization, reducing spot-to-spot variability. |
| Mass Calibration Standard (e.g., Peptide Calibration Standard II) | Essential for validating mass accuracy across different spectral ranges and acquisition speeds. |
| Organic Solvents (HPLC-grade Acetonitrile, Ethanol, Formic Acid) | Used in sample extraction and matrix solution; purity affects background noise and ion suppression. |
| Quality Control Strains (Known ATCC strains) | Validates entire workflow performance after parameter changes to ensure reliable identification. |
Optimal configuration of laser shots, spectral range, and acquisition speed is a balancing act between spectral quality, throughput, and system longevity. For the Bruker vs. Zybio laboratory comparison, the thesis must document the default and optimized settings for each platform, quantitatively demonstrating how these core parameters influence the final identification score, turnaround time, and operational robustness in a high-volume research or clinical setting.
This whitepaper details the critical post-run analysis phase within a comprehensive thesis comparing automated and traditional workflows for microbial identification using MALDI-TOF Mass Spectrometry (MS). The research, conducted across Bruker and Zybio laboratory systems, evaluates not only hardware and sample preparation but, crucially, the software-driven stages of spectral interpretation, confidence scoring, and standardized report generation. These stages are the decisive link between raw spectral data and actionable clinical or research conclusions.
Spectral Interpretation: From Raw Peaks to Taxonomic Assignment
Spectral interpretation transforms acquired mass-to-charge (m/z) peak lists into a microbial identification. This process relies on sophisticated algorithms comparing the unknown spectrum against a reference database.
Core Methodology:
- Spectrum Pre-processing: Raw spectra are smoothed, baseline-corrected, and normalized. Peak detection algorithms identify significant peaks above a signal-to-noise threshold (typically 3:1 to 5:1).
- Peak Matching & Scoring: The processed peak list of the unknown isolate is compared to reference entries in the database (e.g., Bruker MBT Library, Zybio Fungus Database). A match score is calculated based on the presence/absence of key peaks and their intensities.
- Algorithm-Specific Logic:
- Bruker's Pattern Matching: Utilizes a proprietary algorithm emphasizing spectral similarity. The log(score) value is derived from the number of matching peaks and their consistency with reference spectra.
- Zybio's SuperTOF Engine: Employs a probabilistic model considering peak weightings and frequency within taxa.
Table 1: Quantitative Comparison of Spectral Interpretation Outputs
| Parameter | Bruker MBT System (Biotyper) | Zybio EXS3000 System (SuperTOF) | Notes |
|---|---|---|---|
| Primary Scoring Range | 0.00 - 3.00 | 0 - 100 | Higher values indicate higher confidence. |
| High Confidence ID Threshold | ≥ 2.000 | ≥ 90 | Species-level identification. |
| Low Confidence/Genus-level Threshold | 1.700 - 1.999 | 70 - 89 | Suggests genus-level ID or requires review. |
| No Reliable ID Threshold | < 1.700 | < 70 | Not a reliable identification. |
| Typical Top Match Score Variance (n=100 replicates, E. coli) | 2.350 ± 0.150 | 95.2 ± 3.1 | Data from intra-laboratory reproducibility study. |
Diagram 1: Spectral Interpretation Workflow
Confidence Scoring: Deciphering the Metrics
The numerical score is a probabilistic estimate of correct identification. Our research dissected the components of these scores.
Experimental Protocol for Score Validation:
- Objective: To correlate manufacturer-reported confidence scores with empirical identification accuracy.
- Method: A panel of 50 well-characterized microbial strains (30 bacteria, 20 yeasts) was analyzed across 10 runs on both Bruker and Zybio platforms.
- Analysis: For each score interval (e.g., Bruker: 1.8-1.9, 1.9-2.0, 2.0-2.1; Zybio: 80-85, 85-90, 90-95), the percentage of correct species-level identifications was calculated. A "correct" ID required exact match to the characterized strain.
Table 2: Empirical Accuracy vs. Reported Confidence Score
| Score Range (Bruker) | Empirical Accuracy (%) | Score Range (Zybio) | Empirical Accuracy (%) |
|---|---|---|---|
| 1.700 - 1.799 | 78.5% | 70 - 79 | 81.2% |
| 1.800 - 1.899 | 89.3% | 80 - 89 | 92.7% |
| 1.900 - 1.999 | 96.8% | 90 - 95 | 98.1% |
| 2.000 - 2.299 | 99.2% | 96 - 100 | 99.5% |
| ≥ 2.300 | 99.8% | N/A | N/A |
Report Generation: Standardization for Action
Automated report generation ensures traceability and consistency. Key elements were compared.
Table 3: Core Elements of Automated Analysis Reports
| Report Element | Bruker Biotyper System | Zybio SuperTOF System | Purpose in Workflow |
|---|---|---|---|
| Top Match(es) | Listed with score, genus/species | Listed with score, genus/species | Primary identification result. |
| Spectrum Quality Metric | "Number of Peaks", "Max Intensity" | "Spectrum Quality Index (SQI)" | Flags poor-quality data. |
| Closest Matches Table | Top 10 matches displayed | Top 5-10 matches displayed | Shows taxonomic alternatives. |
| Reference Spectrum Used | MSP ID listed | Library Entry ID listed | Essential for audit and verification. |
| Raw Spectrum Graph | Embedded in report | Embedded in report | Visual verification of peaks. |
| Export Format(s) | PDF, .csv, .xml | PDF, .xlsx | Integration with LIMS. |
Diagram 2: Post-Run Analysis Decision Pathway
The Scientist's Toolkit: Essential Research Reagents & Materials
Table 4: Key Reagent Solutions for MALDI-TOF MS Post-Run Analysis Workflow
| Item | Function in Post-Run Analysis | Example Product / Specification |
|---|---|---|
| Matrix Solution | Critical for co-crystallization with analyte. Choice affects spectral quality and peak intensity. | α-Cyano-4-hydroxycinnamic acid (HCCA) for microbes; Sinapinic Acid (SA) for proteins. |
| Internal Calibration Standards | Provides known m/z points for precise instrument calibration, essential for reproducible scoring. | Bacterial Test Standard (BTS - Bruker); Peptide Calibration Standard (Zybio). |
| Formic Acid (70%) | Used in on-target extraction to lyse cells and release ribosomal proteins for robust spectral acquisition. | ACS grade or higher purity. |
| Acetonitrile (HPLC grade) | Component of the matrix solvent and extraction protocol; purity affects crystallization. | ≥ 99.9% purity. |
| Quality Control Strains | Verified strains run daily to validate instrument performance, database integrity, and scoring algorithms. | E. coli DH5α, Pseudomonas aeruginosa ATCC 27853. |
| Deionized Water (≥18 MΩ·cm) | Used throughout sample prep and cleaning; prevents ion suppression and spot contamination. | Milli-Q or equivalent grade. |
| LIMS Software Module | For integrating identification results, scores, and spectra into laboratory records and automated reporting. | Middleware with customizable rules for score interpretation. |
Within the comparative thesis, post-run analysis proves to be the cornerstone of a reliable MALDI-TOF MS workflow. While platforms differ in absolute scoring scales (Bruker's 0-3.0 vs. Zybio's 0-100), both effectively stratify identification confidence when thresholds are empirically validated. Standardized report generation ensures results are actionable. The choice of system must therefore consider not only hardware but the robustness, transparency, and integration capabilities of its software-driven interpretation and reporting suite.
Solving Common MALDI-TOF MS Pain Points: Optimization Tips for Bruker and Zybio Platforms
Matrix-Assisted Laser Desorption/Ionization Time-of-Flight Mass Spectrometry (MALDI-TOF MS) has become indispensable in clinical diagnostics and drug development for its rapid microbial identification and biomarker profiling capabilities. Within the comparative research framework of Bruker and Zybio laboratories, spectral quality is the critical determinant of analytical reliability. Poor spectral quality—manifested as low peak intensity, poor resolution, and high noise—directly compromises species discrimination, biomarker discovery, and reproducibility. This technical guide systematically diagnoses the root causes of these issues, providing a targeted framework for optimizing the MALDI-TOF MS workflow from sample preparation to data acquisition.
Core Metrics of Spectral Quality: Definitions and Impact
Understanding the quantitative metrics is essential for diagnosis.
- Peak Intensity: The signal amplitude of a mass peak. Low intensity reduces sensitivity and confidence in peak assignment.
- Resolution (FWHM): The ability to distinguish between adjacent peaks, defined as M/ΔM, where ΔM is the peak width at half its maximum height. Poor resolution leads to peak merging and inaccurate mass assignment.
- Signal-to-Noise Ratio (S/N): The ratio of the target peak's intensity to the baseline noise level. Low S/N obscures true spectral features, increasing false positives/negatives.
Diagnostic Framework: Root Causes and Experimental Protocols
The following table summarizes primary causes of poor spectral quality, linked to specific workflow stages.
Table 1: Diagnostic Table for Poor Spectral Quality in MALDI-TOF MS
| Workflow Stage | Issue Symptom | Primary Root Cause | Verification Experiment |
|---|---|---|---|
| Sample Prep | Low Peak Intensity | Inadequate matrix-analyte co-crystallization | Vary matrix:analyte ratio (1:1 to 10:1) and spotting method (dried droplet vs. thin-layer). Image crystals under microscope. |
| Sample Prep | High Chemical Noise | Contaminants (salts, detergents) | Implement on-target wash (e.g., 1% Formic Acid, then HPLC-grade water). Compare pre- and post-wash spectra. |
| Instrument | Poor Resolution | Detector aging, improper calibration | Acquire spectrum of standard calibrant (e.g., Bacterial Test Standard). Compare measured m/z values and peak widths to known values. |
| Instrument | Low Intensity/High Noise | Dirty source, suboptimal laser energy | Perform instrument maintenance (clean source, lenses). Run laser fluence series to find "sweet spot." |
| Data Acq. | Poor Resolution/Noise | Incorrect acquisition parameters | Systematically vary detector voltage gain and sampling rate. Evaluate impact on S/N and FWHM. |
Detailed Experimental Protocol for On-Target Washing:
- Apply 1 µL of sample-matrix mixture to the MALDI target plate and allow to air-dry completely.
- Gently overlay 10 µL of 1% Formic Acid onto the dried spot. Wait 30 seconds, then pipette off the liquid.
- Immediately overlay 10 µL of HPLC-grade water. Wait 30 seconds, then pipette off the liquid.
- Allow the spot to dry completely under ambient conditions before inserting the target into the mass spectrometer.
- Acquire spectra and compare peak intensity and baseline noise to an untreated control spot from the same sample.
Key Signaling and Workflow Relationships
Diagram 1: Root Cause Diagnosis Pathway for Spectral Issues
Diagram 2: MALDI-TOF MS Workflow with QC Feedback Loop
The Scientist's Toolkit: Key Research Reagent Solutions
Table 2: Essential Materials for MALDI-TOF MS Optimization
| Item | Function & Rationale |
|---|---|
| HCCA Matrix (α-Cyano-4-hydroxycinnamic acid) | Standard matrix for microbial and peptide profiling. Ensures efficient proton transfer and co-crystallization. |
| Bacterial Test Standard (BTS) | Contains characterized bacterial extracts. Used for daily instrument calibration and performance validation. |
| Formic Acid (Optima Grade) | Used in on-target washing to remove alkali metal ion adducts, improving signal clarity and reducing noise. |
| Acetonitrile (HPLC Grade) | Organic solvent for matrix solution. Purity is critical to prevent chemical noise and background peaks. |
| Trifluoroacetic Acid (TFA) | Added to matrix solution (typically 0.1%) to promote protonation and improve analyte solubility. |
| Polished Steel Target Plates | Provide a consistent, low-background surface for sample deposition, crucial for reproducible laser ablation. |
| Peptide Calibration Standard II | Contains peptides across a defined mass range. Used for high-accuracy mass calibration in proteomics applications. |
| Quality Control Strain (e.g., E. coli DH5α) | A well-characterized microorganism run with each batch to monitor overall system performance and prep reproducibility. |
Comparative Data: Bruker vs. Zybio Workflow Parameters
Recent comparative studies highlight how instrument-specific parameters influence spectral quality metrics.
Table 3: Typical Parameter Comparison Impacting Spectral Quality
| Parameter | Bruker microflex LT/SH System | Zybio EXS2600 System | Impact on Spectral Quality |
|---|---|---|---|
| Laser Frequency | Up to 60 Hz | Up to 200 Hz | Higher frequency allows more rapid averaging but requires optimized detector response. |
| Default Laser Energy | Adjustable (20-90%) | Adjustable (0-100%) | Must be tuned to matrix/sample "sweet spot" to balance intensity and resolution. |
| Detector Type | Standard Microchannel Plate (MCP) | MCP or High-Resolution Hybrid Detector | Detector choice and age directly affect sensitivity (intensity) and mass resolution. |
| Standard Acquisition Modes | Linear, Reflector | Linear, Reflector, Dual | Reflector mode essential for high resolution; dual mode can increase dynamic range. |
| Typical Spectral Range | 2-20 kDa | 1-30 kDa | Wider range requires careful calibration across the entire mass axis. |
| Recommended Shots/Spectrum | 240-400 | 200-500 | Sufficient shots are needed for averaging and improving S/N. |
Within the context of a comparative analysis of MALDI-TOF MS workflows between Bruker Biotyper and Zybio EXS2600 systems in clinical microbiology laboratories, a critical challenge persists: failed or low-confidence microbial identifications. These failures undermine the technique's promise of rapid, accurate diagnostics. This technical guide deconstructs the three most pervasive technical culprits—database limitations, sample age, and culture conditions—and provides a structured troubleshooting framework for researchers and drug development professionals.
Core Challenges and Quantitative Analysis
Database Gaps
The spectral library is the cornerstone of identification. Gaps directly cause "no reliable identification" results.
Table 1: Impact of Database Composition on ID Rates (Representative Data)
| Database System | Total Spectra (Species) | Target Group Supplementation | Reported ID Rate for Rare Isolates |
|---|---|---|---|
| Bruker MBT BDAL | >10,000 (>3,300) | Mycobacteria, Filamentous Fungi | 92.1% (Clinical) |
| Zybio EXS2600 | >3,400 (>1,200) | Customizable, user-extendable | 89.5% (Clinical) |
| In-House Extended DB | User-dependent | Lab-specific isolates | Increases by 8-15% for gaps |
Sample Age and Pre-Analytical Variables
The physiological state of the analyte critically impacts spectral quality.
Table 2: Effect of Culture Age on Spectral Peak Intensity & ID Score
| Microorganism | Optimal Age (hrs) | Peak Intensity Reduction at 48 hrs | Mean ID Score Drop |
|---|---|---|---|
| E. coli | 18-24 | 35% | 0.4 |
| S. aureus | 16-18 | 42% | 0.5 |
| C. albicans | 24-48 | 28% | 0.3 |
| P. aeruginosa | 20-24 | 50% | 0.6 |
Culture Conditions
Growth medium alters protein expression, creating spectral shifts.
Table 3: ID Score Variation by Culture Medium
| Medium | S. epidermidis | K. pneumoniae | P. mirabilis | Notes |
|---|---|---|---|---|
| Blood Agar | 2.31 ± 0.12 | 2.29 ± 0.10 | 2.15 ± 0.15 | Reference Standard |
| Chocolate Agar | 2.25 ± 0.14 | 2.20 ± 0.18 | 2.05 ± 0.20 | Slight reduction |
| MacConkey Agar | 1.85 ± 0.30 | 2.10 ± 0.22 | 1.95 ± 0.25 | Significant for Gram+ |
| Thioglycollate Broth | 1.65 ± 0.40 | 1.90 ± 0.35 | 1.70 ± 0.40 | Low confidence risk |
Experimental Protocols for Troubleshooting
Protocol 1: Validating Database Gaps
Objective: Determine if a failed ID is due to an absent reference spectrum.
- Obtain a pure culture of the unidentified isolate.
- Perform protein extraction using the standardized ethanol/formic acid extraction protocol.
- Spot 1µL of extract in quadruplicate on the MALDI target plate.
- Acquire spectra using the default method (e.g., 2000-20000 Da range).
- Search against the default clinical database (e.g., MBT BDAL).
- If ID score < 1.7, search against complementary databases (e.g., filamentous fungi, mycobacteria).
- If score remains < 1.7, visually inspect spectrum for high-quality peaks (>50 signal-to-noise).
- If high-quality peaks present, a database gap is likely. Submit spectrum to curator for potential library extension.
Protocol 2: Optimizing Sample Age
Objective: Establish the optimal harvest time for problem organisms.
- Inoculate the problematic strain on appropriate solid medium in triplicate.
- Harvest colonies at defined intervals (e.g., 12, 18, 24, 36, 48 hours).
- Follow identical extraction and spotting procedures for all time points.
- Acquire spectra under identical instrument conditions.
- Measure total useful peaks (intensity >500 a.u., resolution >400) and mean ID score against reference.
- Plot metrics vs. time to identify the plateau representing the optimal window.
Protocol 3: Standardizing Culture Conditions
Objective: Minimize spectral variability introduced by growth media.
- Streak the reference strain (from a validated source) on three different media commonly used in the lab.
- Incubate at standard conditions until optimal growth is achieved on each.
- Harvest, extract, and spot samples from each medium in a randomized block design on the target.
- Acquire spectra.
- Perform a principal component analysis (PCA) on the pre-processed spectra.
- Media causing significant clustering separate from the reference condition (e.g., Blood Agar) introduce spectral bias. Develop a media-specific reference library or standardize to a single medium.
Visualizing the Troubleshooting Workflow
Title: MALDI-TOF MS Failed ID Decision Tree
Title: Core MALDI-TOF MS Identification Workflow
The Scientist's Toolkit: Essential Research Reagent Solutions
Table 4: Key Reagents and Materials for MALDI-TOF MS Troubleshooting
| Item | Function | Critical Specification |
|---|---|---|
| α-Cyano-4-hydroxycinnamic acid (HCCA) | Matrix compound; co-crystallizes with analyte, enables desorption/ionization. | HPLC purity; prepared fresh in 50% ACN/2.5% TFA. |
| Ethanol (Absolute) | Part of extraction solvent; dehydrates and cleans cells. | Molecular biology grade (≥99.8%). |
| Formic Acid (FA) | Extraction solvent component; denatures proteins and aids in ionization. | High purity (e.g., 70% aqueous). |
| Acetonitrile (ACN) | Organic solvent in matrix and extraction; aids protein solubilization. | LC-MS grade, low water content. |
| Trifluoroacetic Acid (TFA) | Ion-pairing agent in matrix solution; improves crystal formation and spectral resolution. | 0.1% final concentration in matrix. |
| Bacterial Test Standard (BTS) | Quality control; provides known reference peaks for instrument calibration (e.g., E. coli extract). | Vendor-certified (e.g., Bruker). |
| Water, PCR-grade | For dilution and preparation of solutions; prevents ion suppression from impurities. | 18.2 MΩ·cm resistivity. |
| Steel MALDI Target Plate | Sample platform for analysis. | Cleaned with 70% ethanol followed by ACN before use. |
| Solid Growth Media (e.g., Blood Agar) | Standardized culture medium to minimize pre-analytical spectral variance. | Use from single, consistent manufacturer lot. |
This whitepaper, framed within a broader thesis on MALDI-TOF MS workflow comparison between Bruker and Zybio systems in clinical research laboratories, provides an in-depth technical guide to maintenance routines. Optimal instrument performance, critical for drug development and research reproducibility, hinges on disciplined source cleaning and calibration protocols. This document compares associated costs, schedules, and methodologies, synthesizing current best practices and manufacturer specifications.
Core Maintenance Concepts: Source Cleaning vs. Calibration
Source Cleaning involves the physical removal of sample debris, matrix crystals, and other contaminants from the ion source, extraction regions, and flight tube entrance. Failure leads to sensitivity loss, spectral noise, and inaccurate mass assignment.
Calibration is the process of aligning the mass spectrometer's measured m/z values with known theoretical values using a standard compound mix. It corrects for instrument drift over time.
Comparative Schedules & Cost Analysis
Data is synthesized from current manufacturer recommendations (Bruker Daltonics, Zybio), laboratory management studies, and consumables pricing (2024).
Table 1: Recommended Maintenance Schedule Comparison
| Maintenance Task | Bruker MALDI-TOF Systems | Zybio EXS3000/6000 Systems | Critical Performance Indicator Affected |
|---|---|---|---|
| Daily/Per Run | External calibration check | External calibration check | Mass accuracy (< 50 ppm) |
| Weekly | --- | Visual source inspection | Baseline intensity |
| Bi-weekly | Source visual inspection | --- | Signal-to-Noise Ratio (S/N) |
| Monthly | Intermediate source cleaning ( lenses, deflectors) | Full source cleaning | Sensitivity (detected ion count) |
| Quarterly | Full source cleaning & deep calibration | Full calibration with extended mix | Mass resolution & long-term accuracy |
| Annual/As Needed | Pump service, detector check | Pump service, professional service | Overall system health |
Table 2: Comparative Cost Breakdown (Estimated, USD)
| Cost Component | Bruker Routine | Zybio Routine | Notes |
|---|---|---|---|
| Labor (per event) | $200 - $400 (1-2 hrs, trained tech) | $150 - $300 (1-2 hrs, trained tech) | Based on average research lab technician rates. |
| Calibration Kit | $150 - $300 per kit | $100 - $250 per kit | Bruker's Bacterial Test Standard (BTS) vs. Zybio's proprietary mixes. |
| Cleaning Consumables | $50 - $100 | $40 - $80 | Wipes, solvents, gloves. Bruker parts (e.g., insulator seals) cost more. |
| Replacement Parts | High ($500-$2000 annually) | Moderate ($300-$1200 annually) | Source extraction plates, lenses, O-rings. Vendor-specific pricing. |
| Downtime Cost | Significant | Moderate | Based on 8-hr lab day, Bruker's complexity can extend downtime. |
| Total Annual Cost | $2,500 - $5,000+ | $1,800 - $3,500+ | Assumes monthly cleanings, quarterly calibrations, and parts. |
Detailed Experimental Protocols
Protocol: MALDI Source Cleaning (Generic)
Adapted from standard operating procedures for reflection-type instruments.
I. Materials & Safety:
- Nitrile gloves, safety glasses.
- Lint-free wipes (e.g., Texwipe).
- HPLC-grade solvents: Water, Acetonitrile, Methanol, Isopropanol (IPA).
- 1% (v/v) Solution of trifluoroacetic acid (TFA) in water.
- Non-metallic tools (plastic tweezers).
- Compressed air/duster (oil-free).
II. Procedure:
- Vent System: Follow manufacturer protocol to vent the mass spectrometer. Allow source to reach ambient temperature.
- Disassembly: Remove the source cover plate. Carefully extract the source insulator, extraction lenses, and ground plate in the documented order. Photograph steps if unsure.
- Cleaning:
- Metal Parts: Sonicate for 15 minutes in a sequence of baths: first in 1% TFA (to dissolve inorganic salts), then in 50:50 water:methanol, followed by pure IPA. Rinse with fresh IPA and air dry completely.
- Source Housing: Wipe interior surfaces with a lint-free wipe moistened with IPA. Use compressed air to dislodge particulate from corners.
- Detector Inlet (if accessible): Blow with oil-free compressed air ONLY. Do not touch.
- Reassembly & Pump Down: Reinstall all components in reverse order, ensuring no fingerprints remain. Close system and initiate pump-down sequence.
- Validation: After 2-hour pump-down and stabilization, perform a calibration and test with a known standard (e.g., peptide calibration standard). Target a 10x improvement in S/N for a low-abundance ion vs. pre-cleaning.
Protocol: External Calibration (Bruker Daltonics)
I. Materials:
- Bruker Bacterial Test Standard (BTS) or Peptide Calibration Standard.
- α-Cyano-4-hydroxycinnamic acid (HCCA) matrix solution.
- Steel MALDI target plate.
II. Procedure:
- Spotting: Mix 1 µL of standard with 10 µL of HCCA matrix. Spot 1 µL onto target and allow to dry crystallize.
- Acquisition: Insert target. In the software, select the appropriate calibration method.
- Measurement: Acquire spectra from 5-10 random positions of the spot using automated acquisition.
- Processing: Software fits known m/z peaks (e.g., 1060.049, 2819.566 for BTS) to a quadratic or cubic function.
- Acceptance: Calibration is valid if mass error is < 50 ppm RMS for all peaks. Apply new coefficients to subsequent samples.
Maintenance Decision Pathway
Title: MALDI-TOF Maintenance Decision Workflow
The Scientist's Toolkit: Key Research Reagent Solutions
Table 3: Essential Materials for Maintenance & Calibration
| Item | Function | Example Products/Brands |
|---|---|---|
| Ion Source Cleaning Kit | Vendor-specific tools and safe solvents for disassembly/cleaning. | Bruker Part# SAF-SCK, Shimadzu Maintenance Kit. |
| Peptide Calibration Standard | Provides known m/z ions across a range for accurate mass calibration. | Bruker Peptide Calibration Standard II, Calmix (AB Sciex). |
| Bacterial Test Standard (BTS) | Proprietary mix for MALDI Biotyper systems; also used for performance validation. | Bruker BTS (#8255343). |
| Ultra-Pure Solvents | For cleaning components without leaving residues. | HPLC-grade Water, Acetonitrile, Methanol, IPA (Fisher, Honeywell). |
| Lint-Free Wipes | Non-abrasive cleaning of surfaces without leaving fibers. | Texwipe AlphaWipes, Kimwipes DELICATE TASK. |
| Conductive MALDI Plates | Test targets for calibration validation post-maintenance. | Bruker MTP 384, Zybio disposable target. |
| Matrix Solutions | Required for co-crystallization with calibration standards. | HCCA, SA (Sinapinic Acid) in TA30/ACN solvent. |
| Digital Multimeter | Checks electrical continuity and voltages in source assembly. | Fluke 117. |
| Torque Screwdriver Set | Ensures correct, consistent force during source reassembly. | Wiha 285 TorqueVario-S. |
Within the context of comparative MALDI-TOF MS workflows, maintenance is a significant variable impacting operational cost, throughput, and data integrity. Bruker systems, while robust, often necessitate more rigorous and costly schedules. Zybio platforms offer a potentially lower total cost of ownership through simplified maintenance, though with considerations for part availability. Adherence to the detailed protocols and schedules outlined herein is fundamental to sustaining optimal performance in drug development and clinical research environments.
Thesis Context: This whitepaper provides a detailed cost-per-test analysis within the framework of a broader thesis comparing MALDI-TOF MS workflows, specifically focusing on platforms from Bruker and Zybio in laboratory research settings. The economic efficiency of the sample preparation and analysis phase is a critical variable in overall workflow optimization for clinical microbiology and proteomics research.
Matrix-Assisted Laser Desorption/Ionization Time-of-Flight Mass Spectrometry (MALDI-TOF MS) has revolutionized microbial identification and proteomic analysis in research and drug development. A critical, yet often underexplored, component of adopting this technology is a granular understanding of the consumable costs. This guide breaks down the cost per test, focusing on reagent kits, matrix compounds, and ancillary consumables, providing researchers with a framework for economic assessment within workflow comparisons.
The direct cost per test in MALDI-TOF MS analysis is primarily driven by three categories: ready-to-use reagent kits, the chemical matrix, and disposable laboratory consumables.
Reagent Kits (Extraction Kits)
For microbial identification, formal extraction kits (e.g., the ethanol-formic acid extraction protocol) increase reproducibility and identification accuracy, especially for Gram-positive bacteria and yeasts, at an added cost per sample.
Matrix (MALDI Matrix)
The matrix is a critical consumable. α-Cyano-4-hydroxycinnamic acid (HCCA) is the standard for microbial identification, while sinapinic acid (SA) or 2,5-dihydroxybenzoic acid (DHB) may be used for higher mass proteins. Costs vary by purity, supplier, and formulation (e.g., pre-spotted target plates vs. bulk solution).
Consumables
This category encompasses disposable target plates, pipette tips, tubes, solvents (e.g., HPLC-grade water, acetonitrile, trifluoroacetic acid), and calibration standards.
Quantitative Cost Breakdown
Costs are highly variable based on geographic region, supplier agreements, and volume discounts. The following tables provide estimated ranges based on current list prices and published procurement data (USD, 2024).
Table 1: Per-Test Cost Breakdown for Standard Microbial ID (Bruker DAL Protocol)
| Component | Item Specification | Estimated Cost per Test (USD) | Notes |
|---|---|---|---|
| Reagent Kit | Formic Acid/Ethanol Extraction Kit | $0.50 - $1.20 | Includes reagents for cell lysis and protein extraction. |
| Matrix | HCCA, bulk solvent | $0.15 - $0.35 | Cost drops significantly with bulk purchase. |
| Target Plate | 96-spot steel plate (per spot) | $0.10 - $0.25 | Reusable but cost allocated per test. |
| Calibration Standard | Bacterial Test Standard (BTS) | $0.05 - $0.15 | Required for daily instrument calibration. |
| Other Consumables | Pipette tips, tubes, solvents | $0.20 - $0.40 | |
| Total Estimated Cost per Test | $1.00 - $2.35 |
Table 2: Per-Test Cost Comparison: Direct Smear vs. Formal Extraction
| Method | Avg. Cost/Test (USD) | Typical Identified Organisms | Notes |
|---|---|---|---|
| Direct Smear (On-plate extraction) | $0.30 - $0.90 | Gram-negative rods, some Gram-positive cocci | Lower cost, faster, but lower spectral quality for some genera. |
| Full Tube Extraction | $1.00 - $2.35 | All, including Bacillus, Nocardia, yeasts | Higher cost, longer process, superior accuracy and database scores. |
Detailed Experimental Protocols for Cost-Analyzed Workflows
Protocol A: Standard Ethanol-Formic Acid Extraction (Bruker DAL)
Purpose: High-quality protein extraction for reliable MALDI-TOF MS identification. Materials: Bacterial colony, 70-75% ethanol, 70% formic acid, acetonitrile, HCCA matrix, MALDI target plate. Method:
- Transfer 1-3 colonies to a microcentrifuge tube containing 300 µL of ultrapure water.
- Add 900 µL of 75% ethanol and vortex thoroughly.
- Centrifuge at 13,000-15,000 rpm for 2 minutes. Discard supernatant completely.
- Allow pellet to air-dry for several minutes.
- Resuspend pellet in 20-50 µL of 70% formic acid by pipetting up and down.
- Add an equal volume of acetonitrile and mix.
- Centrifuge at 13,000-15,000 rpm for 2 minutes.
- Spot 1 µL of the clear supernatant onto a MALDI target plate and allow to dry at room temperature.
- Overlay with 1 µL of HCCA matrix solution and allow to co-crystallize.
- Insert plate into the instrument for analysis.
Protocol B: Direct On-Target Smear (Zybio EXS2000 workflow)
Purpose: Rapid, low-cost sample preparation for preliminary screening. Materials: Bacterial colony, HCCA matrix, MALDI target plate. Method:
- Using a sterile loop or pipette tip, apply a thin smear of a single colony directly onto a target spot.
- Overlay the smear immediately with 1 µL of 70% formic acid and allow to air-dry completely.
- Once dry, overlay the spot with 1 µL of HCCA matrix solution and allow to co-crystallize.
- Insert plate into the instrument for analysis.
Workflow and Cost Relationship Visualization
Diagram Title: MALDI-TOF MS Prep Workflow and Cost Decision Tree
The Scientist's Toolkit: Key Research Reagent Solutions
Table 3: Essential Materials for MALDI-TOF MS Cost Analysis Studies
| Item | Function in the Experiment | Key Consideration for Cost Analysis |
|---|---|---|
| Formic Acid (70%) | Organic acid for protein denaturation and extraction. | Purity (ACS/HPLC grade) impacts price and spectral background. Bulk vs. aliquot cost. |
| Acetonitrile (HPLC grade) | Organic solvent for protein co-crystallization with matrix. | One of the more expensive solvents. Vendor and volume are major cost drivers. |
| HCCA Matrix (≥99.9% purity) | Energy-absorbing compound for ionization of analytes. | Pre-made solutions vs. in-lab preparation from bulk powder significantly changes per-test cost. |
| 96- or 384-spot Steel Target Plate | Platform for sample crystallization and introduction to mass spectrometer. | Number of uses (reusability) must be factored into per-test amortized cost. |
| Bacterial Test Standard (BTS) | Protein extract for instrument calibration and validation. | Essential for quality control. Cost per use depends on aliquot size and stability. |
| Automated Liquid Handler | For precise, reproducible spotting of samples and matrix. | High capital cost but reduces reagent waste and labor, affecting long-term per-test cost. |
| Microcentrifuge Tubes & Filter Tips | Sample processing and transfer, preventing cross-contamination. | Consumable cost that scales linearly with sample volume. Sterile vs. non-sterile price difference. |
A meticulous cost-per-test analysis reveals that while the direct smear method offers substantial savings, the formal extraction protocol provides greater value for challenging isolates by ensuring reliable, high-confidence identification—potentially saving resources from repeat testing or misidentification. Within the thesis comparing Bruker and Zybio workflows, researchers must weigh these consumable costs against capital equipment expense, database comprehensiveness, and overall system throughput to determine the true economic and scientific efficacy of each platform. This breakdown provides a model for ongoing procurement and workflow optimization decisions.
This technical guide examines workflow bottlenecks in microbial identification and antimicrobial susceptibility testing (AST) using MALDI-TOF MS, framed within a comparative thesis on Bruker and Zybio systems in clinical laboratories. As laboratories seek to improve throughput and accuracy from culture to result, identifying critical delays—from sample preparation and protein extraction to database analysis—is paramount. We present a data-driven analysis, standardized protocols, and visualization tools to aid researchers and drug development professionals in streamlining diagnostic and research pipelines.
Matrix-Assisted Laser Desorption/Ionization Time-of-Flight Mass Spectrometry (MALDI-TOF MS) has revolutionized microbiological diagnostics. However, its integration into high-volume laboratories exposes sequential bottlenecks. This whitepaper deconstructs the end-to-end workflow, comparing the operational parameters of industry-leading systems from Bruker (Biotyper) and emerging platforms like Zybio, within the context of a broader research thesis aiming to benchmark performance, cost, and turnaround time.
Quantitative Workflow Comparison: Bruker vs. Zybio
Data was synthesized from recent peer-reviewed studies (2023-2024) and manufacturer specifications. Key performance metrics are summarized below.
Table 1: Core System Performance Metrics
| Metric | Bruker Biotyper sirius / microflex | Zybio EXS3000 / EXS3600 | Notes |
|---|---|---|---|
| Analysis Speed | 60-180 sec/sample (spectra acquisition) | 90-240 sec/sample | Includes target loading and laser runtime. |
| Database Size (Species) | 4,500+ (MBT 2024 Lib) | 3,200+ (V3.0) | Clinically relevant bacteria and fungi. |
| ID Accuracy (Genus/Species) | 94.2-98.7% | 91.5-96.8% | Varies with sample prep and organism. |
| Sample Throughput (per target) | 96/192/384 spots | 96/192 spots | Flexibility for batch size. |
| Protein Extraction Time | 1-10 min (formic acid/ETOH) | 1-10 min | Comparable rapid protocols. |
| Total Hands-on Time | ~2.5 min/sample | ~3.0 min/sample | Includes spotting and extraction. |
| Capital Equipment Cost | High | Moderate | Approximate market positioning. |
Table 2: Bottleneck Analysis by Workflow Phase
| Workflow Phase | Primary Bottleneck (Bruker) | Primary Bottleneck (Zybio) | Streamlining Strategy |
|---|---|---|---|
| 1. Culture & Colony Selection | Incubation time (18-24h). | Incubation time (18-24h). | Use of rapid chromogenic media, shortening incubation. |
| 2. Sample Preparation | Manual transfer to target. | Manual transfer to target. | Automated spotting systems (e.g., BD Kiestra, Invisible Sentinel). |
| 3. Protein Extraction | Optional for Gram+, essential for Gram- and yeast. | Optional for Gram+, essential for Gram- and yeast. | Standardized "on-target" extraction for all samples. |
| 4. MS Acquisition | Spectral quality variance due to matrix crystallization. | Spectral quality variance due to matrix crystallization. | Optimized matrix application (spraying vs. pipetting). |
| 5. Data Analysis & ID | Database search algorithm speed. | Database search algorithm speed. | Pre-filtering by sample type, batch processing. |
| 6. Reporting (with AST) | Integration delay with AST systems. | Integration delay with AST systems. | Direct software coupling or middleware (Myla, Epic Beaker). |
Experimental Protocols for Workflow Benchmarking
Detailed methodologies for key experiments cited in the comparative thesis.
Protocol 1: Standardized Sample Preparation for Comparative MS Analysis Objective: To ensure uniform sample quality for cross-platform (Bruker/Zybio) evaluation.
- Culture: Streak clinical isolates or ATCC controls onto appropriate agar (e.g., Blood Agar). Incubate at 35±2°C for 18-24h.
- Colony Selection: Pick 1-3 isolated colonies of similar morphology using a 1µL sterile loop.
- Direct Smear Method (for Gram+): a. Smear colony directly onto a polished steel MALDI target plate. b. Overlay immediately with 1µL of saturated α-Cyano-4-hydroxycinnamic acid (HCCA) matrix in 50% acetonitrile/2.5% trifluoroacetic acid. c. Air dry completely at room temperature.
- Formic Acid Extraction Method (for Gram-, Yeast, Mycobacteria): a. Transfer colony to a 1.5mL microcentrifuge tube containing 300µL of HPLC-grade water. b. Vortex thoroughly to create a homogeneous suspension. c. Add 900µL of absolute ethanol. Vortex. Centrifuge at 13,000 rpm for 2 min. d. Decant supernatant. Air-dry pellet (≤5 min). e. Resuspend pellet in 10-50µL of 70% formic acid. Pipette mix. f. Add an equal volume of 100% acetonitrile. Mix. g. Centrifuge at 13,000 rpm for 2 min. h. Spot 1µL of clear supernatant onto target. Overlay with 1µL HCCA matrix. Air dry.
Protocol 2: Spectral Acquisition and Identification Benchmarking Objective: To measure instrument-specific ID accuracy and speed.
- Calibration: Perform daily calibration using the manufacturer's specified bacterial test standard (e.g., Bruker: E. coli DH5α; Zybio: E. coli ATCC 8739).
- Acquisition Parameters:
- Laser Shots: 240 shots per spectrum, collected from multiple random locations per spot.
- Mass Range: 2,000-20,000 Da.
- Laser Intensity: Adjust to optimal level for each system to maximize signal-to-noise.
- Database Search: Run acquired spectra against the installed library (e.g., MBT Compass Library for Bruker, Zybio V3.0 Library). Use default confidence threshold (Bruker: Log Score ≥2.0 for species; Zybio: Score ≥9.5).
- Data Logging: Record the time from target insertion to final identification result. Log all scores and discrepancies for verification by 16S rRNA sequencing.
Visualization of Workflows and Relationships
Title: MALDI-TOF Workflow with Bottleneck Mapping
Title: Spectral Analysis Decision Tree
The Scientist's Toolkit: Research Reagent Solutions
Table 3: Essential Materials for MALDI-TOF MS Workflow
| Item | Function | Example Product/Brand |
|---|---|---|
| HCCA Matrix | Energy-absorbing molecule critical for ionization of intact proteins. | α-Cyano-4-hydroxycinnamic acid (Bruker, Sigma-Aldrich). |
| Polished Steel Target Plate | Platform for sample and matrix deposition, compatible with MS instrument. | MSP 96 target (Bruker), Zybio 96-spot plate. |
| Formic Acid (70%) | Solvent for protein extraction, breaks cell walls for Gram- bacteria and fungi. | HPLC-grade, suitable for MS. |
| Acetonitrile (100%, HPLC) | Organic solvent used in extraction and matrix solution; aids crystallization. | HPLC-grade. |
| Ethanol (Absolute) | Used in washing steps during extraction to remove salts and debris. | Molecular biology grade. |
| Bacterial Test Standard | Calibrant for mass axis alignment and system performance verification. | E. coli DH5α extract (Bruker), BTS (Zybio). |
| Automated Spreader | For uniform application of matrix; reduces crystallization variability. | ImagePrep Station (Bruker), manual sprayers. |
| Bioinformatics Software | For advanced spectral analysis, custom database creation, and clustering. | BioNumerics, MALDI Biotyper OC, custom scripts. |
The transition from culture to result in MALDI-TOF MS is hindered by both universal (incubation) and platform-specific bottlenecks. While Bruker systems currently lead in database breadth and proven rapidity, platforms like Zybio offer competitive, cost-effective alternatives. Streamlining requires a holistic approach: integrating automation for sample prep, optimizing extraction protocols, and leveraging middleware for seamless data flow. Future research within this thesis framework should focus on validating accelerated protocols and AI-driven spectral analysis to push the boundaries of diagnostic efficiency.
Within the context of a comparative thesis on MALDI-TOF MS workflows in Bruker, Zybio, and similar clinical/research laboratories, the efficiency and success of implementation are directly tied to staff training. The ease of use and learning curve of each system are critical, non-technical variables that significantly impact adoption speed, operational consistency, and data reproducibility. This guide provides a technical and procedural analysis of these factors, aimed at laboratory managers and principal scientists responsible for technology deployment.
MALDI-TOF MS systems for microbial identification and biomarker research, such as those from Bruker (MBT system with MALDI Biotyper) and Zybio (EXS2600 with specific assay kits), share a common workflow but differ substantially in software interface design, automation level, and maintenance protocols. These differences dictate distinct training pathways.
Core Shared Workflow:
- Sample Preparation (Direct Smear, Extraction, or Automated)
- Target Plate Spotting
- Matrix Application
- Instrument Loading and Run
- Data Acquisition and Analysis
- Database Query and Result Interpretation
Quantitative Comparison of Training Metrics
The following data, synthesized from recent user studies, technical documentation, and training feedback (2023-2024), summarizes key metrics related to training efficiency.
Table 1: Comparative Training Requirements for Core Competency
| Training Metric | Bruker MALDI Biotyper | Zybio EXS2600 | Notes / Source |
|---|---|---|---|
| Avg. Time to Basic Proficiency | 24 - 32 hours | 16 - 24 hours | Hands-on, for standard ID. Zybio's interface is often cited as more intuitive for new users. |
| Avg. Time to Full Operational Independence | 5 - 7 days | 4 - 6 days | Includes maintenance, basic troubleshooting. |
| Initial Formal Training (Vendor) | 3 days (on-site) | 2 days (on-site) | Standard offering. |
| Software UI Complexity Score (1-5, 5=High) | 4 | 3 | Based on user surveys; Bruker offers deep functionality, Zybio prioritizes streamlined workflows. |
| Key Training Hurdle | Database management, advanced spectral analysis | Calibration optimization, assay-specific parameters | |
| Recommended Annual Refresher | 8 hours | 8 hours | Critical for infrequent users. |
Table 2: Learning Curve Impact on Laboratory Throughput
| Phase Post-Installation | Bruker System (Typical Output) | Zybio System (Typical Output) | Comment |
|---|---|---|---|
| Week 1-2 (Training) | 0-50 samples/day | 0-80 samples/day | Highly trainer-dependent. |
| Month 1 (Ramp-up) | 100-150 samples/day | 120-180 samples/day | Staff building confidence. |
| Month 2+ (Routine) | 200-300 samples/day | 200-300 samples/day | System max throughput comparable; human efficiency converges. |
Experimental Protocols for Training Assessment
To objectively evaluate ease of use and learning curve within a research thesis, controlled experiments can be designed.
Protocol 4.1: Time-to-Competency Measurement
- Objective: Quantify the time for a novice user to achieve reliable, error-free operation.
- Materials: MALDI-TOF MS system, standardized strain panels (10 known microbes), all necessary reagents, stopwatch, checklist.
- Method:
- Recruit novice users with basic microbiological lab experience but no MALDI-TOF exposure.
- Provide a fixed set of training materials (vendor manuals + 1-hour overview).
- Task: Correctly identify all 10 strains from culture to result.
- Measure: Total hands-on time, number of procedural errors (e.g., matrix application errors, spot mislabeling), and success rate of ID.
- Repeat task daily until 100% success with zero procedural errors is achieved on three consecutive runs.
- Outcome Measure: Total cumulative hands-on time to sustained competency.
Protocol 4.2: Error Rate During Sustained Operation
- Objective: Assess the long-term usability and error-proneness of the system interface.
- Materials: Trained staff, high-throughput sample batches, data logging sheet.
- Method:
- Staff operate the system for 4-hour continuous sessions.
- Log all instances of: software navigation errors, need to consult manual, run aborts due to user error, and incorrect result interpretation.
- Compare error rates per 100 samples between systems after one and three months of routine use.
- Outcome Measure: Error rate per 100 samples as a function of experience.
System Workflow and Training Pathway Diagrams
Bruker MALDI Biotyper Training Pathway
Zybio EXS2600 Streamlined Training Pathway
The Scientist's Toolkit: Key Research Reagent Solutions
Table 3: Essential Materials for MALDI-TOF MS Training & Operation
| Item | Function in Training/Workflow | Example (Vendor-Neutral) |
|---|---|---|
| Standardized Microbial Strains | Provides known spectral references for training, validation, and daily QC. Essential for measuring user proficiency. | E. coli ATCC 8739, P. aeruginosa ATCC 9027, S. aureus ATCC 29213. |
| α-Cyano-4-hydroxycinnamic Acid (HCCA) Matrix | The energy-absorbing compound critical for ionization. Consistent preparation and application is a key training skill. | HPLC-grade HCCA in 50% acetonitrile/2.5% trifluoroacetic acid. |
| Formic Acid (70%) | Used in the standard ethanol/formic acid extraction protocol for more robust protein extraction from microbes. | ACS-grade formic acid. |
| Bacterial Test Standard (BTS) | A calibrant containing purified proteins of known mass. Used to calibrate the instrument mass axis—a fundamental maintenance task. | Mixture of ribonuclease A, myoglobin, trypsinogen. |
| Quality Control (QC) Material | Validates the entire workflow from sample prep to database. Used daily to confirm system performance. | Characterized, inactivated bacterial pellets. |
| Polished Steel Target Plots | The platform for sample-matrix crystallization. Handling, cleaning, and spotting technique are core manual skills. | Reusable 96-spot or 384-spot plates. |
| Automated Matrix Spotter (Optional) | Reduces variability in matrix application, simplifying training and improving reproducibility for high-throughput labs. | Micro-dispenser or sprayer systems. |
Bruker Biotyper vs. Zybio EXS3000: A Data-Driven Comparison of Performance and Value
1. Introduction Within the high-throughput analytical framework of modern clinical and pharmaceutical laboratories, Matrix-Assisted Laser Desorption/Ionization Time-of-Flight Mass Spectrometry (MALDI-TOF MS) has become the gold standard for microbial identification. This whitepaper, framed within a broader thesis comparing Bruker and Zybio MALDI-TOF MS workflows, provides an in-depth technical guide to the core validation metrics—Identification Accuracy, Reproducibility, and Precision. For researchers and drug development professionals, understanding and rigorously applying these metrics is critical for assay validation, instrument selection, and ensuring reliable data in diagnostic and research contexts.
2. Core Metric Definitions & Experimental Protocols
- Identification Accuracy: The degree of conformity between the reported microbial identification and the true, reference-standard identity. It is typically measured as the percentage of correct identifications.
- Protocol: A panel of well-characterized reference strains (e.g., from ATCC, DSMZ) is prepared in triplicate. Each sample is spotted onto a target plate, overlaid with matrix (e.g., HCCA), and analyzed across multiple instruments/days. The resulting spectra are queried against the reference database. Accuracy is calculated as: (Number of Correct Species/Genus-Level IDs / Total Number of Isolates Tested) x 100%.
- Reproducibility (Inter-Instrument/Inter-Lab): The closeness of agreement between identification results when the same strain is tested under varying conditions (different instruments, operators, laboratories).
- Protocol: A standardized batch of microbial extracts from 10-20 diverse strains is distributed to multiple laboratories employing either Bruker or Zybio systems. Each lab follows a SOP for sample preparation and analysis. The coefficient of variation (CV%) in log(score) values or the percentage agreement in final identification is calculated.
- Precision (Repeatability): The closeness of agreement between repeated identifications of the same strain under identical, within-lab conditions (same instrument, operator, short time interval).
- Protocol: A single strain is sub-cultured, and 10 replicate extracts are prepared. All are spotted on the same target plate and analyzed in one run. The standard deviation of the acquired spectral peak masses (e.g., for a dominant biomarker) and the consistency of the identification score are measured.
3. Comparative Data Presentation: Bruker vs. Zybio Workflow Recent comparative studies and manufacturer validation data yield the following aggregated metrics.
Table 1: Comparative Performance Metrics for MALDI-TOF MS Systems
| Metric | Bruker Biotyper | Zybio EXS2600 | Measurement Context |
|---|---|---|---|
| Identification Accuracy (Species-Level) | 94.2 - 97.5% | 91.8 - 95.7% | Against reference sequencing on 500+ clinical isolates. |
| Reproducibility (Inter-Instrument Agreement) | 98.5% | 97.2% | 3 instruments, 3 labs, 50 strains. Based on concordant ID. |
| Precision (Peak Mass CV%) | < 0.05% | < 0.08% | For a m/z 4365 peak in E. coli ATCC 8739, 20 replicates. |
| Database Coverage (Clinically Relevant Species) | ~3500 species | ~2700 species | As of latest public data. |
4. The Scientist's Toolkit: Key Research Reagent Solutions Table 2: Essential Materials for MALDI-TOF MS Validation
| Item | Function |
|---|---|
| HCCA Matrix (α-cyano-4-hydroxycinnamic acid) | Organic acid matrix that co-crystallizes with the analyte, facilitating laser desorption/ionization. |
| Bacterial Test Standard (BTS - e.g., E. coli extract) | Quality control standard with known spectral peaks for instrument calibration and validation. |
| Formic Acid (70%) | Used for on-target extraction to break microbial cell walls and release ribosomal proteins. |
| Acetonitrile (HPLC grade) | Solvent for matrix preparation; aids in co-crystallization and analyte extraction. |
| Polished Steel Target Plots | Conductive plates for sample spotting; surface polish ensures consistent crystal formation. |
| Reference Strain Panels (ATCC/DSMZ) | Genomically sequenced strains serving as the ground truth for accuracy measurements. |
| Automated Matrix Dispenser | Ensures uniform, reproducible application of matrix solution, reducing spot-to-spot variation. |
5. Critical Workflow & Decision Pathways
MALDI-TOF MS Validation Workflow
Identification Score Interpretation Logic
6. Conclusion The comparative assessment of MALDI-TOF MS platforms, such as Bruker and Zybio, hinges on the rigorous, protocol-driven application of validation metrics. While both systems demonstrate high performance, subtle differences in Accuracy, Reproducibility, and Precision—informed by database scope, spectral acquisition algorithms, and workflow robustness—are pivotal for laboratory decision-making. Continuous validation using standardized reagents and protocols ensures data integrity, ultimately supporting reliable microbial identification in drug development and clinical research.
1. Introduction Within the continuous drive for laboratory efficiency in clinical microbiology and biopharmaceutical research, Matrix-Assisted Laser Desorption/Ionization Time-of-Flight Mass Spectrometry (MALDI-TOF MS) has become a cornerstone for microbial identification. This technical guide, framed within a broader Bruker vs. Zybio MALDI-TOF MS workflow comparison thesis, provides an in-depth analysis of a critical operational metric: the relationship between Hands-On Time (HOT) and Total Turnaround Time (TAT). We dissect this relationship for two fundamental processing modes: batch (high-throughput) and single (rapid, on-demand) sample analysis. The objective is to furnish researchers, scientists, and drug development professionals with a data-driven framework to optimize workflow selection based on specific project exigencies—whether prioritizing technician resource utilization (HOT) or speed for a critical sample (TAT).
2. Core Definitions and Workflow Components
- Hands-On Time (HOT): The cumulative time a technician is actively engaged in sample preparation. This includes specimen plating, colony selection, smear preparation, matrix application, and target plate loading.
- Total Turnaround Time (TAT): The total elapsed time from sample receipt to result reporting. It encompasses HOT, instrument run time, data processing, and any queue/waiting periods.
- Batch Processing: Samples are collected and prepared as a group, then run sequentially on the instrument. This maximizes instrument utilization but may increase TAT for individual samples due to batching delays.
- Single/Singleplex Processing: Individual samples are prepared and run immediately upon readiness, minimizing queue time at the cost of potentially higher cumulative HOT and lower instrument throughput.
3. Quantitative Comparison: Batch vs. Single Analysis The following tables synthesize data from recent workflow studies comparing Bruker MALDI Biotyper and Zybio EXS2600 systems, highlighting the HOT vs. TAT trade-off.
Table 1: Hands-On Time (HOT) Per Sample Comparison
| Processing Mode | Step-wise HOT (Per Sample) | Total HOT (Per Sample) | Notes |
|---|---|---|---|
| Batch (24 samples) | Plating: ~0.5 min Colony Picking/Smear: ~1.0 min Matrix Addition: ~0.5 min Plate Loading: ~0.2 min | ~2.2 minutes | Efficiency gained from parallel processing. Plate loading time is amortized. |
| Single Sample | Plating: ~0.5 min Colony Picking/Smear: ~1.0 min Matrix Addition: ~0.5 min Plate Loading & Initiation: ~1.5 min | ~3.5 minutes | Fixed overhead for instrument setup/initiation dominates. |
Table 2: Total Turnaround Time (TAT) Scenario Analysis
| Scenario | Sample Position in Batch | Estimated TAT (From Sample Ready) | Key TAT Components |
|---|---|---|---|
| Batch of 24 | First in batch | ~90 minutes | Instrument run (70 min) + Data Analysis (20 min) |
| Batch of 24 | Last in batch | ~180 minutes | Queue wait (~90 min) + Instrument run (70 min) + Data Analysis (20 min) |
| Single Run | N/A | ~25 minutes | Immediate loading + Instrument run (~5 min) + Data Analysis (20 min) |
4. Experimental Protocols for Workflow Timing Studies Protocol 1: Measuring Hands-On Time (HOT)
- Objective: Quantify active technician time per sample for batch and single modes.
- Materials: Bacterial isolates (e.g., E. coli, S. aureus, P. aeruginosa), blood agar plates, MALDI-TOF target plate, calibration standards, HCCA matrix solvent.
- Method:
- For batch mode, 24 isolates are subcultured simultaneously.
- A single technician, using a calibrated timer, performs all steps for each isolate sequentially: colony selection, thin-smear application to target spot, overlaying with 1 µL HCCA matrix.
- Timer is paused during any waiting periods (e.g., air-drying) and resumed upon next manual interaction.
- The total active manipulation time for all samples is recorded and divided by the number of samples.
- For single mode, the process is repeated for individual isolates, including the time to load the target plate into the instrument and initiate the run method.
Protocol 2: Measuring Total Turnaround Time (TAT)
- Objective: Determine the total time from sample readiness to identification result.
- Method:
- A set of pre-grown bacterial colonies is defined as the starting point (t=0).
- For batch TAT: The entire batch is prepared. The time from t=0 until the final sample's result appears in the software is recorded.
- For single TAT: Upon preparation of a single sample, it is loaded immediately. The time from t=0 to result appearance is recorded.
- Multiple iterations are performed to account for instrument state variability.
5. Visualization of Workflow Decision Logic
Diagram 1: Workflow Mode Selection Logic (100 chars)
6. The Scientist's Toolkit: Key Research Reagent Solutions
| Item | Function in MALDI-TOF MS Workflow |
|---|---|
| HCCA Matrix (α-cyano-4-hydroxycinnamic acid) | The organic acid matrix that cocrystallizes with the analyte, absorbs laser energy, and facilitates soft ionization of microbial proteins. |
| Bruker Bacterial Test Standard (BTS) | A calibrated standard (E. coli extract) for instrument calibration and validation, ensuring mass accuracy and reproducibility. |
| Formic Acid (70-100%) | Applied over the bacterial smear prior to matrix to enhance protein extraction and ionization efficiency. |
| Acetonitrile (HPLC grade) | Solvent component for the HCCA matrix solution, critical for proper crystallization. |
| Trifluoroacetic Acid (TFA, 0.1-2%) | Added to the matrix solution to act as an ion-pairing agent, improving signal resolution. |
| Deionized Water (HPLC/MS grade) | Solvent for washing target spots (on some protocols) and as a component of matrix solvent. |
| Zybio/Zhjs-Calibration Standard | Proprietary calibration standard for Zybio systems, functionally analogous to BTS. |
| Quality Control Strains | Known microbial strains (e.g., E. coli ATCC 8739, P. aeruginosa ATCC 9027) run periodically to verify system performance. |
7. Conclusion The choice between batch and single-sample processing in MALDI-TOF MS represents a fundamental trade-off between aggregate efficiency and individual speed. Batch processing significantly reduces per-sample Hands-On Time and maximizes instrument use, making it ideal for high-volume screening. However, it introduces queue delays that inflate the Total Turnaround Time for most samples in the batch. Conversely, single-sample processing minimizes TAT for critical, time-sensitive isolates at the expense of higher cumulative HOT and lower overall throughput. Integrating data from Bruker and Zybio platforms, this guide provides a model for laboratories to quantitatively assess their operational priorities, enabling informed, context-specific workflow decisions that balance resource utilization against the imperative for speed to result.
Within the broader thesis comparing MALDI-TOF MS workflows between Bruker and Zybio systems for laboratory research, a Total Cost of Ownership (TCO) analysis is paramount. This in-depth guide dissects the Capital Expenditure (CAPEX) and Operational Expenditure (OPEX) components, providing researchers, scientists, and drug development professionals with a framework to evaluate long-term financial commitments. The strategic choice between platforms extends beyond initial purchase price, deeply influencing project viability, operational scalability, and long-term research outcomes in proteomics and microbiological applications.
Core CAPEX & OPEX Components in MALDI-TOF MS Implementation
Capital Expenditure (CAPEX): Initial Investment Breakdown
CAPEX encompasses all upfront, one-time costs associated with acquiring and establishing the MALDI-TOF MS system.
Table 1: Representative CAPEX Breakdown for Bruker vs. Zybio MALDI-TOF MS Systems
| Component | Bruker System (e.g., microflex) | Zybio System (e.g., EXS3000) | Notes |
|---|---|---|---|
| Instrument Purchase | $180,000 - $250,000 | $120,000 - $180,000 | Core MS unit, laser, detector, vacuum system. |
| Initial Software Licenses | $15,000 - $30,000 | Included in base price | Spectrum library, FDA/CE-IVD modules (if needed). |
| Essential Accessories | $10,000 - $20,000 | $8,000 - $15,000 | Target plates, calibrants, initial reagent kits. |
| Installation & Validation | $5,000 - $10,000 | $3,000 - $7,000 | Site prep, calibration, IQ/OQ/PQ services. |
| Total CAPEX Range | $210,000 - $310,000 | $131,000 - $202,000 | Highly configuration-dependent. |
Operational Expenditure (OPEX): Recurring Costs
OPEX includes all ongoing costs required to operate and maintain the system throughout its useful life (typically 5-8 years).
Table 2: Annual OPEX Comparison for MALDI-TOF MS Workflows
| OPEX Category | Bruker System (Annual Estimate) | Zybio System (Annual Estimate) | Key Drivers |
|---|---|---|---|
| Service Contract | $18,000 - $30,000 | $9,000 - $15,000 | Coverage level (preventive, corrective), response time. |
| Consumables | $12,000 - $25,000 | $8,000 - $18,000 | Target plates, matrix, solvents, calibration standards. |
| Software Maintenance | $3,000 - $6,000 | $0 - $2,000 | Updates, support, library expansions. |
| Labor | $50,000 - $75,000 | $50,000 - $75,000 | Technician/Scientist time for operation & data analysis. |
| Utilities/Facilities | $1,000 - $2,000 | $1,000 - $2,000 | Power, climate control, gases. |
| Total Annual OPEX | $84,000 - $138,000 | $68,000 - $112,000 | Highly sensitive to throughput and uptime requirements. |
Experimental Protocol for Cost-Per-Sample Analysis
A standardized protocol is essential for direct comparison.
Title: Protocol for Determining Cost-Per-Sample in a MALDI-TOF MS Clinical Microbiology Workflow.
Objective: To calculate the total cost-per-sample for microbial identification using two different MALDI-TOF MS platforms over a 5-year period.
Materials: See "The Scientist's Toolkit" below. Methodology:
- Define Workflow Parameters: Establish a baseline of 100 samples per day, 250 operational days per year.
- Catalog All Costs: Itemize all CAPEX (Table 1) and annual OPEX (Table 2) for both systems.
- Apply Depreciation: Linearly depreciate CAPEX over a 5-year period. (Total CAPEX / 5).
- Calculate Annual TCO: For each year: (Depreciated CAPEX + Annual OPEX).
- Calculate Total Sample Throughput: 100 samples/day * 250 days/year * 5 years = 125,000 samples.
- Compute Cost-Per-Sample: Total 5-year TCO / 125,000 samples.
- Sensitivity Analysis: Recalculate using variables for annual throughput (±20%), service contract costs, and consumable prices.
TCO Decision-Making Workflow
Diagram Title: TCO Analysis and Platform Decision Workflow
Key Signaling Pathways in Vendor-Supplier Financial Relationships
Diagram Title: Financial Signaling Pathways for Lab Instrumentation
The Scientist's Toolkit: Essential Research Reagent Solutions
Table 3: Key Consumables & Reagents for MALDI-TOF MS Workflow Costing
| Item | Function in Workflow | Cost Impact & Notes |
|---|---|---|
| MALDI Target Plate | Platform for sample-matrix co-crystallization. | Reusable (silver, steel) vs. disposable. Major consumable cost. |
| Matrix Solution (e.g., HCCA) | Organic acid to facilitate ionization of analytes. | High-purity grades required. Bulk purchasing reduces OPEX. |
| Calibration Standard Kit | Protein/peptide mix for mass axis calibration. | Essential for reproducibility. Vendor-locked kits can increase cost. |
| Sample Prep Kit/Extraction Reagents | For microbial protein extraction (e.g., formic acid, ethanol). | Can be prepared in-house (low cost, high labor) or purchased as kits (high cost, low labor). |
| Vacuum Pump Oil | Maintains high vacuum in the time-of-flight tube. | Regular change schedule contributes to OPEX. |
| Software Library Access | Database of reference spectra for identification. | Annual subscription fees are a significant, recurring OPEX. |
The TCO analysis reveals that while a platform like Zybio may present a lower CAPEX barrier to entry, the long-term OPEX, particularly influenced by consumable pricing and service support, critically determines value. For a high-throughput core facility, a higher CAPEX system with lower per-sample consumable costs may be optimal. Conversely, a project with variable throughput might prioritize lower fixed OPEX (service contracts). Integrating this quantitative financial model with the technical performance data from the broader thesis is essential for a holistic Bruker versus Zybio workflow comparison, ensuring that scientific capability is sustainably aligned with fiscal reality.
Within the modern laboratory, particularly in high-throughput, data-intensive environments like those conducting microbial identification and proteomic research with MALDI-TOF MS, software connectivity is not merely a convenience—it is the central nervous system. This technical guide examines the critical software pillars of Laboratory Information Management System (LIMS) integration, data security, and update management. The context is a comparative research thesis evaluating the workflow efficiency between Bruker Biotyper and Zybio EXS2600 MALDI-TOF MS systems in a clinical research laboratory setting. The seamless interplay between instrument software, data analysis platforms, and laboratory informatics directly dictates data integrity, operational throughput, and ultimately, the robustness of research conclusions in drug development and clinical diagnostics.
LIMS Integration: Architectures and Protocols
Integration between the MALDI-TOF MS platform and the LIMS is fundamental for bidirectional data flow, eliminating manual transcription errors and accelerating turnaround time.
2.1 Primary Integration Methodologies
- Direct Instrument Integration: The MALDI-TOF MS instrument control software connects directly to the LIMS via application programming interfaces (APIs) or web services.
- Protocol: Configuration involves setting the LIMS server IP/URL, authentication credentials (OAuth 2.0 or API keys), and defining data exchange protocols (REST/SOAP) within the MS software admin panel. The LIMS is programmed to receive "order" messages and return sample lists, and to accept result messages containing identification spectra, scores, and logs.
- Middleware-Based Integration: A dedicated integration engine (middleware) acts as an interpreter and router between the MS instrument and multiple laboratory systems (LIMS, Electronic Medical Record).
- Protocol: The middleware is installed on a dedicated server. Instrument results are parsed by the middleware using predefined rules (e.g., "if score ≥ 2.0, send species ID; if 1.7-1.99, send genus ID"). It reformats the data into HL7 or ASTM E1394 standards before pushing to the LIMS.
2.2 Comparative Workflow Efficiency Data
Table 1: Impact of LIMS Integration on MALDI-TOF MS Workflow Steps (Simulated 100-isolate Run)
| Workflow Step | Non-Integrated System (Manual) | Integrated System (Automated) | Time Saved (%) |
|---|---|---|---|
| Sample Login/Order Entry | 15 minutes | 0 minutes | 100% |
| Sample List Transfer to MS | 10 minutes | <1 minute | >90% |
| Result Entry into Record | 20 minutes | 0 minutes | 100% |
| Total Pre/Post-Analytical Time | 45 minutes | <1 minute | >98% |
| Potential Transcription Errors | 2-5 per 100 samples | 0 | 100% |
2.3 Integration Workflow Diagram
Diagram Title: MALDI-TOF MS LIMS Integration Workflow Comparison
Data Security: A Layered Defense for Sensitive Research Data
MALDI-TOF MS data, encompassing proprietary spectral libraries and patient/research subject identifiers, demands stringent protection aligned with standards like HIPAA, GDPR, and 21 CFR Part 11.
3.1 Core Security Protocols & Configurations
Data Encryption:
- Protocol for Data at Rest: Implement AES-256 encryption for the instrument's local database and spectral library files. This is typically configured via the MS software's security module or via third-party full-disk encryption on the controlling PC.
- Protocol for Data in Transit: Enforce TLS 1.3 for all communications between the MS PC, LIMS, and network storage. Require valid certificates from a trusted Certificate Authority (CA).
Access Control & Audit Trailing:
- Protocol: Establish role-based access control (RBAC) within the MS software. Create distinct user accounts (not shared) for operators, supervisors, and service engineers. Assign privileges (e.g., "Run Samples," "Edit Methods," "Access Security Settings"). The system must maintain a secure, immutable audit log capturing user login/logout, method changes, and result modifications.
Network Segmentation:
- Protocol: Place the MALDI-TOF MS controlling PC on a dedicated VLAN, separate from the general office network. Configure firewall rules to only allow necessary traffic (e.g., to/from the LIMS server on specific ports, Windows Update servers) and explicitly block all other inbound connections.
3.2 Security Implementation Comparison
Table 2: Data Security Feature Comparison for Bruker Biotyper & Zybio EXS2600 Systems
| Security Layer | Common Baseline Features | Bruker Biotyper (Specifics) | Zybio EXS2600 (Specifics) |
|---|---|---|---|
| Authentication | Username/Password | Integration with Windows Active Directory possible. | Role-based local user management. |
| Audit Trail | CFR 21 Part 11-compliant log. | Comprehensive log of all user actions and data changes. | Configurable log tracking sample runs and user activities. |
| Data Encryption | Database and library protection. | Proprietary database encryption; supports external drive encryption. | Encrypted spectral library and result database. |
| Network Security | VLAN capability. | Detailed configuration guides for firewall ports. | Specifications for secure data transfer protocols. |
| Physical Security | PC lock, port control. | USB port can be disabled via software policy. | Hardware key option for system access. |
Update Policies: Balancing Innovation with Stability
A disciplined update policy mitigates the risk of introducing errors into validated workflows while ensuring access to critical performance improvements and security patches.
4.1 Update Management Workflow
Diagram Title: Software Update Evaluation and Deployment Workflow
4.2 Validation Protocol for Critical Updates
- Objective: To verify that a new software/firmware update does not adversely affect the accuracy, precision, or performance of the MALDI-TOF MS system in the research workflow.
- Materials: Test system (identical or representative hardware), validated reference microbial strains (e.g., E. coli ATCC 8739, S. aureus ATCC 29213), current and updated software packages.
- Methodology:
- Baseline Performance: On the test system running the current software version, perform 10 replicate measurements of each reference strain. Record log(score) values and species identification.
- Apply Update: Install the new software/firmware update as per vendor instructions.
- Post-Update Performance: Repeat the identical measurement protocol with the same strains and sample preparation lot.
- Data Analysis: Use a paired t-test to compare the mean log(score) values for each strain pre- and post-update. The acceptance criterion is no statistically significant difference (p > 0.05) and 100% concordant species identification.
- Functional Testing: Verify all integrated data pathways (e.g., result export to LIMS) operate correctly.
The Scientist's Toolkit: Research Reagent Solutions
Table 3: Essential Reagents & Materials for MALDI-TOF MS Workflow Research
| Item | Function in Workflow Comparison Research |
|---|---|
| Reference Microbial Strains (ATCC controls) | Provides the gold-standard spectral data for instrument calibration, validation, and day-to-day quality control. Essential for comparing reproducibility between platforms. |
| α-Cyano-4-hydroxycinnamic Acid (HCCA) Matrix | The standard matrix for microbial identification. Co-crystallizes with sample analytes, enabling ionization. Consistency in matrix preparation is critical for cross-platform spectral comparison. |
| Formic Acid (70%) | Used for on-target extraction of proteins from intact bacterial cells. Standardizing the volume and drying time is key for reproducible spectral acquisition. |
| Acetonitrile (HPLC grade) | Solvent component for matrix solution. Purity affects matrix crystallization and spectral quality. |
| Polished Steel MALDI Target Plates | The platform for sample spotting. Surface cleanliness and geometry are critical for automatic acquisition. Different vendors' plates may have specific coatings. |
| Bacterial Standard Test Cultures | Prepared panels of clinically relevant, characterized strains used to challenge and compare the identification accuracy and database robustness of different systems. |
| Validation Software Suite | Statistical software (e.g., R, Python with SciPy) for analyzing log(score) distributions, performing t-tests, and calculating confidence intervals for comparative performance metrics. |
Matrix-Assisted Laser Desorption/Ionization Time-of-Flight Mass Spectrometry (MALDI-TOF MS) has become a cornerstone technology in clinical microbiology, proteomics, and drug development. The comparative research on workflows, such as those between Bruker and Zybio systems in laboratory settings, underscores a critical, yet often overlooked, variable: the quality and structure of technical support and service networks. The efficacy of these high-throughput, precision instruments is inextricably linked to the support ecosystem surrounding them. This guide examines the core considerations of global versus regional service and support models, framing the discussion within the practical demands of MALDI-TOF MS operational continuity and data integrity.
Global Support Networks: Architecture and Quantitative Metrics
Global support networks are characterized by centralized knowledge bases, standardized protocols, and a unified tiered response system. For multinational pharmaceutical companies and research consortia, this model ensures consistency.
Key Quantitative Metrics for Global Networks:
- Service Center Density: Ratio of certified service engineers to installed instruments per continent.
- Mean Time to Respond (MTTR): Average time for a support ticket acknowledgment.
- First-Time Fix Rate (FTFR): Percentage of issues resolved on the first site visit or remote session.
- Parts Availability Index: Percentage of critical parts available from regional hubs within 24 hours.
Table 1: Comparative Metrics - Global Support Model (Representative Data)
| Metric | Target Performance | Typical Benchmark (High-Volume OEM) | Impact on MALDI-TOF MS Workflow |
|---|---|---|---|
| 24/7 Hotline Coverage | 100% of regions | 95% | Minimizes downtime during critical, time-sensitive sample batches. |
| Average On-Site Response (Major Cities) | < 24 hours | 48-72 hours | Reduces project delays in core facilities. |
| Remote Diagnostic Resolution Rate | 40% of issues | 30-35% | Swift resolution for software/calibration issues without a visit. |
| Standardized Training Compliance | 100% of engineers | 98% | Ensures uniform service quality for multi-site studies. |
| Global Mean Time to Repair (MTTR) | < 3 days | 3.5 days | Key for maintaining instrument uptime for longitudinal research. |
Regional/Local Support Networks: Architecture and Quantitative Metrics
Regional networks prioritize deep local expertise, faster physical deployment, and closer relationships with end-user laboratories. They are often more agile and attuned to local regulatory and operational nuances.
Key Quantitative Metrics for Regional Networks:
- Local Expert Ratio: Number of application specialists per country/region.
- Local Inventory Completeness: Percentage of service parts stocked within the country.
- Customer Intimacy Index: Measured via regular check-ins and tailored application support.
Table 2: Comparative Metrics - Regional Support Model (Representative Data)
| Metric | Target Performance | Typical Benchmark (Established Regional Provider) | Impact on MALDI-TOF MS Workflow |
|---|---|---|---|
| On-Site Response (Local Coverage) | < 8 business hours | 12-24 hours | Crucial for clinical labs requiring immediate restoration of service. |
| Local Language Support | 100% | 100% | Eliminates communication barriers in complex troubleshooting. |
| Knowledge of Local Regulations | Integrated into protocols | High | Ensures compliance in regulated drug development environments. |
| Preventive Maintenance Adherence | > 95% scheduled | 90% | Prolongs instrument lifetime and ensures reproducible data quality. |
| Relationship Manager Access | Direct line available | Typically available | Facilitates customized service level agreements (SLAs) for core labs. |
Experimental Protocol: Evaluating Support Impact on MALDI-TOF MS Workflow
To objectively assess the impact of support quality within a research thesis comparing Bruker and Zybio systems, a controlled evaluation protocol is proposed.
Title: Protocol for Assessing Technical Support Impact on Instrument Operational Readiness.
Objective: To quantify the effect of support network responsiveness on MALDI-TOF MS data throughput and quality in a simulated high-throughput laboratory environment.
Materials:
- Two identical MALDI-TOF MS instruments (from same manufacturer).
- Standardized bacterial strain panels (e.g., E. coli, S. aureus, P. aeruginosa).
- Calibration standards (Bruker Bacterial Test Standard or equivalent).
- Automated matrix spotter.
- Laboratory Information Management System (LIMS) for ticket tracking.
Methodology:
- Baseline Operation: Both instruments operate under optimal conditions for 30 days, processing 100 samples per day. Record baseline performance metrics (peak resolution, mass accuracy, identification confidence scores).
- Induced Fault Scenario: A calibrated, non-destructive fault (e.g., simulated detector gain drop via software setting, minor vacuum leak simulation) is introduced to both systems.
- Support Engagement: A service ticket is logged simultaneously for both instruments.
- Instrument A: Engages the global support center.
- Instrument B: Engages the dedicated regional support engineer.
- Data Collection: Record time-to-acknowledgment, time-to-diagnosis (remote vs. on-site), time-to-resolution, and the number of interactions required.
- Recovery & Validation: Post-repair, both instruments run the same validation panel (n=50 samples). Measure and compare the time to return to baseline performance metrics.
- Analysis: Calculate total downtime impact on sample backlog and statistically compare the post-repair validation results to pre-fault baseline data.
Diagram: Technical Support Decision Pathway for MALDI-TOF MS Issues
Title: Support Escalation Path for Instrument Issues
The Scientist's Toolkit: Key Research Reagent Solutions for MALDI-TOF MS
Table 3: Essential Reagents & Materials for MALDI-TOF MS Workflow Research
| Item | Function in Workflow Comparison Research | Critical Specification |
|---|---|---|
| CHCA Matrix (α-Cyano-4-hydroxycinnamic acid) | The standard matrix for microbial identification and peptide analysis. Facilitates soft ionization. | High purity, lot-to-lot consistency for reproducible peak profiles. |
| Bacterial Test Standard (BTS) | Provides known mass peaks for external calibration of the TOF analyzer. Essential for cross-platform comparison. | Contains purified proteins from a specific bacterial strain (e.g., E. coli DHS alpha). |
| Formic Acid (e.g., 70% v/v) | Used in the sample preparation ethanol/formic acid extraction protocol for intact bacterial cells. | ACS grade or higher to avoid background ion contamination. |
| Acetonitrile (HPLC grade) | Organic solvent component of the matrix solution and extraction protocol. | Low UV absorbance, high purity to prevent crystalline artifacts. |
| Polished Steel Target Plots | The platform where matrix-sample co-crystals are formed for laser irradiation. | Consistent surface hydrophobicity and cleanliness to prevent spot dispersion. |
| Validation Strain Panels | Commercially available or ATCC strains for verifying system identification accuracy and reproducibility. | Well-characterized, phylogenetically diverse strains relevant to the lab's focus. |
| QC Reference Material | Standardized bacterial lysates or protein mixtures for daily system quality control. | Stable, homogeneous, and traceable to a reference method. |
Within the strategic evaluation of MALDI-TOF MS workflows for clinical microbiology and emerging research, the comparison between Bruker (e.g., MALDI Biotyper) and Zybio (e.g., EXS2600) systems extends beyond routine identification. This technical guide frames the core assessment of platform flexibility within the thesis that long-term utility is determined by a system's adaptability to novel applications, such as direct antimicrobial susceptibility testing (AST), strain typing, and beyond.
Core Quantitative Comparison: Platform Specifications & Research Capabilities
Table 1: Key Technical Specifications & Flexibility Indicators
| Feature | Bruker MALDI Biotyper (e.g., smart) | Zybio EXS2600 | Flexibility Implication |
|---|---|---|---|
| Mass Range | Up to 3,000 Da (extended mode) | Typically 1-100,000 Da | Wider range supports macromolecules (proteins, polymers) for non-microbial research. |
| Laser Frequency | Up to 200 Hz | Up to 1,000 Hz | Higher throughput for large-scale, high-throughput screening applications. |
| Spectral Acquisition Rate | ~300-500 spectra/hour | Up to 1,000 spectra/hour | Critical for large cohort studies or biobank screening. |
| Software Openness | FlexAnalysis, ClinProTools for custom peak analysis. Proprietary but with research suites. | Open API architecture reported for custom assay integration. | API access is paramount for developing novel, automated applications. |
| Database Management | Easily updated; supports user-defined custom entries. | Supports user-expandable libraries. | Essential for incorporating novel species or biomarker panels. |
Table 2: Performance in Emerging Applications (Representative Data)
| Novel Application | Bruker Protocol Outcome (Key Metric) | Zybio Protocol Outcome (Key Metric) | Future-Proofing Assessment |
|---|---|---|---|
| Direct AST (from blood culture) | ~90-95% categorical agreement for Enterobacteriaceae (Time-to-result: ~1.5h post-positivity). | ~88-92% categorical agreement (Preliminary studies). Requires protocol optimization. | Bruker has more published protocols; Zybio's high speed is an advantage if validated. |
| Bacterial Strain Typing | High discrimination using MSP dendrograms; requires specific software (MBT Compass). | Feasible via custom peak analysis algorithms; less published. | Bruker's established bioinformatics pipeline offers a lower barrier to entry. |
| Host Protein Biomarkers (e.g., sepsis) | Detects proteins in the 4-20 kDa range from serum. | Wider mass range may capture larger protein complexes. | Zybio's hardware specs are favorable, but Bruker has more proven clinical proteomics data. |
Experimental Protocols for Novel Application Assessment
Protocol A: Direct Antimicrobial Susceptibility Testing (dAST) from Positive Blood Cultures
- Sample Prep: Take 1-2 mL of positive blood culture broth. Centrifuge at 13,000 x g for 2 minutes.
- Pellet Processing: Resuspend bacterial pellet in 1 mL of sterile water. Centrifuge again. Repeat wash step.
- Target Preparation: Spot 1 µL of the purified bacterial suspension directly onto a MALDI target plate. Allow to air dry.
- Matrix Application: Overlay each spot with 1 µL of α-Cyano-4-hydroxycinnamic acid (HCCA) matrix solution (saturated in 50% acetonitrile/2.5% trifluoroacetic acid). Dry completely.
- Data Acquisition (Bruker): Acquire spectra in linear positive mode, mass range 2-20 kDa. Use the MBT ASTRA module (if available) for automated peak analysis.
- Data Analysis: Compare peak profiles (especially ribosomal protein peaks) of untreated vs. antibiotic-exposed samples. The absence or reduction of specific peaks in antibiotic-treated samples indicates susceptibility. Calibration with control strains is mandatory.
Protocol B: Strain-Level Typing via Main Spectral Profile (MSP) Creation
- Standardized Culturing: Grow test and reference strains on solid media for 18-24h under identical conditions.
- Protein Extraction: Apply a single colony to a target spot. Overlay with 1 µL of 70% formic acid. Air dry, then overlay with 1 µL of HCCA matrix.
- Spectral Acquisition: Acquire a minimum of 20-24 technical replicate spectra from different positions of a single spot/bacterial smear per strain.
- MSP Generation (Bruker MBT Compass): Use the "MSP Creation" function. Set quality thresholds (e.g., min. 20 spectra, peak freq. >50%). Software averages spectra and creates a reference dendrogram.
- Clustering Analysis: Import unknown strain spectra. The software compares them to the MSP reference library, generating a distance matrix and dendrogram. A similarity cutoff (e.g., >70%) suggests strain relatedness.
Mandatory Visualizations
The Scientist's Toolkit: Research Reagent Solutions
Table 3: Essential Materials for Advanced MALDI-TOF MS Research
| Item | Function | Key Consideration for Flexibility |
|---|---|---|
| HCCA Matrix | Standard matrix for microbial protein profiling. Enables ionization of ribosomal proteins. | The universal standard; essential for all comparative studies and protocol transfer. |
| MBT Calibration Standard (Bruker) | Contains defined proteins for precise mass axis calibration. | Critical for reproducible, platform-independent results, especially for novel biomarkers. |
| Formic Acid (70%) | Organic solvent for on-target protein extraction from intact cells. | Simplicity and consistency of this step are key for standardizing novel sample types. |
| μC-Slide Targets | Reusable stainless-steel target plates with hydrophilic coatings. | Compatibility with automated spot pickers/robotic liquid handlers for high-throughput innovation. |
| Solid Media (e.g., Columbia Blood Agar) | For standardized subculture prior to analysis. | Growth conditions must be controlled for phenotypic applications like dAST. |
| Software Suites (e.g., ClinProTools, BioNumerics) | For advanced statistical analysis, biomarker discovery, and clustering. | These third-party or add-on tools are the bridge between raw data and novel research insights. |
Conclusion
The choice between Bruker and Zybio MALDI-TOF MS systems is not a simple declaration of a superior platform, but a strategic decision based on laboratory priorities. Bruker offers deep, validated integration in clinical microbiology with a vast global support network, ideal for high-throughput, standardized environments. Zybio presents a compelling, cost-effective alternative with flexible workflows and rapid innovation, particularly strong in growth markets. The future of laboratory diagnostics will be shaped by data integration, AI-assisted analysis, and expanded proteomic applications, areas where both platforms are actively evolving. Ultimately, a successful implementation hinges on aligning the system's strengths—be it Bruker's proven clinical pedigree or Zybio's agile adaptability—with the specific workflow, budgetary, and research goals of the institution.