Microbial Load Variation: A Critical Confounder in Biomedical Research and Drug Development
This article examines the profound impact of microbial load variation on the validity and interpretation of biomedical research, particularly in microbiome studies and drug development.
Microbial Load Variation: A Critical Confounder in Biomedical Research and Drug Development
Abstract
This article examines the profound impact of microbial load variation on the validity and interpretation of biomedical research, particularly in microbiome studies and drug development. It explores the foundational concept of microbial load as a major source of bias, presents advanced methodological approaches for accurate quantification, addresses key troubleshooting and optimization challenges, and validates strategies to distinguish true biological signals from load-induced artifacts. For researchers and drug development professionals, this synthesis provides a critical framework for designing robust studies and avoiding erroneous conclusions that can compromise diagnostic applications and therapeutic discovery.
Beyond Composition: Why Microbial Load is a Foundational Confounder in Disease Associations
In microbiome research, the fundamental difference between microbial load (absolute abundance) and relative composition (relative abundance) is not merely a technical detail but a critical factor that shapes the interpretation of data and the validity of scientific conclusions. Microbial load refers to the absolute quantity of microorganisms in a sample, typically quantified as the number of microbial cells per unit volume or mass [1] [2]. In contrast, relative composition describes the proportional representation of each microbial taxon within a sample, where all abundances sum to 100% [1] [3]. This distinction is paramount because data derived from standard high-throughput sequencing techniques, such as 16S rRNA gene amplicon sequencing and metagenomics, are inherently compositional [4] [3]. They reveal who is present and in what proportion, but not how many are present in total. Ignoring this reality can lead to profoundly misleading conclusions, as changes in the absolute abundance of one taxon can manifest as apparent changes in the relative abundance of many others, creating false positives and obscuring true biological signals [4] [5] [2]. This technical guide, framed within the context of how microbial load variation affects study conclusions, provides researchers with the principles and practices needed to navigate this complex analytical landscape.
Core Concepts and Definitions
What is Relative Abundance?
Relative abundance quantifies the proportion of a specific microorganism within the entire sampled microbial community. It is a normalized measure that does not provide information about the actual number of microorganisms but rather indicates how a taxon's abundance compares to all others in the sample. The sum of all relative abundances in a sample typically equals 100% or 1 [1].
- Calculation: It is calculated by dividing the number of reads or cells of a specific taxon by the total number of reads or cells of all taxa in the sample.
Relative Abundance of Taxon A = (Number of Taxon A) / (Total number of all taxa)[1] - Source Data: Relative abundance is the direct output of most high-throughput sequencing methods, including 16S rRNA gene sequencing and shotgun metagenomics, without additional quantification steps [1] [3].
What is Absolute Abundance?
Absolute abundance (often synonymous with microbial load) refers to the actual, total number of a specific microorganism present in a sample. It is an absolute quantity that directly informs about the true density of microbes in their environment [1] [2].
- Measurement: It is typically quantified as the number of microbial cells per gram or milliliter of sample (e.g., cells/gram of stool) [1] [6].
- Requirement for Conversion: Absolute abundance cannot be determined from sequencing reads alone. It requires additional quantitative information, such as the total microbial load of the sample, which can be obtained through methods like flow cytometry, quantitative PCR (qPCR), or the use of internal spike-in standards [4] [1] [2]. The absolute abundance of a taxon can then be calculated by multiplying its relative abundance by the total microbial abundance [1].
The Mathematical Relationship
The relationship between absolute and relative abundance is direct and underpins the conversion between the two measures.
Converting Absolute to Relative Abundance:
Relative Abundance of Taxon A = (Absolute Abundance of Taxon A) / (Sum of Absolute Abundances of All Taxa) [1]
Converting Relative to Absolute Abundance:
Absolute Abundance of Taxon A = (Relative Abundance of Taxon A) × (Total Microbial Abundance of the Sample) [1]
Table 1: Key Differences Between Absolute and Relative Abundance
| Feature | Absolute Abundance | Relative Abundance |
|---|---|---|
| Definition | Actual number of cells of a microbe | Proportion of a microbe within the community |
| What it measures | True quantity in the sample | Relative distribution among taxa |
| Data type | Absolute quantity | Compositional, proportional |
| Primary methods | qPCR, flow cytometry, spike-in standards, culture | 16S rRNA sequencing, metagenomics |
| Impact of total load | Independent; provides direct measure | Highly dependent; a change in one taxon affects all others |
| Ideal for | Quantifying true changes in abundance, studying community interactions, clinical thresholds | Comparing community structure, ecological proportions |
The Pitfalls of Relative-Only Analysis and the Impact of Microbial Load
Relying solely on relative abundance data can lead to incorrect biological interpretations. Because the data are compositional, an increase in the relative abundance of one taxon necessitates an apparent decrease in the relative abundance of others, regardless of their true, absolute behavior [4].
A Classic Example of Misinterpretation
Consider a pre- and post-treatment sample containing only two taxa (Orange and Blue). Before treatment, they exist in equal proportions (50% each). After treatment, the ratio is 2:1 (67% Orange, 33% Blue). A relative-only analysis would conclude that Orange increased and Blue decreased [4].
However, multiple absolute scenarios could yield this same relative outcome:
- Orange quadruples and Blue doubles: Both taxa increased, but Orange increased more.
- Orange remains constant and Blue halves: Orange was stable, while Blue decreased.
- Orange halves and Blue decreases four-fold: Both taxa decreased, but Blue decreased more dramatically [4].
Without knowledge of the total microbial load, it is impossible to distinguish which scenario truly occurred, leading to potentially grave misinterpretations of the treatment's effect [4].
Evidence from Real Studies
Recent research across various fields underscores the confounding effect of microbial load:
- Carcass Decomposition: A 2025 study comparing Quantitative Microbiome Profiling (QMP - based on absolute abundance) and Relative Microbiome Profiling (RMP) found "strikingly different, even opposing successional trends for major phyla." For instance, Pseudomonadota displayed a decreasing trend in tissue based on RMP, but QMP revealed an increasing trend. Similarly, Ascomycota showed an initial decline then increase with RMP, but the exact opposite trend with QMP [5].
- Soil Microbiology: A study evaluating microbial population dynamics found that 33.87% of bacterial genera at the genus level showed "opposite changes," described as decreased relative abundance but increased absolute abundance. This occurs when a taxon's absolute count increases, but other taxa increase even more, causing its proportion to shrink [2].
- Human Gut Disease: A machine-learning model predicting fecal microbial load from relative data demonstrated that for several diseases, changes in microbial load, rather than the disease condition itself, more strongly explained alterations in the gut microbiome. Adjusting for this effect "substantially reduced the statistical significance of the majority of disease-associated species," revealing microbial load as a major confounder [7] [6].
Diagram 1: The Compositional Data Problem. This flow chart illustrates how three biologically distinct scenarios (A, B, C) can result in the exact same relative abundance profile, highlighting the risk of misinterpretation without absolute quantification [4].
Methodologies for Absolute Quantification
A range of techniques is available to determine microbial load, each with its own advantages and limitations.
Table 2: Methods for Absolute Quantification of Microbial Load
| Method | Principle | Key Advantages | Key Limitations | Example Applications |
|---|---|---|---|---|
| Flow Cytometry [4] [2] [3] | Counts individual microbial cells in a liquid suspension as they pass a laser. | Rapid; agnostic to DNA sequence; can differentiate live/dead cells; provides direct cell count. | Requires expensive equipment; may not distinguish microbial from host cells in some samples. | Fecal samples, aquatic samples [2]. |
| Quantitative PCR (qPCR) [4] [1] [2] | Amplifies a universal marker gene (e.g., 16S rRNA gene) and compares to a standard curve for quantification. | Cost-effective; high sensitivity; compatible with low-biomass samples; easy handling. | Requires primer specificity; PCR biases; requires standard curve; 16S copy number variation can bias counts [2]. | Feces, clinical samples (lung), soil, low-biomass samples [2]. |
| Spike-In Internal Standards [4] [2] [8] | A known quantity of foreign cells or DNA is added to the sample prior to DNA extraction. | Can be directly incorporated into sequencing workflow; corrects for technical variation in extraction/sequencing. | Choice of standard and spiking amount is critical; can be expensive [2]. | Soil, sludge, feces, diverse human microbiomes [2] [8]. |
| Digital PCR (ddPCR) [2] | Partitions a sample into thousands of nanoreactions for absolute counting of DNA molecules without a standard curve. | High precision; no standard curve needed; robust to PCR inhibitors; good for low-concentration targets. | Requires dilution for high-concentration samples; may require replicates [2]. | Clinical samples (lung, bloodstream), air, feces [2]. |
| Culturing [3] | Grow microbes on nutrient media and count colony-forming units (CFUs). | Quantifies viable cells; well-established. | Only captures a fraction of viable microbes; time-consuming; cannot identify unculturable taxa. | General microbiology, food safety. |
Detailed Experimental Protocol: Full-Length 16S rRNA Sequencing with Spike-In Controls
The following protocol, adapted from a 2025 study, details how to obtain absolute abundances using nanopore sequencing and spike-in controls [8].
1. Sample Preparation and DNA Extraction:
- Collect samples (e.g., stool, saliva, skin swabs) using a standardized method.
- Extract genomic DNA using a commercial kit (e.g., QIAamp PowerFecal Pro DNA Kit).
- Quantify DNA concentration using a fluorescence-based method (e.g., Qubit fluorimeter).
2. Addition of Spike-In Control:
- Add a known amount of spike-in control (e.g., ZymoBIOMICS Spike-in Control I) to the sample DNA prior to PCR amplification. The spike-in should comprise a defined percentage (e.g., 10%) of the total DNA input [8]. This controls for losses and biases in subsequent PCR and library preparation steps.
3. 16S rRNA Gene Amplification and Sequencing:
- Amplify the full-length 16S rRNA gene using primers suitable for long-read sequencing.
- Use a minimal number of PCR cycles (e.g., 25 cycles) to reduce amplification bias.
- Perform barcoding, library pooling, and purification according to sequencing platform specifications (e.g., Oxford Nanopore Technologies protocol).
- Sequence the library on an appropriate device (e.g., MinION Mk1C).
4. Data Analysis and Absolute Quantification:
- Basecalling and Quality Control: Perform basecalling and filter reads by quality score (e.g., q-score ≥ 9) and length.
- Taxonomic Assignment: Assign taxonomy using a tool designed for long-read data (e.g., Emu) [8].
- Calculate Absolute Abundance:
- The relative abundance of each taxon is obtained from the taxonomic profile.
- The known absolute amount of the spike-in added to the sample allows for the calculation of a conversion factor.
- The absolute abundance of each native taxon in the sample is calculated using the formula:
Absolute Abundance (cells/unit) = (Relative Abundance of Taxon / Relative Abundance of Spike-in) × Known Absolute Amount of Spike-in[8].
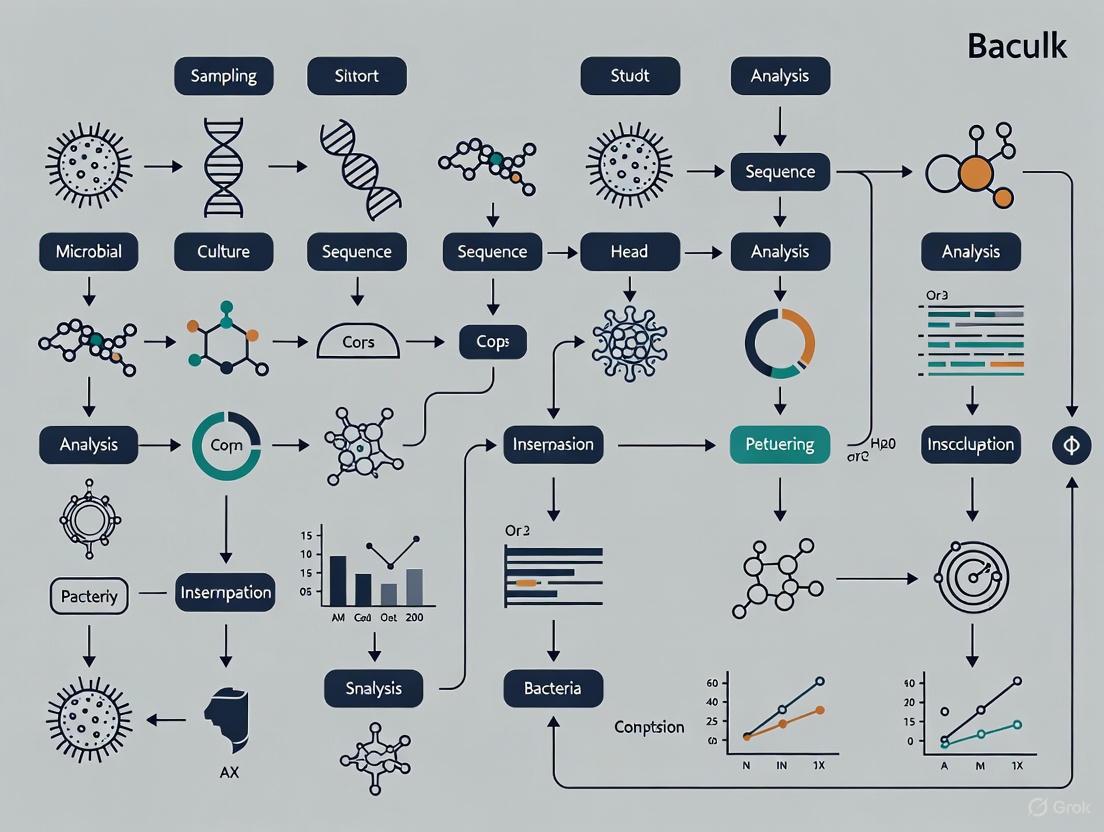
Diagram 2: Spike-In QMP Workflow. This diagram outlines the key steps in a quantitative microbiome profiling protocol that uses an internal spike-in control to convert relative sequencing data into absolute microbial counts [8].
The Scientist's Toolkit: Key Research Reagent Solutions
Table 3: Essential Reagents and Kits for Absolute Quantification
| Item | Function/Description | Example Product |
|---|---|---|
| Mock Community Standards | Defined mixtures of microbial cells or DNA at known ratios. Used for validating and benchmarking sequencing and quantification methods. | ZymoBIOMICS Microbial Community Standard (D6300) / DNA Standard (D6305) [8]. |
| Spike-In Controls | Known quantities of non-native cells or DNA added to samples to enable absolute quantification. Critical for internal calibration. | ZymoBIOMICS Spike-in Control I (High Microbial Load) (D6320) [8]. |
| DNA Extraction Kits | Standardized protocols for isolating microbial DNA from complex samples. Kits designed for soil or stool are often used. | QIAamp PowerFecal Pro DNA Kit [8]. |
| Fluorometric DNA Quantification Kits | Accurately measure DNA concentration using fluorescence, which is more reliable for complex samples than spectrophotometry. | Qubit dsDNA BR Assay Kit [8]. |
| Universal 16S qPCR Assays | Primers and probes targeting conserved regions of the 16S rRNA gene to quantify total bacterial load via qPCR. | Various custom or commercial assays (e.g., TaqMan) [2]. |
The distinction between microbial load and relative composition is foundational to robust microbiome science. As demonstrated, reliance on relative abundance alone can confound data interpretation, leading to false associations and incorrect biological conclusions. Microbial load is not a nuisance variable; it is a key determinant of microbiome variation and a major confounder in disease association studies [7] [6]. The adoption of absolute quantification methods—whether through spike-in standards, flow cytometry, or qPCR—is no longer a niche pursuit but a necessary step for enhancing the reproducibility, accuracy, and biological relevance of microbiome research. By integrating the measurement of microbial load into study designs, researchers can move beyond the limitations of compositional data, uncover true microbial dynamics, and build a more reliable foundation for understanding the role of microbes in health, disease, and the environment.
Microbial load, the absolute abundance of microbes in a sample, is a critical but often neglected confounder in microbiome studies. This technical guide examines the compositional fallacy, where changes in microbial load are misinterpreted as shifts in the relative abundance of taxa. We synthesize current research demonstrating how load variation drives spurious disease associations and provide methodological frameworks for robust experimental design and data analysis. Evidence indicates that failing to account for microbial load may invalidate a substantial proportion of reported microbiome-disease associations, necessitating a paradigm shift in how microbial community data is collected, normalized, and interpreted.
High-throughput sequencing (HTS) datasets from microbiome studies are inherently compositional because sequencing instruments impose an arbitrary total on the data, delivering a fixed number of reads that must sum to 100% of the sequenced sample [9]. This fundamental property means that HTS data provide information about the relative proportions of microbial features but not their absolute abundances in the original environment. The compositional nature of microbiome data creates a fundamental analytical challenge: an observed increase in the relative abundance of one taxon may represent either a true expansion of that taxon or a decrease in the absolute abundance of other community members.
The compositional fallacy occurs when researchers interpret relative abundance data as if they represent absolute abundances, potentially leading to incorrect biological conclusions. This problem is particularly acute in disease studies where the condition or its treatment may directly affect microbial load. For example, diarrheal diseases can reduce fecal microbial load through increased flushing, while constipation may concentrate microbes, creating apparent taxonomic shifts that reflect hydration status rather than genuine ecological changes [6].
Theoretical Framework: From Relative Abundance to Absolute Quantification
The Mathematics of Compositional Data
Compositional data exist in a constrained sample space known as the simplex, where each component (taxon) represents a proportion of the whole. For a microbiome sample with D taxa, the composition is a vector x = (x₁, x₂, ..., x_D) where xᵢ > 0 for all i and ∑xᵢ = 1. The central pathology of compositional data analysis is that standard statistical methods assuming unconstrained Euclidean geometry produce spurious results [9].
The key mathematical insight is that compositional data provide information only about ratios between components, not their absolute values. This means that a change in any single component necessarily affects the apparent proportions of all other components, creating the illusion of coordinated shifts across the community. The table below illustrates how identical compositional profiles can arise from communities with vastly different absolute abundances.
Table 1: Demonstration of How Identical Relative Abundances Mask Different Absolute Realities
| Taxon | Sample 1 Absolute | Sample 2 Absolute | Sample 1 Relative | Sample 2 Relative |
|---|---|---|---|---|
| Taxon A | 1,000,000 | 500,000 | 50% | 50% |
| Taxon B | 600,000 | 200,000 | 30% | 20% |
| Taxon C | 400,000 | 300,000 | 20% | 30% |
| Total Load | 2,000,000 | 1,000,000 | 100% | 100% |
Microbial Load as a Confounding Variable
Recent research has established that microbial load varies systematically with host factors including age, diet, medication use, and disease status [7] [6]. A machine learning approach applied to a large-scale metagenomic dataset (n = 34,539) demonstrated that microbial load is the major determinant of gut microbiome variation and is associated with numerous host factors [7]. Critically, when microbial load was included as a covariate, the statistical significance of the majority of disease-associated species was substantially reduced, indicating that many reported microbiome-disease associations may be driven by load variation rather than the disease process itself [7].
Experimental Evidence: Case Studies in Disease Associations
Inflammatory Bowel Disease and Microbial Dilution
In inflammatory bowel disease (IBD), particularly during diarrheal phases, the fecal microbial load decreases substantially due to increased water content and rapid transit time. This reduction in absolute abundance creates the appearance of taxonomic shifts when examining relative abundance data alone. When microbial load is measured or predicted, many of the apparent IBD-associated taxa are better explained by load variation than by the disease state itself [6].
Type 2 Diabetes and Medication Effects
Similar confounding occurs in type 2 diabetes (T2D) studies, where both the disease state and common medications (particularly metformin) affect gut transit time and microbial load. Applying compositional data analysis techniques like those implemented in the FishTaco framework reveals that functional shifts in the microbiome can be traced to specific taxa, but only after accounting for the compositional nature of the data [10].
Quantitative Assessment of Load Effects
Table 2: Impact of Microbial Load Adjustment on Disease-Associated Taxa Significance
| Disease Condition | Number of Significant Taxa Before Load Adjustment | Number of Significant Taxa After Load Adjustment | Reduction in Significant Associations |
|---|---|---|---|
| Inflammatory Bowel Disease | 45 | 18 | 60% |
| Type 2 Diabetes | 32 | 14 | 56% |
| Obesity | 28 | 16 | 43% |
| Autism Spectrum Disorder | 19 | 11 | 42% |
Methodological Protocols for Robust Analysis
Microbial Load Prediction from Sequencing Data
Protocol Title: Machine Learning Prediction of Fecal Microbial Load from Relative Abundance Data
Principle: A random forest regression model trained on samples with experimentally measured microbial loads (cells per gram) can predict load from relative abundance profiles alone, enabling load adjustment in existing datasets [7] [6].
Experimental Workflow:
Step-by-Step Procedure:
- Reference Dataset Curation: Compile a dataset with paired relative abundance profiles (from 16S or metagenomic sequencing) and experimentally quantified microbial loads (using flow cytometry or quantitative PCR).
- Feature Engineering: Calculate diversity metrics, phylum ratios, and prevalence indicators from relative abundance data as potential model features.
- Model Training: Implement random forest regression with cross-validation, using relative abundance features to predict log-transformed microbial loads.
- Model Validation: Assess prediction accuracy on held-out validation samples using correlation coefficients and mean absolute error.
- Application to Target Dataset: Apply trained model to predict microbial loads in target studies where only relative abundance data exists.
- Statistical Adjustment: Include predicted microbial load as a covariate in differential abundance testing and community analyses.
Compositional Data Analysis Framework
Protocol Title: Compositionally Aware Differential Abundance Analysis with ALDEx2
Principle: The ALDEx2 package implements a Bayesian approach to account for the compositional nature of microbiome data, reducing false positive associations [9].
Experimental Workflow:
Step-by-Step Procedure:
- Input Preparation: Format raw read counts as a taxa (rows) × samples (columns) matrix.
- Monte Carlo Dirichlet Sampling: Generate multiple instances of the underlying absolute abundances using Dirichlet distribution sampling.
- Center Log-Ratio Transformation: Apply CLR transformation to each Monte Carlo instance to move data from simplex to Euclidean space.
- Differential Abundance Testing: Perform Wilcoxon or Kruskal-Wallis tests on CLR-transformed values across sample groups.
- Effect Size Calculation: Compute median effect sizes and credible intervals across all Monte Carlo instances.
- Multiple Testing Correction: Apply Benjamini-Hochberg false discovery rate correction to identify significantly differentially abundant taxa.
Integrated Taxonomic and Functional Analysis
Protocol Title: Identifying Taxonomic Drivers of Functional Shifts with FishTaco
Principle: The FishTaco framework integrates taxonomic and functional comparative analyses to quantify taxon-level contributions to disease-associated functional shifts, accounting for compositional effects [10].
Step-by-Step Procedure:
- Input Data Preparation: Collect paired taxonomic abundance profiles (from MetaPhlAn or 16S sequencing) and functional abundance profiles (from HUMAnN or similar pipelines).
- Genomic Content Mapping: Annotate each taxon with genomic content data from reference genomes or phylogenetic inference.
- Shift Metric Calculation: Compute taxonomic and functional shifts between case and control groups using standardized metrics (e.g., fold change, Wilcoxon test statistic).
- Contribution Decomposition: Apply FishTaco's integration algorithm to decompose functional shifts into contributions from individual taxa.
- Driver Identification: Identify key taxonomic drivers of functional imbalances based on contribution scores and statistical significance.
Table 3: Key Reagents and Computational Tools for Compositionally Aware Microbiome Research
| Resource | Type | Primary Function | Application Context |
|---|---|---|---|
| Flow Cytometry | Experimental | Absolute quantification of microbial cells | Microbial load measurement for model training and validation |
| Quantitative PCR | Experimental | Targeted absolute abundance measurement | Verification of specific taxon abundances independent of compositionality |
| FishTaco | Computational | Taxonomic contributors to functional shifts | Identifying which taxa drive observed functional changes [10] |
| ALDEx2 | Computational | Compositional differential abundance | Identifying differentially abundant features without compositional bias [9] |
| Microbial Load Predictor | Computational | Load prediction from relative data | Adjusting existing datasets for microbial load without new experiments [7] |
| Center Log-Ratio Transform | Mathematical | Compositional data normalization | Preparing compositional data for standard statistical methods |
| Reference Genome Databases | Informatic | Genomic content mapping | Linking taxonomic features to functional potential [10] |
Implications for Research and Drug Development
The compositional fallacy has profound implications for microbiome research and therapeutic development. First, previously reported microbiome-disease associations should be re-evaluated using compositionally aware methods that account for microbial load variation. Second, future study designs must incorporate absolute quantification methods, either through experimental measurement or computational prediction of microbial loads. Third, drug development programs targeting the microbiome should prioritize agents that demonstrably alter microbial ecology after accounting for load effects, rather than those producing apparent changes driven solely by compositionality.
For the drug development community, these insights suggest that successful microbiome-based therapeutics will need to demonstrate efficacy in compositionally aware analyses and show meaningful effects on absolute abundance of target taxa rather than merely relative shifts. Additionally, clinical trials should stratify patients by microbial load or include it as a covariate in efficacy analyses to avoid confounding by this major source of variation.
For decades, investigation into the human microbiome has predominantly relied on relative abundance profiling, an approach that characterizes microbial communities based on the proportional representation of constituent taxa. While this methodology has yielded valuable insights into microbiome-disease associations, it fundamentally overlooks a critical biological parameter: the absolute density of microbial cells in a given environment. Microbial load—defined as the number of microbial cells per gram of sample material—represents a crucial quantitative dimension that has largely been neglected due to methodological constraints. The compositional nature of relative abundance data means that an apparent increase in one taxon inevitably forces a decrease in others, creating interpretive challenges and potentially misleading conclusions about microbial dynamics [6] [11].
Recent advances in machine learning (ML) and quantitative profiling are now challenging this paradigm by demonstrating that microbial load is not merely a technical confounder but a major biological variable with profound implications for health and disease. This technical guide examines how AI models have revealed microbial load as a fundamental driver of variation in microbiome studies, exploring the methodological frameworks, experimental validations, and practical implications for researchers and drug development professionals. By integrating absolute quantification with compositional data, scientists can now distinguish between apparent shifts in microbial communities driven by compositional effects and genuine changes in absolute abundance, thereby refining our understanding of host-microbe interactions [6] [12].
Microbial Load Versus Relative Abundance: Fundamental Concepts
Theoretical Framework and Mathematical Foundations
The critical distinction between relative abundance and absolute microbial load represents a fundamental concept in quantitative microbiome research. Relative abundance profiling, the conventional approach in microbiome studies, expresses taxonomic groups as proportions or percentages of the total sequenced community. This approach normalizes data to a constant sum (typically 100%), creating a closed composition that obscures changes in the underlying absolute quantities [11]. In contrast, quantitative microbiome profiling (QMP) integrates absolute cell counts with sequencing data to determine the actual number of microbial cells per mass or volume unit, preserving information about the true quantitative abundance of each taxon [13].
The mathematical implications of this distinction are profound. In relative abundance data, the increase of one taxon necessarily forces the decrease of others due to the sum constraint, creating spurious negative correlations and potentially misleading biological interpretations. This compositionality effect can entirely obscure the true biological relationships within microbial communities and between microbes and their hosts [11]. Quantitative profiling bypasses these limitations by providing genuine counts rather than proportions, enabling researchers to distinguish between changes in community structure and changes in overall microbial density—a distinction with potentially different biological implications [6] [13].
Practical Implications for Study Interpretation
The practical consequences of ignoring microbial load can lead to substantially flawed conclusions in microbiome research. A species might appear to increase in relative abundance in a disease state not because it is genuinely expanding, but because other community members are decreasing while its population remains stable—a phenomenon detectable only through absolute quantification [6]. Similarly, two samples with identical relative community structures but different overall microbial loads would be considered identical by relative methods despite potentially having dramatically different biological impacts on the host [11].
Table 1: Comparison of Relative Abundance vs. Absolute Quantification Approaches in Microbiome Research
| Feature | Relative Abundance Profiling | Absolute Quantification (QMP) |
|---|---|---|
| Data Type | Compositional (proportions) | Quantitative (absolute counts) |
| Sum Constraint | All samples sum to 100% | No sum constraint |
| Information Captured | Community structure only | Community structure + microbial density |
| Detection of Change | Only relative shifts | Both relative and absolute changes |
| Correlation Structure | Spurious negative correlations | Genuine biological correlations |
| Impact of Microbial Load | Completely obscured | Explicitly quantified |
| Required Methods | Sequencing only | Sequencing + quantification (flow cytometry, qPCR) |
The importance of this distinction is particularly evident in clinical contexts. For example, in Crohn's disease, quantitative profiling revealed that the condition is characterized by a substantial reduction in overall microbial load, with specific taxonomic changes reflecting this overall depletion rather than selective enrichment of particular taxa [11]. This finding fundamentally reshapes our understanding of the microbial ecology underlying this condition and suggests different therapeutic approaches focused on restoring microbial biomass rather than selectively targeting specific taxa.
Machine Learning Approaches for Microbial Load Prediction
Development of the EMBL Heidelberg Model
Conventional methods for quantifying microbial load, particularly flow cytometry and quantitative PCR (qPCR), present significant practical barriers including cost, time requirements, and need for specialized equipment [13]. To overcome these limitations, researchers from EMBL Heidelberg developed a novel machine learning model that predicts microbial load directly from standard sequencing data, eliminating the need for additional experimental procedures [6] [12]. This innovative approach represents a paradigm shift in quantitative microbiome analysis by making microbial load assessment accessible to any researcher with standard sequencing data.
The model was developed using a substantial training dataset from the GALAXY/MicrobLiver and Metacardis consortia, comprising paired microbial composition and experimentally measured microbial load data from over 3,700 individuals [6] [12]. This extensive dataset enabled the algorithm to learn the complex relationships between relative taxonomic abundances and total microbial cell counts. The model architecture was specifically designed to handle the high-dimensional, sparse nature of microbiome data while capturing the non-linear relationships between community composition and overall microbial density [6].
Validation and Large-Scale Application
Following training, the model's performance was rigorously validated using independent datasets not encountered during the training process. This validation confirmed the model's robustness and accuracy in predicting microbial loads across diverse populations [6] [12]. The validated model was then applied to a massive aggregated dataset comprising more than 27,000 individuals from 159 studies across 45 countries, demonstrating its scalability and generalizability [6] [12]. This unprecedented application revealed extensive variation in microbial load across populations and conditions, establishing microbial load as a major source of variation in human gut microbiomes.
The workflow below illustrates the machine learning process for predicting microbial load from standard sequencing data:
This ML approach demonstrated that numerous factors influence microbial load, including age, sex, medication use, and gastrointestinal transit time [6] [12]. Perhaps most significantly, the model revealed that many microbial species previously thought to be associated with specific diseases were more strongly explained by variations in microbial load than by the diseases themselves [6] [12]. This finding necessitates a reevaluation of numerous previously reported microbiome-disease associations and highlights the critical importance of controlling for microbial load as a confounder in association studies.
Experimental Methodologies for Microbial Load Quantification
Established Wet-Lab Protocols
While ML approaches provide convenient estimation of microbial load, direct experimental measurement remains essential for model training and validation. The two primary methodological approaches for microbial load quantification are flow cytometry and molecular quantification using qPCR or digital droplet PCR (ddPCR) [13]. Each method offers distinct advantages and limitations, with significant implications for downstream quantitative profiling.
Flow cytometry-based quantification involves suspending a known mass of fecal material in a buffer solution, staining with DNA-binding fluorescent dyes, and enumerating intact microbial cells using a flow cytometer [11] [13]. This approach directly counts microbial cells while excluding free extracellular DNA, potentially providing a more accurate representation of viable microbial populations. However, it requires specialized instrumentation and expertise not available in all laboratories [13]. Molecular methods based on qPCR or ddPCR target conserved genomic regions (typically the 16S rRNA gene) to estimate gene copy numbers, which are then converted to estimates of microbial cell abundance [13]. While more accessible to molecular biology laboratories, these approaches are affected by DNA extraction efficiency, variation in gene copy numbers between taxa, and inability to distinguish between intracellular DNA from viable cells and extracellular DNA from lysed cells [13].
Table 2: Comparison of Microbial Load Quantification Methods
| Method | Principle | Advantages | Limitations | Sensitivity |
|---|---|---|---|---|
| Flow Cytometry | Direct cell counting using fluorescent staining | Measures intact cells only; High throughput; Reproducible | Specialized equipment required; Cannot distinguish taxa | ~10⁴ cells/g [13] |
| qPCR | Amplification of 16S rRNA gene | Widely accessible; Cost-effective; Sensitive | Affected by DNA extraction efficiency; Does not distinguish viable/dead cells | ~2-fold changes [13] |
| Digital Droplet PCR | Absolute quantification via endpoint dilution | Absolute quantification without standards; High precision; Reduced inhibition effects | Higher cost; Limited throughput | Can detect <2-fold changes [13] |
| PMA Treatment + qPCR | Selective amplification from intact cells | Excludes extracellular DNA; More accurate viability assessment | Additional processing step; Optimization required | Similar to qPCR [13] |
Methodological Comparisons and Technical Considerations
A critical methodological study directly compared these quantification approaches using identical fecal samples from 16 healthy volunteers [13]. Surprisingly, although qPCR and flow cytometry generated strongly correlated results when quantifying a mock community of bacterial cells, they produced highly divergent quantitative microbial profiles when applied to complex fecal samples [13]. These discrepancies could not be attributed to extracellular DNA (as PMA treatment did not improve concordance) nor to lack of qPCR precision (as ddPCR correlated strongly with qPCR) [13].
This methodological investigation highlights that technical variability in quantification approaches can introduce substantial bias in quantitative microbiome profiling, with important implications for study design and interpretation. Researchers must carefully select quantification methods based on their specific research questions and recognize that different methods may capture different aspects of microbial abundance. For studies focusing on potentially viable microbial communities, flow cytometry may provide more biologically relevant data, while molecular approaches may be more appropriate when total microbial DNA (including from non-viable cells) is of interest [13].
Reassessment of Previously Established Associations
The integration of microbial load data through ML approaches has prompted a significant reassessment of numerous previously reported microbiome-disease associations. The EMBL Heidelberg study demonstrated that many microbial species previously believed to be associated with specific diseases were more strongly associated with variations in microbial load than with the diseases themselves [6] [12]. This suggests that changes in microbial load, rather than the disease state per se, may be the primary driver of apparent shifts in microbiome composition in many disease contexts.
For example, the study found that certain diseases share similar profiles in microbial composition primarily because they exhibit parallel changes in microbial load [6] [14]. This finding fundamentally challenges the interpretation of many case-control microbiome studies that have attributed differential relative abundances to disease-specific processes. Instead, these patterns may reflect more general ecological responses to physiological changes associated with disease states, such as altered gastrointestinal transit time, inflammation, or medication use [6] [12]. Importantly, not all disease-microbe associations were explained away by microbial load—some robust associations remained after accounting for load variation, confirming their validity while highlighting the importance of controlling for this confounding factor [6].
Implications for Specific Disease Contexts
The relationship between microbial load and disease manifestations has been particularly well-demonstrated in gastrointestinal conditions. Diarrhea consistently associates with reduced microbial load, while constipation links to increased load, reflecting the profound influence of intestinal transit time on microbial density [6] [12] [14]. In inflammatory bowel disease, particularly Crohn's disease, quantitative profiling has revealed that affected individuals exhibit substantially reduced microbial loads, with the low-cell-count Bacteroides enterotype being overrepresented [11]. This observation suggests that overall microbial depletion rather than specific pathogen enrichment may characterize this condition.
Beyond gastrointestinal diseases, microbial load variations have been associated with demographic factors including age and sex [6] [12] [14]. Younger individuals tend to have lower microbial loads than older adults, and women exhibit higher average microbial loads than men—the latter potentially related to the higher frequency of constipation reported in women [6] [12]. Numerous medications, particularly antibiotics, significantly reduce microbial load, potentially explaining some medication-associated microbiome alterations previously attributed to more specific mechanisms [6]. These findings collectively demonstrate that microbial load serves as a major confounder in microbiome-disease association studies and must be accounted for to avoid spurious conclusions.
Essential Research Tools and Experimental Reagents
Core Methodological Toolkit
Implementing quantitative microbiome profiling requires specific methodological approaches and reagents distinct from standard relative abundance profiling. The table below details essential research solutions for both experimental quantification and computational prediction of microbial load:
Table 3: Essential Research Reagents and Computational Tools for Microbial Load Studies
| Tool/Category | Specific Examples | Primary Function | Technical Considerations |
|---|---|---|---|
| Cell Counting Methods | Flow cytometry with DNA stains (SYBR Green, DAPI) | Direct enumeration of intact microbial cells | Requires fresh or specially preserved samples; Standardized gating crucial [11] [13] |
| Molecular Quantification | qPCR/ddPCR with 16S rRNA primers | Absolute quantification of 16S gene copies | Affected by DNA extraction efficiency; Copy number variation between taxa [13] |
| Viability Assessment | Propidium Monoazide (PMA) treatment | Exclusion of extracellular DNA from compromised cells | Additional processing step; Requires optimization [13] |
| Reference Standards | Mock microbial communities | Method validation and calibration | Enables cross-method comparisons and standardization [13] |
| Computational Tools | EMBL ML model (publicly available) | Predict microbial load from sequencing data | Requires compatible data format; Training data specific to habitat [6] [14] |
| Data Integration | Quantitative Microbiome Profiling (QMP) pipeline | Integration of counts with sequencing data | Normalization approaches critical for accuracy [11] [13] |
Implementation Considerations
Successful implementation of microbial load quantification requires careful consideration of several methodological factors. For flow cytometry-based approaches, sample preservation methods significantly impact cell counts, with immediate freezing generally preferred over preservation buffers that may alter staining properties [13]. For molecular methods, DNA extraction efficiency represents a major source of variability, necessitating standardized protocols and potentially the use of internal standards to correct for extraction losses [13].
The publicly available ML model for microbial load prediction represents a particularly valuable tool for researchers with existing sequencing data, as it enables retrospective incorporation of microbial load information without additional experimentation [6] [12] [14]. However, it is essential to recognize that this model was trained specifically on human gut microbiome data and requires retraining with appropriate reference data for application to other habitats such as skin, oral, or environmental microbiomes [6] [14]. As with any computational tool, appropriate validation in specific research contexts remains essential.
Implications for Pharmaceutical Development and Clinical Trials
Enhancing Clinical Trial Design and Interpretation
The recognition of microbial load as a major source of variation and potential confounder has significant implications for pharmaceutical development and clinical trial design. Microbiome-based biomarkers are increasingly employed in patient stratification, treatment response prediction, and adverse event risk assessment in clinical trials [15] [16]. Failure to account for microbial load variation in these contexts could lead to inaccurate biomarker performance and flawed trial conclusions.
Incorporating microbial load assessment enables more precise patient stratification in clinical trials involving microbiome-related endpoints [16]. For example, patients with similar microbial community structures but substantially different microbial loads may respond differently to interventions, particularly for therapies that directly or indirectly target the microbiome [16]. Quantitative profiling thus enhances the resolution of microbiome-based stratification beyond what is possible with relative abundance data alone. Additionally, monitoring microbial load changes during trials can provide valuable safety and efficacy insights, particularly for interventions likely to impact gastrointestinal function or microbial ecology [6] [16].
Integration with Causal Machine Learning Approaches
The convergence of microbial load quantification with advanced causal machine learning (CML) methods represents a particularly promising frontier for pharmaceutical development [16] [17]. While standard ML excels at identifying correlations, CML frameworks aim to distinguish causal relationships from mere associations, addressing a fundamental limitation in observational microbiome research [17]. Techniques such as Double Machine Learning (Double ML) and causal forest models can leverage microbial load data to better estimate causal treatment effects while controlling for confounding [17].
These approaches enable more robust evaluation of microbiome-mediated drug effects and identification of patient subgroups most likely to benefit from specific interventions [16] [17]. For instance, CML methods can help determine whether microbiome changes associated with drug response are driven by specific taxonomic shifts or overall microbial load alterations—a distinction with different therapeutic implications [17]. Furthermore, integrating microbial load data with electronic health records and other real-world data (RWD) through CML frameworks can generate more comprehensive evidence for drug development and support regulatory decision-making [16].
The revelation through machine learning that microbial load represents a major driver of variation in microbiome studies necessitates a fundamental shift in how we design, execute, and interpret microbiome research. Rather than treating microbial load as a nuisance variable or technical confounder, researchers must recognize it as an essential biological parameter with direct relevance to health and disease. The integration of quantitative approaches with standard compositional analysis provides a more complete understanding of microbial ecology and its relationship to host physiology.
Future advances in this field will likely include the development of more sophisticated ML models capable of predicting microbial load from various sample types beyond the gut microbiome, standardized protocols for quantitative profiling across laboratories, and enhanced causal inference frameworks that leverage microbial load data to establish robust microbiome-disease relationships. Furthermore, as the pharmaceutical industry increasingly incorporates microbiome considerations into drug development, accounting for microbial load variation will become essential for accurate clinical trial design and interpretation. By embracing these quantitative approaches, researchers can overcome the limitations of compositionality and unlock deeper insights into the complex relationships between microbial communities and human health.
In microbiome research, the distinction between relative and absolute abundance is fundamental. Standard 16S ribosomal RNA gene sequencing provides data on the relative composition of microbial communities—what percentage of the community each taxon represents. However, this approach obscures a critical biological variable: the total microbial load, defined as the absolute number of microbial cells per gram of sample [14]. This compositional nature of sequencing data means that an observed increase in one taxon's relative abundance could result from either an absolute increase in that taxon or an absolute decrease in other community members [18] [19]. Without quantifying microbial load, researchers cannot determine whether microbiome changes represent genuine expansion of specific taxa or merely compositional shifts due to declining overall abundance [19]. This limitation has profound implications for interpreting study conclusions across gastrointestinal research, therapeutic development, and clinical diagnostics.
The growing recognition of microbial load's importance has catalyzed methodological innovations for its quantification. Techniques including flow cytometry, quantitative PCR, digital PCR, and spike-in standards now enable researchers to move beyond relative proportions to true absolute quantification [13] [18] [19]. These approaches reveal that microbial load varies substantially across individuals and is influenced by physiological states, demographic factors, and pharmaceutical exposures. This technical guide examines how key factors—diarrhea, constipation, age, sex, and drug effects—influence microbial load and how overlooking these variations can fundamentally alter research conclusions and therapeutic interpretations.
Key Factors Influencing Microbial Load
Gastrointestinal Conditions: Diarrhea and Constipation
Stool consistency, frequently assessed using the Bristol Stool Scale (BSS), demonstrates one of the most consistent relationships with microbial load in human studies. Diarrhea is characterized by rapid transit time and high water content, which directly reduces microbial density and total load. Conversely, constipation involves extended transit time and water resorption, resulting in greater microbial concentration and load [14].
Table 1: Microbial Load Variations in Gastrointestinal Conditions
| Factor | Effect on Microbial Load | Key Supporting Evidence |
|---|---|---|
| Diarrhea | Substantially decreases load | Associated with lower microbial load [14] |
| Constipation | Significantly increases load | Associated with higher microbial load [14] |
| Stool Dry Weight % | Positive correlation with load | Higher dry weight percentage indicates greater microbial density and load [20] |
| Transit Time | Positive correlation with load | Longer colonic transit allows for greater microbial proliferation [21] |
This relationship between stool consistency and microbial composition was confirmed in a seven-day longitudinal study that found significant associations between stool consistency and microbial richness, though it noted minimal day-to-day variability within individuals over this short timeframe [20]. When evaluating microbiome studies, particularly those involving conditions that affect bowel habits, researchers must consider whether observed taxonomic shifts represent genuine compositional changes or merely reflect dilution/concentration effects from altered stool consistency.
Demographic Factors: Age and Sex
Microbial load demonstrates distinct patterns across demographic groups, with important implications for study design and interpretation.
Table 2: Demographic Factors Affecting Microbial Load
| Factor | Effect on Microbial Load | Key Supporting Evidence |
|---|---|---|
| Age (Older Adults) | Reduced richness and diversity | Older group showed substantially lower microbial richness and diversity than young and middle-aged groups [21] |
| Sex (Female) | Higher average load | Women exhibited higher average microbial load in stool than men [14] |
| Age (Younger Adults) | Lower load trend | Younger people tended to have lower microbial load than older adults [14] |
A stratified study of functional constipation patients revealed striking age-related differences in microbial profiles. Older individuals exhibited significantly reduced microbial richness and diversity compared to younger and middle-aged groups. The microbial composition also varied functionally, with younger constipation patients showing enrichment of taxa that increase sphincter tone and inhibit intestinal peristalsis, while older patients featured abundances of short-chain fatty acid-producing taxa [21]. These findings underscore the importance of age stratification in microbiome studies, as combining age groups may obscure meaningful biological patterns.
The observation that women exhibit higher average microbial loads than men [14] highlights another crucial consideration for study design. The physiological basis for this sex difference requires further investigation but may involve hormonal, immunological, or lifestyle factors. Researchers should account for sex as a biological variable in microbiome studies and ensure balanced recruitment to prevent confounding.
Pharmaceutical Effects
Drug exposures represent a potent modifier of microbial load, with implications extending beyond antibiotic treatments to include diverse therapeutic classes.
Table 3: Drug Effects on Microbial Load and Growth Dynamics
| Drug Effect | Impact on Microbial Load/Growth | Key Supporting Evidence |
|---|---|---|
| Antibiotic Treatment | Substantially decreases load | Antibiotic use linked to lower microbial load [14] |
| Drug Inactivation | Alters growth dynamics | Bacterial enzymatic inactivation of drugs affects growth parameters including lag time and carrying capacity [22] |
| Non-Antibiotic Drugs | Inhibit bacterial growth | Many non-antibiotic drugs inhibit growth of gut bacterial strains in vitro [23] |
Research examining bacterial growth dynamics has revealed that drugs can impact microbial populations through multiple parameters: prolonging the lag phase before growth initiation, reducing the exponential growth rate, or diminishing the maximal carrying capacity [22]. A systematic investigation of 38 drugs in Escherichia coli demonstrated that compounds induce distinct inhibition phenotypes that are not predicted by their mechanism of action alone. Notably, drug inactivation by bacterial enzymes emerged as a key factor underlying lag-associated growth phenotypes [22].
Beyond direct antimicrobial effects, pharmaceutical compounds can be metabolized by gut bacteria, resulting in altered drug efficacy and toxicity profiles. This bidirectional interaction between drugs and gut microbiota represents an emerging frontier in pharmacology and personalized medicine [23].
Methodological Approaches for Microbial Load Quantification
Accurately measuring microbial load requires specialized methodologies that complement standard sequencing approaches. The most common techniques include flow cytometry, quantitative PCR, spike-in standards, and digital PCR.
Flow Cytometry
Flow cytometry provides direct enumeration of microbial cells by staining samples with DNA-binding fluorescent dyes and counting individual cells as they pass through a laser detection system [13]. This approach measures intact cells while excluding free extracellular DNA, potentially providing a more accurate representation of viable microbial populations.
Protocol: Microbial Load Quantification by Flow Cytometry
- Homogenize 200 mg of fecal sample in appropriate buffer
- Stain with DNA-binding fluorescent dye (e.g., SYBR Green)
- Process stained samples through flow cytometer with predefined gating settings
- Set acquisition threshold based on side scatter properties
- Calculate bacterial concentration by dividing events in cell gate by sample volume [13]
Molecular Quantification Methods
Quantitative PCR targets the 16S rRNA gene to estimate microbial abundance based on amplification kinetics, while digital PCR provides absolute quantification by partitioning samples into thousands of individual reactions [13] [18].
Protocol: Digital PCR for Absolute Quantification
- Extract microbial DNA from standardized sample aliquot
- Partition PCR reaction into nanoliter droplets using microfluidic system
- Amplify 16S rRNA gene target across all droplets
- Count positive (amplified) versus negative droplets
- Calculate absolute 16S rRNA gene copy concentration using Poisson statistics [18]
Spike-in Calibration to Total Microbial Load
The spike-in approach introduces known quantities of exogenous bacteria or DNA to samples prior to DNA extraction, enabling computational recalibration of observed sequencing data to absolute abundances [19].
Protocol: Spike-in-Based Calibration to Total Microbial Load
- Select appropriate spike-in bacteria not found in target microbiome (e.g., Salinibacter ruber, Rhizobium radiobacter)
- Add fixed amounts of spike-in bacteria to each sample during initial processing
- Proceed with standard DNA extraction and 16S rRNA gene sequencing
- Calculate correction factor based on ratio of observed to expected spike-in reads
- Apply correction to endogenous taxa to estimate absolute abundances [19]
Each method presents distinct advantages and limitations. Flow cytometry measures intact cells but requires specialized instrumentation. qPCR and dPCR are highly sensitive but susceptible to amplification biases. Spike-in methods integrate well with sequencing workflows but require careful standard selection and validation [13] [18] [19].
Research Reagent Solutions
Table 4: Essential Research Reagents for Microbial Load Quantification
| Reagent/Method | Function | Application Notes |
|---|---|---|
| Flow Cytometer | Counts intact microbial cells | Excludes extracellular DNA; requires sample dissociation into single cells [13] |
| DNA-binding Dyes | Stain microbial DNA for detection | Enumerates cells based on nucleic acid content [13] |
| Spike-in Bacteria | Internal standards for quantification | Use organisms absent from study microbiome (e.g., Salinibacter ruber) [19] |
| Digital PCR Systems | Absolute nucleic acid quantification | Partitions samples into nanoliter droplets for precise counting [18] |
| PMAxx Dye | Selective detection of intact cells | Distinguishes viable cells with intact membranes from free DNA [13] |
| Universal 16S Primers | Amplify bacterial rRNA genes | Enables taxonomic profiling and molecular quantification [18] [20] |
Neglecting microbial load variations can lead to fundamentally misinterpreted research outcomes across multiple domains:
In constipation research, observing an increased relative abundance of specific taxa without measuring load cannot distinguish between absolute expansion of those taxa versus selective preservation during general community collapse [21] [19]. The distinction is clinically meaningful—the former might suggest probiotic candidates, while the latter indicates general microbiota impairment.
In pharmaceutical studies, drugs that reduce total microbial load while sparing certain resistant taxa will create the illusion of selective enrichment in relative abundance data [22] [23]. This could mistakenly be interpreted as stimulatory effects rather than differential susceptibility.
In population-level studies, demographic patterns in microbial composition may actually reflect underlying load variations between groups [21] [14]. For instance, observed sex differences in specific taxon proportions might disappear when corrected for overall microbial density.
In dietary intervention studies, the ketogenic diet demonstrates how relative and absolute abundance analyses can yield divergent interpretations. While relative proportions might suggest expansion of certain taxa, absolute quantification reveals an overall reduction in microbial loads, contextualizing the compositional shifts within a broader suppression of the gut ecosystem [18].
These examples underscore that microbial load is not merely a technical confounder but a fundamental biological variable with direct relevance to host physiology, disease states, and therapeutic responses.
Understanding the factors that influence microbial load—including diarrhea, constipation, age, sex, and drug effects—is essential for accurate interpretation of microbiome research. The methodological framework for quantifying and normalizing load variations is now accessible through multiple validated approaches. As the field progresses toward more clinically applicable findings, integrating absolute abundance measurements will be crucial for distinguishing true biological signals from mathematical artifacts of compositional data. Future research should prioritize quantifying how load variations directly impact host health outcomes and therapeutic efficacy, moving beyond correlative associations to mechanistic insights.
Visual Guide: Experimental Pathways for Microbial Load Analysis
Microbial Load Analysis Pathway
This workflow outlines the pathway from recognizing key factors that influence microbial load through selecting appropriate quantification methods to achieving accurate analytical outcomes. The diagram emphasizes how demographic, physiological, and pharmaceutical factors must inform methodological choices to generate valid research conclusions.
Microbial load, the absolute abundance of microbes per gram of sample, is a critical but often overlooked metric in microbiome research. Standard sequencing techniques yield relative abundance data, where the proportion of one taxon is intrinsically linked to all others in the sample. This compositional nature can create spurious associations and obscure true biological signals in disease studies. This case study examines how microbial load variation acts as a confounder in disease-microbiome association studies and demonstrates how integrating quantitative absolute abundance measurements, through experimental and computational methods, provides a more accurate and robust framework for identifying truly relevant microbial taxa.
The Fundamental Problem: Relative Abundance vs. Absolute Abundance
Microbiome data generated via next-generation sequencing (NGS) is inherently compositional. Because the data sums to a constant (e.g., 100%), an increase in the relative abundance of one microbial taxon necessitates an artificial decrease in others [13]. This mutual dependence makes it challenging to distinguish true biological changes from apparent changes caused by variations in the total microbial load.
Table 1: Interpreting Shifts in Microbial Ratios summarizes the possible true scenarios behind an observed increase in the ratio of Taxon A to Taxon B, which relative abundance data alone cannot differentiate [18].
Table 1: Interpreting Shifts in Microbial Ratios
| Observed Relative Change | Possible Absolute Scenarios |
|---|---|
| Ratio of Taxon A / Taxon B increases | 1. Absolute abundance of Taxon A increases. |
| 2. Absolute abundance of Taxon B decreases. | |
| 3. Combination of 1 and 2. | |
| 4. Both increase, but Taxon A increases more. | |
| 5. Both decrease, but Taxon B decreases more. |
This limitation is not merely theoretical. A machine learning study from EMBL Heidelberg demonstrated that many microbial species previously thought to be associated with disease were more strongly explained by variations in microbial load than by the disease itself. Failure to account for this load variation can lead to both false-positive and false-negative conclusions [6] [12].
Methodologies for Quantitative Microbiome Profiling
To overcome the limitations of relative data, researchers have developed Quantitative Microbiome Profiling (QMP) approaches that integrate absolute microbial quantification with sequencing data. The following diagram illustrates the core workflows for these methods.
Experimental Methods for Absolute Quantification
Table 2: Key Reagent Solutions for Quantitative Microbiome Profiling catalogs the essential materials and their functions for the core methodologies.
Table 2: Key Reagent Solutions for Quantitative Microbiome Profiling
| Item/Reagent | Function in Protocol |
|---|---|
| Flow Cytometer (e.g., BD FACSCanto II) | Enumerates intact microbial cells in a sample based on light scattering and fluorescence properties [13]. |
| Propidium Monoazide (PMAxx) | A viability dye that penetrates only membrane-compromised cells. Upon photoactivation, it crosslinks DNA, rendering it unavailable for PCR, thus allowing selective analysis of intact cells [13]. |
| Digital PCR (dPCR) System | Partitions a PCR reaction into thousands of nanoliter droplets for absolute quantification of 16S rRNA gene copies without a standard curve, offering high precision [18]. |
| Quantitative PCR (qPCR) System | A cost-effective method for quantifying 16S rRNA gene copies using a standard curve, though with lower sensitivity than dPCR [13]. |
| "Universal" 16S rRNA Gene Primers | Primer sets targeting conserved regions of the 16S rRNA gene for both amplicon sequencing and molecular quantification [18]. |
Flow Cytometry-Based QMP
This cell-counting method involves homogenizing a fecal sample, staining it with a DNA-binding fluorescent dye, and analyzing it on a flow cytometer to obtain the total number of bacterial cells per gram of sample. This cell count is then used to normalize 16S rRNA gene sequencing data, transforming relative abundances into absolute cell counts [13]. A key consideration is that flow cytometry counts only intact cells, potentially excluding free extracellular DNA that is still captured during sequencing.
Molecular-Based QMP (qPCR and dPCR)
These methods quantify the total number of 16S rRNA gene copies in a DNA extract. qPCR is a common, accessible approach but may only be sensitive enough to detect 2-fold changes [13]. dPCR, a more recent technology, provides ultrasensitive and absolute quantification by dividing the PCR reaction into thousands of individual droplets, reducing amplification bias and eliminating the need for a standard curve [18]. This makes dPCR particularly suitable for samples with low microbial loads, such as small-intestine mucosa [18].
A Machine Learning Framework for Predicting Microbial Load
A groundbreaking approach developed by the Bork group at EMBL Heidelberg uses machine learning to predict microbial load directly from standard relative abundance sequencing data, bypassing the need for additional experiments. The model was trained on large datasets (e.g., from the GALAXY/MicrobLiver and Metacardis consortia, encompassing over 3,700 individuals) that contained both microbial composition and experimentally measured microbial load. Once trained and validated, the model was applied to a massive dataset of over 27,000 individuals from 159 studies, revealing widespread confounding effects of microbial load on disease associations [6] [12].
Re-interpreting Disease Associations: A Practical Application
The ketogenic diet study in mice provides a clear example of how absolute quantification alters biological interpretation [18]. Relative abundance analysis might show an increase in a particular taxon on the ketogenic diet. However, quantitative absolute measurements revealed that the total microbial load actually decreased on the diet. Therefore, a taxon that seemed to increase in relative terms could, in absolute terms, have remained stable or even decreased, fundamentally changing the hypothesis regarding its role in the diet's physiological effects.
Furthermore, large-scale analyses using the machine learning model have identified specific factors that systematically influence microbial load, making them potent confounders:
- GI Distress: Diarrhea reduces microbial load, while constipation increases it [6] [12].
- Demographics: Women have a higher average microbial load than men, and young people have a lower load than the elderly [6] [12].
- Disease and Medication: Many diseases and drugs significantly alter the total microbial load [6].
The following diagram synthesizes the process of how microbial load confounds disease associations and how QMP addresses the issue.
Essential Workflow for Robust Microbiome Analysis
To ensure robust and interpretable results, researchers should adopt the following workflow:
- Acknowledge Compositionality: Recognize that standard relative abundance data has inherent limitations for cross-group comparisons [13] [18].
- Quantify Absolutely Where Possible: For new studies, incorporate an absolute quantification method (e.g., flow cytometry, dPCR) during the experimental design phase. dPCR is particularly recommended for its precision and applicability across diverse sample types, including mucosa [18].
- Account for Load in Existing Data: For studies with existing relative data, apply the machine learning model to estimate microbial load and include it as a covariate in statistical models to control for its confounding effects [6] [12].
- Re-evaluate Previous Findings: Re-assess putative disease-associated taxa from prior research through the lens of microbial load to test the robustness of those associations.
Microbial load is a major determinant of gut microbiome variation and a critical confounder in disease association studies. Relying solely on relative abundance profiles can lead to misleading conclusions about which microbes are involved in a disease process. By adopting quantitative microbiome profiling frameworks—whether through rigorous experimental quantification using dPCR and flow cytometry or the innovative application of machine learning to existing data—researchers can control for this confounder. This leads to a more accurate identification of true disease-associated taxa, ultimately advancing our understanding of the microbiome's role in health and disease and accelerating the development of reliable microbial diagnostics and therapeutics.
From Theory to Practice: Methodologies for Accurate Microbial Load Assessment
Culture-based enumeration, long considered the gold standard in microbiology, relies on the ability of bacterial cells to replicate on or in laboratory media to form visible colonies. This method provides a foundational approach for quantifying viable microorganisms in diverse fields, from clinical diagnostics to food safety. However, mounting evidence reveals significant limitations, including the inability to detect viable but non-culturable (VBNC) pathogens, underestimation of true microbial concentrations, and substantial interference from environmental contaminants. This technical review examines the methodological constraints of culture-based enumeration and explores how emerging technologies and a deeper understanding of microbial load variations are critical for generating accurate, reproducible research conclusions in microbial ecology and diagnostic development.
For over a century, culture-based enumeration has served as the principal method for quantifying viable microorganisms, forming the cornerstone of microbiological analysis in clinical, industrial, and research settings. The method operates on a simple principle: a single viable bacterial cell, when provided with appropriate nutrients and environmental conditions, will multiply to form a visible colony that can be counted manually or automatically [24]. This colony-forming unit (CFU) count provides both qualitative and quantitative information about the number of viable microorganisms present in a sample [25].
Regulatory agencies worldwide typically mandate culture-based methods for compliance testing and label claims verification for probiotic products and microbiological safety testing [25]. The methods are regarded as sensitive, inexpensive, and relatively straightforward to implement, requiring minimal sophisticated instrumentation for basic application [24]. The entire culture process typically requires 2-3 days for preliminary isolation and up to a week for final confirmation of species, often involving multiple steps including pre-enrichment, selective enrichment, plating on selective media, and biochemical or serological confirmatory tests [24].
Fundamental Limitations of Culture-Based Enumeration
The Viable But Non-Culturable (VBNC) State and Microbial Dormancy
A critical limitation of culture-based methods is their inability to detect microorganisms in the Viable But Non-Culturable (VBNC) state. In this reversible physiological state, cells maintain metabolic activity and membrane integrity but cannot form colonies on conventional culture media routinely used for their detection [24]. VBNC cells express genes and produce proteins, and may retain pathogenicity, yet remain invisible to culture-based detection systems [26].
More than 67 pathogenic species, including foodborne pathogens such as Escherichia coli O157:H7, Vibrio spp., Listeria monocytogenes, Campylobacter jejuni, and Bacillus cereus, have been documented to enter the VBNC state [24]. This state can be induced by various stressors commonly encountered in food processing and environmental conditions, including starvation, osmotic stress, temperature fluctuations, pH changes, and exposure to preservatives or disinfectants [24]. The public health implications are significant, as VBNC pathogens may evade detection during routine safety testing yet retain the potential to cause disease upon encountering favorable conditions.
Similarly, "persister" cells represent a dormant phenotype that exhibits negligible metabolic activity undetectable by standard viability assays and cannot be cultured using conventional methods [24]. These cells can regain culturalbility and pathogenicity following the removal of stress conditions, representing another source of potential false negatives in culture-based testing regimes.
Table 1: Microbial States Bypassing Culture-Based Detection
| Metabolic State | Key Characteristics | Inducing Factors | Reversibility |
|---|---|---|---|
| Viable But Non-Culturable (VBNC) | Low metabolic activity, maintained membrane integrity, gene expression continues | Starvation, temperature extremes, osmotic stress, preservatives, disinfectants | Yes, upon removal of stress conditions |
| Persister Cells | Negligible metabolic activity, tolerance to bactericidal agents | Antibiotic exposure, sanitizers, long-term stress | Yes, upon exposure to specific stimuli |
| Sublethally Injured | Damage to cell structures, impaired growth on selective media | Physical/chemical treatments, sublethal processing | Variable (temporary or permanent) |
| Dormant Spores | Metabolic shutdown, high resistance to environmental stresses | Nutrient limitation, environmental cues | Yes, upon germination signals |
Technical and Operational Constraints
Beyond physiological limitations, culture-based enumeration faces numerous technical challenges that affect its accuracy, reproducibility, and practical implementation:
Time-Intensive Processes: Culture-based detection typically requires 2-3 days to yield preliminary results, with full confirmation potentially extending to a week [24]. This timeline is often incompatible with the rapid decision-making needed in clinical settings or for perishable product testing, where delayed results can render the information obsolete for timely interventions.
Limited Resolution and Specificity: Culture methods struggle with polymicrobial infections and biofilms, which constitute 65-80% of bacterial infections treated by physicians in the developed world [26]. Bacteria in biofilm states can undergo mutations that enhance fitness within the protected biofilm environment while impairing their ability to transition to free-living states required for growth on culture media [26]. Consequently, culture-based sampling may fail to detect dominant pathogens within complex microbial communities.
Accuracy and Reproducibility Concerns: Plate counting typically underestimates true bacterial concentrations for multiple reasons [25]. Microbial aggregates or flocs may give rise to single colonies regardless of the number of cells present, while stressed cells may require specific resuscitation conditions not provided in standard protocols. Comparative studies demonstrate that culture methods consistently report lower counts than alternative methods; for instance, flow cytometry showed no interference from nanoparticles that significantly disrupted spectrophotometer measurements [27].
Inability to Differentiate Strains with Critical Functional Differences: Culture-based identification typically stops at the genus or species level, missing critical strain-level variations that determine pathogenicity, ecological function, or therapeutic potential [28]. For example, within Escherichia coli, specific strains may be neutral commensals, enterohemorrhagic pathogens, or beneficial probiotics, with genomic differences having profound consequences for human health [28].
Table 2: Quantitative Comparison of Bacterial Enumeration Methods
| Method | Detection Principle | Time to Result | VBNC Detection | Key Limitations |
|---|---|---|---|---|
| Culture-Based (CFU) | Growth on solid media | 2-7 days | No | Labor-intensive, underestimates counts, limited automation |
| Flow Cytometry | Cell staining and counting | Hours | Yes (with viability markers) | Requires specialized equipment, method development needed |
| qPCR | DNA amplification and detection | Hours to 1 day | No (unless with viability dyes) | Does not distinguish live/dead without modifications, requires DNA extraction |
| Optical Density | Light scattering by cells | Minutes | No | Measures live and dead cells plus debris, interference common |
| Phage-Based Methods | Bacteriophage infection and lysis | Hours | Yes | Host-specific, requires method optimization |
Microbial load, defined as the density of microbial cells in a sample, represents an often-overlooked variable that can fundamentally confound interpretations in microbiome research and diagnostic applications. While most microbiome studies focus exclusively on microbial composition (the relative abundance of different taxa), variations in total microbial load can create spurious associations or mask true biological relationships [6].
The Composition Versus Load Distinction
The distinction between microbial composition and microbial load is conceptually critical. Compositional analysis describes the relative proportion of different microbial taxa, typically presented as percentages that sum to 100%. In contrast, microbial load represents an absolute quantity—the number of microbial cells per unit of sample [6]. This distinction has profound implications for data interpretation.
Consider a hypothetical scenario: in healthy individuals, species "Red" might constitute 2% of a total microbiome of 1,000 bacteria (20 cells), while species "Blue" constitutes 5% (50 cells). In disease states, if the total bacterial count drops to 500 due to pathogen pressure or environmental factors, species "Red" might now appear to constitute 4% of the microbiome—suggesting a relative increase. However, in absolute terms, the number of "Red" bacteria may have remained unchanged at 20 cells, while "Blue" bacteria decreased [6]. Without measuring the microbial load, researchers might erroneously conclude that species "Red" had expanded in association with the disease.
Impact on Disease Association Studies
Recent research demonstrates that many microbial species previously thought to be associated with disease were more strongly explained by variations in microbial load than by the disease state itself [12]. Numerous factors unrelated to the disease under investigation can significantly alter microbial load, including:
- Medications: Many pharmaceutical agents significantly impact microbial densities [12]
- Gastrointestinal function: Diarrhea reduces microbial load, while constipation increases it [6]
- Demographic factors: Women have higher average microbial loads than men, potentially linked to different constipation frequencies, while young people have smaller average microbial loads than the elderly [6] [12]
These confounding variables can lead to both false-positive and false-negative associations in microbiome studies if researchers consider only relative abundance data without accounting for underlying variations in total microbial load [6].
Machine Learning Approaches for Load Estimation
Recognizing the technical challenges in directly measuring microbial loads (which require specialized protocols such as flow cytometry or quantitative microscopy), researchers have developed computational approaches to infer this crucial metric. A novel machine learning model trained on datasets with both microbial composition and experimentally measured microbial load can now predict microbial loads from standard compositional data alone [6] [12]. This approach has revealed that incorporating microbial load information helps distinguish robust disease-microbe associations from those confounded by load variations.
Methodological Comparisons and Alternative Approaches
Direct Method Comparisons in Experimental Systems
Comparative studies consistently highlight the limitations of culture-based approaches while validating alternative methods. In studies of nanoparticle interference on bacterial quantification, flow cytometry (FCM) demonstrated no apparent interference from ZnO, TiO₂, and SiO₂ nanoparticles when quantifying various bacterial species, while the spectrophotometer method using optical density measurement proved unreliable [27]. CFU counting in these studies was characterized as time-consuming, less accurate, and unsuitable for automation [27].
In gut microbiome models investigating Clostridioides difficile infection, both qPCR and bacterial culture tracked similar population dynamics, with Pearson correlation coefficients varying from 98% for Bacteroides spp. to 62% for Enterobacteriaceae [29]. However, qPCR provided results in real-time, enabling more rapid intervention, and allowed monitoring of additional microbiota groups not easily cultured [29].
Studies on probiotic products reveal significant discrepancies between methods. In direct-fed microbials, plate counts consistently yielded lower concentrations than flow cytometry or qPCR approaches, particularly for product samples stored over time [25]. This underestimation has direct regulatory implications, as products may fail compliance testing due to methodological limitations rather than true viability loss.
Emerging and Alternative Technologies
Flow Cytometry (FCM): FCM enables rapid, reliable detection of all bacteria including non-cultivable microorganisms, with the ability to distinguish and quantitate live and dead bacteria in mixed populations [27]. The method counts more than 20,000 bacterial cells per sample, providing high accuracy and excellent reproducibility [27].
Molecular Methods (qPCR/NGS): Quantitative PCR provides rapid, sensitive detection of specific bacterial taxa but traditionally cannot distinguish between live and dead cells without pre-treatment with viability dyes [29]. Next-generation sequencing (NGS) approaches, particularly 16S rRNA gene sequencing, can identify difficult-to-culture species but provide primarily qualitative or semi-quantitative data unless supplemented with quantitative frameworks [26] [28].
Phage-Based Methods: Bacteriophage-based detection systems exploit the specificity of phage-host interactions to detect viable bacteria, as phage replication requires metabolically active host cells [24]. These methods show particular promise for rapid detection of specific pathogens and avoid detection of non-viable cells.
Diagram 1: Methodological limitations and integrated approaches for accurate microbial enumeration. Each method presents specific constraints requiring complementary approaches.
Experimental Protocols for Comparative Enumeration
Flow Cytometry Protocol for Bacterial Quantification
Principle: Flow cytometry with viability staining enables rapid discrimination and enumeration of live and dead bacterial cells based on membrane integrity, without reliance on cellular replication [27].
Reagents and Equipment:
- Flow cytometer with appropriate laser and detector configuration
- BacLight LIVE/DEAD bacterial viability kit or equivalent viability stains
- Phosphate-buffered saline (PBS) or appropriate staining buffer
- Sample filtration or dilution materials as needed
Procedure:
- Prepare sample suspension in appropriate buffer, ensuring single-cell distribution
- Add viability stains according to manufacturer specifications
- Incubate samples in darkness for specified duration (typically 15-30 minutes)
- Analyze samples using flow cytometry with established instrument settings
- Establish gating parameters using control samples (live, dead, unstained)
- Collect data for at least 20,000 events per sample to ensure statistical reliability
- Analyze populations using appropriate software to distinguish live (green fluorescence) and dead (red fluorescence) subpopulations
Validation: This method has demonstrated reliability in quantifying bacterial populations in the presence of nanoparticles that interfere with other methods, showing no apparent interference from ZnO, TiO₂, and SiO₂ nanoparticles [27].
Integrated Culture and Molecular Enumeration Protocol
Principle: Parallel culture and qPCR analysis enables correlation between traditional viability assessment and rapid DNA-based quantification, providing both cultivability and genetic presence data.
Reagents and Equipment:
- Selective and non-selective culture media appropriate for target organisms
- DNA extraction kit optimized for bacterial cells
- Species-specific or group-specific PCR primers
- Real-time PCR instrument
- Anaerobic workstation if targeting obligate anaerobes
Procedure:
- Serially dilute samples in appropriate buffer
- Plate dilutions on selective and non-selective media for culture enumeration
- Incubate plates under appropriate atmospheric conditions for target organisms
- Count colony-forming units after appropriate incubation period
- In parallel, extract DNA from original sample using standardized protocol
- Perform quantitative PCR with taxon-specific primers
- Generate standard curves using control strains for absolute quantification
- Compare culture (CFU/mL) and qPCR (gene copies/μL) results
Validation: This approach has shown strong correlations (98% for Bacteroides spp.) between methods while revealing substantial discrepancies for stressed populations and specific taxonomic groups [29].
The Scientist's Toolkit: Essential Research Reagents and Solutions
Table 3: Essential Reagents for Advanced Microbial Enumeration
| Reagent/Kit | Primary Function | Application Notes |
|---|---|---|
| BacLight LIVE/DEAD Viability Kit | Differential staining of live/dead bacteria based on membrane integrity | Essential for flow cytometric enumeration; validated against nanoparticle interference [27] |
| Species-Specific qPCR Primers | Targeted amplification of taxonomic marker genes | Enables quantification of specific taxa; requires validation against culture data [29] |
| Viability Dyes (PMA/EthD) | Selective DNA modification in membrane-compromised cells | Allows molecular differentiation of intact cells; critical for DNA-based viability assessment [24] |
| Selective Culture Media | Growth support for specific taxonomic groups | Necessary for culture-based comparison; both selective and non-selective media required for injured cells [25] |
| Phage-Based Detection Kits | Host-specific lysis and detection | Provides rapid viability assessment; emerging alternative to culture methods [24] |
| DNA Extraction Kits (Microbiome-Optimized) | Nucleic acid isolation from complex samples | Critical for molecular methods; efficiency impacts quantitative accuracy [28] |
Culture-based enumeration remains a foundational methodology in microbiology, providing critical information about bacterial cultivability that retains clinical and regulatory relevance. However, its limitations as a standalone method—particularly its inability to detect VBNC states, its susceptibility to confounding by microbial load variations, and its systematic underestimation of true viable populations—necessitate a more nuanced approach to microbial enumeration. Contemporary research demands integrated methodological frameworks that combine the functional information of culture with the rapidity and comprehensiveness of molecular and cytometric approaches. Furthermore, the recognition that microbial load variations can fundamentally confound research conclusions mandates increased attention to this critical metric, either through direct measurement or computational estimation. As microbial research continues to evolve toward more sophisticated ecological and translational applications, moving beyond traditional gold standards to embrace methodologically pluralistic approaches will be essential for generating accurate, reproducible, and clinically actionable insights.
Diagram 2: Impact of microbial load information on research conclusions. Incorporating load data prevents spurious associations and enhances biological insight.
The integration of full-length 16S rRNA gene sequencing with synthetic spike-in controls represents a transformative approach for advancing microbiome research. This technical guide explores how this combined methodology addresses critical limitations in conventional 16S rRNA sequencing by enhancing taxonomic resolution to the species level and enabling absolute quantification of microbial abundances. Framed within the context of a broader thesis on how microbial load variation affects study conclusions, this review demonstrates how these technical advancements provide more reliable data interpretation across research and drug development applications. We present comprehensive experimental protocols, data analysis frameworks, and practical implementation guidelines to facilitate adoption of these cutting-edge techniques.
Microbial load variation presents a fundamental challenge in microbiome research that directly impacts study conclusions and therapeutic development. Traditional 16S rRNA gene sequencing approaches provide only relative abundance data, where fluctuations in one species can create apparent changes in others despite stable absolute abundances [30]. This compositionality problem obscures true biological relationships and can lead to erroneous conclusions in both basic research and clinical applications.
The limitations of short-read 16S rRNA sequencing further compound these challenges. Commonly used variable regions (e.g., V3-V4) frequently fail to achieve species-level taxonomic resolution, especially for closely related taxa [31] [32]. Primer selection biases introduce additional distortions, as different primer sets exhibit varying coverage across bacterial phyla and may systematically underrepresent certain taxa [33]. These technical artifacts confound our ability to distinguish genuine microbial load variations from methodological limitations.
Full-length 16S rRNA sequencing with spike-in controls addresses these fundamental limitations by providing both complete genetic information for precise taxonomic classification and internal reference standards for absolute quantification. This integrated approach enables researchers to differentiate true microbial load changes from compositional artifacts, thereby producing more reliable and interpretable data for drug development and clinical diagnostics.
Technical Foundations
Full-Length 16S rRNA Gene Sequencing
The 16S rRNA gene, approximately 1,500 base pairs long, contains nine variable regions (V1-V9) interspersed with conserved regions [34]. While the conserved regions enable broad taxonomic amplification, the variable regions provide the phylogenetic resolution necessary for classification [33]. Third-generation sequencing platforms from PacBio and Oxford Nanopore Technologies (ONT) now enable routine sequencing of the entire 16S rRNA gene, overcoming the historical compromise of targeting only sub-regions due to technology limitations [32].
The taxonomic resolution advantage of full-length sequencing is substantial. One in-silico analysis demonstrated that while the commonly sequenced V4 region failed to confidently classify 56% of sequences at the species level, full-length sequences achieved nearly perfect species-level classification [32]. Different variable regions show distinct taxonomic biases; for example, the V1-V2 region performs poorly for Proteobacteria, while V3-V5 struggles with Actinobacteria [32]. By capturing all variable regions, full-length sequencing eliminates these biases and provides uniform taxonomic resolution across diverse bacterial lineages.
Recent advancements in sequencing chemistry and basecalling have significantly improved the accuracy of full-length 16S sequencing. PacBio's Circular Consensus Sequencing (CCS) generates highly accurate HiFi reads, while ONT's R10.4.1 chemistry has improved basecalling accuracy to Q20 (1% error rate) or better [35]. These developments make full-length 16S sequencing increasingly accessible and reliable for routine microbiome analysis.
Spike-In Controls for Quantification and Quality Control
Spike-in controls are synthetic DNA sequences or engineered microorganisms added to samples at known concentrations to serve as internal standards. These controls enable absolute quantification of microbial abundances and comprehensive quality assessment throughout the sequencing workflow [30]. Unlike mock communities, spike-ins are added directly to experimental samples, allowing for per-sample quality control and normalization [36].
Two primary types of spike-in controls have been developed:
Synthetic 16S rRNA gene spike-ins contain artificial variable regions with negligible identity to natural sequences, allowing unambiguous identification in sequencing data [30]. These are typically cloned into plasmid vectors and linearized before use.
Whole-cell spike-in standards consist of genetically engineered bacteria containing unique synthetic 16S rRNA tags integrated into their genomes [37]. These controls capture biases introduced during DNA extraction and cell lysis, in addition to amplification and sequencing biases.
The utility of spike-in controls extends beyond quantification to include sample tracking and cross-contamination detection. By adding unique combinatorial mixtures of spike-ins to individual samples (sample tracking mixes, or STMs), researchers can verify sample identity throughout complex workflows and detect cross-contamination down to approximately 1% [36]. This capability is particularly valuable in large-scale studies processing hundreds of samples simultaneously.
Methodological Implementation
Experimental Design Considerations
Sequencing Platform Selection
| Platform | Key Features | Read Length | Error Profile | Best Applications |
|---|---|---|---|---|
| PacBio HiFi | Circular Consensus Sequencing (CCS) | Full-length 16S (~1,500 bp) | Random errors (<1% with ≥10 passes) [32] | High-accuracy species-level classification |
| Oxford Nanopore | Real-time sequencing, R10.4.1 chemistry | Full-length 16S (~1,500 bp) | ~1% error rate (Q20) with current chemistry [35] | Rapid turnaround, species-level biomarker discovery |
| Illumina MiSeq | Short-read sequencing | 300-600 bp (V3-V4 typical) | Very low error rate (<0.1%) | Cost-effective genus-level profiling |
Spike-In Control Implementation
| Spike-In Type | Representative Products | Optimal Spiking Level | Key Applications |
|---|---|---|---|
| Synthetic DNA | ZymoBIOMICS Spike-in Control [8] | 10% of total DNA [8] | Absolute quantification, protocol optimization |
| Whole Cell | ATCC Spike-in Standards (MSA-2014) [37] | 1-9% of total community [37] | DNA extraction efficiency, complete workflow QC |
| Sample Tracking | Custom STMs [36] | ~2.5% of total reads [36] | Sample mix-up detection, cross-contamination monitoring |
Wet-Lab Protocols
DNA Extraction and Spike-In Addition
The following protocol is optimized for human gut microbiome samples but can be adapted for other sample types:
Add spike-in controls immediately upon sample processing. For whole-cell standards, add to the sample matrix before DNA extraction. For synthetic DNA standards, add to the lysate before purification [37].
Extract DNA using a bead-beating protocol (e.g., QIAamp PowerFecal Pro DNA Kit) to ensure efficient lysis of diverse bacterial taxa [8].
Quantify DNA concentration using fluorometric methods (e.g., Qubit dsDNA BR Assay) and normalize all samples to the same concentration (typically 1-5 ng/μL) [8].
Library Preparation for Full-Length 16S Sequencing
PacBio Protocol:
- Amplify full-length 16S rRNA gene using primers 27F (5'-AGAGTTTGATCMTGGCTCAG-3') and 1492R (5'-GGTTACCTTGTTACGACTT-3') [31].
- Perform PCR amplification with 25-35 cycles, using high-fidelity polymerase to minimize amplification bias [8].
- Purify amplicons using size-selection beads to remove primer dimers and non-specific products.
- Prepare SMRTbell library according to manufacturer's instructions for Sequel II sequencing [31].
Oxford Nanopore Protocol:
- Amplify full-length 16S rRNA gene using the same primer set as above with tailed adapters for nanopore sequencing.
- Perform PCR amplification with 25-35 cycles, optimizing cycle number based on template concentration [8].
- Purify amplicons using AMPure XP beads and prepare library using Ligation Sequencing Kit (SQK-LSK109).
- Load library onto Primed R9.4.1 or R10.4.1 flow cells for sequencing [35].
Bioinformatic Analysis
Read Processing and Denoising
PacBio Data:
- Process CCS reads using DADA2 to generate amplicon sequence variants (ASVs) [31].
- Filter reads by length (1,400-1,600 bp) and quality (Q-score ≥20).
Oxford Nanopore Data:
- Basecall raw data using Dorado with super-accurate (sup) model [35].
- Denoise reads using Emu, which employs an expectation-maximization approach specifically designed for noisy long reads [35].
- Filter reads by length (1,000-1,800 bp) and quality (q-score ≥9) [8].
Taxonomic Classification and Quantification
Identify spike-in reads by alignment to reference spike-in sequences using Bowtie2 or BLAST [37].
Calculate absolute abundances using the formula: Absolute Abundance = (Sample Read Count / Spike-in Read Count) × Known Spike-in Molecules
Perform taxonomic classification using the SILVA database or Emu's default database, which have been shown to provide complementary classification performance [35].
Data Analysis and Interpretation
Absolute Quantification Using Spike-In Controls
The incorporation of spike-in controls transforms relative abundance data into absolute quantification, addressing a fundamental limitation of conventional 16S rRNA sequencing. The calculation proceeds as follows:
Spike-in read proportion is determined for each sample: ( P{spike} = \frac{R{spike}}{R_{total}} )
Absolute abundance of each taxon is calculated: ( A{taxon} = \frac{R{taxon}}{R{spike}} \times C{spike} ) where ( C_{spike} ) represents the known concentration of spike-in molecules added to the sample.
This approach has been validated across diverse sample types, including stool, saliva, nasal, and skin samples, showing high concordance with culture-based quantification methods [8]. Staggered spike-in mixtures with varying concentrations can further extend the dynamic range of quantification.
Taxonomic Resolution and Biomarker Discovery
Full-length 16S rRNA sequencing significantly improves species-level classification compared to short-read approaches. In a direct comparison, PacBio full-length sequencing assigned 74.14% of reads to the species level, compared to only 55.23% with Illumina V3-V4 sequencing [31]. This enhanced resolution enables more precise biomarker discovery, as demonstrated in colorectal cancer studies where Nanopore full-length sequencing identified specific bacterial species biomarkers (e.g., Parvimonas micra, Fusobacterium nucleatum, Peptostreptococcus anaerobius) that were not consistently resolved with Illumina sequencing [35].
Quality Control and Sample Tracking
The implementation of sample tracking mixes (STMs) enables comprehensive quality control throughout the experimental workflow. Key quality metrics include:
- Sample purity: Proportion of reads assigned to expected spike-in controls (typically >99.9%) [36]
- Cross-contamination level: Proportion of unexpected spike-in reads in each sample
- Amplification efficiency: Variation in spike-in recovery across samples
These metrics allow researchers to identify and quantify sample mishandling, cross-contamination, and technical biases that could otherwise compromise data integrity.
The Scientist's Toolkit: Essential Research Reagents
| Category | Specific Product/Type | Key Features | Application |
|---|---|---|---|
| Spike-in Controls | ZymoBIOMICS Spike-in Control I (High Microbial Load) [8] | Fixed 7:3 ratio of two bacterial species | Absolute quantification in high-biomass samples |
| ATCC Spike-in Standards (MSA-1014, MSA-2014) [37] | Genetically engineered strains with synthetic 16S tags | Whole-workflow quality control | |
| Mock Communities | ZymoBIOMICS Microbial Community Standard (D6300) [8] | 8 bacterial strains with defined composition | Method validation and benchmarking |
| ZymoBIOMICS Gut Microbiome Standard (D6331) [33] | 19 bacterial and archaeal strains | Gut microbiome-specific validation | |
| DNA Extraction Kits | QIAamp PowerFecal Pro DNA Kit [8] | Bead-beating protocol for mechanical lysis | Efficient DNA extraction from diverse taxa |
| PCR Enzymes | High-fidelity polymerases | Low error rate, minimal bias | Accurate amplification of full-length 16S |
| Reference Databases | SILVA database [33] | Curated rRNA database with taxonomy | Taxonomic classification |
| Emu default database [35] | Optimized for long-read classification | Species-level assignment with Nanopore data |
Applications in Research and Drug Development
Microbial Drug Metabolism Studies
The combination of full-length 16S sequencing and absolute quantification enables precise investigation of microbiome-mediated drug metabolism. Specific bacterial taxa harbor enzymes capable of transforming pharmaceutical compounds through reactions including dihydropyrimidine reduction (e.g., 5-fluorouracil metabolism by E. coli PreT/PreA enzymes) [38] and cardiac glycoside reduction (e.g., digoxin inactivation by Eggerthella lenta) [38]. By providing accurate species-level identification and absolute abundance data, the described methodology facilitates prediction of interindividual variation in drug metabolism based on microbiome composition.
Disease Biomarker Discovery
The enhanced resolution of full-length 16S sequencing significantly improves disease biomarker discovery. In colorectal cancer research, Nanopore full-length sequencing identified specific bacterial species biomarkers that enabled disease prediction with an AUC of 0.87 using 14 species, or 0.82 using just 4 key species [35]. This precision represents a substantial advancement over genus-level biomarkers derived from short-read sequencing, with direct implications for diagnostic development.
Therapeutic Monitoring
Absolute quantification of microbial loads enables accurate monitoring of microbiome changes in response to therapeutic interventions. Unlike relative abundance data, absolute quantification can distinguish between genuine expansion of beneficial taxa and apparent increases caused by reduction of other community members. This capability is particularly valuable for evaluating microbiome-based therapeutics, including probiotics, prebiotics, and fecal microbiota transplantation.
The integration of full-length 16S rRNA gene sequencing with spike-in controls represents a paradigm shift in microbiome research methodology. By addressing fundamental limitations of conventional approaches—including limited taxonomic resolution, compositionality problems, and quality control challenges—this integrated framework provides more accurate and biologically meaningful data. The experimental protocols and analytical frameworks presented in this technical guide provide researchers with practical tools for implementation across diverse applications, from basic research to drug development and clinical diagnostics.
As sequencing technologies continue to advance and spike-in controls become more sophisticated, we anticipate further improvements in accuracy, throughput, and accessibility. These developments will strengthen our ability to understand how microbial load variations influence health and disease, ultimately supporting the development of novel microbiome-based therapeutics and personalized medicine approaches.
Sepsis is a life-threatening medical emergency requiring rapid and accurate pathogen identification to guide targeted antimicrobial therapy. Traditional diagnostic methods, primarily blood culture, are hampered by prolonged turnaround times and low sensitivity, often leading to empirical antibiotic treatment and suboptimal patient outcomes [39]. Metagenomic next-generation sequencing (mNGS) has emerged as a powerful, unbiased tool for rapid pathogen detection, capable of identifying bacteria, viruses, and fungi within hours. However, its application to blood samples presents a significant "needle in a haystack" challenge: the overwhelming abundance of human host DNA can constitute over 99% of sequenced material, drastically reducing the sensitivity for detecting microbial pathogens [39] [40].
This problem is intrinsically linked to the broader thesis of how microbial load variation affects study conclusions. In sepsis diagnostics, low microbial load in the bloodstream is a common characteristic, meaning that any technique that fails to address the host DNA background will inevitably produce false negatives or require excessive, costly sequencing depth. Pre-analytical host depletion techniques are therefore not merely optional optimizations but fundamental prerequisites for obtaining clinically actionable results. The recent development of Zwitterionic Interface Ultra-Self-assemble Coating (ZISC)-based filtration represents a significant technological advance in this domain, enabling highly efficient physical separation of host cells from microorganisms prior to DNA extraction [39] [41]. This guide provides a comprehensive technical examination of ZISC filtration, detailing its principles, performance, and protocols to empower researchers and clinicians in enhancing the diagnostic yield for bloodstream infections.
Technical Foundation of ZISC Filtration Technology
Core Mechanism and Material Properties
The ZISC-based filtration device (commercialized as the Devin Fractionation Membrane) operates on a principle of selective cellular adsorption based on surface charge interactions. The filter features a proprietary zwitterionic interface—a surface coating containing both positive and negative ionic groups—that creates a highly specific binding environment for nucleated human cells, particularly white blood cells (WBCs) [39] [41].
Key Mechanism Details:
- Electrostatic Selectivity: The zwitterionic coating exhibits electrostatic properties that are highly attractive to leukocytes. The surface charge promotes strong adhesion and retention of these host cells as whole blood is passed through the filter [42] [43].
- Microbial Permeability: Crucially, bacteria, fungi, and viruses pass through the filter unimpeded. This selective permeability is attributed to the differing surface properties of microorganisms compared to nucleated human cells, allowing for their preservation in the filtrate [39].
- Anti-Clogging Design: The self-assembling nature of the coating maintains filter porosity and prevents clogging, regardless of pore size, enabling consistent performance across varying blood volumes (3-13 mL) [39] [41].
This physical separation method is fundamentally different from biochemical depletion approaches (e.g., differential lysis, methylated DNA removal) as it occurs prior to DNA extraction, avoiding the biases and DNA damage that can occur during enzymatic or chemical treatment steps.
Comparative Advantages Over Alternative Host Depletion Methods
ZISC filtration addresses several limitations inherent in other host depletion strategies. The table below provides a systematic comparison of ZISC filtration against other common techniques.
Table 1: Comparative Analysis of Host Depletion Techniques for mNGS in Bloodstream Infections
| Method | Working Principle | Host Depletion Efficiency | Microbial Recovery | Workflow Complexity | Key Limitations |
|---|---|---|---|---|---|
| ZISC Filtration | Physical retention of WBCs via zwitterionic surface interactions | >99% WBC removal [39] | High; preserves intact microbes | Low (<5 minutes processing) [41] | Limited data on fungal/protozoan recovery |
| Differential Lysis (QIAamp DNA Microbiome Kit) | Selective chemical lysis of human cells followed by DNase treatment | Variable (~70-90%) [39] | Moderate; potential for co-lysing delicate microbes | Moderate to High | Incomplete host DNA removal; potential pathogen loss |
| CpG Methylated DNA Enrichment (NEBNext Microbiome Kit) | Immunoprecipitation of methylated host DNA | ~90-95% [42] | High for bacteria; lower for viruses/fungi | Moderate | Post-extraction only; doesn't reduce inhibitory cellular components |
| Cell-Free DNA (cfDNA) Approach | Sequencing of plasma cfDNA, avoiding intact cells | N/A (bypasses cellular DNA) | Low for intracellular pathogens; inconsistent sensitivity [39] | Low | Limited sensitivity; misses cell-associated pathogens |
| Saponin-Based Lysis + Centrifugation | Selective lysis of human cells with saponin followed by centrifugal removal | Moderate (~80-90%) [43] | Variable; centrifugation can pellet some pathogens | Moderate | Incomplete host DNA removal; complex optimization |
The comparative data reveals that ZISC filtration achieves superior host depletion efficiency while maintaining excellent microbial recovery and offering a streamlined, rapid workflow. This combination of attributes makes it particularly suitable for clinical settings where turnaround time and reliability are critical.
Experimental Validation and Performance Metrics
Analytical Sensitivity and Specificity Assessments
Rigorous analytical validation studies have demonstrated the significant enhancement in mNGS performance enabled by ZISC-based host depletion.
Table 2: Performance Metrics of ZISC Filtration-Enhanced mNGS for Pathogen Detection
| Performance Parameter | gDNA-based mNGS with ZISC Filtration | gDNA-based mNGS without Filtration | cfDNA-based mNGS |
|---|---|---|---|
| Average Microbial Reads (RPM) | 9,351 RPM [39] | 925 RPM [39] | 1,251-1,488 RPM [39] |
| Detection Rate in Culture-Positive Sepsis | 100% (8/8 samples) [39] | Not reported | Inconsistent sensitivity [39] |
| Fold-Increase in Microbial Reads | >10-fold enrichment [39] | Baseline | Not significantly enhanced by filtration [39] |
| Host DNA Background | >99% reduction [39] | High human DNA background | Inherently lower, but inconsistent |
| White Blood Cell Removal | >99% across 3-13 mL blood volumes [39] | N/A | N/A |
| Bacterial Passage Efficiency | Unimpeded passage of E. coli, S. aureus, K. pneumoniae [39] | N/A | N/A |
| Viral Passage Efficiency | Unimpeded passage of feline coronavirus [39] | N/A | N/A |
The data unequivocally demonstrates that ZISC filtration coupled with genomic DNA (gDNA)-based mNGS achieves the highest sensitivity for pathogen detection, outperforming both unfiltered gDNA and cell-free DNA approaches. The dramatic reduction in host DNA background translates directly into more efficient sequencing resource utilization and enhanced detection of low-abundance pathogens—a critical consideration in sepsis where microbial loads can be exceedingly low.
Workflow Integration and Protocol Specifications
The integration of ZISC filtration into the standard mNGS workflow for sepsis diagnostics involves specific procedural steps that ensure optimal performance:
Sample Preparation and Filtration Protocol:
- Blood Collection: Collect 3-10 mL of whole blood into standard anticoagulant-containing vacuum tubes [39].
- Filtration Assembly: Connect the ZISC-based filtration device (Devin filter) to a syringe. Transfer the blood sample to the syringe.
- Filtration Process: Gently depress the syringe plunger to pass the blood through the filter into a sterile collection tube. The process takes approximately 5 minutes for a 10 mL sample [41].
- Post-Filtration Processing: Subject the filtered blood to low-speed centrifugation (400g for 15 minutes) to separate plasma from any remaining cellular material [39].
- Microbial Pellet Isolation: Transfer the plasma to a new tube and perform high-speed centrifugation (16,000g) to pellet microbial cells [39].
- DNA Extraction: Extract DNA from the microbial pellet using standard commercial kits, optionally with microbial-specific enhancements [39].
Downstream Sequencing Considerations:
- Library Preparation: Use ultra-low input DNA library prep kits (e.g., Ultra-Low Library Prep Kit, Micronbrane) compatible with the typically low microbial DNA yields [39].
- Sequencing Depth: Target at least 10 million reads per sample on platforms such as Illumina NovaSeq 6000 to ensure adequate coverage for low-abundance pathogens [39].
- Bioinformatic Analysis: Employ customized bioinformatics pipelines that include removal of any residual human reads and comprehensive alignment to microbial databases [39].
Figure 1: ZISC Filtration-Enhanced mNGS Workflow for Sepsis Diagnosis. This integrated protocol enables pathogen identification within 24 hours, significantly faster than traditional blood culture (2-5 days).
Integration with Targeted NGS and Broader Implications
Synergy with Targeted Sequencing Approaches
While mNGS offers comprehensive pathogen detection, targeted NGS (tNGS) represents a complementary approach that focuses sequencing resources on clinically relevant pathogens. Recent research demonstrates that ZISC filtration can be effectively combined with tNGS panels for enhanced performance:
- Increased Pathogen Reads: When coupled with a tNGS panel covering 330+ clinically relevant pathogens, pre-processing with a human cell-specific filtration membrane (similar in principle to ZISC) boosted pathogen reads by 6- to 8-fold compared to unfiltered samples [42] [43].
- Improved Detection of Low-Abundance Pathogens: The combination of host depletion and targeted enrichment enables reliable identification of pathogens present at low concentrations that would otherwise be missed by either method alone [42].
- Cost-Effectiveness: By reducing background human DNA and enriching for pathogen sequences, this integrated approach reduces the sequencing depth required for confident pathogen detection, making NGS more economically viable for routine clinical use [42] [43].
The Scientist's Toolkit: Essential Research Reagents and Materials
Table 3: Key Research Reagent Solutions for ZISC Filtration-Based Pathogen Detection
| Item | Specification/Example | Primary Function | Technical Notes |
|---|---|---|---|
| ZISC Filtration Device | Devin Fractionation Membrane (Micronbrane) | Selective depletion of host white blood cells | Removes >99% WBCs; preserves microbial integrity; processes 3-13 mL blood in 5 min [39] [41] |
| DNA Extraction Kit | ZISC-based Microbial DNA Enrichment Kit | Optimal recovery of microbial DNA from filtrate | Compatible with low biomass samples; includes steps to minimize contamination |
| Library Prep Kit | Ultra-Low Library Prep Kit (Micronbrane) | Preparation of sequencing libraries from low-input DNA | Specifically designed for the limited microbial DNA recovered from blood samples [39] |
| Spike-in Controls | ZymoBIOMICS Spike-in Control I (High Microbial Load) | Process control and quantification reference | Contains I. halotolerans and A. halotolerans at defined genome copies [39] |
| tNGS Panel | Custom multiplex tNGS panel | Targeted enrichment of clinically relevant pathogens | Covers 330+ pathogens; compatible with DNA from filtration workflow [42] |
| Bioinformatics Pipeline | Custom in-house or commercial software | Taxonomic classification and host read removal | Critical for distinguishing legitimate microbial signals from residual host background |
The implementation of ZISC filtration technology has profound implications for the understanding of microbial load variation in sepsis and its effect on research conclusions. Traditional mNGS without effective host depletion systematically underestimates microbial abundance due to signal masking by host DNA, potentially leading to erroneous correlations between perceived microbial abundance and clinical outcomes.
- Correction of Quantitative Biases: By removing the overwhelming host DNA background, ZISC filtration reveals the true microbial load in blood samples, enabling more accurate correlations between pathogen abundance and disease severity [39] [40].
- Revelation of Polymicrobial Infections: The enhanced sensitivity of host-depleted mNGS increases detection of mixed infections, which were previously underreported due to the dominance of the most abundant pathogen signal or host background [39].
- Standardization Across Samples: ZISC filtration reduces sample-to-sample variability in host DNA content that can confound comparative analyses, particularly in longitudinal studies tracking treatment response [39] [41].
Figure 2: Impact of Host Depletion on Microbial Load Assessment and Research Conclusions. Effective host depletion transforms NGS from a qualitative to a quantitative tool, fundamentally altering research interpretations in sepsis and other low-biomass infections.
ZISC-based filtration technology represents a paradigm shift in the approach to pathogen detection in sepsis and other bloodstream infections. By enabling greater than 99% depletion of host white blood cells while preserving microbial integrity, this technology directly addresses the fundamental challenge of low microbial load in blood samples. The resulting enhancement in pathogen detection sensitivity—evidenced by tenfold increases in microbial reads and 100% detection rates in culture-positive samples—establishes a new standard for sequencing-based sepsis diagnostics.
From a research perspective, the implementation of robust host depletion methods like ZISC filtration is essential for generating accurate data on microbial load and composition in sepsis. The technique corrects for the quantitative biases that have plagued previous mNGS studies and enables more reliable correlations between pathogen abundance and clinical outcomes. As the field moves toward integrated diagnostic approaches combining host depletion with either metagenomic or targeted sequencing strategies, the importance of understanding and controlling for microbial load variation becomes increasingly critical for drawing valid scientific conclusions and translating research findings into improved patient care.
In the study of microbial communities, a fundamental disparity exists between what organisms are present and what they are actively doing. While shotgun metagenomics has revolutionized our understanding of microbial potential by sequencing all DNA in a sample, it cannot distinguish between dormant cells, active cells, or free DNA. This limitation becomes critically important in low-biomass environments like human skin, where microbial density is several orders of magnitude lower than in the gut, typically ranging from 10³ to 10⁴ prokaryotes per cm² [44]. In these environments, metatranscriptomics—the sequencing of community-wide mRNA—provides a powerful alternative by capturing the actively expressed genes and pathways, thereby revealing the functional state of a microbial community in response to its specific environment [45].
The integration of microbial activity data is essential for accurate interpretation of microbiome studies, as genomic abundance alone can be a misleading indicator of functional importance. Research has demonstrated that a notable divergence often exists between transcriptomic and genomic abundances, with some microorganisms making an outsized contribution to metatranscriptomes despite modest representation in metagenomes [44] [46] [47]. Furthermore, recent studies highlight that microbial load—the absolute abundance of microbes—is a major determinant of microbiome variation and a significant confounder in disease association studies [7] [6] [12]. Failure to account for microbial load can lead to false associations, as changes in the relative abundance of specific taxa may actually reflect shifts in total microbial density rather than genuine ecological changes [7]. This technical guide outlines robust metatranscriptomic workflows specifically designed for low-biome environments, with a focus on human skin, while framing the discussion within the critical context of how microbial load variation impacts study conclusions.
Technical Challenges in Low-Biomass Metatranscriptomics
Working with low-biomass samples presents a unique set of technical challenges that must be addressed to generate reliable data. The primary issues researchers encounter include:
Low Microbial RNA Yield: The sparse microbial population in environments like skin means that the starting material for RNA sequencing is minimal, requiring highly sensitive methods to capture sufficient material for sequencing [44].
High Host Nucleic Acid Contamination: In host-associated environments, microbial RNA can be overwhelmed by host-derived RNA, with one study reporting that approximately 98% of metatranscriptomic reads from skin samples were non-human, meaning a significant 2% still represented host transcriptomes that needed to be computationally removed [44].
Contamination from External Sources: Reagents, sampling equipment, and laboratory environments can introduce contaminating microbial DNA and RNA that disproportionately impact low-biomass samples, potentially leading to spurious results [48].
Low RNA Stability: RNA is inherently less stable than DNA, requiring careful handling and preservation to prevent degradation, especially when working with limited starting material [44] [46].
Difficulty in Distinguishing Active from Dormant Communities: Without proper normalization and controls, it remains challenging to determine whether transcriptional activity represents a small, highly active population or a larger, less active one [7].
These challenges are compounded by the fact that practices suitable for higher-biomass samples (e.g., stool) may produce misleading results when applied to low microbial biomass samples [48]. Consequently, specialized workflows addressing these specific limitations are essential for generating meaningful metatranscriptomic data from low-biome environments.
Optimized Experimental Workflow for Skin Metatranscriptomics
Sample Collection and Preservation
The initial steps of sample collection and preservation are critical for maintaining RNA integrity and minimizing contamination. For skin metatranscriptomics, the optimized protocol utilizes:
Non-invasive Sampling with Swabs: Commercially available swabs provide a clinically practical method for sampling diverse skin sites while being compatible with downstream processing [44] [47].
Immediate Preservation in DNA/RNA Shield: Immediate preservation of swabs in specialized buffers like DNA/RNA Shield is essential to stabilize nucleic acids and prevent degradation during storage and transport [44].
Personal Protective Equipment (PPE): Researchers should use gloves and other appropriate barriers to limit contact between samples and contamination sources during collection [48].
Inclusion of Handling Controls: Collection of negative controls, including empty collection vessels and swabs exposed to the sampling environment, is crucial for identifying contamination sources introduced during sampling [48].
RNA Extraction and Enrichment
Following sample collection, the RNA extraction and enrichment process must maximize yield while minimizing bias:
Bead Beating for Comprehensive Lysis: Mechanical disruption through bead beating ensures efficient lysis of diverse microbial cell types, including Gram-positive bacteria and fungi, which have robust cell walls [44].
Direct-to-Column TRIzol Purification: This method provides effective RNA purification while removing inhibitors that could interfere with downstream applications [44].
rRNA Depletion with Custom Oligonucleotides: Custom-designed oligonucleotides for ribosomal RNA depletion achieve substantial enrichment (2.5–40×) of non-ribosomal RNA compared to undepleted controls, with a median of >79.5% of reads representing non-rRNA transcripts [44].
Assessment of RNA Integrity: Metrics such as DV200 (percentage of RNA fragments >200 nucleotides) should be monitored, with successful libraries typically achieving DV200 ≥76 [44].
Table 1: Key Performance Metrics of an Optimized Skin Metatranscriptomics Workflow
| Workflow Component | Performance Metric | Achieved Result | Significance |
|---|---|---|---|
| Sampling Method | Clinical practicality | High | Compatible with diverse sites using commercially available swabs |
| rRNA Depletion | Enrichment of non-rRNA reads | 2.5–40× enrichment | Median >79.5% non-rRNA reads |
| Technical Reproducibility | Pearson's correlation | r > 0.95 | High technical reproducibility across replicates |
| Sequencing Success Rate | Library generation | 75% (102/135 samples) | Robust across individuals and sites |
| Microbial Read Yield | Deduplicated non-rRNA reads | Median 3.7 × 10⁶ read pairs | Sufficient for functional representation |
Library Preparation and Sequencing
The final wet lab stages focus on preparing high-quality libraries for sequencing:
cDNA Synthesis and Library Construction: Using specialized kits designed for low-input RNA ensures adequate representation of low-abundance transcripts.
Sequencing Depth Considerations: To adequately capture microbial diversity and function, a median of 2.2 million microbial reads per sample (0.66 Gbp) has been shown to be sufficient, with rarefaction analysis confirming that libraries with >1 million read pairs typically represent active microbial functions adequately [44].
Paired Metagenomic Sequencing: Concurrent DNA sequencing of matched samples enables direct comparison of genomic potential and transcriptional activity, revealing important divergences between these two layers of information [44].
Computational Analysis and Contamination Management
Bioinformatic Processing Pipeline
The computational workflow for analyzing skin metatranscriptomic data requires specialized approaches to handle the unique characteristics of these datasets:
Customized Workflow with Skin-Specific Databases: Utilizing a skin-specific microbial gene catalog (integrated Human Skin Microbial Gene Catalog - iHSMGC) significantly improves annotation sensitivity, with one study reporting a median of 81% of reads receiving functional annotations compared to 60% with general-purpose workflows like HUMAnN3 [44].
Host Read Filtering: Efficient removal of host-derived sequences is essential, with successful implementations achieving removal of approximately 2% of reads aligning to human transcriptomes [44].
Taxonomic and Functional Annotation: Specialized tools are needed to accurately assign taxonomic classifications and functional annotations to metatranscriptomic reads, accounting for the high proportion of non-bacterial components (e.g., fungal transcripts) in skin samples [44].
Unique Minimizer Thresholding: To address taxonomic misclassification, an empirically determined threshold of unique minimizers per million microbial reads can effectively discriminate false-positive from true-positive taxa at relative abundances as low as 0.1% across a range of read counts (10⁴–10⁶ reads) [44].
Contamination Identification and Control
Contamination management is particularly crucial for low-biomass studies, where contaminant signals can easily overwhelm genuine biological signals. Key strategies include:
Comprehensive Negative Controls: Processing negative handling controls alongside samples to identify contaminant signals from swabs, extraction kits, and sample processing steps [44] [48].
Contaminant Taxa Identification: Using data from negative controls and prior reports to identify and filter potential contaminant taxa, which often include Achromobacter, Bradyrhizobium, Mycolibacterium, Mycobacterium, and Brevundimonas species in skin studies [44].
Cross-Contamination Prevention: Implementing physical barriers during sample processing and using unique dual indices can help minimize cross-contamination between samples [48].
Rigorous Reporting Standards: Documenting all contamination control measures and filtering steps in publications to enhance reproducibility and interpretation of results [48].
The following diagram illustrates the complete optimized workflow from sample collection through data analysis:
Essential Research Reagents and Tools
Successful implementation of skin metatranscriptomics requires specific reagents and computational tools optimized for low-biomass applications. The following table summarizes key solutions used in established protocols:
Table 2: Essential Research Reagents and Tools for Skin Metatranscriptomics
| Reagent/Tool | Function | Example/Specification |
|---|---|---|
| DNA/RNA Shield | Nucleic acid preservation immediately after sampling | Prevents degradation during storage and transport [44] |
| Custom rRNA Depletion Oligos | Enrichment of microbial mRNA | Targets bacterial and fungal rRNA; achieves 2.5–40× enrichment [44] |
| Bead Beating System | Mechanical cell lysis | Ensures disruption of diverse microbial cell types [44] |
| TRIzol-based Purification | RNA extraction and purification | Direct-to-column method for high-quality RNA [44] |
| iHSMGC Database | Functional annotation | Skin-specific microbial gene catalog improves annotation to 81% of reads [44] |
| Unique Minimizer Filter | Taxonomic misclassification control | Empirically determined threshold discriminates true positives at 0.1% abundance [44] |
| Machine Learning Models | Microbial load prediction | Predicts absolute abundance from relative composition data [7] [6] |
Microbial Load as a Critical Confounding Factor
The variation in microbial load—the absolute abundance of microbes in a sample—represents a fundamental confounding factor in microbiome studies that is particularly relevant for metatranscriptomic interpretation. Recent research demonstrates that:
Microbial Load Explains Variation: Machine learning approaches have revealed that microbial load is the major determinant of gut microbiome variation and is associated with numerous host factors, including age, diet, and medication [7] [6].
Disease Associations Confounded: For several diseases, changes in microbial load, rather than the disease condition itself, more strongly explain alterations in patients' gut microbiome [7]. Adjusting for this effect substantially reduces the statistical significance of the majority of disease-associated species [7] [12].
Compositional Data Limitations: Standard sequencing approaches produce proportional (relative) data rather than absolute abundances, creating analytical challenges when total microbial density varies between samples [7].
Technical Implications for Metatranscriptomics: In metatranscriptomic studies, gene expression levels are typically normalized to total sequenced reads, meaning that apparent changes in transcriptional activity could actually reflect changes in total microbial load rather than genuine regulatory differences [7].
The relationship between microbial load, metagenomic abundance, and metatranscriptomic activity can be visualized as follows:
This confounding effect necessitates either experimental measurement of microbial loads (e.g., through flow cytometry or quantitative PCR) or computational estimation using machine learning approaches that predict microbial load from compositional data [7] [6] [12]. Without accounting for microbial load variation, studies risk misattcribing effects to specific taxa or functions when the underlying driver is actually a shift in total microbial density.
Case Study: Skin Metatranscriptomics Reveals Active Players
The practical application of these optimized workflows has yielded significant biological insights that would have been missed with metagenomics alone. A comprehensive study of 27 healthy adults across five skin sites (scalp, cheek, volar forearm, antecubital fossae, and toe web) demonstrated:
Divergence Between Genomic and Transcriptomic Abundance: The research identified a marked disparity between the most active species in skin metatranscriptomes versus the most highly abundant species in skin metagenomes [44] [47]. Specifically, Staphylococcus species and fungi in the Malassezia genus had an outsized contribution to metatranscriptomes at most sites, despite their limited metagenomic representation [44] [46] [47].
Niche Adaptation Signatures: Species-level analysis showed clear signatures of microbial adaptation to their specific skin niches, such as increased secreted fungal phospholipase C level on cheeks versus scalp [44].
Antimicrobial Gene Expression: Skin commensals were found to transcribe diverse antimicrobial genes in situ, including several uncharacterized bacteriocins expressed at levels similar to known antimicrobial genes [44] [46].
Microbe-Microbe Interactions: Correlation of microbial gene expression with organismal abundances uncovered more than 20 genes that putatively mediate interactions between microbes, including a secreted Malassezia restricta protein with strongly negative in vivo association with C. acnes [44].
This case study highlights how metatranscriptomics can identify actively functioning species and microbial interactions that remain invisible to DNA-based approaches, particularly when combined with appropriate consideration of microbial load as a potential confounding factor.
Optimized metatranscriptomic workflows for low-biome environments like skin represent a significant advancement over DNA-based approaches by capturing the actively expressed functions of microbial communities. The integration of careful experimental design, specialized wet-lab protocols, and customized bioinformatic analyses enables researchers to overcome the unique challenges posed by low microbial biomass samples. However, the interpretation of resulting data must carefully consider the influence of microbial load variation on study conclusions, as changes in total microbial density can confound both metagenomic and metatranscriptomic findings.
Future methodological developments will likely focus on improving sensitivity for low-abundance transcripts, enhancing single-cell approaches to understand population heterogeneity, and integrating multi-omic data to build more comprehensive models of community function. As machine learning approaches for predicting microbial load from compositional data continue to mature [7] [6], their application to metatranscriptomic studies will help disentangle genuine regulatory changes from shifts in microbial density. These advancements will further establish metatranscriptomics as an essential tool for understanding microbial community function in low-biome environments, with applications ranging from clinical diagnostics to environmental monitoring.
Traditional metagenomic sequencing characterizes the relative composition of microbial communities but fails to capture their absolute abundance, potentially leading to confounded research conclusions. This technical guide details a machine learning framework that predicts fecal microbial load—the absolute quantity of microbial cells per gram—directly from standard relative abundance data. This approach addresses a major source of variation in microbiome studies, enabling more accurate associations between the microbiome and host health, disease states, and drug responses.
Metagenomic sequencing has revolutionized our understanding of microbial communities, yet standard analyses provide only a relative profile of taxonomic composition [49]. This relative data obscures a critical biological variable: the absolute microbial load, defined as the total number of microbial cells per unit mass of sample [7]. Consequently, a reported increase in the relative abundance of a particular bacterium could signify its actual proliferation or merely the decline of other community members.
This limitation is a significant confounder in microbiome research. Variations in microbial load have been linked to host factors such as age, diet, and medication use [7]. Furthermore, for several diseases, alterations in a patient's gut microbiome are more strongly explained by changes in microbial load than by the disease condition itself [7]. Failing to account for this factor can lead to spurious associations, misattributing effects to relative compositional changes that are actually driven by shifts in total community density. This whitepaper outlines a computational pipeline that leverages machine learning to infer this crucial metric from widely available relative metagenomic data, thereby refining our interpretation of microbiome dynamics in health and disease.
Core Methodology: A Machine Learning Framework for Load Prediction
The following workflow details the primary steps for developing a model to predict microbial load from relative metagenomic profiles, synthesizing methodologies from recent research [7].
Diagram 1: Core machine learning workflow for predicting microbial load.
Input Data and Feature Space
- Input Data: The model is trained on a subset of samples for which both relative taxonomic abundance (from standard metagenomic sequencing) and experimentally measured absolute microbial loads (e.g., via flow cytometry) are available [7].
- Feature Set: The primary features are the relative abundances of microbial taxa (species or genera) and potentially other genomic elements across a large number of samples (e.g., n=34,539) to capture a wide range of biological variation [7].
Model Architecture and Training
- Algorithm Selection: The approach utilizes a machine-learning algorithm capable of handling high-dimensional, compositional data. The specific algorithm is trained to learn the complex, non-linear relationships between the relative abundance of taxa and the total microbial load.
- Training Objective: The model learns to predict the continuous value of microbial load (cells/gram) solely from the vector of relative abundances for each sample [7].
Validation and Implementation
- Validation: The model's performance is rigorously assessed on a held-out test set of samples not used during training, using metrics like the correlation between predicted and measured loads.
- Application: Once trained and validated, the model can be applied to new standard relative abundance metagenomic datasets to generate predictions of their absolute microbial loads, without requiring additional experimental measurements [7].
The integration of predicted microbial load has been shown to substantially alter the interpretation of case-control microbiome studies. Adjusting analyses for this predicted effect can dramatically reduce the number of species falsely identified as being significantly associated with a disease [7].
Table 1: Impact of Load Adjustment on Disease-Associated Species Significance
| Disease Condition | Number of Significant Species (Unadjusted) | Number of Significant Species (Load-Adjusted) | Interpretation |
|---|---|---|---|
| Example Disease A | 45 | 15 | Many associations were confounded by load. |
| Example Disease B | 30 | 25 | The disease has a strong compositional effect. |
| Inflammatory Condition C | 50 | 12 | Load variation is a major driver of perceived dysbiosis. |
Note: The data in this table is illustrative of the findings reported in the literature, where adjusting for predicted microbial load "substantially reduced the statistical significance of the majority of disease-associated species" [7].
Experimental Protocol: A Step-by-Step Guide for Validation
This protocol provides a detailed methodology for validating a microbial load prediction model against experimental ground-truth data.
Sample Preparation and Data Generation
- Sample Collection: Collect and homogenize fecal samples from the cohort under study.
- Absolute Load Measurement (Ground Truth): Use flow cytometry to count microbial cells per gram of sample. Preserve an aliquot of the same sample for DNA extraction.
- Metagenomic Sequencing (Relative Data): Extract total DNA from the preserved aliquot and perform shotgun metagenomic sequencing following standard protocols [50] [49].
Data Processing and Model Application
- Bioinformatic Processing: Process raw sequencing reads through a standardized pipeline, including quality control (e.g., PRINSEQ++) [50], taxonomic profiling (e.g., MetaPhyler) [50], and generation of relative abundance tables.
- Load Prediction: Input the relative abundance table into the pre-trained machine learning model to generate predicted microbial loads for each sample.
- Validation Analysis: Correlate the predicted microbial loads with the experimentally measured loads from flow cytometry to assess model accuracy on the new validation cohort.
The Scientist's Toolkit: Essential Research Reagents and Solutions
Table 2: Key Research Reagents and Computational Tools for Microbial Load Studies
| Item Name | Function/Application | Specifications/Standards |
|---|---|---|
| Flow Cytometry Kit | Measures absolute microbial load (cells/gram) as experimental ground truth. | Includes fluorescent stains for nucleic acids (e.g., SYBR Green I) and calibration beads. |
| DNA Extraction Kit | Isolates high-quality metagenomic DNA from complex samples like stool. | Must be optimized for bacterial cell lysis and compatible with downstream sequencing. |
| Shotgun Sequencing Library Prep Kit | Prepares DNA libraries for whole-metagenome sequencing on platforms like Illumina. | Designed for low-input DNA and minimizes host DNA contamination. |
| Bioinformatics Pipeline (e.g., DIAMOND, MetaPhyler) | Processes raw sequencing data for taxonomic classification and functional annotation [50]. | Uses universal, single-copy marker genes for accurate taxonomic profiling [50]. |
| Machine Learning Environment (e.g., R/Python with scikit-learn) | Provides the framework for developing, training, and validating the load prediction model [7]. | Includes libraries for handling high-dimensional data and statistical validation. |
The ability to computationally estimate microbial load from standard relative metagenomic data represents a significant advance for the field. This approach identifies microbial load as a major, previously underappreciated source of variation in microbiome studies [7]. By integrating this predicted metric into analytical models, researchers can distinguish true compositional shifts from changes in community density, leading to more robust and biologically accurate conclusions about the microbiome's role in health, disease, and response to pharmaceutical interventions.
Navigating Pitfalls: Optimizing Study Design and Workflows to Control for Load Variation
The pre-analytical phase—encompassing sample collection, storage, and nucleic acid extraction—represents a critical source of variation in microbiome studies that significantly influences the validity and reproducibility of research conclusions. Despite advances in high-throughput sequencing technologies, methodological inconsistencies in these initial stages can introduce substantial bias, particularly affecting the measurement of microbial load—the absolute abundance of microbes in a sample. Emerging evidence indicates that microbial load is not merely a technical metric but a fundamental biological variable that confounds associations between microbial composition and disease states [6] [12]. When studies focus exclusively on relative abundance (composition) while ignoring variation in total microbial abundance, they risk drawing false conclusions, as shifts in one bacterial group may reflect changes in other taxa rather than actual variation in the bacteria of interest [6].
This technical guide examines how standardized procedures for sample handling and processing can minimize technical artifacts and improve the reliability of microbiome data, with particular emphasis on understanding how microbial load variations influence study outcomes. By implementing rigorous pre-analytical protocols, researchers can better distinguish true biological signals from methodological artifacts, thereby advancing our understanding of microbiome-disease relationships.
Microbial Load as a Confounding Factor
Traditional microbiome analyses primarily focus on relative abundance (the proportion of different microbial taxa within a sample) rather than absolute abundance (the actual quantity of microbes present). This approach can be misleading because changes in the relative abundance of a particular bacterium might not reflect its true population dynamics but rather fluctuations in other community members [6]. Microbial load serves as a key confounding variable in association studies, as many factors unrelated to the disease under investigation can alter total microbial abundance:
- Gastrointestinal conditions: Diarrhea significantly reduces microbial load, while constipation increases it [6] [12]
- Demographic factors: Women generally exhibit higher microbial loads than men, potentially linked to different constipation prevalence, and older individuals tend to have higher microbial loads than younger people [6]
- Medications: Various pharmaceutical treatments significantly alter microbial density [12]
- DNA extraction efficiency: Different extraction methods yield substantially different quantities of DNA from identical samples [51] [52]
Machine Learning Approaches for Microbial Load Estimation
Direct measurement of microbial load through experimental methods remains time-consuming and costly. However, researchers from EMBL Heidelberg have developed a machine learning model that accurately predicts microbial load from standard microbial composition data, eliminating the need for additional experiments [6] [12]. This model was trained on large datasets from the GALAXY/MicrobLiver and Metacardis consortia (comprising over 3,700 individuals) and validated on a much larger sample of 27,000 individuals from 159 studies across 45 countries [12]. The availability of this tool enables researchers to account for microbial load variation in existing and future datasets, thereby improving the robustness of disease-microbiome associations.
Standardizing Sample Collection and Storage
Sample Collection Protocols
Proper sample collection represents the first critical step in minimizing pre-analytical variation. Standardized protocols for different sample types ensure consistent microbial representation:
- Stool samples: Collect midstream stool using a plastic scoop embedded in collection tube caps. For optimal standardization, collect thumbnail-sized samples and place them in sterile containers [53]. Samples should be immediately refrigerated at 4°C if processing within hours, or frozen at -80°C for long-term storage [53]
- Nasal cavity samples: Insert a sterile swab approximately 2.5 cm into the nostril and gently rotate over mucosal surfaces of the anterior nostrils for 5 seconds. Combine swabs from both nostrils into a single specimen [53]
- Skin samples: Moisten a sterile swab with sterile specimen collection fluid (0.15 M NaCl and 0.1% Tween 20) and rub it firmly back and forth 30-50 times over a defined skin area for approximately 30 seconds [53]. Standardize sampling sequence across body sites (e.g., scalp, forearm, back, forehead)
- Saliva samples: Collect 2 mL of saliva in funnel-type collection tubes without foam. Participants should refrain from eating, drinking, smoking, or chewing gum for 30 minutes prior to collection [53]
Storage Conditions and Preservation Solutions
Storage conditions significantly impact microbial composition and load measurements. Several preservation strategies have been evaluated for their effectiveness:
Table 1: Comparison of Sample Storage Methods for Microbiome Studies
| Storage Method | Temperature Conditions | Maximum Storage Duration | Impact on Microbial Composition | Applications |
|---|---|---|---|---|
| Immediate freezing | -80°C | Long-term (months to years) | Minimal changes if handled properly | Gold standard for most research settings |
| DNA/RNA Shield solution | Room temperature | 3 weeks | Low impact on bacterial distribution | Field studies, transportation |
| Ethanol | Room temperature | Limited (days) | Variable effects across taxa | Resource-limited settings |
| RNAlater | 4°C or -20°C | Weeks to months | Some taxon-specific effects | Combined DNA/RNA analyses |
The use of DNA/RNA Shield reagent (Zymo Research) has demonstrated particular promise for standardizing sample storage. Research shows that storage of fecal material in this solution for three weeks at different temperatures with multiple thawing cycles had minimal impact on bacterial distribution [54]. This preservation method enables transportation and temporary storage at ambient temperatures, facilitating multi-center studies and field research.
Optimizing DNA Extraction Methods
DNA Extraction Protocol Comparison
DNA extraction represents one of the most significant sources of technical variation in microbiome studies. Different lysis methods exhibit varying efficiencies for Gram-positive versus Gram-negative bacteria, directly influencing observed microbial composition and diversity metrics [51] [52].
Table 2: Performance Comparison of DNA Extraction Methods for Gut Microbiome Studies
| Extraction Method | Lysis Mechanism | DNA Yield | Gram-positive Efficiency | Alpha-diversity | Inter-protocol Reproducibility |
|---|---|---|---|---|---|
| Mechanical + heat lysis (Bead-beating) | Combined mechanical and chemical/enzymatic | High | High | High | Moderate |
| Chemical/Enzymatic heat lysis | Chemical/enzymatic only | Moderate | Low to moderate | Moderate | Low |
| S-DQ (SPD + DNeasy PowerLyzer PowerSoil) | Bead-beating with stool preprocessing | High | High | High | High |
| ZymoBIOMICS DNA Miniprep | Bead-beating | High | High | High | Moderate |
A comprehensive study comparing DNA extraction methods for 16S rRNA gene sequencing demonstrated that protocols incorporating mechanical lysis (bead-beating) consistently outperformed those relying solely on chemical/enzymatic lysis [51] [52]. Specifically, the combined mechanical and heat lysis technique yielded significantly higher bacterial abundance and better recovery of Gram-positive taxa compared to chemical/enzymatic heat lysis alone [51].
Stool Preprocessing and Standardization
The implementation of a stool preprocessing device (SPD) prior to DNA extraction significantly improves standardization and quality. Research indicates that SPD enhances the overall efficiency of DNA extraction protocols by improving DNA yield, sample alpha-diversity, and recovery of Gram-positive bacteria [52]. Among tested protocols, SPD combined with the DNeasy PowerLyzer PowerSoil protocol (S-DQ) demonstrated superior overall performance [52].
The optimal DNA extraction protocol must be matched with the sample preservation method. For example, the inhibitory effects of preservation solutions must be considered, and appropriate dilution or washing steps should be incorporated to minimize interference with downstream enzymatic reactions [54].
Experimental Protocols for Method Validation
Protocol for Comparing DNA Extraction Methods
To evaluate different DNA extraction methods for gut microbiome analysis:
Sample Preparation:
- Collect fresh fecal samples from multiple donors (include both healthy individuals and those with relevant disease conditions)
- Homogenize samples thoroughly before aliquoting to ensure consistent distribution of microbial communities
- For method comparison studies, use identical sample aliquots across all extraction protocols
DNA Extraction:
- Process samples using each extraction method following manufacturers' protocols
- Include both mechanical and non-mechanical lysis methods for comparison
- For protocols incorporating SPD, follow manufacturer's instructions for stool preprocessing
- Extract all samples in the same batch to minimize inter-day variation
Quality Assessment:
- Quantify DNA yield using fluorometric methods (e.g., Qubit Fluorometer) for accurate concentration measurements
- Assess DNA purity using spectrophotometric ratios (A260/280 and A260/230)
- Evaluate DNA integrity through agarose gel electrophoresis or bioanalyzer systems
Downstream Analysis:
- Perform 16S rRNA gene sequencing (targeting V4 region) on all samples
- Include a mock community with known composition as a positive control for accuracy assessment
- Process each sample in triplicate to assess technical variability
Data Analysis:
- Compare alpha-diversity metrics (e.g., observed species, Shannon diversity) between methods
- Evaluate accuracy by comparing observed versus expected abundances in mock communities
- Assess reproducibility through technical replicate consistency [52]
Protocol for Assessing Sample Storage Conditions
To evaluate the impact of sample storage conditions on microbiome composition:
Experimental Design:
- Collect fresh samples from multiple donors
- Divide each sample into aliquots for different storage conditions
- Include immediate freezing at -80°C as a reference standard
Storage Conditions:
- Test various preservation methods (e.g., DNA/RNA Shield, ethanol, RNAlater)
- Evaluate different storage temperatures (room temperature, 4°C, -20°C, -80°C)
- Assess temporal stability by processing aliquots at different time points (e.g., 0, 3, 7, 14, 30 days)
DNA Extraction and Sequencing:
- Extract DNA from all samples using a standardized protocol
- Perform 16S rRNA gene sequencing or shotgun metagenomic sequencing
- Include extraction blanks to control for contamination
Data Analysis:
- Compare microbial composition across storage conditions using beta-diversity metrics
- Identify specific taxa sensitive to different storage conditions
- Evaluate the impact on microbial load measurements across conditions [54]
The Scientist's Toolkit: Essential Research Reagents and Materials
Table 3: Essential Research Reagents and Materials for Standardized Pre-Analytical Processing
| Reagent/Material | Function | Application Notes |
|---|---|---|
| DNA/RNA Shield solution (Zymo Research) | Preserves nucleic acids during sample storage and transportation | Enables room temperature storage for up to 3 weeks with minimal microbial composition changes [54] |
| DNeasy PowerLyzer PowerSoil Kit (QIAGEN) | DNA extraction with mechanical lysis | Optimal for Gram-positive bacteria; enhanced with stool preprocessing device [52] |
| ZymoBIOMICS DNA Miniprep Kit (Zymo Research) | DNA extraction with bead-beating | High DNA yield and quality; suitable for diverse sample types [54] |
| Sterile iCleanhcy Specimen Collection Swabs | Microbial sample collection from body surfaces | Standardized collection from nasal cavity, skin, and other mucosal surfaces [53] |
| Stool Preprocessing Device (SPD, bioMérieux) | Standardizes stool sample homogenization before DNA extraction | Improves DNA extraction yield and reproducibility across samples [52] |
| NucleoSpin Soil Kit (Macherey-Nagel) | DNA extraction from challenging samples | Effective for soil and stool samples; may benefit from protocol modifications [52] |
Workflow Diagrams for Pre-Analytical Standardization
Standardized Pre-Analytical Workflow
Standardized Pre-Analytical Workflow - This diagram illustrates the integrated approach to sample processing that incorporates microbial load estimation to improve result interpretation.
Microbial Load as a Confounder in Study Design
Microbial Load as Study Confounder - This diagram shows how multiple factors influence microbial load, which in turn can create apparent compositional changes that may lead to misleading conclusions if not properly accounted for in the analysis.
Standardization of pre-analytical phases represents an essential prerequisite for valid and reproducible microbiome research. The integration of microbial load measurements into analytical frameworks addresses a critical confounding variable that has often been overlooked in association studies. By adopting standardized protocols for sample collection, storage, and DNA extraction—such as the use of stool preprocessing devices and bead-beating extraction methods—researchers can significantly reduce technical variability and improve cross-study comparability.
Furthermore, the development of computational tools for estimating microbial load from standard sequencing data enables re-evaluation of existing datasets and enhances the design of future studies. As microbiome research progresses toward clinical applications, rigorous attention to these pre-analytical considerations will be paramount for distinguishing true biological signals from methodological artifacts and advancing our understanding of host-microbiome interactions in health and disease.
The variation in microbial load across different environments presents a fundamental challenge in microbial ecology and drug development research. Low microbial biomass samples, characterized by a low absolute abundance of microbial cells, are particularly susceptible to technical artifacts that can severely skew study conclusions. The skin microbiome is a prime example of such a challenging niche, where a low bioburden is compounded by high host DNA contamination and the persistent presence of non-viable microbial material [55] [56]. In these contexts, standard microbiome characterization methods, which often rely on relative abundance data, can produce misleading results. An observed increase in one taxon's relative abundance must mathematically coincide with a decrease in another's, regardless of whether the total bacterial cell density has changed [56]. This review synthesizes current strategies for robustly studying low-biomass environments, framing them within the critical context of how microbial load variation directly impacts the interpretation of data and the validity of biological conclusions.
Core Challenges in Low-Biomass Microbiome Research
Research in low-biomass environments is fraught with methodological pitfalls that can introduce significant bias. Understanding these challenges is the first step toward mitigating their effects.
Relic DNA Bias: A substantial portion of DNA sequenced from low-biomass samples like skin can originate from dead microbial cells. One recent study found that up to 90% of microbial DNA from skin swabs can be relic DNA, which does not represent the active, living community functionally interacting with the host [56]. This can lead to incorrect conclusions about the true microbial population structure.
Low Absolute Abundance and High Host Content: The skin is estimated to host between 10^4 to 10^6 bacterial cells per square centimeter, which is low compared to other body sites [55] [56]. This low signal is often overwhelmed by high quantities of host DNA, reducing sequencing depth for microbial reads and complicating analysis.
Contamination and Bioburden: As an externally facing organ, the skin is highly influenced by the environment. Contamination from reagents, collection kits, or the environment can constitute a significant proportion of the sequenced DNA, potentially leading to false positives and obscuring the true resident signal [55].
Compositional Data Limitations: Most sequencing studies are compositional, meaning they report relative abundances. In a low-biomass setting, a minor contaminant can appear as a dominant taxon, and real but small changes in one organism can create illusory changes in others [57] [56].
Table 1: Key Challenges and Their Impacts on Low-Biomass Studies
| Challenge | Description | Impact on Study Conclusions |
|---|---|---|
| Relic DNA | DNA from dead cells with compromised membranes. | Overestimation of viable microbial diversity and population size; misrepresentation of the functionally active community [56]. |
| Low Biomass | Low absolute abundance of microbial cells. | Reduced statistical power; increased susceptibility to contamination and stochastic effects [55]. |
| High Host DNA | Human DNA dominates the sample. | Lower sequencing efficiency for microbial genomes; higher sequencing costs to achieve sufficient microbial coverage [55] [58]. |
| Compositional Nature | Data sums to a constant (e.g., 100%). | Can create false negative and false positive correlations; obscures true absolute changes in abundance [57] [56]. |
Advanced Strategies for Robust Sampling and Biomass Recovery
The initial sample collection is a critical step where significant bias can be introduced. The choice of method must balance efficacy with practical constraints, especially in clinically sensitive populations.
Evaluation of Sampling Techniques
For sensitive facial skin, gentle scraping with a sterile surgical blade has been demonstrated to recover significantly more microbial DNA than standard swabbing. In a pilot study of 10 patients, swabbing consistently failed to recover detectable microbial DNA, whereas scraping yielded sufficient DNA for both bacterial and fungal sequencing (0.065 to 13.2 ng/µL for bacteria and 0.104 to 30.0 ng/µL for fungi) [58]. Scraping recovers superficial stratum corneum fragments, accessing microbes that swabbing may miss. While tape-stripping is another alternative, it is associated with increased skin irritation [58]. Standardizing the sampled area using plastic patterns and controlling pressure and duration are essential for reproducibility [56].
Relic-DNA Depletion for Targeting the Viable Community
To overcome the bias introduced by DNA from dead cells, propidium monoazide (PMA) treatment can be employed. PMA is a dye that selectively penetrates cells with compromised membranes (dead cells), covalently binds to their DNA upon light activation, and renders it non-amplifiable in subsequent PCR and sequencing steps [56]. This process enriches the sequenced DNA for the viable microbiome.
Integrating PMA treatment with shotgun metagenomics and flow cytometry allows for absolute quantification of the live microbiota. This approach has shown that relic-DNA depletion can reduce intraindividual similarity across samples, strengthening underlying biological patterns [56].
Quantitative Profiling and Analytical Frameworks
Moving beyond relative abundance profiles is crucial for accurate ecological understanding and for assessing the impact of microbial load variation.
Absolute Quantification Methods
Flow Cytometry with Internal Standards: Using flow cytometry to count cells in a sample provides an absolute count of total bacteria (from both live and dead cells). When combined with PMA treatment, it can specifically quantify the live cell fraction [56]. This absolute count is foundational for contextualizing sequencing data.
Spike-In Standards: Adding a known quantity of an artificially designed, synthetic DNA sequence (a spike-in) to the sample before DNA extraction and sequencing allows for the conversion of relative sequencing read counts into absolute abundances [57]. The known quantity of the spike-in serves as a calibrator, enabling the calculation of 16S rRNA gene copies per unit of volume or mass [57].
Table 2: Comparison of Quantitative Profiling Approaches
| Method | Principle | Output Metric | Key Advantage | Consideration |
|---|---|---|---|---|
| Flow Cytometry | Physical counting of cells stained with fluorescent dye. | Cells per unit volume (e.g., cells/mL). | Direct, culture-independent measure of total and viable cell load [56]. | Requires fresh or properly preserved samples; does not provide taxonomic ID. |
| Spike-In Standards | Addition of known quantity of synthetic DNA prior to extraction. | 16S rRNA gene copies per unit volume or mass [57]. | Converts relative sequencing data to absolute abundance; corrects for technical biases. | Requires careful optimization of spike-in concentration; added cost. |
| PMA Treatment | Selective removal of DNA from dead cells prior to sequencing. | Relative and absolute abundance of the viable community. | Reveals the active microbial fraction; reduces relic-DNA bias [56]. | Protocol requires optimization for different sample types (e.g., skin, soil). |
In Silico Modeling and Integration
Computational modeling provides a systems-level framework to interpret complex microbiome data and generate testable hypotheses. Genome-scale metabolic models (GEMs), like the AGORA2 resource, comprehensively map the biochemical transformations encoded by a microbial genome [38]. When applied to the skin microbiota, in silico models can simulate dynamic responses to perturbations, such as the introduction of a probiotic or a change in the skin environment, helping to rationalize therapy design [59]. These models can be parameterized with quantitative, absolute abundance data to more accurately predict community dynamics and host-microbe interactions.
The Scientist's Toolkit: Essential Reagents and Materials
Table 3: Key Research Reagent Solutions for Low-Biomass Studies
| Reagent / Material | Function | Application in Low-Biomass Research |
|---|---|---|
| Propidium Monoazide (PMA) | DNA intercalating dye that selectively cross-links relic DNA in dead cells. | Depletion of relic DNA prior to DNA extraction to profile the viable microbiome [56]. |
| Internal Spike-in Standards | Synthetic DNA sequences added in known quantities to the sample. | Absolute quantification of 16S rRNA gene copies or genomes, correcting for technical variation [57]. |
| HostZERO Microbial DNA Kit | DNA extraction kit designed to deplete host DNA. | Enhances microbial DNA recovery and reduces host DNA background in samples with high host content [58]. |
| Sterile Surgical Blades (No. 10) | Tool for gentle scraping of the stratum corneum. | Superior microbial DNA recovery from sensitive and low-biomass skin sites compared to swabs [58]. |
| SYBR Green I Nucleic Acid Stain | Fluorescent dye that binds to double-stranded DNA. | Staining for flow cytometric absolute cell counting (total cells) [56]. |
Integrated Workflow and Future Perspectives
Combining the strategies outlined above creates a powerful, multi-faceted approach to tackling low-biomass challenges. The following diagram summarizes an integrated workflow from sample collection to data interpretation, highlighting steps that address key biases.
The future of low-biomass research lies in the widespread adoption of quantitative methods and multi-modal integration. As computational models become more sophisticated and are validated with quantitative, viability-informed data, they will unlock a deeper, more mechanistic understanding of microbiome dynamics in these challenging environments [59]. This integrated approach—combining optimized sampling, relic-DNA depletion, absolute quantification, and in silico modeling—provides a robust framework to ensure that conclusions drawn from low-biomass studies reflect genuine biology rather than methodological artifacts. For drug development professionals, this rigor is paramount in accurately assessing the role of niche-specific microbiomes in therapeutic efficacy and toxicity [38].
In microbiome research, the standard reliance on relative abundance data introduces significant distortion in study conclusions, as an increase in one taxon's abundance forces an apparent decrease in all others. This review frames the critical importance of absolute quantification within a broader thesis on how microbial load variation fundamentally affects biological interpretations. We detail how spike-in controls, particularly novel marine-sourced bacterial DNA, provide a robust methodological correction to this problem, enabling researchers to distinguish true biological change from measurement artifact and thereby derive more accurate conclusions from microbial studies.
Microbial load variation represents a fundamental, often unaddressed confounder in microbiome science. When analyses rely solely on relative abundance—the proportion of a specific taxon within the total sequenced community—critical information about the absolute quantity of organisms in the sample is lost.
- The Compositional Data Problem: Relative abundance data is compositional; all measurements are interdependent. An increase in the relative abundance of one taxon necessitates a mathematical decrease in the abundance of others, even if their absolute cell counts remain unchanged [60]. This inherent negative correlation bias can generate false positives in differential abundance analyses and obscure true biological relationships [60].
- Impact on Clinical and Ecological Inferences: Variations in total microbial load between sample groups (e.g., healthy vs. diseased states, mothers vs. infants, or different treatment arms) can completely invert the interpretation of a taxon's dynamics. A bacterium that appears to increase in relative terms might actually be stable or even decreasing in absolute abundance if the total community size shrinks. Without absolute quantification, these erroneous conclusions can misdirect research and therapeutic development.
The Solution: Spike-In Controls for Absolute Quantification
Spike-in controls provide a powerful methodological solution to the problem of microbial load variation. The core principle involves adding a known quantity of an exogenous biological material (e.g., DNA from microbes not found in the native habitat) to each sample prior to DNA extraction. By measuring the proportion of spike-in sequences in the final sequencing data, researchers can back-calculate the absolute abundance of all endogenous taxa.
A 2025 pilot study demonstrated the efficacy of a novel spike-in approach using marine-sourced bacterial DNA from Pseudoalteromonas sp. APC 3896 and Planococcus sp. APC 3900, strains isolated from deep-sea fish [60]. These were selected for their phylogenetic distance from typical gut microbiota and their reliable amplification with standard 16S rRNA primers.
Comparative Performance of Absolute Quantification Methods
The table below summarizes the key absolute quantification techniques, highlighting the advantages of the spike-in method.
Table 1: Comparison of Absolute Microbiome Quantification Methods
| Method | Principle | Key Advantages | Key Limitations |
|---|---|---|---|
| Marine-Sourced DNA Spike-In [60] | Addition of known quantity of exogenous bacterial DNA to sample DNA prior to sequencing. | High accuracy and scalability; applicable to high-throughput workflows; accounts for technical biases from DNA extraction to sequencing. | Requires careful calibration of spike-in DNA quantity; relies on absence of spike-in taxa in native samples. |
| Flow Cytometry [60] | Direct counting of bacterial cells in a fluid stream. | Direct cell count; provides viability data using specific dyes. | Requires complex sample preparation (dissociation, dilution, filtering); challenging for low-biomass/small-volume samples. |
| Quantitative PCR (qPCR) [60] | Amplification and quantification of a target gene (e.g., 16S rRNA) using standard curves. | High taxonomic specificity with appropriate primers. | Subject to primer-dependent amplification bias; difficult to scale for complex communities. |
| Total DNA Quantification [60] | Measurement of total DNA yield from a sample. | Technically simple and fast. | Confounded by the presence of host and non-bacterial DNA; inaccurate for low-biomass samples. |
Experimental Protocol: Implementing a Marine-Sourced DNA Spike-In
The following detailed methodology is adapted from the 2025 pilot study that validated the use of marine-sourced bacterial DNA [60].
Reagent Preparation and Calibration
- Spike-in Strains: Culture Pseudoalteromonas sp. APC 3896 and Planococcus sp. APC 3900 in Difco 2216 marine broth aerobically at 30°C for 24 hours [60].
- Genomic DNA (gDNA) Extraction: Extract gDNA from bacterial cultures using a standard kit. Precisely quantify the DNA concentration using a fluorescence-based method (e.g., Qubit 1X dsDNA HS Assay).
- Spike-in Stock Solution: Combine the gDNA from both strains into a single stock solution. The absolute quantity (number of DNA copies) is calculated using the formula:
number of copies = (amount of DNA [ng] × 6.022 × 10^23) / (length of dsDNA amplicon × 660 × 10^9)[60]. - Working Solution: Serially dilute the stock to a working concentration that will be added to patient samples.
Sample Processing and Sequencing
- Aliquot Sample: Precisely aliquot a homogenized portion of the biological sample (e.g., 0.2 g of stool).
- Add Spike-in: Add a known volume of the spike-in working solution to the sample aliquot. The volume added should contain a known number of spike-in DNA copies.
- Co-extraction: Perform genomic DNA extraction on the combined sample-spike-in mixture (e.g., using QIAmp Mini Stool DNA Kit with bead-beating homogenization) [60].
- Library Preparation and Sequencing: Proceed with standard library preparation targeting the 16S rRNA V3-V4 region and perform high-throughput sequencing.
Data Analysis and Absolute Abundance Calculation
- Bioinformatic Processing: Process raw sequencing data through a standard 16S rRNA amplicon pipeline (DADA2, QIIME 2, or mothur).
- Spike-in Sequence Identification: Identify sequences that map to the Pseudoalteromonas and Planococcus genera.
- Calculate Absolute Abundance: For each native taxon i in the sample, its absolute abundance is calculated as:
Absolute Abundance (cells/g) = (Reads_taxon_i / Reads_spike-in) × (Known_cells_spike-in / Sample_mass). The known cell count of the spike-in is derived from the pre-added DNA copy number, adjusted for the 16S rRNA gene copy number per genome obtained from databases like rrnDB [60].
The Scientist's Toolkit: Essential Research Reagent Solutions
Table 2: Key Reagents and Materials for Spike-in Absolute Quantification
| Item | Function / Rationale | Specific Examples / Notes |
|---|---|---|
| Exogenous Spike-in Organisms | Provides a known number of cells or DNA molecules for calibration. | Marine-sourced bacteria (Pseudoalteromonas sp., Planococcus sp.) are evolutionarily distant from host-associated microbiomes [60]. |
| Culture Medium | For propagation and maintenance of spike-in organisms. | Difco 2216 Marine Broth is specified for cultivating marine bacterial strains [60]. |
| High-Sensitivity DNA Quantification Kit | For accurate measurement of spike-in DNA concentration. | Qubit 1X dsDNA HS Assay Kit; more accurate for dilute nucleic acid solutions than spectrophotometry [60]. |
| DNA Extraction Kit with Bead Beating | For simultaneous lysis of sample and spike-in cells to ensure equal recovery. | QIAmp Mini Stool DNA Kit with zirconia beads for mechanical homogenization [60]. |
| 16S rRNA Gene Primer Set | For amplification of the target gene from both native and spike-in communities. | Primers for V3-V4 region; must effectively amplify the chosen spike-in organisms [60]. |
| Reference Database | For determining 16S rRNA gene copy number in spike-in genomes. | rrnDB database; provides accurate copy number information needed for final calculations [60]. |
Integrating absolute quantification via spike-ins fundamentally alters data interpretation. The 2025 pilot study on mother-infant pairs revealed that while relative abundance analysis showed compositional differences, absolute quantification demonstrated that mothers had a total bacterial load approximately half a log higher than infants [60]. Crucially, the absolute abundance of Bifidobacterium was comparable between mothers and infants, a finding masked by relative data [60]. This demonstrates how microbial load variation, if unaccounted for, leads to flawed conclusions about taxonomic abundance and dynamics.
The Firmicutes/Bacteroidetes (F/B) ratio has long been a prominent metric in microbiome research, frequently cited as a hallmark of states like obesity. However, a critical examination of the evidence reveals that this ratio is a flawed and unreliable biomarker. This whitepaper details the technical and interpretative pitfalls of over-relying on such simplistic metrics, with a specific focus on how variation in total microbial load can confound study conclusions and lead to erroneous interpretations. By exploring advanced quantitative methodologies and presenting a framework for more robust analysis, this guide aims to equip researchers and drug development professionals with the knowledge to navigate the complexities of microbiome data, thereby enhancing the validity and translational potential of their findings.
The F/B Ratio: From Promising Biomarker to Problematic Metric
The gut microbiota is dominated by two major bacterial phyla, Firmicutes and Bacteroidetes, which together can constitute over 90% of the microbial community [61]. The F/B ratio first gained prominence as a potential biomarker for obesity following early studies in mice and humans which reported a higher proportion of Firmicutes and a lower proportion of Bacteroidetes in obese individuals compared to their lean counterparts [61]. It was theorized that an elevated F/B ratio could indicate a microbiota with an increased capacity to harvest energy from the diet, thus promoting weight gain and obesity [61] [62].
Despite its initial promise, subsequent research has failed to consistently replicate these findings, leading to significant controversy. Numerous studies have reported contradictory results, showing no modification of the ratio or even a decreased F/B ratio in obese individuals [61]. For instance, a 2022 longitudinal study in children found no relationship between the F/B ratio and BMI z-scores throughout the first 12 years of life [62]. Similarly, a large 2020 study of a healthy Ukrainian population observed that the F/B ratio naturally increases with age in healthy individuals, complicating its interpretation in disease contexts [63]. These discrepancies indicate that the F/B ratio is not a specific hallmark of obesity and that its utility as a standalone diagnostic or prognostic tool is highly questionable.
The Core Problem: Compositional Data and Microbial Load Variation
The primary pitfall of using relative abundance data, such as the F/B ratio, stems from the compositional nature of standard sequencing data. Techniques like 16S rRNA gene amplicon sequencing measure the relative proportion of each taxon, meaning all abundances sum to 100% [18]. Consequently, an increase in the relative abundance of one taxon necessitates an artificial decrease in the relative abundance of others, creating a false dependency that is a mathematical artifact of the measurement technique, not a true biological phenomenon [18].
Table 1: Interpreting Changes in Relative Abundance: A Two-Taxon Example
| Scenario | Change in Relative Abundance | Possible Absolute Abundance Reality |
|---|---|---|
| Scenario 1 | Taxon A increases, Taxon B decreases | Taxon A's population grew, Taxon B's stayed the same. |
| Scenario 2 | Taxon A increases, Taxon B decreases | Taxon A's population stayed the same, Taxon B's decreased. |
| Scenario 3 | Taxon A increases, Taxon B decreases | Both taxa decreased, but Taxon B decreased more drastically. |
| Scenario 4 | Taxon A increases, Taxon B decreases | Both taxa increased, but Taxon A increased more dramatically. |
This compositional constraint means that a change in the F/B ratio can represent any of the scenarios outlined in Table 1 [18]. Without knowledge of the total microbial load, it is impossible to determine if an increased F/B ratio is due to a true expansion of Firmicutes, a loss of Bacteroidetes, or a complex combination of both. This fundamental limitation can lead to high false-positive rates in differential abundance analysis and severely skews correlation-based analyses [18].
The following diagram illustrates how different underlying changes in absolute abundance can lead to the same observed relative abundance profile, highlighting the interpretative challenge.
Quantitative Methodologies: Moving from Relative to Absolute Abundance
To overcome the limitations of relative abundance data, researchers have developed Quantitative Microbiome Profiling (QMP) approaches that measure the absolute abundance of microbial taxa. The core principle involves normalizing relative sequencing data with an independent measurement of the total microbial load in a sample [13].
Key Quantification Methods
The main methods for determining total microbial load each have distinct advantages and limitations, as summarized in the table below.
Table 2: Comparison of Microbial Load Quantification Methods for QMP
| Method | Principle | Key Advantages | Key Limitations & Challenges |
|---|---|---|---|
| Flow Cytometry (QMP) [13] | Direct counting of intact microbial cells. | Counts only intact cells, independent of DNA extraction efficiency and amplification bias. | Cannot discriminate between live/dead cells without viability dyes (e.g., PMA); requires specialized equipment. |
| Quantitative PCR (qPCR) [13] | Molecular quantification of 16S rRNA gene copies. | Cost-effective, simple, and highly accessible for most labs. | Sensitive to DNA extraction efficiency, PCR inhibitors, and amplification bias; correlates poorly with flow cytometry in complex samples [13]. |
| Digital PCR (dPCR) [18] | Absolute quantification of 16S rRNA gene copies via endpoint partitioning. | High precision, resistant to PCR inhibitors, no standard curve needed. | Higher cost per sample than qPCR; upper limit of quantification constrained by partition count. |
| Spiked Standards [18] | Addition of known quantities of exogenous DNA before extraction. | Controls for both DNA extraction and amplification biases. | Requires careful calibration; spike-in material must not cross-react with sample DNA. |
A critical study from 2020 directly compared flow cytometry-based and qPCR-based QMP and found that they generated highly divergent quantitative microbial profiles from the same fecal samples [13]. This discrepancy persisted even when samples were pre-treated with Propidium Monoazide (PMA) to exclude DNA from dead cells, suggesting that technical differences—not biological factors—are a major source of bias. This underscores the importance of methodological consistency and validation in quantitative studies [13].
An Integrated Quantitative Sequencing Framework
A robust framework for absolute abundance measurement combines the precision of dPCR with the high-throughput nature of 16S rRNA gene sequencing [18]. This workflow is particularly powerful for samples with varying microbial loads, such as those from different gastrointestinal locations (lumen vs. mucosa).
Table 3: The Scientist's Toolkit: Essential Reagents for a dPCR-Based QMP Workflow
| Item / Reagent | Function in the Protocol |
|---|---|
| Digital PCR (dPCR) System | Provides absolute quantification of total 16S rRNA gene copies per gram of sample, serving as the anchoring value. |
| Full-Length 16S rRNA Gene Amplicon Sequencing | Profiles the taxonomic composition of the sample; stopped in late exponential phase to minimize chimera formation [18]. |
| Validated DNA Extraction Kit | Efficiently lyses both Gram-positive and Gram-negative cells; efficiency should be confirmed across sample types (e.g., stool, mucosa) [18]. |
| Mock Microbial Community | A defined mix of bacteria used to validate DNA extraction efficiency and evenness across different sample matrices. |
| Germ-Free (GF) Mouse Tissue | Used as a matrix for spike-in recovery experiments to assess extraction performance without background interference [18]. |
The following diagram outlines a generalized experimental workflow for obtaining absolute abundance data, integrating the tools listed above.
Implications for Research and Drug Development
The shift from relative to absolute quantification has profound implications for interpreting study outcomes and developing microbiome-targeted therapies.
Re-evaluation of Established Findings
The ketogenic diet provides a compelling case study. When analyzed using relative abundance, it may appear to cause a significant increase in a particular taxon. However, quantitative analysis revealed that the ketogenic diet actually caused a substantial decrease in total microbial load. The relative increase was a passive consequence of the broader community collapse, not an active expansion of the taxon in question [18]. Without absolute quantification, the biological interpretation is fundamentally incorrect.
Advancing Therapeutic Discovery and Development
In pharmaceutical development, inaccurate microbial metrics pose direct risks.
- Misidentifying Drug Targets: Relying on relative F/B ratios could lead programs to target a taxon that appears elevated in disease but is actually stable in absolute terms, leading to therapeutic dead-ends.
- Overlooking True Effects: A therapeutically beneficial reduction in a pathobiont could be masked in relative data if other taxa expand to fill the niche.
- Sterility Testing: Beyond the gut, growth-based methods for sterility testing in drug manufacturing are slow and can yield false negatives, risking patient safety [64]. Rapid methods like qPCR/dPCR are capable of faster, more sensitive detection of contaminants, enhancing sterility assurance [64].
Furthermore, understanding absolute abundances is crucial for developing Microbiome-active Drug Delivery Systems (MADDS). These systems leverage microbial stimuli (e.g., specific enzymes, pH) for controlled drug release [65]. The absolute abundance of these microbes, not their relative proportion, will determine the local concentration of the triggering stimulus and, therefore, the efficacy and consistency of the drug release profile.
The over-reliance on simplistic ratios like Firmicutes/Bacteroidetes represents an outdated approach that fails to capture the true dynamics of microbial ecosystems. The variation in total microbial load is not a peripheral concern but a central factor that can completely invert research conclusions and undermine the development of robust biomarkers and therapies.
To move the field forward, researchers and drug developers must:
- Abandon Single-Ratio Metrics: Discontinue the use of the F/B ratio as a primary biomarker for disease states.
- Adopt Quantitative Frameworks: Integrate absolute abundance measurements using dPCR, flow cytometry, or validated spike-in standards as a standard practice in microbiome study design.
- Embrace Methodological Rigor: Acknowledge and account for the significant biases introduced by different quantification methods by performing validation experiments and reporting methodologies with utmost transparency.
By embracing quantitative precision over simplistic ratios, the scientific community can generate more reproducible, biologically accurate, and clinically meaningful data, ultimately unlocking the true translational potential of microbiome research.
In microbial research, the validity of study conclusions is fundamentally dependent on the consistency of experimental conditions, with microbial load variation representing a critical and often overlooked source of bias. Differences in initial cell density, growth phase, and culture handling can significantly alter microbial physiology and response to experimental treatments, potentially leading to irreproducible and conflicting findings [22]. The research community faces a reproducibility crisis exacerbated by manual, variable techniques and insufficient methodological documentation [66]. This technical guide examines how automation and standardization strategies directly address these challenges by controlling for microbial load variation, thereby enhancing the reliability and replicability of microbial studies for researchers, scientists, and drug development professionals.
How Microbial Load Influences Experimental Outcomes
Microbial load, often quantified via optical density or cell count, is not merely a metric but a determinant of population-level physiology. Variations in load affect the dynamics of nutrient depletion, waste accumulation, and cell-to-cell communication, which in turn influence gene expression and phenotypic outcomes [22]. In drug discovery, sub-inhibitory concentrations of antimicrobials can exert strikingly different effects depending on the density and growth phase of the bacterial culture. For instance, a drug might prolong the lag phase in one instance but primarily reduce the maximal growth rate in another, leading to incorrect conclusions about its mechanism of action [22].
The Reproducibility Challenge
The voluminous and specialized nature of modern scientific literature, combined with intense pressure to publish, has created an environment where methodological details are often omitted, and results can be difficult to verify independently [66]. In microbial culturing, factors such as well shape, culture volume, and plate coverings significantly affect evaporation and aeration, directly impacting growth measurements and contributing to inter-laboratory variability [67]. A core problem is the inconsistent terminology surrounding verification; as defined by the National Academies of Sciences, Engineering, and Medicine, reproducibility refers to obtaining consistent results using the same data and methods, while replicability means confirming findings with new data and independent methods [66].
Table 1: Quantifying the Impact of Technical Variables on Microbial Growth
| Technical Variable | Impact on Microbial Growth | Effect on Data Reproducibility |
|---|---|---|
| Culture Volume (≤ 0.25 ml) | Increased evaporation; altered aeration [67] | High well-to-well and plate-to-plate variation |
| Well Geometry (round vs. square) | Changes in oxygen transfer and mixing efficiency [67] | Alters growth kinetics, affecting comparisons between studies |
| Plate Sealing (lid vs. gas-permeable membrane) | Modifies humidity and gas exchange within the well [67] | Significant edge effects (edge vs. center wells); inconsistent growth |
| Manual Pipetting | Introduces volume inaccuracies and cross-contamination [68] | High error rates that can compromise sequencing and assay results |
Automation as a Solution for Reproducible Microbial Culturing
Integrated Automated Systems for Cell Culture
Fully automated microbial culture systems integrate robotic arms, automated liquid handlers (e.g., from Hamilton Robotics), and multi-mode plate readers (e.g., BioTek Neo2SM) to create a closed, consistent workflow [67]. These systems handle plate movement, liquid transfer, incubation, and measurement without human intervention. A key feature is the use of an automated plate sealer and de-sealer that applies gas-permeable membranes to 96-well plates. This step is critical for minimizing evaporation during extended incubations, thereby reducing a major source of microbial load variation, especially between edge and center wells [67] [69].
A Standardized Automated Protocol for Growth and Measurement
The following detailed protocol, adapted from a method validated over 150 experiments, ensures cultures are maintained in a reproducible state [67]:
- Culture Vessel: Use clear-bottom 96-well plates with square wells (e.g., 4titude, #4ti-0255) and a working volume of 500 µl. This volume provides sufficient aeration while remaining compatible with standard plate readers [67].
- Sealing: Apply a gas-permeable membrane (e.g., 4titude, #4ti-0598) using an automated sealer before incubation [67].
- Incubation and Measurement: Incubate plates at 37°C in a plate reader equipped with double-orbital shaking (807 cpm). Measure OD600 and fluorescence every 5 minutes. Applying a small temperature gradient (e.g., 1°C from bottom to top) minimizes condensation on the seal [67].
- Automated Passaging: The protocol employs sequential passaging to control growth phase:
- Growth Plate 1 (Stationary Phase): The automated liquid handler prepares a plate with rich media and seeds it with a diluted culture. It is sealed and incubated for 12-16 hours to provide a reproducible starting point.
- Growth Plate 2 (Exponential Phase): A second plate is pre-filled with a serial dilution of an inducer (e.g., IPTG) and pre-warmed. Using a 96-channel pipetting head, the system transfers a small aliquot (e.g., 10 µl) from Growth Plate 1 to this new plate, creating a 50-fold dilution. This plate is then sealed and incubated for a defined period (e.g., 160 min) to maintain exponential growth [67].
This workflow ensures that cultures are always harvested or measured at a consistent physiological state, mitigating the confounding effects of microbial load variation.
Diagram 1: Automated microbial culture and analysis workflow.
Standardizing Analysis: Quantitative Frameworks for Robust Growth Phenotyping
Deconvolving Growth Parameters with Mathematical Models
To objectively quantify how experimental variables affect microbial growth, growth curve data must be fitted to robust mathematical models. The modified Gompertz equation is widely used for this purpose, as it deconvolves the growth curve into three key parameters that can be independently analyzed [22]:
- Lag Period (λ): The duration of physiological adjustment before exponential growth.
- Maximal Growth Rate (μmax): The slope of the steepest part of the growth curve.
- Maximal Bacterial Load (A): The carrying capacity or yield of the culture.
Fitting this model to high-throughput growth data allows researchers to determine whether a drug or genetic perturbation specifically affects one of these parameters or has a mixed effect, moving beyond qualitative comparisons [22].
Comparing Drug Effects at Standardized Inhibition Levels
Directly comparing Gompertz parameters from curves with different overall levels of inhibition is invalid. A solution is to use the Area Under the Curve (AUC) as a standardized metric of drug potency. Researchers can interpolate the Gompertz parameters across a range of AUC values (e.g., from 0.2 to 1.0, relative to a no-drug control) [22]. This creates a mathematical framework to ask: "How does each drug reshape the growth curve at an identical level of inhibition (e.g., at AUC50)?" This approach revealed that drugs with the same cellular target can produce distinct growth inhibition phenotypes, and that drug inactivation by resistant bacteria is a major factor underlying a phenotype dominated by a prolonged lag phase [22].
Table 2: Essential Research Reagents and Equipment for Automated, Reproducible Microbial Culture
| Item | Function/Role in Reproducibility | Specific Example |
|---|---|---|
| Automated Liquid Handler | Ensures precise, reproducible liquid transfers and dilutions across all wells and plates [67]. | Hamilton Robotics STAR |
| 96-Channel Pipetting Head | Enables simultaneous transfer across an entire plate, critical for consistent passaging and reagent addition [67]. | Integrated with Hamilton STAR |
| Multi-Mode Plate Reader | Provides automated, continuous monitoring of optical density (OD600) and fluorescence during incubation [67]. | BioTek Neo2SM |
| Gas-Permeable Seal | Minimizes evaporation and ensures consistent gas exchange, critical for reducing edge effects [67]. | 4titude #4ti-0598 |
| Square-Well Plates | Optimizes culture aeration and optical properties for growth and measurement in plate readers [67]. | 4titude #4ti-0255 |
| Automated Colony Picker | Streamlines the isolation of single colonies, reducing contamination and human selection bias [68]. | QPix FLEX System |
The Scientist's Toolkit: Key Reagent Solutions
Implementing automated and reproducible workflows requires specific laboratory tools. The table below details essential equipment and their functions.
The integration of automation, standardized protocols, and quantitative data analysis presents a comprehensive solution to the challenge of reproducibility in microbial research. By systematically controlling for technical variations, particularly in microbial load, these approaches allow the true biological effects of drugs and genetic perturbations to be accurately measured and compared. As these methodologies become more accessible—evolving from a luxury to essential infrastructure—they empower labs of all sizes to generate data that is not only robust and reliable but also truly replicable, thereby accelerating discovery in drug development and fundamental microbiology [67] [68].
Conclusion
Microbial load is not merely a technical metric but a fundamental biological variable that critically confounds research conclusions. Ignoring its variation risks widespread false associations and misleading interpretations in microbiome science and drug development. The integration of robust methodological frameworks—spanning experimental wet-lab techniques like spike-ins and host depletion, coupled with dry-lab computational corrections—is no longer optional but essential for scientific rigor. Future research must prioritize the systematic incorporation of microbial load assessment into standard protocols. This paradigm shift will enhance the reproducibility of findings, validate true disease-microbe links, and ultimately pave the way for more reliable diagnostics and targeted therapeutics in precision medicine.
References
- 1. Absolute Abundance vs Relative Abundance in the ... [https://www.cd-genomics.com/resource-absolute-abundance-relative-abundance.html]
- 2. Current Applications of Absolute Bacterial Quantification in ... [https://pmc.ncbi.nlm.nih.gov/articles/PMC8467167/]
- 3. The Importance of Quantification in Microbiome Science [https://blog.microbiomeinsights.com/importance-quantification-microbiome-science]
- 4. Establishing microbial composition measurement ... [https://www.nature.com/articles/s41467-019-10656-5]
- 5. Quantifying the relative contributions of bacterial and ... [https://www.nature.com/articles/s41522-025-00842-3]
- 6. Microbial load can influence disease associations [https://www.embl.org/news/science-technology/microbial-load-can-influence-disease-associations/]
- 7. Fecal microbial load is a major determinant of gut ... [https://www.sciencedirect.com/science/article/pii/S0092867424012042]
- 8. Quantitative profiling of bacterial communities via full length ... [https://bmcmicrobiol.biomedcentral.com/articles/10.1186/s12866-025-04399-1]
- 9. Microbiome Datasets Are Compositional: And This Is Not ... [https://www.frontiersin.org/journals/microbiology/articles/10.3389/fmicb.2017.02224/full]
- 10. Systematic characterization and analysis of the taxonomic ... [https://pmc.ncbi.nlm.nih.gov/articles/PMC5316541/]
- 11. Quantitative microbiome profiling links gut ... [https://www.nature.com/articles/nature24460]
- 12. Machine Learning Reveals Impact of Microbial Load on ... [https://www.genengnews.com/topics/artificial-intelligence/machine-learning-reveals-impact-of-microbial-load-on-gut-health-and-disease/]
- 13. How to Count Our Microbes? The Effect of Different ... [https://pmc.ncbi.nlm.nih.gov/articles/PMC7426659/]
- 14. Gut bacteria: both variation and load affect health outcomes [https://sciencenews.dk/en/gut-bacteria-both-variation-and-load-affect-health-outcomes]
- 15. AI in Pharma and Biotech: Market Trends 2025 and Beyond [https://www.coherentsolutions.com/insights/artificial-intelligence-in-pharmaceuticals-and-biotechnology-current-trends-and-innovations]
- 16. Real-World Data and Causal Machine Learning to Enhance ... [https://pmc.ncbi.nlm.nih.gov/articles/PMC12579681/]
- 17. Beyond just correlation: causal machine learning for the ... [https://pmc.ncbi.nlm.nih.gov/articles/PMC12521120/]
- 18. A quantitative sequencing framework for absolute ... [https://www.nature.com/articles/s41467-020-16224-6]
- 19. Adjusting microbiome profiles for differences in microbial load ... [https://microbiomejournal.biomedcentral.com/articles/10.1186/s40168-016-0175-0]
- 20. Does Day-to-Day Variability in Stool Consistency Link ... [https://www.frontiersin.org/journals/cellular-and-infection-microbiology/articles/10.3389/fcimb.2021.639667/full]
- 21. A stratified comparative study of age and constipation subtype [https://pmc.ncbi.nlm.nih.gov/articles/PMC12576558/]
- 22. Predicting drug inactivation by changes in bacterial growth ... [https://www.nature.com/articles/s44259-025-00152-w]
- 23. How to Determine the Role of the Microbiome in Drug ... [https://pmc.ncbi.nlm.nih.gov/articles/PMC7333656/]
- 24. Methods for detection of viable foodborne pathogens [https://pmc.ncbi.nlm.nih.gov/articles/PMC7190587/]
- 25. A comparison of methods for enumerating bacteria in direct ... [https://www.sciencedirect.com/science/article/abs/pii/S016770121930154X]
- 26. PRIMARY CARE | Limitations of Culture [https://microgendx.com/primary-care-limitations-of-culture/]
- 27. A comparison of conventional methods for the quantification of ... [https://pmc.ncbi.nlm.nih.gov/articles/PMC4236543/]
- 28. Experimental design and quantitative analysis of microbial ... [https://pmc.ncbi.nlm.nih.gov/articles/PMC5708111/]
- 29. Method comparison for the direct enumeration of bacterial ... [https://bmcmicrobiol.biomedcentral.com/articles/10.1186/s12866-019-1669-2]
- 30. Synthetic spike-in standards for high-throughput 16S rRNA ... [https://pmc.ncbi.nlm.nih.gov/articles/PMC5389483/]
- 31. Full-length 16S rRNA gene sequencing by PacBio improves ... [https://bmcgenomics.biomedcentral.com/articles/10.1186/s12864-024-10213-5]
- 32. Evaluation of 16S rRNA gene sequencing for species and ... [https://www.nature.com/articles/s41467-019-13036-1]
- 33. Unveiling the impact of 16S rRNA gene intergenomic ... [https://pmc.ncbi.nlm.nih.gov/articles/PMC12081361/]
- 34. 16S and ITS rRNA Sequencing | Identify bacteria & fungi ... [https://www.illumina.com/areas-of-interest/microbiology/microbial-sequencing-methods/16s-rrna-sequencing.html]
- 35. Nanopore full length 16S rRNA gene sequencing ... [https://www.nature.com/articles/s41598-025-10999-8]
- 36. Sample tracking in microbiome community profiling assays ... [https://www.nature.com/articles/s41598-018-27314-3]
- 37. Use of Recombinant Bacteria with Unique Tags as Spike-in ... [https://www.atcc.org/resources/application-notes/use-of-recombinant-bacteria-with-unique-tags-as-spike-in-controls-for-microbiome-studies]
- 38. Microbial metabolism marvels: a comprehensive review of ... [https://pmc.ncbi.nlm.nih.gov/articles/PMC11332652/]
- 39. Optimization of Metagenomic Next-Generation Sequencing Workflow with a Novel Host Depletion Method for Enhanced Pathogen Detection | Molecular Diagnosis & Therapy [https://link.springer.com/article/10.1007/s40291-025-00797-3]
- 40. Advances in Host Depletion and Pathogen Enrichment Methods for Rapid Sequencing–Based Diagnosis of Bloodstream Infection - ScienceDirect [https://www.sciencedirect.com/science/article/pii/S1525157824001284]
- 41. Devin™ Host Depletion & Metagenomics Assay More Accurate [https://micronbrane.com/host-depletion-pathogen-identificiation-mngs/]
- 42. a novel filtration and targeted next-generation sequencing ... [https://www.frontiersin.org/journals/microbiology/articles/10.3389/fmicb.2025.1538265/full]
- 43. Enhancing bloodstream infection diagnostics: a novel filtration ... [https://pmc.ncbi.nlm.nih.gov/articles/PMC11965694/]
- 44. Skin metatranscriptomics reveals a landscape of variation ... [https://www.nature.com/articles/s41587-025-02797-4]
- 45. Metatranscriptomics: Case Studies on Microbial Gene ... [https://www.cd-genomics.com/blog/metatranscriptomics-case-study-environments/]
- 46. Skin metatranscriptomics reveals a landscape of variation ... [https://pubmed.ncbi.nlm.nih.gov/40877570/]
- 47. Metatranscriptomic Workflow Reveals Microbial Gene ... [https://www.genomeweb.com/sequencing/metatranscriptomic-workflow-reveals-microbial-gene-activity-across-skin-microbiome-sites]
- 48. Guidelines for preventing and reporting contamination in ... [https://www.nature.com/articles/s41564-025-02035-2]
- 49. Computational Metagenomics: State of the Art - PMC [https://pmc.ncbi.nlm.nih.gov/articles/PMC12470432/]
- 50. Variation in the microbial β-glucuronidase level in the human ... [https://pmc.ncbi.nlm.nih.gov/articles/PMC7790408/]
- 51. Variability in the Pre-Analytical Stages Influences ... [https://pmc.ncbi.nlm.nih.gov/articles/PMC9223004/]
- 52. Comparison of DNA extraction methods for 16S rRNA gene ... [https://www.nature.com/articles/s41598-023-33959-6]
- 53. Sample Collection, DNA Extraction, and Library Construction ... [https://pmc.ncbi.nlm.nih.gov/articles/PMC10260709/]
- 54. Optimisation of sample storage and DNA extraction for human ... [https://pmc.ncbi.nlm.nih.gov/articles/PMC8164492/]
- 55. The Skin Microbiome: Current Techniques, Challenges ... [https://pmc.ncbi.nlm.nih.gov/articles/PMC10223452/]
- 56. Absolute quantification of the living skin microbiome ... [https://microbiomejournal.biomedcentral.com/articles/10.1186/s40168-025-02063-4]
- 57. Quantitative microbial taxonomy across particle size, depth ... [https://www.frontiersin.org/journals/microbiology/articles/10.3389/fmicb.2025.1552305/full]
- 58. Scraping enhances microbial DNA recovery over swabbing ... [https://www.nature.com/articles/s41598-025-22259-w]
- 59. Toward the Next Generation of In Silico Modeling ... [https://pmc.ncbi.nlm.nih.gov/articles/PMC12221595/]
- 60. Assessment of absolute abundance in mother-infant gut ... [https://pmc.ncbi.nlm.nih.gov/articles/PMC12367464/]
- 61. The Firmicutes/Bacteroidetes Ratio: A Relevant Marker of Gut ... [https://pmc.ncbi.nlm.nih.gov/articles/PMC7285218/]
- 62. Gut microbiota and BMI throughout childhood: the role of ... [https://www.nature.com/articles/s41598-022-07176-6]
- 63. Differences in the gut Firmicutes to Bacteroidetes ratio across ... [https://bmcmicrobiol.biomedcentral.com/articles/10.1186/s12866-020-01903-7]
- 64. Challenges of growth-based microbiological methods in ... [https://link.springer.com/article/10.1007/s44395-025-00020-6]
- 65. Microbiome-active drug delivery systems (MADDS) [https://www.sciencedirect.com/science/article/pii/S0169409X25002054]
- 66. Understanding Reproducibility and Replicability - NCBI - NIH [https://www.ncbi.nlm.nih.gov/books/NBK547546/]
- 67. Method for reproducible automated bacterial cell culture and ... [https://pmc.ncbi.nlm.nih.gov/articles/PMC9462466/]
- 68. How Automation Transforms Microbial Research [https://www.moleculardevices.com/lab-notes/clone-screening/how-automation-transforms-microbial-research]
- 69. Method for reproducible automated bacterial cell culture ... [https://www.nist.gov/publications/method-reproducible-automated-bacterial-cell-culture-and-measurement]