Nutrient Flows and Microbial Succession: From Oligotroph-Copiotroph Dynamics to Biomedical Applications
This article synthesizes current research on how nutrient flows govern the succession of oligotrophic and copiotrophic microorganisms, two fundamental life strategy groups in microbial ecology.
Nutrient Flows and Microbial Succession: From Oligotroph-Copiotroph Dynamics to Biomedical Applications
Abstract
This article synthesizes current research on how nutrient flows govern the succession of oligotrophic and copiotrophic microorganisms, two fundamental life strategy groups in microbial ecology. It explores the foundational principles distinguishing these groups, from genomic traits like ribosomal RNA operon copy number to physiological strategies in nutrient uptake and growth. The piece critically reviews methodological approaches for studying these communities, including ecosystem modeling and dilution-to-extinction experiments, while addressing common troubleshooting scenarios such as cultivation obstacles and unintended selection biases. Furthermore, it examines the validation of these ecological concepts across diverse environments, from soils and forests to marine systems, and concludes with a forward-looking perspective on the implications of these dynamics for clinical microbiomes and drug development.
Oligotrophs vs. Copiotrophs: Defining the Fundamental Microbial Life Strategies Shaped by Nutrient Availability
The dichotomy between copiotrophic and oligotrophic lifestyles represents a fundamental axis of variation in microbial ecology, fundamentally shaped by trade-offs in nutrient acquisition, growth strategies, and survival mechanisms. This whitepaper synthesizes current research to elucidate the physiological and molecular bases of these contrasting ecological strategies, framed within the context of how nutrient flows govern microbial succession dynamics. We examine the mechanistic underpinnings of these lifestyles, from proteome allocation constraints and transport system trade-offs to regulatory networks that facilitate adaptation to nutrient fluctuations. The ecological implications of these dichotomous strategies are explored, including their roles in coexistence, biodiversity-ecosystem functioning relationships, and succession patterns in both terrestrial and aquatic environments. For researchers and drug development professionals, this review provides a comprehensive framework for understanding microbial community dynamics and identifies key experimental approaches and reagents for investigating these fundamental biological strategies.
Microbial life operates along a continuous spectrum of nutritional strategies, with copiotrophs and oligotrophs representing two contrasting ecological paradigms. Copiotrophs (r-strategists) thrive in nutrient-rich environments, exhibiting rapid growth rates, high metabolic activity, and a "feast-and-famine" lifestyle characterized by boom-bust population dynamics [1] [2]. In contrast, oligotrophs (K-strategists) dominate nutrient-poor environments, employing a "slow-and-steady" approach with reduced growth rates, enhanced substrate affinities, and efficient resource conservation mechanisms [1] [3]. This fundamental dichotomy arises from physiological and genomic trade-offs that optimize fitness across varying nutritional landscapes [2].
The study of these microbial lifestyles extends beyond ecological theory, with significant implications for human health and drug development. Many pathogens exhibit copiotrophic tendencies, exploiting nutrient-rich host environments during infection, while chronic infections often involve slow-growing, persistent bacteria with oligotrophic characteristics [2]. Understanding the molecular mechanisms governing these lifestyles provides crucial insights for developing novel antimicrobial strategies, particularly against persistent infections where traditional antibiotics targeting rapidly growing cells often fail [2].
Physiological and Molecular Mechanisms
Fundamental Trade-offs Shaping Microbial Lifestyles
The divergence between oligotrophic and copiotrophic strategies emerges from fundamental trade-offs between growth rate, nutrient affinity, and survival capacity:
Growth-Survival Trade-off: Experimental evidence demonstrates that Escherichia coli cultures grown under slower growth conditions prior to carbon starvation exhibit significantly reduced death rates during starvation. Cells growing at 0.1 h⁻¹ showed death rates of approximately 0.25 day⁻¹, while those growing at 0.7 h⁻¹ displayed death rates of 0.59 day⁻¹ [4]. This inverse relationship between growth rate and survival capability represents a core trade-off influencing fitness in fluctuating environments [4] [2].
Transport Efficiency Trade-off: Copiotrophs predominantly utilize phosphotransferase systems (PTS) for nutrient uptake, enabling rapid substrate translocation but with relatively low affinity (high half-saturation constants) [1]. Oligotrophs rely extensively on ATP-binding cassette (ABC) transporters with periplasmic binding proteins that achieve dramatically enhanced substrate affinities—attaining nanomolar half-saturation concentrations even with micromolar dissociation constants [1]. However, this high-affinity strategy requires substantial proteomic investment in binding proteins and large periplasms to accommodate them, creating a diffusion limitation that constrains maximum growth rates [1].
Proteomic Allocation Trade-off: Bacteria must allocate limited proteomic resources between growth-promoting functions (ribosomes, metabolic enzymes) and functions enhancing adaptability and survival (stress response proteins, transport systems) [2]. Copiotrophs maximize investment in ribosomes and growth-related functions in nutrient-rich conditions, while oligotrophs maintain significant "proteome reserve" dedicated to stress preparedness and high-affinity acquisition systems, reducing maximum potential growth rates but enhancing resilience to nutrient fluctuations [2].
Table 1: Key Functional Traits Differentiating Copiotrophs and Oligotrophs
| Trait | Copiotrophs | Oligotrophs |
|---|---|---|
| Maximal Growth Rate | High (doubling time <1 hour) [1] | Low (doubling time >5 hours) [1] |
| Nutrient Transport Systems | Dominantly PTS [1] | Dominantly ABC transporters [1] |
| Substrate Affinity | Low (high KM) [1] | High (nanomolar KM) [1] |
| Proteome Reserve | Limited [2] | Substantial [2] |
| Metabolic Flexibility | Specialized for rapid growth on preferred substrates [2] | Generalist capabilities for diverse substrates [2] |
| Starvation Survival | Poorer survival during extended starvation [4] | Enhanced long-term survival during starvation [4] |
| Typical Cell Volume | Larger (>1 μm³) [1] | Smaller (<0.1 μm³) [1] |
Regulatory Networks and Signaling Pathways
The transition between feast and famine conditions involves sophisticated regulatory mechanisms that rewire cellular metabolism:
Diagram 1: CrfA-mediated feast-to-famine transition in Caulobacter
In Caulobacter crescentus, a sophisticated RNA-based regulatory network governs the transition from feast to famine conditions. During carbon starvation, the small RNA CrfA is induced and functions as an RNA sponge to sequester a family of four homologous sRNAs (SisA-D) [5]. Under nutrient-rich conditions, Sis sRNAs post-transcriptionally repress a large regulon including genes involved in alternative nutrient metabolism and TonB-dependent receptors (TBDRs) for nutrient import [5]. CrfA-mediated neutralization of Sis sRNAs during starvation derepresses this regulon, enabling metabolic adaptation to nutrient limitation [5]. This RNA sponge mechanism represents a crucial adaptive strategy for oligotrophic bacteria navigating fluctuating nutrient environments [5].
In enteric bacteria like Escherichia coli, (p)ppGpp-mediated stringent response and cAMP-CRP catabolite repression systems coordinate proteome allocation during nutrient transitions [2]. Under nutrient upshifts, resources are directed toward ribosome synthesis and growth-related functions, while nutrient downshifts trigger increased investment in biosynthetic enzymes and stress response proteins [2]. The basal expression of these alternative functions—the "proteome reserve"—determines adaptation lag times, creating a trade-off between maximal growth rate in stable environments and adaptability to changing conditions [2].
Experimental Approaches and Methodologies
Key Research Methods for Investigating Microbial Lifestyles
Table 2: Experimental Approaches for Studying Copiotroph-Oligotroph Dynamics
| Method | Application | Key Measurements | Considerations |
|---|---|---|---|
| Chemostat Cultivation [4] | Control bacterial growth rate using nutrient-limited continuous culture | Maintenance rates, death rates during starvation, substrate affinity constants | Requires specialized equipment; enables precise control of growth conditions |
| Dilution-to-Extinction (DTE) [6] | Manipulate microbial diversity by reducing species abundance through serial dilution | Community assembly processes, functional performance, copiotroph/oligotroph ratios | May artificially select for copiotrophs due to elevated nutrient-to-biomass ratios |
| Starvation Survival Kinetics [4] | Measure population survival during carbon starvation | Death rates (CFU/ml over time), maintenance energy requirements during starvation | Requires careful standardization of pre-starvation growth conditions |
| Nutrient Uptake Assays [1] | Quantify transport kinetics of different nutrient acquisition systems | Half-saturation constants (KM), maximal uptake rates (Vmax) | Different methodological approaches needed for PTS vs. ABC transporters |
| Proteome Allocation Analysis [2] | Measure resource investment in different cellular functions | Ribosomal content, metabolic enzyme levels, stress protein expression | Requires proteomic techniques; reveals trade-offs between growth and other functions |
The Scientist's Toolkit: Essential Research Reagents
Table 3: Key Research Reagents for Microbial Lifestyle Investigations
| Reagent/Cell Line | Function/Application | Key Features |
|---|---|---|
| Caulobacter crescentus [5] | Model oligotroph for starvation response studies | Naturally adapted to oligotrophic environments; sophisticated genetic tools available |
| Escherichia coli K-12 [4] [2] | Model copiotroph for growth rate and starvation studies | Well-characterized physiology and genetics; responds strongly to nutrient shifts |
| Vibrio species [1] | Model copiotrophs for transport system studies | High growth rates; numerous PTS transporters; feast-famine lifestyle |
| SAR11 isolates [1] | Model oligotrophs for transport and efficiency studies | Extremely small genomes; high-affinity ABC transporters; dominant ocean bacterioplankton |
| 3xFLAG-Hfq strain [5] | RNA interactome studies through RIL-seq | Enables identification of Hfq-dependent sRNA-mRNA interactions and RNA sponges |
| GFP-based reporter system [5] | Validation of post-transcriptional regulation | Enables quantification of regulatory effects on specific target genes |
Detailed Experimental Protocol: Starvation Survival Kinetics
The following methodology, adapted from Schink et al. (2020), allows quantitative comparison of starvation survival between different microbial strains or growth conditions [4]:
Principle: Bacterial death rate during carbon starvation depends on pre-starvation growth conditions, with slower growth leading to reduced death rates [4].
Procedure:
- Pre-starvation cultivation: Grow bacterial cultures in media with different carbon substrates (e.g., LB, mannose, glycerol) or in carbon-limited chemostat at varying dilution rates to achieve a range of growth rates [4].
- Culture standardization: Harvest cultures during mid-exponential phase (OD₆₀₀ ≈ 0.5) to ensure consistent metabolic state [4].
- Carbon starvation initiation: Wash cells thoroughly and resuspend in carbon-free minimal medium to remove residual nutrients [4].
- Viability monitoring: Sample starved cultures at regular intervals (e.g., daily) and determine viable counts via plate counting (CFU/ml) or live/dead staining [4].
- Death rate calculation: Plot log(CFU/ml) versus time; the negative slope of the linear regression represents the death rate (γ) [4].
Maintenance Rate Determination:
- During starvation monitoring, supplement parallel cultures with small, quantified concentrations of a carbon source [4].
- Measure the duration of halted cell death following carbon supplementation [4].
- Calculate maintenance rate from the carbon concentration and the duration of death arrest [4].
Diagram 2: Starvation survival kinetics workflow
Ecological Implications and Nutrient Flow Context
The interplay between copiotrophs and oligotrophs fundamentally shapes microbial community responses to nutrient flows and environmental disturbances:
Succession Dynamics and Nutrient Cycling
Nutrient flows create predictable successional patterns in microbial communities, typically beginning with copiotroph dominance following nutrient pulses and transitioning toward oligotroph dominance as resources diminish [6] [2]. In dilution-to-extinction experiments, high dilution levels disproportionately reduce rare species while selecting for copiotrophic taxa due to elevated nutrient-to-biomass ratios, shifting community assembly from stochastic to deterministic processes [6]. This selection for copiotrophs can complicate biodiversity-ecosystem functioning relationships in experimental systems, as specialized functions carried by rare species are lost while broad functions maintained by copiotrophs persist [6].
In temperate forest ecosystems, selective logging dramatically alters nutrient flows, initiating successional shifts in nutrient limitation that influence overall ecosystem productivity [7]. Following disturbance, plant growth transitions from nitrogen limitation to phosphorus limitation over approximately 36 years of recovery, with this shift in nutrient limitation accounting for 25.6% of the variation in aboveground net primary productivity—a greater contribution than soil nutrient supply or species diversity changes [7]. These patterns demonstrate how macroscale ecosystem processes emerge from microbial-scale trophic strategies responding to altered nutrient flows.
Coexistence Mechanisms and Ecosystem Functioning
The coexistence of copiotrophs and oligotrophs within complex communities is maintained by trade-offs that create distinct niche specializations [2]. Copiotrophs exploit temporal and spatial nutrient patches, while oligotrophs persist in resource-poor backgrounds [1] [2]. This functional diversity enhances overall ecosystem stability and metabolic versatility, particularly in heterogeneous environments with fluctuating resource regimes [2].
Environmental disturbances that alter nutrient flows can disrupt this balance, with significant consequences for ecosystem functioning. The selection for copiotrophs following disturbances can simplify community functional profiles, potentially impairing specialized processes while maintaining broad functions [6]. Understanding these dynamics is crucial for predicting ecosystem responses to anthropogenic changes and developing management strategies that maintain critical microbial functions.
The conceptual dichotomy between copiotrophic and oligotrophic lifestyles represents a fundamental framework for understanding microbial community dynamics in response to nutrient flows. The trade-offs between growth rate, nutrient affinity, adaptability, and survival capacity create complementary ecological strategies that support ecosystem functioning across diverse environments. For drug development professionals, these insights are particularly valuable for understanding pathogen dynamics in host environments, where nutrient availability shifts dramatically between different tissue types and disease states.
Future research should focus on integrating molecular-level mechanisms with ecosystem-scale consequences, particularly in the context of global change factors that alter nutrient cycling. The development of novel tools for tracking nutrient flows and microbial responses in complex environments will enhance our ability to predict ecosystem outcomes under changing conditions. Furthermore, exploring the molecular basis of oligotrophic survival may yield novel targets for combating persistent bacterial infections, addressing a critical challenge in antimicrobial therapy.
This whitepaper synthesizes current research on three interconnected genomic and physiological hallmarks in microorganisms: ribosomal RNA operon (rrn) copy number, microbial growth rates, and carbon use efficiency (CUE). We examine how these traits serve as biomarkers for microbial life history strategies, distinguishing between copiotrophic and oligotrophic organisms, and how their interplay governs community succession in response to nutrient flows. The document provides a technical guide for researchers, featuring consolidated quantitative data, standardized experimental protocols, and visualization tools to support drug development and microbial ecology research.
Microbial life history strategies are fundamentally shaped by their genomic capacity for resource acquisition and utilization. The ribosomal RNA operon (rrn) copy number, a key genomic trait, correlates with an organism's potential for rapid growth and nutrient demand [8]. This trait aligns with physiological hallmarks, particularly carbon use efficiency (CUE)—the proportion of consumed carbon allocated to biomass growth versus respiration [9]. Understanding the relationship between these hallmarks is critical for predicting microbial community dynamics, especially the succession between oligotrophic (slow-growing, nutrient-scarce specialists) and copiotrophic (fast-growing, nutrient-rich specialists) strategists in response to nutrient flows [10] [11]. This whitepaper integrates these concepts to provide a framework for researchers investigating microbial ecology, bioremediation, and drug discovery.
Core Hallmarks: Definitions and Interrelationships
Ribosomal RNA Operon Copy Number
The rRNA operon (rrn) is a genetic unit containing the 5S, 16S, and 23S rRNA genes. Its copy number varies significantly across prokaryotes, from 1 to as many as 15 copies per genome [8]. This copy number is a phylogenetically conserved trait linked to an organism's ecological strategy. Bacteria with high rrn copy numbers are typically adapted to nutrient-rich conditions and exhibit fast maximum growth rates, as multiple gene copies enable rapid ribosome assembly and protein synthesis. Conversely, bacteria with low rrn copy numbers are often adapted to nutrient-poor, oligotrophic conditions and exhibit slower growth rates [11] [12].
Microbial Growth Rates
Growth rate is a fundamental physiological trait differentiating oligotrophs and copiotrophs. The Growth Rate Hypothesis (GRH) posits a positive relationship between rrn copy number, cellular phosphorus demand (for rRNA production), and growth rate [12]. However, this relationship is context-dependent; in extremely oligotrophic environments, the high phosphorus cost of maintaining multiple rrn copies can decouple this link, leading to unique physiological adaptations [12].
Carbon Use Efficiency (CUE)
Carbon use efficiency is a key physiological parameter that quantifies how microorganisms allocate organic carbon between growth (biomass production and repair) and respiration (energy production). It is calculated as: CUE = Microbial Growth / (Microbial Growth + Respiration) [9] [13] A higher CUE indicates more carbon is incorporated into microbial biomass, which can subsequently contribute to soil organic matter formation, whereas a lower CUE signifies greater carbon loss as CO₂ [9] [10]. CUE is not a fixed value but is influenced by biotic and abiotic factors, including microbial community composition and nutrient availability [13].
Quantitative Data Synthesis
The following tables consolidate key quantitative relationships from recent research to facilitate comparison and analysis.
Table 1: Relationship between rrn Copy Number, Environment, and Microbial Strategy
| Environment / Condition | Typical rrn Copy Number Range (Community-level) | Associated Microbial Strategy | Key References |
|---|---|---|---|
| Nutrient-Rich (e.g., coastal sediments, bioremediation sites) | 2.74 ± 0.06 (up to 7.61) | Copiotrophy | [11] [14] |
| Nutrient-Scarce (e.g., ocean water, oligotrophic aquatic systems) | 1.54 ± 0.01 | Oligotrophy | [11] [12] |
| Hydrocarbon-Polluted (Bioremediation) | Elevated vs. uncontaminated sites | Copiotrophy (enriched) | [14] |
| Vegetation Primary Succession (Late Stage) | Lower (inferred from community shift) | Oligotrophy | [10] |
Table 2: Carbon Use Efficiency (CUE) Values and Drivers Across Ecosystems
| Measurement Method | Typical CUE Range | Key Influencing Factors | Impact on CUE | References |
|---|---|---|---|---|
| 13C-Substrate Tracing | ~0.59 (Global mean) | Substrate Quality (e.g., simple vs. complex) | Positive with labile C (e.g., glucose) | [9] [15] [13] |
| 18O-Water Method | ~0.34 (Global mean) | Nutrient (N, P) Availability | Positive with increased availability | [9] [15] [13] |
| Stoichiometric Modelling | ~0.34 (Global mean) | Soil pH | Complex (U-shaped relationship reported) | [9] [13] |
| All Methods | Varies by Biome | Microbial Community (Oligotroph:Copiotroph ratio) | Positive with higher oligotroph ratio | [10] |
Impact of Nutrient Flows on Microbial Succession
Nutrient availability is a primary driver of microbial community composition, selecting for organisms with specific genomic and physiological traits. The paradigm, termed the "hunger games" hypothesis [11], posits that nutrient supply dictates the success of high-rrn copiotrophs versus low-rrn oligotrophs.
- High-Nutrient Conditions: An influx of nutrients (e.g., organic carbon, nitrogen, phosphorus) creates a environment favorable for copiotrophic bacteria. These organisms, characterized by high rrn copy numbers, exhibit rapid growth, high nutrient demand, and a tendency for faster C utilization, often leading to lower CUE in the initial phase of a nutrient pulse [10] [11]. This is evident in hydrocarbon-contaminated sites, where the community-level rrn copy number increases, indicating an enrichment of copiotrophs [14].
- Low-Nutrient Conditions: As nutrients become scarce, the community shifts toward oligotrophic strategists. Oligotrophs possess low rrn copy numbers, slower growth rates, and more efficient resource assimilation. They allocate more energy to resource acquisition from complex organic matter, which can lead to a higher CUE, as seen in the later stages of vegetation succession and in pristine soils [10] [15]. This strategic shift has profound implications for carbon cycling, as oligotroph-dominated communities facilitate greater carbon storage [10] [13].
This succession is further reflected in microbial network interactions. Nutrient-rich coastal sediments exhibit a much higher proportion of negative associations (inter-species co-exclusion) than nutrient-scarce ocean waters, indicating intense competition for abundant resources among copiotrophs [11].
Visualizing the Conceptual Framework of Nutrient-Driven Succession
The following diagram illustrates the logical relationship between nutrient availability, microbial hallmarks, and community succession.
Diagram Title: Nutrient Flows Drive Microbial Succession
Experimental Protocols and Methodologies
Determining rrn Copy Number
1. In Silico Estimation from Genomic Data:
- Procedure: For isolates or metagenome-assembled genomes (MAGs), identify the 16S rRNA gene sequences within the genome. Tools like
barrnaporRNAmmercan be used for annotation. The number of distinct 16S rRNA gene sequences per genome equals the rrn copy number. For community-level analysis, calculate the abundance-weighted average rrn copy number using reference databases likerrndb[8]. - Notes: This method is most accurate for complete genomes. For partial genomes or MAGs, completeness and contamination should be assessed to avoid underestimation or overestimation.
2. Experimental Determination via Southern Blotting:
- Procedure: Digest purified genomic DNA with restriction enzymes that do not cut within the rrn operon. Separate the DNA fragments via gel electrophoresis and transfer to a membrane. Hybridize the membrane with a labeled 16S rRNA gene probe. The number of distinct hybridizing bands corresponds to the rrn copy number [8].
- Notes: This is a labor-intensive but direct method for validating in silico predictions for cultured isolates.
Measuring Carbon Use Efficiency (CUE)
1. 18O-Water Labeling Method:
- Principle: This substrate-independent method estimates CUE by measuring the incorporation of 18O from labeled water into microbial DNA, which is proportional to new DNA synthesis (growth). Respiration is measured separately [9] [15].
- Workflow:
- Incubate soil samples in an atmosphere with 18O-labeled water vapor.
- Extract DNA after a defined incubation period.
- Measure 18O incorporation into DNA using isotope ratio mass spectrometry.
- Measure CO₂ evolution to determine respiration.
- Calculate CUE = Growth / (Growth + Respiration).
2. 13C-Substrate Tracing Method:
- Principle: This method tracks the fate of a labeled carbon substrate (e.g., 13C-glucose) into microbial biomass and respired CO₂ [9] [15].
- Workflow:
- Add a 13C-labeled substrate to soil or microbial culture.
- Incubate for a short period (hours to days) to prevent recycling of the label.
- Trap and measure the 13C in evolved CO₂.
- Extract and analyze microbial biomass (e.g., via chloroform fumigation-extraction or by analyzing 13C in phospholipid fatty acids).
- Calculate CUE = (13C in biomass) / (13C in biomass + 13C in respired CO₂).
Visualizing the 18O-Water CUE Measurement Workflow
Diagram Title: 18O-Water CUE Measurement Workflow
The Scientist's Toolkit: Research Reagent Solutions
Table 3: Essential Research Reagents and Materials
| Item | Function / Application | Specific Example / Note |
|---|---|---|
| 13C-labeled Substrates | Tracing carbon fate in CUE experiments. | 13C-glucose is a common labile C source; 13C-acetate or complex mixtures can also be used. |
| 18O-labeled Water | Substrate-independent measurement of microbial growth for CUE. | Used in the 18O-water method; requires isotope ratio mass spectrometry for detection. |
| DNA Restriction Enzymes | Experimental determination of rrn copy number via Southern blot. | Choose enzymes that do not cut within the rrn operon of the target organism. |
| 16S rRNA Gene Probes | Detection and quantification of rrn operons in Southern blot. | Must be designed for the specific phylogenetic group being studied. |
| Phospholipid Fatty Acid (PLFA) Extraction Kits | Extraction of microbial biomass for CUE and community structure analysis. | Allows for linking community composition (via PLFA profiles) to function (CUE). |
| Isotope Ratio Mass Spectrometer (IRMS) | High-precision measurement of stable isotopes (18O, 13C). | Essential for accurate determination of isotopic enrichment in CUE protocols. |
| rrnDB Database | Curated resource for rRNA operon copy numbers in prokaryotes. | Used for in silico estimation and community-level rrn copy number calculations [8]. |
The dichotomy between oligotrophic and copiotrophic lifestyles is a fundamental organizing principle in microbial ecology, primarily governed by divergent strategies for nutrient acquisition. Oligotrophs, exemplified by the SAR11 clade, achieve dominance in nutrient-poor environments through high-affinity ATP-binding cassette (ABC) transporters. In contrast, copiotrophs like Vibrios thrive in nutrient-rich conditions using rapid phosphotransferase system (PTS) transporters. This review provides a mechanistic analysis of these transport systems, detailing how their inherent trade-offs in affinity, efficiency, and regulatory control fundamentally shape microbial succession and global carbon cycling. We synthesize molecular-level models, genomic evidence, and experimental data to present a quantitative framework for understanding the impact of nutrient flows on oligotroph and copiotroph succession.
Microbial life is primarily constrained by nutrient availability, leading to the evolution of distinct ecological strategies. Oligotrophs are adapted to chronically low-nutrient conditions (e.g., open ocean), characterized by slow growth, small cell volumes, and high-affinity uptake systems. Copiotrophs exploit nutrient-rich patches (e.g., marine particles), exhibiting rapid growth, larger cell sizes, and high-capacity uptake systems [1]. The succession between these groups is driven by fluctuations in nutrient flux, a process critical to predicting carbon sequestration and ecosystem responses to environmental change [1] [16].
The core mechanical difference lies in their preferred transport machinery. This review dissects the operation, regulation, and ecological consequences of ABC and PTS transporters, providing researchers with the experimental and theoretical tools to study their roles in microbial community dynamics.
Mechanistic Breakdown of Primary Nutrient Uptake Systems
High-Affinity ABC Transporters: The Oligotroph's Strategy
ATP-binding Cassette (ABC) transporters are multi-component complexes that use the energy from ATP hydrolysis to import nutrients. They are the system of choice for oligotrophs like SAR11, which lack PTS systems entirely [1].
- Molecular Components: A typical ABC importer consists of (i) a periplasmic substrate-binding protein (BP), (ii) two transmembrane domains (TMDs) that form a translocation pathway, and (iii) two nucleotide-binding domains (NBDs) that bind and hydrolyze ATP [17].
- Kinetic Mechanism and the Role of Binding Proteins: The high affinity of ABC transport is not solely due to the intrinsic affinity of the binding protein but is an emergent property of the system architecture. As demonstrated by molecular-level modeling, the specific affinity of transport is proportional to the abundance of binding proteins when the BP-to-transport unit ratio is high [1]. This allows oligotrophs to achieve nanomolar half-saturation concentrations even with binding proteins that have only micromolar dissociation constants [1].
The kinetic mechanism can be summarized as a four-step process [1]:
- Binding: Substrate (S) binds reversibly to the binding protein (BP) in the periplasm to form a complex (S:BP).
- Docking: The S:BP complex binds to the membrane-bound transport unit (T).
- Translocation: ATP hydrolysis by the NBDs powers the conformational change that translocates the substrate into the cytoplasm.
- Reset: The transport unit and binding protein dissociate, resetting the system.
A Michaelis-Menten approximation of this process yields a cytoplasmic uptake rate ((v_{c,ABC})) that is a function of both transporter and binding protein abundance [1].
Rapid PTS Transport: The Copiotroph's Strategy
The Phosphoenolpyruvate:Sugar Phosphotransferase System (PTS) is a group translocation system that simultaneously transports and phosphorylates its substrate. It is a hallmark of copiotrophic bacteria like Vibrios and E. coli [1] [18].
- Molecular Components: The PTS comprises two general energy-coupling proteins, Enzyme I (EI) and histidine-containing phosphocarrier protein (HPr), and sugar-specific Enzyme II (EII) complexes. The EII complex itself often consists of cytoplasmic domains (EIIA and EIIB) and a transmembrane channel (EIIC) [18].
- Kinetic Mechanism: Phosphoryl groups are transferred from phosphoenolpyruvate (PEP) to the incoming sugar via a phosphorylation cascade: PEP → EI → HPr → EIIA → EIIB → Sugar (translocated via EIIC) This process is kinetically simpler than ABC transport and can be modeled as a two-step reaction resulting in classic Michaelis-Menten kinetics, where the uptake rate ((v{c,PTS})) depends solely on transporter abundance and the transporter's intrinsic dissociation constant ((KT)) [1].
Quantitative Comparison of Transport System Kinetics and Trade-offs
The fundamental trade-offs between the ABC and PTS strategies are evident in their kinetic parameters and physiological requirements. The table below summarizes the quantitative differences predicted by molecular models and observed experimentally.
Table 1: Quantitative Comparison of ABC and PTS Transport Characteristics
| Characteristic | ABC Transporters (Oligotrophs) | PTS (Copiotrophs) |
|---|---|---|
| Primary Energy Source | ATP hydrolysis | Phosphoenolpyruvate (PEP) |
| Half-Saturation Constant (KM) | Nanomolar range (function of BP abundance) [1] | Micromolar or higher (intrinsic to transporter) [1] |
| Maximal Uptake Rate (Vmax) | Lower (diffusion-limited by BPs) [1] | Higher (direct coupling to translocation) [1] |
| Key Molecular Feature | Periplasmic Binding Proteins (BP) | Multi-protein Phosphoryl Transfer Chain |
| Impact on Growth Rate | Precludes high growth rates [1] | Supports very high growth rates [1] |
| Representative Organisms | SAR11, Sphingopyxis alaskensis [1] | Vibrio spp., E. coli, Streptococcus mutans [1] [19] |
The critical trade-off is clear: ABC transporters enable survival under extreme nutrient limitation but inherently limit maximum growth rates, while PTS systems sacrifice affinity for speed, enabling rapid growth only when nutrients are abundant [1].
Experimental Analysis of Transport Systems
Key Methodologies for Investigating Transporter Function
Research into these transport systems relies on a combination of genomic, transcriptomic, and biochemical approaches.
- Global Transcriptional Analysis: Microarray or RNA-Seq technology can identify which transporter genes are expressed under different nutrient conditions. For example, a study on Streptococcus mutans UA159 used a whole-genome expression microarray to analyze the transcription profiles of all its sugar transporters when grown on 13 different carbohydrates [19]. This method revealed that specific PTSs were induced by their cognate sugars (e.g., fructose, lactose), while others were constitutively highly expressed, and ABC transporters were specific for oligosaccharides [19].
- Proteome Allocation Modeling: This theoretical approach models the cell's optimal investment in its proteome (e.g., transport proteins, metabolic enzymes, ribosomes) under different nutrient regimes. By modeling the costs (protein synthesis) and benefits (nutrient uptake, growth) of ABC and PTS systems, researchers can predict the optimal strategy for a given environmental nutrient concentration [1]. This has successfully explained why investing in large amounts of slow-diffusing binding proteins is only advantageous at extremely low nutrient levels [1].
- Kinetic Assays in Membrane Vesicles and Proteoliposomes: The function of purified transporters can be studied in isolation by reconstituting them into artificial liposomes. This approach was used to demonstrate that the maltose and histidine ABC importers of E. coli and S. enterica directly couple ATP hydrolysis to transport [17]. Similarly, kinetic parameters (KM, Vmax) can be determined using isolated membrane vesicles.
The Scientist's Toolkit: Essential Research Reagents
Table 2: Key Reagents and Materials for Transport System Research
| Research Reagent / Method | Function in Experimental Protocol |
|---|---|
| Whole-Genome Microarray / RNA-Seq | Profiling global transcription of all transporter genes simultaneously in response to different nutrient sources [19]. |
| Defined Growth Medium (e.g., FMC) | Precisely control nutrient availability and composition to study transporter induction and function without confounding variables from complex media [19]. |
| Membrane Vesicles / Proteoliposomes | Isolate the transport process from cellular metabolism to directly measure uptake rates and energy coupling (ATP hydrolysis) [17]. |
| Radiolabeled Substrates (e.g., ¹⁴C-sugars) | Trace the uptake and accumulation of specific nutrients with high sensitivity in kinetic assays. |
| Heterologous Expression Systems (e.g., E. coli) | Express and purify specific transporter components from uncultivable organisms (like many oligotrophs) for functional characterization. |
Ecological and Evolutionary Implications for Microbial Succession
The trade-offs between ABC and PTS systems have profound consequences for microbial ecology and succession.
- Nutrient Flows Dictate Community Structure: The model of nutrient uptake explains the observed dichotomy in marine environments. In the low-nutrient open ocean, oligotrophs with ABC transporters efficiently scavenge nutrients, achieving high biomass but low turnover. During a nutrient pulse (e.g., from a phytoplankton bloom or particle input), fast-growing copiotrophs with PTS systems rapidly outcompete oligotrophs, leading to a successional shift [1]. As the patch is depleted, oligotrophs regain dominance. This succession is a direct result of the kinetic properties of their transport systems.
- Evolutionary Trade-offs and the "Tragedy of the Commons": Evolutionary models incorporating a trade-off between nutrient uptake capacity and mortality (e.g., due to lower investment in defense) show that adaptation does not necessarily maximize ecosystem biomass or productivity [16]. In some scenarios, natural selection can lead to overconsumption and reduced resource levels, akin to a "tragedy of the commons," supporting Tilman's R* rule, which predicts that the species that can survive at the lowest equilibrium resource level (R) will be selected [16]. Oligotrophs, with their low R conferred by ABC transporters, are the ultimate outcome of this rule in stable, low-nutrient environments.
- Regulatory Integration and Metabolic Balance: The PTS is deeply integrated into the global regulatory network in copiotrophs. In E. coli, the PTS component IIAGlc regulates non-PTS sugar uptake and adenylate cyclase, mediating catabolite repression [18]. This allows the cell to prioritize the uptake of preferred sugars. In contrast, the ability of ABC transporters to achieve high affinity while closely matching metabolic capacity makes severe metabolic imbalances less likely in oligotrophs, which may explain the toxicity of high-nutrient conditions to specialists like SAR11 [1].
The divergence between high-affinity ABC transporters and high-capacity PTS systems represents a foundational evolutionary trade-off that structures microbial communities globally. Oligotrophs, exemplified by SAR11, are optimized for nutrient retention and persistence, while copiotrophs, like Vibrios, are optimized for rapid resource exploitation. Their succession is a direct manifestation of nutrient flows, governed by the kinetic and biochemical constraints of their transport machinery.
Future research will benefit from further integrating molecular-level transport models with ecosystem-scale biogeochemical models. Key challenges include elucidating the full diversity of transporters in uncultivated microbial lineages and understanding how these principles apply to other limiting nutrients, such as phosphorus and iron, whose uptake also involves complex trade-offs. For drug development professionals, a deeper understanding of these essential bacterial nutrient uptake systems continues to offer potential targets for novel antimicrobial strategies, particularly as resistance to conventional antibiotics spreads.
The overwhelming taxonomic diversity of soil and aquatic microorganisms can be effectively simplified through a life-history classification strategy that categorizes microbes into ecologically coherent units based on their reproductive and survival strategies [20]. This framework establishes a fundamental dichotomy between two primary ecological strategies: copiotrophy and oligotrophy. Copiotrophic organisms are characterized by rapid growth rates and a reliance on resource availability, thriving in nutrient-rich environments through a "feast-or-famine" lifestyle. In contrast, oligotrophic organisms grow more slowly but excel at efficiently exploiting limited resources, maintaining population stability in nutrient-poor environments [20] [21]. This life-history classification represents a fundamental trade-off between growth rate and resource use efficiency, enabling researchers to directly link microbial performance to environmental conditions [20].
The genomic underpinnings of these contrasting ecological strategies involve several key traits. Copiotrophic bacteria typically possess higher ribosomal RNA (rRNA) gene copy numbers, which supports the increased ribosomal content required for rapid growth responses to nutrient pulses [20]. They also exhibit greater codon usage bias in ribosomal genes, reflecting translational selection that enhances protein synthesis efficiency during rapid growth phases [20]. These genomic features collectively enable the higher maximum growth rates that characterize copiotrophic response to nutrient availability. The trade-off for this rapid growth capability is reduced efficiency in resource-limited environments, where oligotrophs with their minimalistic cellular economies and high-affinity uptake systems demonstrate superior competitive abilities [1].
Mechanistic Basis of Microbial Life History Strategies
Physiological and Molecular Determinants
The divergent strategies of copiotrophs and oligotrophs emerge from fundamental differences in their cellular architecture and metabolic priorities, particularly in their nutrient transport systems and energy allocation patterns.
Transport System Trade-offs: Copiotrophs predominantly utilize phosphotransferase systems (PTS) for sugar uptake, which provide rapid substrate translocation but with relatively lower affinity. Oligotrophs rely extensively on ATP-binding cassette (ABC) transporters that employ substrate-binding proteins, enabling them to achieve dramatically higher nutrient affinities. Modeling demonstrates that ABC transport allows independent tuning of affinity and maximal uptake rate, with oligotrophs capable of attaining half-saturation concentrations over a thousand-fold smaller than their binding protein's dissociation constant [1]. However, this high-affinity strategy requires large periplasms and high abundances of slowly diffusing binding proteins, which inherently constrains growth rates and represents a fundamental trade-off that shapes lifestyle specialization [1].
Metabolic Efficiency Strategies: Under resource-limited conditions, selection strongly favors microbes that maximize progeny produced per unit of resource consumed, a trait quantified as carbon use efficiency (CUE) [21]. Oligotrophs exhibit physiological adaptations that enhance efficiency in low-nutrient environments, including phospholipid substitution (replacing PO₄-bearing membrane lipids with non-phosphorous alternatives) and substantial intracellular carbon storage allocation [22]. These strategies simultaneously lower cellular phosphorus demand while increasing cellular carbon reserves, effectively increasing biomass C/P ratios in a manner analogous to the "sclerophylly" observed in vegetation adapted to infertile soils [22].
Ecological Drivers of Community Succession
Nutrient pulses trigger predictable successional patterns in microbial communities through shifts in the relative dominance of copiotrophic and oligotrophic strategies. These dynamics are governed by the interaction between resource availability and microbial life history traits.
Resource Flux and Spatial Heterogeneity: Mathematical simulations and experimental studies demonstrate that efficient growth (a hallmark of oligotrophs) is favored over rapid growth when resource flux is low and spatial heterogeneity is high [21]. Under these conditions, competition is effectively privatized to individuals, shifting the cost of inefficient resource use from the community to the individual. In contrast, high resource flux in homogeneous environments favors rapidly growing copiotrophs [21].
Community Assembly Processes: The transition from copiotroph to oligotroph dominance following a nutrient pulse involves shifting contributions of stochastic and deterministic processes to community assembly. During the initial response phase, deterministic processes dominate as copiotrophic taxa with specific trait advantages are selectively enriched [6]. As resources decline, the community assembly becomes increasingly influenced by stochastic processes, particularly through the actions of rare species that persist at low abundances [6].
Quantitative Trait Differentiation Across Nutrient Gradients
Empirical studies across diverse ecosystems have quantified distinct trait values between copiotrophic and oligotrophic microbial communities, revealing consistent patterns in genomic features and physiological capabilities.
Table 1: Comparative Genomic and Physiological Traits of Microbial Life History Strategies
| Trait | Copiotrophs | Oligotrophs | Measurement Approach | Experimental Context |
|---|---|---|---|---|
| 16S rRNA copy number | Higher | Lower | Metagenomic prediction | Sonoran Desert soils [20] |
| Codon usage bias (ENC') | Greater | Lesser | Ribosomal gene analysis | Sonoran Desert soils [20] |
| Predicted max growth rate | Faster | Slower | Codon usage models | Sonoran Desert soils [20] |
| Transport system affinity | Lower (PTS) | Higher (ABC) | Kinetic modeling | Marine bacteria [1] |
| Half-saturation constant | Micromolar-millimolar | Nanomolar | Transport assays | Marine bacteria [1] |
| Carbon Use Efficiency | Variable | Higher in low nutrients | Stoichiometric modeling | Ecosystem development [21] |
| Membrane lipid composition | Phospholipids dominant | Non-P lipids increased | Lipidomics | Cooloola chronosequence [22] |
| Unannotated genes in community | Fewer | More (novel functions) | Metagenomic annotation | Sonoran Desert soils [20] |
Table 2: Community-Level Responses to Nutrient Manipulation in Experimental Systems
| Ecosystem Type | Nutrient Treatment | Copiotroph Response | Oligotroph Response | Methodological Approach |
|---|---|---|---|---|
| Arid soil ecosystems | Vegetated (high C) vs. bare (low C) | 16S rRNA copy number: Higher | 16S rRNA copy number: Lower | Metagenomic trait prediction [20] |
| Lake microcosms | Dilution-to-extinction | Selected at high dilution | Lost at high dilution | rrn copy number analysis [6] |
| Aquatic microcosms | Nutrient enrichment | Specialization decrease | Specialization increase | DOM-bacteria networks [23] |
| Agricultural soils | Particle size fractions | Dominant in sand fractions | Dominant in clay fractions | SOC bioavailability assays [24] |
| Marine systems | Carbon availability | Dominant in rich conditions | Dominant in poor conditions | Transport modeling [1] |
Experimental Approaches and Methodologies
Field Sampling and Microcosm Experiments
Investigating microbial successional dynamics requires integrated approaches combining field observations with controlled manipulative experiments.
Natural Gradient Studies: Research in the Sonoran Desert employed a spatially explicit sampling design comparing soils from vegetated areas (relative copiotrophic conditions) with adjacent bare grounds (oligotrophic conditions) across a 77km transect. This approach quantified life history traits from metagenomic data, including average 16S rRNA gene copy number, codon usage bias in ribosomal genes, and predicted maximum growth rates [20]. Metagenomic assembly and annotation pipelines identified non-redundant gene catalogs, revealing that oligotrophic microbial communities harbored a higher proportion of genes unannotated in public reference databases, suggesting a rich source of novel functions [20].
Dilution-to-Extinction Experiments: This approach manipulates microbial diversity through serial dilution to reduce species abundance and eliminate rare taxa. A typical protocol involves: (1) collecting original microbial communities from natural environments (e.g., bacterioplankton from lake surfaces); (2) removing microeukaryotes larger than 0.8µm through sequential filtration; (3) preparing a 5-step dilution gradient with a dilution factor of 1:10; (4) incubating diluted communities in sterilized native medium under controlled conditions; and (5) sampling for molecular analysis after a regrowth period [6]. This method demonstrates that higher dilution levels selectively favor copiotrophs due to reduced competition and relatively higher nutrient availability per cell, fundamentally shifting community assembly processes [6].
Molecular and Analytical Techniques
Metagenomic Trait Prediction: Computational approaches estimate community-weighted traits from sequence data. The workflow includes: (1) quality trimming of raw reads; (2) de novo assembly of contigs; (3) gene prediction on assembled contigs; (4) functional annotation against reference databases (KEGG, eggNOG); (5) estimation of 16S rRNA copy number through coverage analysis of single-copy marker genes; and (6) prediction of maximum growth rates from codon usage bias patterns in ribosomal proteins [20].
Metabolomic and Lipidomic Profiling: Advanced mass spectrometry techniques (e.g., FT-ICR MS) characterize microbial physiological responses to nutrient scarcity. In the Cooloola chronosequence study, researchers quantified: (1) phospholipid substitution by tracking the ratio of non-phosphorus betaine lipids to phospholipids; (2) intracellular carbon storage compounds (triacylglycerols, polyhydroxybutyrate); and (3) elemental stoichiometry of microbial biomass. These measurements revealed how microbial physiology conserves phosphorus across long-term ecosystem development [22].
The Scientist's Toolkit: Essential Research Reagents and Methodologies
Table 3: Essential Research Reagents and Analytical Tools for Microbial Succession Studies
| Reagent/Technique | Function/Application | Experimental Context |
|---|---|---|
| FastDNA SPIN for Soil Kit | High-yield DNA extraction from diverse soil types | Sonoran Desert soils [20] |
| DADA2 pipeline | 16S rRNA amplicon sequence variant analysis | Lake microcosm studies [6] |
| Megahit assembler | De novo metagenomic assembly from complex communities | Metagenomic trait prediction [20] |
| Prodigal | Protein-coding gene prediction from metagenomic contigs | Functional annotation [20] |
| GhostKOALA/eggNOG-mapper | Functional annotation of genes against KEGG/eggNOG | Metabolic pathway analysis [20] |
| FT-ICR MS | Ultrahigh-resolution characterization of DOM molecules | DOM-microbe network analysis [23] |
| PLFA/NLFA analysis | Microbial lipid profiling for community structure & physiology | Phosphorus conservation studies [22] |
| Bray-2 extractant | Phosphorus availability assessment in soils | Ecosystem development chronosequence [22] |
| rrnDB database | Ribosomal RNA copy number prediction from taxonomy | Life history classification [6] |
Implications for Ecosystem Function and Anthropogenic Impacts
The successional dynamics between copiotrophic and oligotrophic microorganisms have profound implications for ecosystem functioning and biogeochemical cycling. Research demonstrates that these microbial transitions directly influence carbon sequestration, nutrient retention, and organic matter turnover across diverse ecosystems.
In terrestrial environments, the shift toward oligotrophic dominance during ecosystem development enhances phosphorus conservation through physiological strategies that reduce cellular P demand and increase intracellular carbon storage [22]. This microbial "sclerophylly" mirrors patterns observed in plant communities adapted to nutrient-poor soils and contributes to the stability of soil organic carbon pools. In agricultural contexts, soil physical structure creates distinct habitats that select for different microbial strategies, with copiotrophic bacteria dominating in sand fractions with higher SOC bioavailability and oligotrophic bacteria prevailing in clay fractions with reduced nutrient accessibility [24].
The specialized metabolic capabilities of oligotrophic communities also represent a rich source of novel biological functions with potential biotechnological applications. Metagenomic analyses reveal that oligotrophic microbial communities harbor a significantly higher proportion of genes unannotated in reference databases [20], suggesting extensive untapped genetic potential that could inform drug discovery and industrial enzyme development. This genetic novelty reflects the adaptive capacity of microorganisms persisting in resource-limited environments and highlights the value of studying microbial communities across nutrient gradients.
Tools and Techniques: Modeling, 'Dilution-to-Extinction,' and Tracking Microbial Succession in Complex Ecosystems
Integrating Microbial Community Data into Ecosystem Models (e.g., MIMICS) for Predictive Power
The integration of microbial community data into process-based ecosystem models represents a paradigm shift in ecological forecasting, enhancing our ability to predict ecosystem responses to environmental change. Microbial communities govern fundamental biogeochemical processes, yet their dynamics have historically been underrepresented in ecosystem models due to methodological limitations and conceptual gaps. The MIcrobial-MIneral Carbon Stabilization (MIMICS) model exemplifies this advancement by explicitly incorporating microbial functional traits to simulate litter decomposition and soil carbon formation [25]. This integration is particularly crucial for understanding the impact of nutrient flows on oligotroph and copiotroph succession, as these life history strategies respond differentially to nutrient availability and environmental stressors [11] [6]. The functional composition of microbial communities—represented by traits such as ribosomal RNA operon (rrn) copy number—serves as a biological indicator of ecosystem processes, enabling more accurate parameterization of models under changing climate conditions [11] [25]. This technical guide examines current methodologies, data integration frameworks, and experimental protocols for leveraging microbial community data to enhance the predictive power of ecosystem models within the context of nutrient cycling and microbial succession dynamics.
Theoretical Foundation: Microbial Life History Strategies and Nutrient Dynamics
Copiotroph-Oligotroph Dynamics in Nutrient Gradients
Microbial taxa exist along a continuum of life history strategies, with copiotrophs and oligotrophs representing contrasting ecological adaptations. Copiotrophs are characterized by rapid growth under high nutrient conditions, typically possessing high rrn copy numbers in their genomes, which facilitates efficient protein synthesis and resource exploitation when nutrients are abundant [6]. In contrast, oligotrophs exhibit slower growth rates but superior nutrient acquisition and retention capabilities under scarce nutrient conditions, typically featuring low rrn copy numbers [6]. This fundamental tradeoff between growth rate and nutrient efficiency governs microbial community succession and ecosystem functioning across nutrient gradients.
The distribution of these functional groups follows predictable patterns based on nutrient availability. Research on marine bacterial communities demonstrates that the relationship between species abundance and rrn copy number reverses along nutrient gradients [11]. In nutrient-rich coastal sediments, copiotrophs with high rrn copy numbers dominate the abundant biosphere, while oligotrophs with low rrn copy numbers are disproportionately represented in the rare biosphere [11]. Conversely, in nutrient-scarce pelagic zones, this pattern is inverted, with oligotrophs predominating in abundant populations [11]. This divergence highlights how nutrient regimes determine the selective advantages of different microbial strategies, with implications for their representation in ecosystem models.
Conceptual Framework for Microbial Community Assembly
The integration of microbial data into ecosystem models requires understanding the community assembly processes that shape functional composition. Both deterministic processes (e.g., nutrient selection) and stochastic processes (e.g., probabilistic dispersal) interact to structure microbial communities [6]. The relative importance of these processes shifts along disturbance and nutrient gradients, influencing the predictability of community outcomes.
Dilution-to-extinction experiments demonstrate that high dilution levels (reducing microbial abundance) selectively favor copiotrophic taxa due to reduced competition and relatively high nutrient availability [6]. This manipulation mimics natural disturbances and nutrient pulses, revealing how community assembly rules govern functional composition. As dilution increases, stochastic processes initially dominate due to the high number of rare species, but deterministic selection becomes stronger at higher dilution levels as copiotrophs dominate the regrowing community [6]. This conceptual framework provides a mechanistic basis for modeling microbial responses to environmental change.
Table 1: Microbial Functional Groups and Their Characteristics in Relation to Nutrient Availability
| Functional Group | Growth Strategy | Typical rrn Copy Number | Nutrient Preference | Competitive Advantage |
|---|---|---|---|---|
| Copiotrophs | Fast-growing, resource-acquisitive | High (e.g., 5-11 copies) | Nutrient-rich conditions | Rapid growth under high resource availability |
| Oligotrophs | Slow-growing, resource-conservative | Low (e.g., 1-4 copies) | Nutrient-scarce conditions | Efficient nutrient scavenging and retention |
| SAR11 (Ocean Example) | Extreme oligotroph | 1 copy | Oligotrophic waters | Minimal genome and cell size for reduced nutrient requirements |
Methodological Approaches: From Microbial Data to Model Parameterization
Generating Microbial Community Data: 16S rRNA Gene Sequencing
The foundation for microbial data integration begins with robust characterization of community composition through 16S ribosomal RNA (rRNA) gene sequencing [26]. This targeted amplicon sequencing approach remains widely used due to its cost-effectiveness compared to whole-genome sequencing. The methodological workflow involves several critical steps:
Primer Selection and Amplification: Conserved regions flanking hypervariable regions of the 16S rRNA gene serve as binding sites for primers during amplification. Primer choice is crucial for taxonomic resolution and coverage [26]. Computational tools like SPYDER [27] or mopo16S [26] facilitate primer optimization.
Sequencing and Quality Control: Next-Generation Sequencing platforms (e.g., Illumina, Ion Torrent) generate millions of short reads that are subsequently denoised and quality-filtered using tools like QIIME2 [6], Mothur [28], or USEARCH [29] to discard low-quality sequences [26].
Sequence Variant Clustering: Processed sequences are clustered into Operational Taxonomic Units (OTUs) or higher-resolution Amplicon Sequence Variants (ASVs). ASV methods infer biological sequences using error models and can distinguish variants differing by as little as one nucleotide without arbitrary dissimilarity thresholds [26].
Taxonomic Assignment and Functional Inference: The final output is an OTU/ASV table containing abundance data for each taxonomic unit across samples [26]. For functional inference, rrn copy numbers are estimated for each OTU using databases like rrnDB [30] [11], enabling calculation of community-weighted functional traits.
Estimating Functional Traits: rrn Copy Number as a Growth Strategy Proxy
The ribosomal RNA operon (rrn) copy number serves as a genomic predictor of microbial growth strategies and nutrient demands [11] [6]. This phylogenetically conserved trait correlates with maximum growth rate and nutrient utilization efficiency, providing a functional link between community composition and ecosystem processes [11]. The estimation protocol involves:
Taxon-Based rrn Copy Number Assignment: Using the rrnDB database, each OTU is assigned an average rrn copy number based on its taxonomic classification [6]. If child-taxon information is unavailable, values from parent taxa are applied.
Community-Level Metric Calculation: The community-level rrn copy number is computed as an abundance-weighted average across all community members, reflecting the dominant growth strategies in a given environment [11].
Validation with Environmental Nutrients: Statistical correlations between community-level rrn copy numbers and environmental nutrient concentrations (e.g., nitrogen, phosphorus) confirm the functional relevance of this trait across ecosystems [11].
Table 2: Correlation Patterns Between Community-Level rrn Copy Number and Nutrient Availability Across Ecosystems
| Ecosystem Type | Sample Location | Community-Level rrn Copy Number (Mean ± SE) | Correlation with Nitrogen | Correlation with Phosphorus |
|---|---|---|---|---|
| Coastal Sediment (Nutrient-Rich) | Mission Bay | 3.52 ± 0.25 | Strong positive (r = 0.782, P < 0.01) | Strong positive (r = 0.743, P < 0.01) |
| Coastal Sediment (Nutrient-Rich) | Hangzhou Bay | 3.18 ± 0.17 | Strong positive (r = 0.701, P < 0.01) | Strong positive (r = 0.665, P < 0.01) |
| Ocean Water (Nutrient-Scarce) | Global Ocean (Surface) | 1.54 ± 0.01 | Moderate positive (r = 0.410, P < 0.013) | Moderate positive (r = 0.452, P < 0.01) |
Experimental Manipulations: Dilution-to-Extinction Approaches
Dilution-to-extinction (DTE) experiments provide a powerful methodological framework for manipulating microbial diversity and examining biodiversity-ecosystem functioning relationships [6]. The experimental protocol involves:
Sample Collection and Pre-treatment: Natural microbial communities are collected from environmental samples (e.g., lake water, soil). For bacterioplankton studies, microeukaryotes larger than 0.8µm are excluded through sequential filtration to remove predators that selectively consume certain bacterial taxa [6].
Dilution Series Preparation: A multi-step dilution gradient with a dilution factor of 1:10 is prepared, typically yielding 5-6 diversity levels plus a sterile control. This dramatically reduces microbial abundance and eliminates rare species at higher dilution levels [6].
Regrowth Phase: Diluted communities are incubated in sterilized native medium (e.g., autoclaved lake water) under controlled conditions. Bottles are shaken regularly for oxygenation and randomly repositioned to minimize positional effects [6].
Sampling and Analysis: Cell density is monitored throughout incubation. After a predetermined period (e.g., 8 days), samples are collected for DNA extraction and sequencing. Community composition, rrn copy number, and functional performance are assessed across dilution treatments [6].
DTE experiments demonstrate that higher dilution levels favor copiotrophs with high rrn copy numbers, shifting community assembly from stochastic to deterministic processes [6]. These manipulations reveal how nutrient availability and disturbance regimes shape microbial functional composition, providing empirical data for model parameterization.
Model Integration: From Microbial Data to Ecosystem Forecasting
The MIMICS Model Framework
The MIcrobial-MIneral Carbon Stabilization (MIMICS) model represents a significant advancement in integrating microbial community data into ecosystem-scale predictions [25]. Unlike conventional decomposition models that represent organic matter dynamics through first-order kinetics, MIMICS explicitly incorporates microbial physiological traits and community composition to simulate carbon cycling.
The model parameterization using microbial community data involves:
Representation of Microbial Functional Groups: MIMICS classifies microbes into copiotrophic and oligotrophic functional types based on growth characteristics and substrate affinities [25]. This dichotomy aligns with empirical observations of rrn copy number distributions across nutrient gradients [11].
Calibration with Empirical Data: The model is calibrated to observed decomposition rates and their drivers, including the copiotroph-to-oligotroph ratio derived from community sequencing data [25]. This calibration to mechanistic drivers rather than solely to rate measurements improves the underlying ecological dynamics.
Validation Under Climate Change Scenarios: The calibrated model is validated against independent decomposition data and used to project responses under climate change scenarios (e.g., SSP 3-7.0) [25]. This approach reveals how microbial mediation influences ecosystem-scale carbon fluxes.
Network Inference for Microbial Interactions
Understanding species interactions is crucial for predicting community dynamics under environmental change. Network inference approaches reconstruct interaction networks from microbial abundance data using methods from network theory [26]. Key methodologies include:
Correlation-Based Approaches: Statistical correlations (e.g., SparCC, SPIEC-EASI) identify co-occurrence patterns that suggest potential ecological interactions [26] [31]. Random Matrix Theory (RMT)-based association networks can identify non-random assembly patterns in complex microbial communities [11].
Model-Based Inference: Techniques like Generalized Lotka-Volterra (gLV) models, Gaussian Processes (GP), and Vector Autoregression (VAR) infer interaction strengths from time-series data [31] [27]. The MIMIC Python package integrates multiple mathematical approaches for inferring microbial interactions from empirical data [27].
Metabolic Modeling: Constraint-based reconstruction and analysis (COBRA) approaches generate genome-scale metabolic models to predict cross-feeding interactions and metabolic dependencies among community members [31].
Network analyses reveal that negative associations (suggesting competition or co-exclusion) are more prevalent in nutrient-rich coastal sediments (14.38-80.35% of associations) compared to nutrient-scarce ocean water (0.04%) [11]. This pattern reflects how nutrient availability modulates interaction types and strengths within microbial communities.
The MIMIC Python Package for Microbial Community Analysis
The Modelling and Inference of MICrobiomes (MIMIC) project provides a comprehensive Python package for simulating, modeling, and predicting microbial community interactions and dynamics [30] [27]. This computational toolkit implements:
Multiple Modeling Approaches: Integration of gLV, GP, VAR, and novel models for multi-omic data analysis [27].
Bayesian Inference: Probabilistic estimation of model parameters and interaction strengths from empirical data [27].
Machine Learning Techniques: Prediction of community dynamics and responses to perturbations [27].
Community Design Tools: In silico design of microbial communities with desired functional properties [27].
MIMIC enhances the integration of microbial data into predictive models by providing a flexible framework for analyzing complex community dynamics, enabling researchers to bridge empirical measurements and ecosystem-scale predictions.
Experimental Workflows and Visualization
Integrated Workflow for Microbial Data Integration into Ecosystem Models
The following diagram illustrates the comprehensive workflow from empirical data collection to ecosystem model prediction, highlighting the key steps in integrating microbial community information:
Nutrient Regulation of Microbial Interaction Networks
The diagram below illustrates how nutrient availability shapes microbial community structure and interaction networks, influencing the integration of these data into ecosystem models:
Table 3: Research Reagent Solutions for Microbial Community Analysis and Modeling
| Category | Item/Resource | Function/Application | Example Tools/Protocols |
|---|---|---|---|
| Sequencing & Bioinformatics | 16S rRNA Primers | Amplification of target gene regions for community profiling | 515F/806R, SPYDER for optimization [26] [6] |
| Bioinformatic Pipelines | Processing raw sequencing data into OTU/ASV tables | QIIME2 [6], Mothur [28], USEARCH [29] | |
| Functional Trait Analysis | rrnDB Database | Reference database for rrn copy number estimation | Taxonomic assignment of growth strategy proxies [11] [6] |
| Phylogenetic Markers | Inferring functional traits from phylogenetic information | RDP classifier [30], SILVA database | |
| Experimental Manipulation | Dilution-to-Extinction | Biodiversity manipulation for BEF studies | Creating diversity gradients to test function [6] |
| Sterile Media | Regrowth medium for community experiments | Autoclaved environmental samples [6] | |
| Computational Modeling | MIMIC Python Package | Simulating and predicting microbial community dynamics | gLV, VAR, Gaussian Process models [27] |
| MIMICS Model | Ecosystem-scale decomposition forecasting | Integrating copiotroph:oligotroph ratios [25] | |
| Network Analysis | Correlation Algorithms | Inferring microbial co-occurrence networks | SparCC, SPIEC-EASI, Random Matrix Theory [26] [11] |
| Metabolic Modeling | Predicting metabolic interactions and cross-feeding | COBRA, genome-scale reconstructions [31] |
The integration of microbial community data into ecosystem models represents a transformative approach for predicting ecosystem responses to environmental change. By parameterizing models like MIMICS with empirical measurements of microbial functional traits—particularly the copiotroph-to-oligotroph ratio inferred from rrn copy number distributions—researchers can enhance the mechanistic basis and predictive accuracy of ecological forecasts [11] [25]. This integration reveals how nutrient flows regulate microbial succession and ecosystem processes, with implications for carbon cycling, climate feedbacks, and ecosystem management.
Methodological advances in 16S rRNA sequencing, functional trait inference, network analysis, and process-based modeling have created unprecedented opportunities to bridge microbial ecology and ecosystem science [26] [31] [27]. Experimental manipulations like dilution-to-extinction provide mechanistic insights into how biodiversity loss affects ecosystem functioning, informing model structure and parameterization [6]. As these approaches mature, the seamless integration of microbial community data into ecosystem models will become standard practice, advancing our fundamental understanding of ecological dynamics and enhancing our capacity to forecast ecosystem responses to global change.
Leveraging the rrn Copy Number as a Genomic Proxy for Community-Level Life History Strategies
In microbial ecology, the ribosomal RNA operon (rrn) copy number has emerged as a powerful, genome-based predictor for classifying bacterial life history strategies along the copiotroph-oligotroph spectrum [32] [33]. Copiotrophic organisms, typically characterized by higher rrn copy numbers, are adapted to nutrient-rich conditions and exhibit rapid growth rates, whereas oligotrophic organisms, with lower rrn copy numbers, thrive in nutrient-poor environments and prioritize metabolic efficiency over rapid growth [34] [35]. This genomic trait provides a foundational metric for moving beyond taxonomic classification to predict the functional traits of microbial communities and their successional dynamics in response to nutrient flows.
The central thesis of this guide is that nutrient availability acts as a primary selective force shaping microbial communities, and the rrn copy number serves as a robust, quantifiable proxy for tracking the resulting successional patterns. By integrating this genomic trait into ecological models and experimental frameworks, researchers can bridge the gap between microbial community composition and ecosystem function, ultimately enhancing predictions of carbon cycling and ecosystem responses to environmental change [36] [37].
Theoretical Foundation: From Genomic Traits to Ecological Strategies
Conceptual Frameworks and Ecological Definitions
The application of life history theory to microbes often involves mapping ecological strategies onto a genomic framework. Several key concepts are integral to this approach:
- Oligotrophic-Copiotrophic Spectrum: This spectrum describes a fundamental trade-off in bacterial resource acquisition and growth. Oligotrophs are slow-growing, efficient species adapted to low-nutrient environments, while copiotrophs are fast-growing species that rapidly exploit nutrient-rich conditions [32] [35].
- CSR/YAS Schema: Originally developed in plant ecology, the Competitor-Stress tolerator-Ruderal (CSR) framework has been adapted for microbes as the Yield-Acquisition-Stress tolerator (YAS) schema. "Competitors" or "Acquisition" strategists (often copiotrophs) dominate in resource-rich habitats, "Stress-tolerators" persist in low-nutrient or extreme conditions (often oligotrophs), and "Ruderals" thrive in high-disturbance environments [32].
- Resistance-Resilience Framework: Microbial traits can also be understood through their contribution to community stability. Resistance is the ability to withstand disturbance, often associated with stress-tolerant oligotrophs, while resilience is the capacity to recover after a disturbance, a trait often linked to fast-growing copiotrophs [32].
The rrn copy number provides a genomic anchor for these conceptual frameworks, linking abstract ecological strategies to a measurable, genomic trait.
The Underlying Genomic Trait: WhyrrnCopy Number is a Powerful Proxy
The rrn copy number is a phylogenetically conserved genomic trait that correlates with an organism's maximum potential growth rate and nutrient demand [38] [33]. The physiological rationale is that a higher number of rRNA operons allows for more ribosomes to be synthesized simultaneously, facilitating rapid protein production and cell division when resources are abundant [11]. However, this capability comes with trade-offs, including higher ribosomal maintenance costs and typically lower nutrient utilization efficiency compared to organisms with fewer rrn copies [33] [35].
This fundamental trade-off between growth rate and efficiency makes the rrn copy number a key indicator of an organism's life history strategy. The following conceptual diagram illustrates how this genomic trait is linked to ecological strategy and environmental drivers:
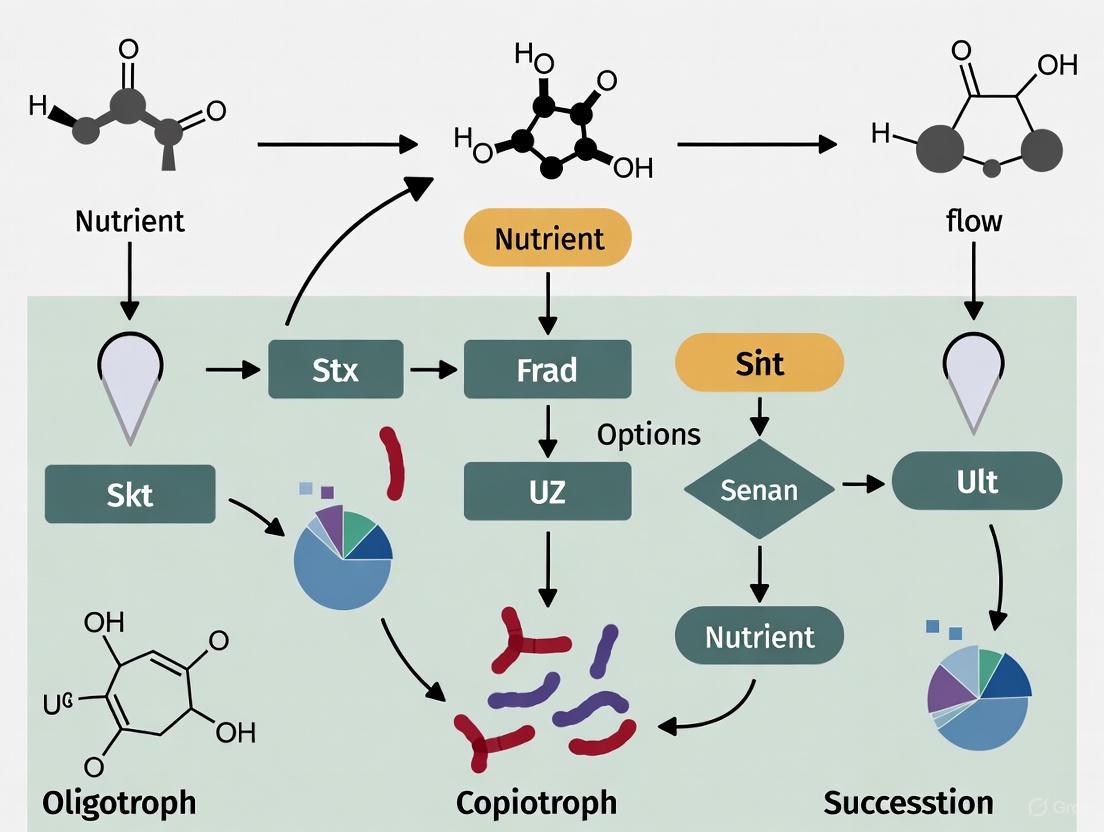
Figure 1: Conceptual model linking environmental conditions to genomic traits, ecological strategies, and ecosystem outcomes. The copiotrophic (top) and oligotrophic (bottom) pathways represent contrasting life history strategies tied to the rrn copy number.
Methodological Guide: Quantifying and Applying therrnCopy Number
Core Experimental Workflows
Integrating rrn copy number analysis into microbial ecology research involves a sequence of methodological steps, from sample collection to data interpretation. The workflow below outlines the two primary approaches: community-level profiling and isolate-based characterization.
Figure 2: Experimental workflows for community-level (top) and isolate-based (bottom) approaches to leveraging rrn copy number as a life history proxy. Dashed lines indicate integrative steps.
Key Reagents and Computational Tools
Table 1: Essential Research Reagents and Tools for rrn-Based Life History Studies
| Category/Item | Specific Examples & Details | Primary Function in Research |
|---|---|---|
| Sample Collection | Soil corers, filtration systems (0.2 µm filters), sterile containers | Obtain microbial biomass from environmental samples while preserving community structure [33] [35]. |
| DNA Extraction Kits | FastDNA Spin Kit for Soil, Mo Bio PowerSoil kits | Lyse diverse microbial cells and extract high-quality, PCR-amplifiable DNA from complex matrices [35]. |
| Sequencing Primers | 515F/806R for 16S rRNA gene amplification | Target the V4 hypervariable region of the 16S rRNA gene for community composition analysis [35]. |
| Reference Database | rrnDB database | Curated resource providing 16S rRNA gene copy number information for bacterial taxa, essential for accurate estimation [11] [35]. |
| Bioinformatics Tools | USEARCH, UPARSE, QIIME 2, SINTAX algorithm | Process sequencing data: merge reads, cluster OTUs, perform taxonomic assignment, and calculate community metrics [35]. |
| Ecological Models | MIMICS (MIcrobial-MIneral Carbon Stabilization) model | Process-based ecosystem model that can be parameterized using empirical microbial community data, including copiotroph:oligotroph ratios [36]. |
Calculation of Community-Level Metrics
The most common application of rrn copy number in ecology is the calculation of an abundance-weighted average community-level rrn copy number. This metric reflects the dominant life history strategy within the entire community [11] [35].
The formula for this calculation is: Community-level rrn copy number = Σ (Relative abundance of OTU~i~ × rrn copy number of OTU~i~)
This weighted average provides a single value that can be correlated with environmental variables like nutrient concentrations [33] [11]. For example, in a microcosm DTE experiment, the community-level rrn copy number increased with dilution, indicating a selective enrichment for copiotrophs as nutrients became relatively more available per cell [35].
Data Interpretation: Linking Genomic Patterns to Ecological Processes
Quantitative Patterns and Environmental Correlations
Empirical studies across diverse ecosystems have consistently demonstrated strong relationships between community-level rrn copy number, nutrient availability, and ecosystem functioning. The following table synthesizes key quantitative findings from recent research.
Table 2: Empirical Patterns of rrn Copy Number Variation Across Ecosystems and Nutrient Gradients
| Ecosystem / Context | Observed Pattern | Interpretation & Ecological Significance |
|---|---|---|
| Global Ocean vs. Coastal Sediments [11] | Community-level rrn copy number was significantly lower in nutrient-scarce ocean water (1.54 ± 0.01) than in nutrient-rich coastal sediments (2.74 ± 0.06). | Positive correlation between environmental nutrient concentration and community-level rrn copy number; nutrient scarcity selects for oligotrophic strategists. |
| Long-Term Manure Fertilization [33] | Manure application increased the community rrn copy number and enriched copiotrophic taxa (e.g., Bacillales, Alteromonadales). | Organic amendments raise soil nutrient availability, shifting the community toward fast-growing, copiotrophic life history strategies. |
| Forest Succession [34] | A shift from copiotrophic to oligotrophic bacterial communities occurs from early to late successional stages. | As C and N substrate availability declines and recalcitrant carbon accumulates during succession, slower-growing, efficient oligotrophs gain a competitive advantage. |
| Dilution-to-Extinction Experiments [35] | Higher dilution levels led to an increase in the community-level rrn copy number during regrowth. | Dilution reduces competition, creating a high nutrient-to-biomass ratio that favors the rapid growth of copiotrophs. |
| Soil Bacterial Isolates [38] | High-rrn isolates consumed a greater diversity and amount of substrates in a defined medium than low-rrn isolates. | Direct experimental evidence linking the genomic trait to functional phenotype: high rrn copy number predicts broader substrate utilization and more competitive interactions. |
IntegratingrrnData into Ecosystem Models
A critical advancement is the integration of empirical rrn-based life history data into process-based ecosystem models. For instance, the MIMICS model (MIcrobial-MIneral Carbon Stabilization) was successfully calibrated using field data that included the copiotroph-to-oligotroph ratio, derived from metrics like the community-level rrn copy number [36]. This integration improved the model's mechanistic representation of litter decomposition and altered its predictions under climate change scenarios, sometimes increasing the predicted rate of litter mass loss by up to 5% [36]. This demonstrates how genomic traits can refine projections of carbon-cycle feedbacks.
Advanced Applications and Research Frontiers
Network Interactions and Community Assembly
The rrn copy number can also predict the nature of ecological interactions within microbial communities. Studies show that environments with high nutrient availability and thus higher community-level rrn copy numbers, like coastal sediments, exhibit a greater proportion of negative network associations (e.g., competition) [38] [11]. This is because high-rrn copiotrophs have overlapping substrate use profiles, increasing the potential for resource competition [38]. In contrast, nutrient-scarce systems like the open ocean are dominated by positive associations, potentially reflecting more cooperative cross-feeding or niche partitioning [11].
Furthermore, community assembly processes shift along successional gradients. In a glacier forefield, the initial stages of succession (<60 years) were dominated by stochastic processes, while later stages became increasingly governed by deterministic selection, as reflected in multidiversity patterns [39]. The rrn copy number helps track this transition from stochastic colonization to niche-based assembly.
Resolving Contradictions and Context Dependencies
While a powerful tool, the application of rrn copy number is not without complexities. The relationship between rrn copy number and other traits can be habitat-dependent [32]. For example, the relationship between resistance and resilience traits in prokaryotes was found to be positive for genomes smaller than 5 million base pairs but negative for larger genomes [32]. This indicates that broad, universal trade-offs may be complicated by other genomic factors, and precludes a simple, globally consistent application of the CSR schema. Researchers must therefore consider local environmental contexts and other genomic traits when interpreting rrn copy number data.
The Scientist's Toolkit: A Protocol for Soil Systems
This section provides a detailed protocol for a typical experiment designed to link soil nutrient flows to microbial life history strategies using the rrn copy number proxy.
Objective: To determine the effect of long-term nutrient amendment on soil bacterial life history strategies and their functional outcomes.
Materials:
- Experimental Plots: Long-term field experiments with defined fertilization regimes (e.g., control vs. manure-amended soils) [33].
- DNA Extraction Kit: e.g., FastDNA Spin Kit for Soil [35].
- Sequencing Primers: 515F/806R for the 16S rRNA gene V4 region [35].
- Bioinformatics Pipeline: USEARCH/UPARSE for OTU clustering, SINTAX for taxonomy, access to the rrnDB database.
- Metabolomics Platform: LC-MS (Liquid Chromatography-Mass Spectrometry) for untargeted soil metabolome profiling [33].
- Enzyme Assays: Reagents for fluorometric or colorimetric measurement of extracellular enzyme activities (e.g., for C, N, P acquisition).
Procedure:
- Sample Collection: Collect soil cores from replicate plots of each treatment. homogenize and subdivide for DNA extraction, metabolomics, and soil chemistry analysis.
- Soil Chemistry: Standard analyses for SOC, TN, NH₄⁺, NO₃⁻, and available P to characterize the nutrient environment [33].
- DNA Sequencing & Analysis:
- Extract genomic DNA.
- Amplify and sequence the 16S rRNA gene region.
- Process sequences to obtain an OTU table and perform taxonomic assignment.
- Assign a rrn copy number to each OTU using the rrnDB database.
- Calculate the abundance-weighted average community-level rrn copy number.
- Functional Metrics:
- Measure the activities of key extracellular enzymes.
- Perform untargeted metabolomics via LC-MS to profile the soil metabolome [33].
- Data Integration:
- Correlate the community-level rrn copy number with soil nutrient contents and enzyme activities.
- Construct co-occurrence networks to identify potential competitive or cooperative interactions.
- Use statistical models (e.g., linear mixed-effects models) to test the significance of the fertilization effect on the rrn copy number and its relationship with crop yield or other ecosystem functions [33].
The rrn copy number provides an unparalleled genomic proxy for bridging the gap between microbial community composition and ecosystem function. By quantifying this trait, researchers can move beyond census-taking to predict how microbial communities will respond to changing nutrient flows, and what the functional consequences of those shifts will be for processes like carbon cycling and plant productivity. As the methods for sequencing and metabolic profiling continue to advance, the integration of genomic traits like the rrn copy number into predictive ecological models will be crucial for building a mechanistic understanding of the microbial drivers of ecosystem stability and change.
Dilution-to-extinction (DTE) is a high-throughput cultivation technique used to isolate individual microorganisms by progressively diluting a microbial community until only a single cell remains in some aliquots [40]. This method has become a fundamental manipulative tool in microbial ecology for studying Biodiversity-Ecosystem Functioning (BEF) relationships, allowing researchers to experimentally reduce microbial diversity to examine how this reduction affects specialized ecosystem processes [35] [41]. By creating a gradient of microbial diversity, DTE enables scientists to test hypotheses about functional redundancy, niche complementarity, and the role of rare species in maintaining ecosystem functions.
The technique is particularly valuable for isolating rare or uncultured microorganisms that may not thrive in standard laboratory conditions, thus expanding our understanding of microbial biodiversity beyond what is possible with culture-independent methods alone [40] [42]. When applied within the context of nutrient flow dynamics, DTE provides unique insights into how resource availability shapes microbial community assembly and consequently influences ecosystem functioning.
Theoretical Framework: DTE in Oligotroph and Copiotroph Succession
Oligotroph-Copiotroph Dynamics in Nutrient Gradients
The application of DTE must be understood through the lens of microbial life history strategies, particularly the oligotroph-copiotroph spectrum that governs microbial succession in response to nutrient flows [35]. Oligotrophs are organisms adapted to nutrient-poor environments, characterized by slow growth, efficient nutrient uptake systems, and high-affinity transporters [43]. In contrast, copiotrophs thrive in nutrient-rich conditions, exhibiting rapid growth rates when resources are abundant but poor survival under nutrient limitation [1].
Table 1: Characteristics of Oligotrophs and Copiotrophs
| Trait | Oligotrophs | Copiotrophs |
|---|---|---|
| Nutrient Preference | Low nutrient environments | Nutrient-rich environments |
| Growth Rate | Slow | Fast |
| Metabolic Strategy | Efficient nutrient scavenging | Rapid nutrient utilization |
| Transport Systems | High-affinity ABC transporters [1] | Phosphotransferase systems (PTS) [1] |
| Population Density | Generally low | High under favorable conditions |
| Examples | SAR11 clade, Sphingopyxis alaskensis [1] | Vibrios, generalist heterotrophs [1] |
During DTE experiments, the dilution process itself creates a temporary nutrient-rich environment relative to the greatly reduced microbial abundance, fundamentally shifting community assembly processes [35]. This nutrient-to-microbe ratio alteration drives the selection of copiotrophic taxa at higher dilution levels, as these conditions favor rapid growth strategies [35]. The regrowth phase after dilution thus becomes a race between different microbial strategies, with profound implications for interpreting BEF relationships.
Community Assembly Processes in DTE Experiments
The dilution process in DTE experiments significantly alters the relative importance of stochastic versus deterministic processes in community assembly [35]. At low dilution levels, stochastic processes dominate due to the high number of rare species, while deterministic processes become stronger at higher dilution levels because microbial copiotrophs are selectively enriched during the regrowth phase [35].
This shift has critical implications for BEF studies: stochastic processes can impair ecosystem functioning, generating negative BEF relationships, while deterministic processes often result in positive BEF relationships [35]. Understanding this dynamic is essential for proper interpretation of DTE experiments, particularly when investigating how nutrient flows influence microbial succession and ecosystem function.
Experimental Methodology and Protocols
Core DTE Protocol for Microbial Isolation
The fundamental DTE approach involves creating a serial dilution series of a microbial inoculum from an environmental sample, typically using a dilution factor of 1:10 at each step [35]. The diluted suspensions are then dispensed into multi-well plates containing an appropriate growth medium, with theoretical optimal dilution resulting in approximately 30-50% of wells showing growth - indicating a high probability of single-cell isolation [42].
Table 2: Key Steps in Standard DTE Protocol
| Step | Procedure | Purpose |
|---|---|---|
| Sample Collection | Collect environmental samples (soil, water, plant tissues) | Source diverse microbial communities |
| Cell Suspension Preparation | Homogenize sample in sterile buffer (e.g., PBS) | Release microorganisms into suspension |
| Serial Dilution | Create dilution series (typically 10-fold steps) in growth medium | Gradually reduce cell density |
| Dispensing | Transfer aliquots to multi-well plates | Isolate individual cells |
| Incubation | Incubate under appropriate conditions | Allow microbial growth |
| Growth Monitoring | Assess turbidity or metabolic activity | Identify wells with growth |
| Isolate Validation | Confirm purity and identity of isolates | Ensure single-strain isolation |
A high-throughput protocol for field-grown crops illustrates this process: samples are processed to create cell suspensions, which undergo serial dilution before being dispensed into 96-well plates containing tryptic soy broth or other appropriate media [44]. Following incubation, growth is detected by increased turbidity, and isolates are subsequently characterized through 16S rRNA gene sequencing [44].
Modifications for Oligotroph and Copiotroph Selection
To specifically target different microbial life strategies, the standard DTE protocol can be modified:
- For oligotroph enrichment: Use nutrient-poor media, extended incubation times (weeks to months), and lower incubation temperatures to mimic natural oligotrophic conditions [43].
- For copiotroph enrichment: Use nutrient-rich media, shorter incubation times, and conditions that simulate nutrient pulses [35] [1].
These modifications allow researchers to specifically investigate how nutrient flows shape microbial community assembly and the consequent effects on ecosystem functions. The selection of appropriate growth media is critical, as it determines which microbial taxa will successfully proliferate following dilution [42].
DTE in Biodiversity-Ecosystem Function Research
Revealing BEF Relationships in Microbial Systems
DTE experiments have provided critical evidence for positive diversity-function relationships in microbial systems, challenging earlier assumptions of complete functional redundancy [41]. Research on soil microbial communities has demonstrated that reductions in microbial functional diversity through DTE lead to proportional decreases in specialized soil processes including nitrification, denitrification, and methane flux [41].
These findings suggest that, contrary to traditional ecological theory, microbial systems exhibit less functional redundancy than previously assumed, particularly for specialized processes carried out by specific microbial guilds [41]. The relationship appears especially strong for functions requiring specific metabolic pathways limited to relatively few microbial species, such as nitrification mediated by ammonia-oxidizing bacteria [41].
Nutrient Flows and Functional Performance
The interaction between nutrient availability and microbial diversity in determining ecosystem function represents a key insight from DTE studies. Research has shown that the selection of copiotrophs at high dilution levels can complicate the interpretation of BEF relationships, as these rapidly-growing taxa may maintain broad functions but impair specialized functions typically associated with rare species [35].
Specialized functions, often carried by rare species, are more likely to be impaired in DTE experiments, while broad functions seem less impacted due to the good performance of copiotrophs [35]. This distinction highlights the importance of considering both microbial life history strategies and nutrient flows when predicting ecosystem responses to biodiversity change.
Technical Considerations and Limitations
Methodological Constraints
While DTE offers powerful approaches for microbial cultivation and BEF research, several important limitations must be considered:
- Restricted to cultivable microbes: DTE primarily isolates microorganisms capable of growth under the provided laboratory conditions [44]
- Aerobic bias: Standard protocols are designed for aerobic bacteria and may miss obligate anaerobes [44]
- Underrepresentation of slow-growing taxa: Fast-growing microorganisms may outcompete slow-growing or fastidious bacteria [42] [44]
- Loss of interdependent microbes: The isolation of individual cells may disrupt essential microbial interactions [44]
- Medium selectivity: The choice of growth medium introduces specific biases in microbial recovery [42] [44]
Troubleshooting Common Issues
Table 3: Troubleshooting DTE Experiments
| Problem | Potential Cause | Solution |
|---|---|---|
| No growth in wells | Over-dilution | Reduce dilution factor or increase starting inoculum [44] |
| Excessive growth in all wells | High bacterial concentration | Prepare more diluted suspension before plating [44] |
| Cross-contamination | Splashing during pipetting | Use slow, controlled pipetting; centrifuge plates before handling [44] |
| Drying of medium | Incomplete sealing | Tightly seal plates with Parafilm to minimize evaporation [44] |
| Unrepresentative diversity | Medium selectivity | Employ multiple media types to capture broader diversity [42] |
Research Toolkit: Essential Materials and Reagents
Core Reagent Solutions
- Buffers: Phosphate-buffered saline (PBS) for sample homogenization and dilution [42]
- Growth Media: Tryptic soy broth (TSB) for general heterotrophs [44]; specialized low-nutrient media for oligotrophs [43]
- DNA Extraction Reagents: Kits for microbial DNA extraction (e.g., FastDNA Spin Kit for Soil) [35]
- PCR Components: High-fidelity polymerase (e.g., KAPA Hotstart), primers for 16S rRNA gene amplification [44]
- Preservation Solutions: Glycerol for cryopreservation at -80°C [44]
Equipment Requirements
- Liquid Handling: Automated pipetting systems for high-throughput processing [44]
- Incubation: Temperature-controlled incubators with shaking capability [35]
- Detection: Plate readers for monitoring growth through turbidity or fluorescence [44]
- Molecular Analysis: PCR thermocyclers, electrophoresis systems, and sequencing platforms [35] [44]
- Sterilization: Laminar flow hoods for aseptic technique [42]
Visualizing DTE Workflows and Community Dynamics
DTE Experimental Workflow
Nutrient-Mediated Community Assembly in DTE
Dilution-to-extinction represents a powerful methodological approach for investigating the complex relationships between microbial diversity, nutrient flows, and ecosystem functioning. By enabling the experimental manipulation of microbial diversity while controlling for nutrient conditions, DTE has revealed fundamental insights into how oligotroph and copiotroph succession shapes ecosystem processes.
The method's particular strength lies in its ability to disentangle the effects of diversity loss from other environmental factors, providing critical experimental evidence for microbial BEF relationships. When applied within the context of nutrient flow research, DTE offers unique opportunities to explore how resource availability mediates the relationship between microbial community composition and ecosystem function.
Future applications of DTE will continue to enhance our understanding of microbial systems, particularly as researchers develop more sophisticated approaches for targeting previously uncultured microbial taxa and for investigating microbial interactions in simplified communities. The integration of DTE with modern molecular techniques and stable isotope approaches will further strengthen its utility for addressing fundamental questions in microbial ecology and ecosystem science.
The study of nutrient flows in terrestrial ecosystems is fundamental to understanding global carbon and nutrient cycles. Within this context, the concepts of oligotrophic (slow-growing, adapted to low-nutrient environments) and copiotrophic (fast-growing, thriving in nutrient-rich conditions) microbial strategies provide a critical framework for interpreting ecosystem responses to environmental change [36] [10]. Long-term fertilization experiments serve as invaluable manipulative studies that reveal how chronic nutrient enrichment alters the structure, function, and successional trajectories of microbial communities in wetland and forest ecosystems. This case study examines key findings from such experiments, focusing on how nutrient flows shape the oligotroph-copiotroph dynamics that underpin ecosystem functioning.
The theoretical foundation for this work rests on the understanding that microorganisms adopt distinct trophic strategies along resource availability gradients. As noted in glacier retreat area studies, "Copiotrophic species (e.g., Actinobacteria and Firmicutes) have fast growth rates and flourish in high-carbon mineralization rate soils," while "Oligotrophic taxa (e.g., Acidobacteria and Chloroflexi) are slow-growing microorganisms and predominate in more recalcitrant carbon substrates" [10]. This physiological differentiation makes the copiotroph-to-oligotroph ratio a sensitive bioindicator of ecosystem nutrient status and functional processes.
Theoretical Framework: Oligotroph-Copiotroph Dynamics in Ecosystem Context
Conceptual Foundation of Microbial Trophic Strategies
The oligotroph-copiotroph framework represents a continuum of microbial life-history strategies that correlate with environmental nutrient availability. This conceptual model offers "one axis of microbial functional and physiological diversity with distinct growth rate parameters, preferred substrates, and carbon use efficiencies that can be considered in ecosystem models" [36]. In the context of fertilization studies, this framework predicts that nutrient enrichment should favor copiotrophic taxa, potentially at the expense of oligotrophic specialists, with cascading effects on ecosystem processes.
The application of this framework extends beyond bacterial communities to include fungal taxa, though "the oligotrophic-copiotrophic conceptual framework is frequently applied to bacteria and is less used to discuss the ecological roles of fungal members" [10]. Some studies have classified Basidiomycota and Ascomycota as representative of oligotrophs and copiotrophs respectively, but experimental evidence linking fungal communities to this framework remains limited compared to bacterial systems.
Integrating Microbial Data into Ecosystem Models
Process-based ecosystem models have traditionally represented climate and litter quality effects on decomposition but have only recently begun integrating empirical microbial community data. The MIcrobial-MIneral Carbon Stabilization (MIMICS) model represents one such advancement, incorporating "functional representation of microbial communities with different enzyme classes or as copiotrophic and oligotrophic microbes" [36]. This integration is crucial because models calibrated solely to decomposition rates or pool sizes may accurately predict current conditions without providing confidence in future projections under climate change scenarios.
Model calibration to empirical drivers, including the copiotroph-to-oligotroph ratio, rather than solely to traditional goodness-of-fit metrics, improves mechanistic representation and confidence in projections. Research demonstrates that "incorporating empirical drivers of litter decomposition provides similar, and sometimes better, predictions of leaf litter decomposition but with different underlying ecological dynamics" [36]. For some sites, this calibration increased climate change-induced leaf litter mass loss by up to 5%, with significant implications for carbon cycle-climate feedbacks.
Figure 1: Conceptual framework of microbial trophic strategies in response to nutrient inputs. The environmental filter of nutrient availability determines the dominance of oligotrophic versus copiotrophic strategies, which in turn drive key ecosystem functions. CUE = Carbon Use Efficiency.
Wetland Ecosystem Case Study: Long-Term Nutrient Enrichment
Experimental Protocol and Design
A long-term nutrient enrichment study in an oligotroph-dominated wetland ecosystem examined how fertilization shapes rhizosphere community composition [45]. The experimental design included:
- Site Characteristics: A nutrient-poor wetland ecosystem with historically low nutrient availability.
- Treatment Structure: Fertilized versus unfertilized plots, with fertilization treatment representing increased nitrogen and phosphorus deposition.
- Sampling Design: Bulk soils and plant rhizospheres (forb and grass functional types) sampled to assess bacterial community composition.
- Methodological Approach: DNA sequencing to characterize bacterial communities, with taxonomic assignment and functional inference based on phylogenetic relationships.
- Core Microbiome Analysis: Identification of 602 unique taxa in forb core microbiomes and 372 unique taxa in grass core microbiomes.
This experimental approach allowed researchers to address how long-term nutrient enrichment, simulating anthropogenic nutrient deposition, filters soil microbiomes and alters plant-microbe relationships in historically nutrient-poor systems.
Key Findings and Data Synthesis
Contrary to conventional expectations, long-term nutrient enrichment in this oligotroph-dominated wetland increased bacterial diversity rather than reducing it [45]. The table below summarizes the key quantitative findings from this study:
Table 1: Wetland fertilization effects on bacterial communities
| Parameter | Unfertilized Plots | Fertilized Plots | Implications |
|---|---|---|---|
| Oligotroph Dominance | High | Increased | Challenges copiotroph-enrichment paradigm |
| Bacterial Diversity | Lower | Greatest in bulk soils | Nutrient enrichment increases diversity |
| Community Structure | Determined by plant association | Determined by fertilization | Fertilization overrides plant effects |
| Forb Rhizosphere | 602 unique core taxa | Enriched in disease-suppressive taxa | Potential shift in plant health dynamics |
| Grass Rhizosphere | 372 unique core taxa | Enriched in carbon-decomposition taxa | Altered C cycling potential |
Notably, "fertilization increased the presence of oligotrophs in bulk and rhizosphere communities" [45], contradicting the common assumption that nutrient enrichment invariably favors copiotrophic taxa. This unexpected result highlights the importance of ecosystem context and initial conditions in determining microbial responses to fertilization.
The research also revealed that "nutrient addition strongly determines forb and grass rhizosphere composition, which could indicate different metabolic preferences in the bacterial communities" [45]. This shift in rhizosphere composition has potential implications for plant health and ecosystem functions associated with carbon and nitrogen cycling.
Forest Ecosystem Case Studies: Varied Responses to Fertilization
Temperate Forest Microbial Dynamics and Litter Decomposition
A comprehensive leaf litterbag decomposition experiment across 10 temperate forest U.S. National Ecological Observatory Network (NEON) sites calibrated and validated the MIMICS model to incorporate empirical microbial community data [36]. The experimental protocol included:
- Site Selection: 10 temperate forest sites with 7 used for calibration and 3 for validation.
- Litterbag Methodology: Standardized litterbags deployed and collected over time to measure decomposition rates.
- Microbial Community Quantification: Bacterial communities characterized and represented as copiotroph-to-oligotroph ratios.
- Model Calibration: Novel Monte Carlo parameterization method calibrating the model to empirical drivers (soil moisture, litter lignin:N, copiotroph:oligotroph ratio) rather than solely to decomposition rates.
- Climate Change Projection: Using SSP 3-7.0 climate change scenario to evaluate calibration effects.
This approach answered "a call for the use of empirical microbial community data in process-based ecosystem models" [36] and demonstrated that representing observational drivers in models improves confidence in climate change predictions. The calibrated model sometimes predicted up to 5% greater climate change-induced leaf litter mass loss, with significant implications for carbon cycle-climate feedbacks.
Loblolly Pine Plantation Response to Throughfall Reduction and Fertilization
A 6-year study in a loblolly pine (Pinus taeda) plantation in the southeastern USA examined the combined effects of throughfall reduction (~30%) and fertilization on soil water usage to a depth of 3 meters [46]. The experimental design featured:
- Factorial Design: 2×2 factorial experiment with throughfall reduction (ambient vs. reduced) and fertilization (no fertilization vs. fertilization).
- Soil Moisture Monitoring: Soil moisture measured at multiple depths (0-3 m) over 28 months.
- Drought Context: Study conducted during periods of mild to moderate drought based on Palmer Drought Severity Index.
The investigation tested the hypotheses that "throughfall reduction treatment will reduce soil moisture for the whole soil profile, and when combined with fertilization the soil moisture reduction will be greater than throughfall reduction or fertilization alone" [46].
Table 2: Forest fertilization effects on ecosystem processes
| Ecosystem Type | Treatment | Key Findings | Microbial Implications |
|---|---|---|---|
| Temperate Forests (Multi-site) | Model calibration with microbial data | 5% increased climate-induced decomposition with calibration | Copiotroph dominance increases climate sensitivity |
| Loblolly Pine Plantation | Throughfall reduction × Fertilization | Deep soil water usage under drought; fertilization intensified water depletion | Shift toward drought-adapted microbial taxa |
| North Florida Watersheds | Fertilization at BMP rates | No detectable effect on stream nutrients or biota | Limited nutrient leaching from microbial retention |
| Subtropical Forests (Primary succession) | Natural fertility gradient | Microbial CUE increased with oligotroph:copiotroph ratio | Oligotroph dominance enhances C storage |
The research found that "fertilization when combined with the throughfall reduction treatment significantly decreased soil water at 0.1-0.9 m depth" [46], demonstrating interactive effects of nutrient and water availability. Deep soil water (below 0.9 m) played a critical role in buffering transpirational demand during months when transpiration exceeded precipitation, particularly under throughfall reduction.
Watershed-Scale Fertilization in North Florida Forests
A different perspective comes from a watershed-scale study in north Florida that examined stream export responses to forest fertilization [47]. This research tested "the hypothesis that forest fertilization in compliance with established Best Management Practices (BMPs) has negligible effects on stream nutrient concentrations and mass export, and that stream biotic condition is similarly unaffected."
The experimental approach included:
- Watershed Monitoring: Two moderately sized forested watersheds (Simms Creek and Santa Fe Drain) monitored from Fall 2012 to Spring 2017.
- Fertilization Regime: Application of four years of scheduled fertilizer in a single year to test extreme scenarios.
- Water Quality Metrics: Solute concentrations, mass fluxes, and stream biotic integrity measures.
- Regulatory Context: Comparison to Numeric Nutrient Criteria (NNC) standards.
The central finding was that "there was no detectable effect of fertilization on any of the measured solute concentrations or mass fluxes, or on any measures of stream biotic integrity" [47]. This suggests that properly managed forest fertilization at BMP rates maintains water quality, with implications for microbial nutrient retention in these ecosystems.
Cross-Ecosystem Synthesis: Emerging Patterns
Microbial Community Succession Along Nutrient Gradients
Across ecosystems, fertilization induces predictable changes in microbial community composition and function, though the specific trajectories depend on initial conditions. In primary succession gradients, such as in a glacier retreat area on the southeastern Tibetan Plateau, researchers observed that "microbial communities shift from copiotrophic to oligotrophic taxa" as carbon quality decreases over time [10]. This shift has functional consequences, as "microbial CUE increased with microbial oligotroph:copiotroph ratios," indicating that "a higher microbial CUE occurred in the oligotrophs-dominated stages" [10].
This pattern was also observed in subtropical forest succession, where studies revealed that "forest succession improves the complexity of soil microbial interactions and the ecological stochasticity of community assembly" [34]. The relative importance of stochasticity in soil fungal communities increased in later successional stages, with dispersal limitation and drift accounting for large proportions of bacterial and fungal community assembly, respectively.
Ecosystem-Specific Responses and Management Implications
The case studies reveal that ecosystem context dramatically influences responses to fertilization:
- Wetlands: Long-term nutrient enrichment in oligotroph-dominated wetlands increased bacterial diversity and increased oligotroph presence, contrary to expectations [45].
- Forests: Throughfall reduction and fertilization interact to affect deep soil water usage, with fertilization potentially intensifying drought impacts [46].
- Watersheds: Properly managed forest fertilization following BMPs showed no detectable effects on stream nutrient export, suggesting microbial communities and soil processes effectively retain added nutrients [47].
These contextual differences highlight the importance of ecosystem-specific understanding for predicting microbial responses to anthropogenic nutrient enrichment.
Research Protocols and Methodologies
Standardized Experimental Approaches
To ensure comparability across fertilization studies, researchers have developed standardized protocols for assessing microbial community responses:
Litterbag Decomposition Studies
- Standardized litterbag mesh sizes and litter compositions
- Deployment periods spanning multiple seasons
- Measurement of mass loss, nutrient dynamics, and microbial community succession
- Environmental monitoring (soil moisture, temperature, litter quality)
Microbial Community Characterization
- DNA sequencing of 16S and ITS regions for bacterial and fungal communities
- Bioinformatic processing using standardized pipelines (QIIME, MOTHUR)
- Functional inference based on phylogenetic relationships
- Co-occurrence network analysis to identify ecological modules
Process Rate Measurements
- Carbon use efficiency determination via 13C-labeling approaches
- Enzyme activity assays for nutrient acquisition
- Heterotrophic respiration measurements
- Nutrient leaching and retention quantification
The Scientist's Toolkit: Essential Research Reagents and Materials
Table 3: Essential research reagents and materials for fertilization studies
| Item | Function | Application Examples |
|---|---|---|
| Ionic Fertilizers (NH₄NO₃, KH₂PO₄) | Controlled nutrient addition | Creating nutrient availability gradients [45] [48] |
| Litterbags (standardized mesh) | Decomposition measurement | Quantifying litter mass loss and nutrient dynamics [36] |
| DNA Extraction Kits (e.g., MoBio PowerSoil) | Microbial community analysis | Characterizing bacterial and fungal composition [45] [34] |
| 13C-Labeled Substrates | CUE determination | Measuring carbon use efficiency [10] |
| Soil Moisture Sensors | Environmental monitoring | Tracking soil water availability [46] |
| Ion Chromatography Systems | Nutrient concentration analysis | Quantifying soil and water nutrients [47] |
| Sequencing Reagents (e.g., Illumina) | Community sequencing | Assessing microbial diversity and composition [45] [34] |
Figure 2: Experimental workflow for fertilization studies integrating field manipulations with laboratory analyses and data modeling to understand microbial responses to nutrient enrichment.
Long-term fertilization experiments reveal complex interactions between nutrient flows and microbial community succession across ecosystems. The oligotroph-copiotroph framework provides a valuable lens for interpreting these responses, though ecosystem context and initial conditions strongly mediate outcomes. Key insights include:
- Context-Dependent Responses: Nutrient enrichment does not invariably favor copiotrophic taxa, as demonstrated by increased oligotroph dominance in fertilized wetlands [45].
- Functional Consequences: Microbial trophic strategies influence carbon use efficiency, with oligotroph-dominated communities exhibiting higher CUE and potentially greater carbon storage [10].
- Management Implications: Properly managed forest fertilization following BMPs can maintain water quality, suggesting effective nutrient retention by soil microbial communities [47].
- Modeling Advancements: Integrating empirical microbial data into process-based models like MIMICS improves projections of climate change impacts on decomposition [36].
Future research should prioritize cross-ecosystem comparisons, longer-term studies to capture successional dynamics, and enhanced integration of molecular data with ecosystem-scale models. Such approaches will advance our understanding of how anthropogenic nutrient enrichment alters the oligotroph-copiotroph dynamics that govern critical ecosystem functions.
Resolving Experimental Challenges: Cultivation Barriers, Community Assembly, and Functional Interpretation
The "Great Plate Count Anomaly" describes the longstanding challenge in microbiology where typically only 1% or fewer of environmental microorganisms can be cultured in the laboratory using standard techniques [49]. This discrepancy between microscopic cell counts and colony-forming units has profound implications for understanding microbial ecosystems, particularly in the context of nutrient flows and the succession of oligotrophic and copiotrophic strategists. While recent studies suggest the proportion of culturable marine microorganisms may be higher than traditionally estimated, a significant majority remain uncultured due to specific, unmet growth requirements [49]. Overcoming this anomaly is critical for advancing our understanding of microbial ecology, ecosystem functioning, and biotechnological applications.
This technical guide explores innovative strategies for cultivating previously uncultivable microorganisms, with particular emphasis on oligotrophic microbes—slow-growing organisms adapted to nutrient-poor conditions that play crucial roles in carbon cycling and ecosystem stability [10]. The cultivation of these organisms must be framed within the broader theoretical framework of microbial succession, where nutrient availability drives transitions between oligotrophic and copiotrophic (fast-growing, nutrient-requiring) strategists [10]. Understanding these dynamics provides both the rationale and the methodology for accessing the microbial "dark matter" that has eluded traditional cultivation attempts.
Theoretical Framework: Nutrient Flows and Microbial Trophic Strategies
Oligotroph-Copiotroph Dynamics in Microbial Succession
Microbial community assembly follows predictable patterns based on nutrient availability and environmental conditions. The oligotroph-copiotroph framework provides a functional classification system where:
- Oligotrophic strategists are characterized by slow growth rates, high substrate affinity, and efficiency in utilizing recalcitrant carbon sources, typically dominating in low-nutrient environments [10]. Examples include Acidobacteria and Chloroflexi [10].
- Copiotrophic strategists exhibit fast growth rates, lower substrate affinity, and thrive in nutrient-rich conditions, often dominating early successional stages or resource-pulse environments [36]. Examples include Actinobacteria and Firmicutes [10].
Empirical studies across diverse ecosystems reveal consistent patterns in the relationship between nutrient flows and microbial succession. In glacier retreat areas undergoing primary vegetation succession, research demonstrates a clear shift from copiotroph-dominated communities in early successional stages with labile carbon availability to oligotroph-dominated communities in late stages with more recalcitrant carbon pools [10]. Similarly, in temperate forest ecosystems, the ratio of copiotrophs to oligotrophs serves as a key predictor of litter decomposition rates and carbon cycling dynamics [36].
dot code for Oligotroph Copiotroph Succession:
Ecological and Physiological Basis of the Great Plate Count Anomaly
The Great Plate Count Anomaly persists due to fundamental mismatches between laboratory conditions and native microbial habitats. Key factors contributing to the anomaly include:
- Nutrient specificity: Many marine and soil microbes require specific nutrients or growth conditions not replicated in standard media [49].
- Slow growth rates: Oligotrophic microorganisms often have extremely slow division times, making them susceptible to overgrowth by faster competitors or invisible within standard incubation periods [49].
- Unidentified growth requirements: Many microorganisms depend on specific signaling molecules, cofactors, or interspecies interactions that are not provided in artificial media [49].
- Metabolic dormancy: Some microbial populations exist in persistent dormant states, only becoming active under specific environmental triggers [49].
The functional implications of these trophic strategies extend to fundamental ecosystem processes. Research demonstrates that oligotroph-dominated communities typically exhibit higher microbial carbon use efficiency (CUE), representing more efficient conversion of substrate carbon into biomass rather than respiratory loss [10]. This relationship underscores the critical importance of accurately representing microbial functional groups in ecosystem models predicting carbon cycle responses to environmental change [36].
Advanced Methodologies for Cultivation of Challenging Microbes
Cultivation Techniques and Media Formulations
Successful cultivation of oligotrophic and dormant microbes requires mimicking native environmental conditions while reducing physiological stress. The following table summarizes advanced approaches that address specific growth limitations:
Table 1: Advanced Cultivation Techniques for Overcoming the Great Plate Count Anomaly
| Technique | Principle | Target Microbes | Key Modifications | Reported Success |
|---|---|---|---|---|
| Diffusion Chambers | Permits chemical exchange with natural environment while containing cells | Oligotrophs, slow-growers | Semi-permeable membranes allow nutrient and signal molecule diffusion | Significantly higher recovery than standard plates [49] |
| High-Throughput Cultivation | Miniaturization enables testing thousands of conditions | Diverse uncultured taxa | Microdroplets, microarrays with condition variation | Access to novel phylogenetic lineages [49] |
| Co-culture Approaches | Recreates essential microbial interactions | Dependent community members | Addition of helper strains or conditioned media | Activation of dormant cells via signaling [49] |
| Low-Nutrient Media | Mimics native oligotrophic conditions | Oligotrophs | 10-1000x dilution of standard nutrients, natural extracts | Reduced metabolic shock [10] |
| Extended Incubation | Accommodates slow growth rates | Slow-growing oligotrophs | Incubation for weeks to months, contamination prevention | Recovery of rarely cultivated taxa [49] |
Experimental Protocols for Oligotroph Cultivation
Dilute Nutrient Media Preparation for Oligotroph Isolation
Principle: Standard laboratory media create toxic conditions for oligotrophic microbes adapted to low nutrient concentrations. This protocol establishes a gradient of nutrient availability to selectively enrich oligotrophic populations.
Materials:
- Basal salts solution (per liter: 0.5g NH₄Cl, 0.1g KH₂PO₄, 0.5g MgSO₄·7H₂O, 0.01g CaCl₂·2H₂O)
- Environmental extract (collect from target habitat: soil, sediment, or water)
- Ultra-pure water
- Gelling agent (gellan gum or agar)
- Cycloheximide (for fungal inhibition in bacterial isolations)
Procedure:
- Prepare environmental extract by collecting habitat material (soil, sediment), mixing with ultra-pure water (1:2 w/v), autoclaving, and filtering through 0.2μm membrane.
- Create media dilutions (100%, 10%, 1%, and 0.1% nutrient strength) by combining basal salts with environmental extract in appropriate ratios.
- Add gelling agent (15g/L for agar, 10g/L for gellan gum) and cycloheximide (100mg/L) if targeting bacteria.
- Autoclave and pour plates under sterile conditions.
- Inoculate with serial dilutions of environmental samples.
- Incubate at in situ temperature for 4-12 weeks, monitoring weekly for slow-growing colonies.
Technical Notes: Successful oligotroph isolation often requires extended incubation (8+ weeks). Colony appearance may be atypical—small, translucent, or pigmented. Transfer emerging colonies to fresh media of the same composition for purification.
Diffusion Chamber Construction for In Situ Cultivation
Principle: This method maintains microbial cells in their natural chemical environment while protecting them from predation and competition, allowing uncultivable organisms to grow.
Materials:
- 0.03μm pore-size polycarbonate membranes
- Silicon gaskets
- Plastic chamber assemblies
- Sterile seawater or habitat-equivalent buffer
Procedure:
- Prepare environmental sample by gentle homogenization and filtration through 5μm membrane to remove large particles.
- Mix sample with low-gelling temperature agarose (final concentration 0.8%) at 30°C.
- Sandwich agarose-sample mixture between two polycarbonate membranes separated by gasket.
- Assemble chamber and incubate in natural environment or laboratory microcosm mimicking natural conditions.
- After 2-4 weeks, disassemble chamber and extract grown colonies for further purification on appropriate media.
Technical Notes: Diffusion chambers can increase culturalbility 300-fold compared to standard plates. Optimal incubation time varies by habitat—typically 2-8 weeks.
dot code for Diffusion Chamber Workflow:
Integration of Cultivation with Omics Technologies
Cultivation-Omics Workflow Integration
Modern microbial cultivation benefits enormously from integration with metagenomic and other omics approaches. This synergistic relationship enables targeted cultivation based on genomic insights and validation of metabolic potential.
dot code for Cultivation Omics Integration:
Metagenomic data provides critical insights for guiding cultivation efforts. Through functional gene prediction (e.g., PiCRUST) and metabolic pathway reconstruction, researchers can design targeted media that address specific nutritional requirements of uncultivated taxa [50]. This approach has successfully identified community-level ecological strategies and genetic repertoires that differentiate oligotrophic and copiotrophic assemblages [50].
Research Reagent Solutions for Oligotroph Cultivation
Table 2: Essential Research Reagents for Oligotroph and Dormant Microbe Cultivation
| Reagent/Category | Function/Principle | Application Examples | Technical Considerations |
|---|---|---|---|
| Gelling Agents | Creates solid surface with minimal nutrient introduction | Gellan gum, Agarose | Gellan gum superior for oligotrophs due to lower nutrient content |
| Signaling Molecules | Activates quorum sensing and growth initiation | N-acyl homoserine lactones, Autoinducer-2 | Breaks dormancy in viable but non-culturable cells |
| Metabolic Stimulants | Provides specific enzymatic cofactors | Pyroloquinoline quinone (PQQ), Heme, Cobalamin | Addresses auxotrophy in target organisms |
| Natural Substrates | Mimics native nutrient sources | Environmental extracts, Plant polymers | Provides complex, slowly metabolized carbon sources |
| Inhibitors | Selective pressure against fast-growers | Cycloheximide, Nystatin, Antibiotics | Reduces overgrowth by copiotrophs and fungi |
| Sorption Resins | Removes waste metabolites | XAD resins, Activated charcoal | Reduces accumulation of growth-inhibiting compounds |
Data Integration and Ecosystem Modeling
Incorporating Microbial Data into Ecosystem Models
The integration of empirical microbial data into process-based ecosystem models represents a critical advancement for predicting ecosystem responses to environmental change. The MIMICS (MIcrobial-MIneral Carbon Stabilization) model exemplifies this approach by incorporating functional representations of microbial communities, specifically the copiotroph-to-oligotroph ratio, to predict litter decomposition dynamics [36].
Calibration of ecosystem models to empirical microbial drivers, rather than solely to process rates, improves mechanistic representation and confidence in projections under climate change scenarios [36]. Research demonstrates that models incorporating microbial functional groups predict increased litter decomposition under climate change at certain sites, with implications for carbon-cycle climate feedbacks [36].
Table 3: Quantitative Relationships Between Microbial Parameters and Ecosystem Processes
| Parameter Relationship | Ecosystem Context | Mathematical Relationship | Ecological Interpretation |
|---|---|---|---|
| Oligotroph: Copiotroph Ratio vs. CUE | Glacier retreat primary succession | Positive correlation (R² = 0.67) | Oligotroph-dominated communities show higher carbon conversion efficiency [10] |
| Copiotroph: Oligotroph Ratio vs. Decomposition | Temperate forest litter decomposition | Variable by site | Calibration improves climate change projections [36] |
| Fungal: Bacterial Ratio vs. CUE | Multiple ecosystems | Inconsistent correlation | Context-dependent relationship [10] |
| Carbon Quality vs. Trophic Strategy | Primary succession gradient | Negative correlation with oligotroph dominance | Copiotrophs dominate high-quality carbon environments [10] |
Overcoming the Great Plate Count Anomaly requires a paradigm shift from traditional cultivation approaches to integrated strategies that incorporate ecological theory, particularly the framework of oligotroph-copiotroph dynamics along nutrient gradients. The successful cultivation of dormant and oligotrophic microbes hinges on mimicking native environmental conditions, including nutrient scarcity, essential signaling molecules, and appropriate community contexts.
Future advancements will likely focus on several key areas: (1) refined high-throughput cultivation systems that enable rapid testing of thousands of nutrient and signaling combinations; (2) single-cell isolation and cultivation technologies that bypass community dependencies; and (3) increasingly sophisticated integration of genomic and metabolic data to predict growth requirements. Furthermore, embracing the concept of microbial succession and trophic strategies provides not only a theoretical framework for understanding microbial community assembly but also a practical roadmap for accessing the vast untapped resource of microbial diversity.
As cultivation techniques continue to evolve alongside omics technologies, we move closer to resolving the Great Plate Count Anomaly and unlocking the full functional potential of Earth's microbial diversity. This progress will fundamentally advance our understanding of ecosystem processes, enhance predictive modeling of biogeochemical cycles, and provide novel microbial resources for biotechnology and drug discovery.
The Core Mechanism: Resource Shifts and Community Assembly
Dilution-to-extinction (DTE) experiments are a powerful tool for manipulating microbial diversity to study Biodiversity-Ecosystem Functioning (BEF) relationships [6]. The central pitfall, however, lies in how the methodology itself systematically alters the microbial community. The process begins with a high dilution of the original microbial inoculum, which dramatically reduces the absolute abundance of all species. This reduction is not neutral; it effectively removes rare species from the community, as their already-low numbers fall below a detectable threshold or are driven to local extinction [6].
Concurrently, the dilution step creates a new environment where the remaining, low-diversity microbial community is introduced into a fresh, nutrient-rich medium relative to the now-scarce microbial cells. This high nutrient-to-microbe ratio fundamentally shifts the ecological selection pressures. The environment becomes highly favorable for copiotrophs—fast-growing, r-strategist microorganisms that thrive in nutrient-rich conditions [6]. These copiotrophs, which often possess high ribosomal RNA (rrn) copy numbers—a genomic trait correlated with maximum growth rates—are able to rapidly exploit the available resources and dominate the community during the regrowth phase [6]. In contrast, oligotrophs—slow-growing, K-strategists adapted to nutrient-poor conditions—are selectively disadvantaged in this sudden boom phase, leading to a community that is no longer representative of the original environmental sample [6].
The following diagram illustrates this sequential process that leads to the selection of copiotrophs:
Consequences for Biodiversity and Ecosystem Functioning
The inadvertent selection for copiotrophs has profound implications for interpreting BEF relationships. This shift in community structure directly influences the assembly process. At low dilution levels, where diversity remains relatively high, stochastic processes (random birth, death, dispersal) play a significant role in community assembly. However, as dilution increases and copiotrophs are selectively enriched, deterministic processes (niche-based selection) become dominant [6]. This is a critical confounder in BEF studies, as the same process used to manipulate diversity (dilution) also changes the very rules governing how the community is assembled.
The functional consequences of this shift are equally significant. Different microbial life strategies are linked to different ecosystem functions. The impairment of specialized functions, often carried out by the lost rare species, can be obscured if only broad functions are measured, as these may be maintained by the dominating copiotrophs [6]. Therefore, a DTE experiment might misleadingly show no relationship between diversity and a particular function, when in reality the relationship with a specialized function has been erased.
Table 1: Impact of Increasing Dilution Levels on Microbial Community Attributes and Assembly Processes
| Dilution Level | Species Richness | Relative Abundance of Copiotrophs | Dominant Community Assembly Process | Ecosystem Functional Potential |
|---|---|---|---|---|
| Low | High | Low | Primarily Stochastic | Broad and Specialized |
| Medium | Moderate | Moderate | Mixed Stochastic/Deterministic | Broad maintained, Specialized impaired |
| High | Low | High | Primarily Deterministic | Primarily Broad |
Methodological Framework and Quantitative Assessment
The microcosm study and meta-analysis cited provide a clear methodological framework for a DTE experiment [6]. The core protocol involves creating a serial dilution of a microbial community (e.g., bacterioplankton from a lake) with a sterile growth medium, typically using a dilution factor of 1:10 across several steps. After dilution, the communities are incubated under controlled conditions to allow for regrowth. Sampling occurs after a set period to analyze the resulting community structure and function.
A key quantitative method used to track the life-history strategy shift is the analysis of ribosomal RNA operon (rrn) copy number [6]. This involves:
- DNA Extraction & Sequencing: Microbial DNA is extracted from filters and the 16S rRNA gene is amplified and sequenced.
- Taxonomic Assignment: Sequences are clustered into Operational Taxonomic Units (OTUs) and their taxonomy is identified.
- rrn Copy Number Prediction: The average rrn copy number for each OTU is predicted based on its taxonomy using specialized databases like the rrnDB [6].
- Community-Weighted Mean Calculation: The mean rrn copy number for the entire community is calculated using an abundance-weighted average. An increase in this value is a strong indicator of copiotroph selection [6].
Table 2: Key Reagents and Materials for a DTE Microcosm Study
| Research Reagent / Material | Function / Purpose |
|---|---|
| Source Microbial Community | The natural inoculum for the experiment (e.g., lake bacterioplankton) [6]. |
| Sterile Growth Medium | Provides nutrients for microbial regrowth after dilution; often autoclaved source water [6]. |
| Isopore Membrane Filters (e.g., 5-µm, 0.8-µm) | Used to pre-filter the source community to remove microeukaryote predators that could alter bacterial composition [6]. |
| DNA Extraction Kit (e.g., FastDNA Spin Kit for Soil) | To extract microbial genomic DNA from the collected biomass on filters for downstream sequencing [6]. |
| 16S rRNA Gene Primers (e.g., 515F/806R) | For PCR amplification of the target gene to enable characterization of the prokaryotic community via high-throughput sequencing [6]. |
| rrnDB Database | A key bioinformatics resource used to predict the ribosomal RNA operon copy number for each OTU based on its taxonomy [6]. |
The conceptual relationship between the experimental manipulation, the resulting ecological shift, and the ultimate effect on BEF research is summarized below:
A Path Forward: Recommendations for Future Research
To mitigate these pitfalls and generate more ecologically relevant insights from DTE experiments, researchers should adopt the following strategies:
- Focus on Specialized Functions: Given that broad functions may be resilient due to copiotroph activity, BEF relationships should be defined using specialized microbial functions, which are more likely to be impaired by the loss of rare species [6]. This provides a more sensitive and meaningful assessment of biodiversity loss.
- Track Life-History Strategies: Quantifying traits like the community-weighted mean rrn copy number should be a standard practice in DTE studies. This provides a quantitative measure of the copiotroph-oligotroph shift, allowing researchers to account for this confounder in their interpretations [6].
- Integrate Community Assembly Metrics: Employing analytical frameworks like the Modified Stochasticity (MST) index to quantify the relative importance of stochastic and deterministic assembly processes can help clarify the mechanistic link between dilution, community assembly, and ecosystem function [6].
- Contextualize with Broader Frameworks: Placing DTE findings within the broader context of nutrient flows and microbial succession is essential. For instance, the copiotroph-oligotroph framework is increasingly being integrated into ecosystem models to predict processes like litter decomposition under climate change, highlighting the real-world relevance of these functional groups [36].
Distinguishing Between Broad and Specialized Ecosystem Functions in Manipulated Communities
Ecosystem functioning encompasses the collective biological, geochemical, and physical processes that sustain an ecosystem. Within manipulated communities—whether through nutrient enrichment, species introductions, or deliberate assembly—these functions can be categorized as either broad or specialized. This distinction is critical for predicting ecosystem responses to anthropogenic changes and for designing effective restoration strategies. Broad functions, such as primary production and community respiration, are supported by many taxonomic groups and remain relatively stable across community compositions. In contrast, specialized functions, such as the decomposition of recalcitrant compounds or the removal of specific pollutants, often depend on particular microbial taxa or specific trophic interactions [51].
The manipulation of nutrient flows serves as a powerful experimental tool to investigate this functional dichotomy. Nutrient enrichment directly alters the fundamental resource landscape, driving succession within microbial communities from oligotroph-dominated systems (adapted to low nutrient availability) to copiotroph-dominated systems (thriving in high nutrient conditions) [36] [52]. This shift in the copiotroph-to-oligotroph ratio has profound implications for carbon and nutrient cycling, thereby influencing both broad and specialized ecosystem functions [36] [53]. This guide provides a technical framework for distinguishing between these functional types, complete with experimental protocols and visualization tools, to advance research on how nutrient-mediated community changes affect ecosystem processes.
Conceptual Framework: Broad vs. Specialized Functions
The distinction between broad and specialized ecosystem functions lies in the relationship between the process and the community responsible for its execution.
Defining Characteristics
- Broad Ecosystem Functions are characterized by high levels of functional redundancy across the community. Multiple species can perform the same process, making the overall function resistant to changes in species composition. These processes are often fundamental to ecosystem energy and material flows.
- Specialized Ecosystem Functions are characterized by low functional redundancy. They are often dependent on specific key taxa or particular combinations of species (consortia) that possess unique metabolic pathways or traits.
Table 1: Key Characteristics of Broad and Specialized Ecosystem Functions
| Feature | Broad Ecosystem Functions | Specialized Ecosystem Functions |
|---|---|---|
| Functional Redundancy | High | Low |
| Dependence on Diversity | Often weak; driven by biomass and dominant taxa | Often strong; relies on presence of specific taxa |
| Response to Perturbation | Relatively stable | Highly sensitive to community shifts |
| Typical Examples | Gross Primary Production, Community Respiration, Total Biomass Accumulation | Degradation of Endocrine Disrupting Compounds (EDCs), Lignin Decomposition, Specific Nutrient Immobilization Pathways |
Relationship to Nutrient Flows and Microbial Succession
Nutrient manipulation is a primary driver of copiotroph and oligotroph succession. Oligotrophs (K-strategists) are adapted to low-nutrient conditions, grow slowly, and are efficient at utilizing recalcitrant carbon substrates. Copiotrophs (r-strategists) respond rapidly to nutrient pulses, grow quickly, and prefer labile carbon [36] [52]. Nutrient enrichment typically shifts the community balance toward copiotrophs.
This successional dynamic directly impacts ecosystem functions:
- Broad Functions: A shift to copiotrophs under high nutrient conditions can accelerate total decomposition rates of simple substrates and increase system respiration [36] [53].
- Specialized Functions: The loss of oligotrophs may impair the decomposition of complex compounds like lignin, a specialized function. Conversely, the introduction of a specific pollutant might select for a rare, specialized copiotroph capable of its degradation [51].
The following diagram illustrates the conceptual pathway from nutrient manipulation to divergent functional outcomes.
Methodological Approaches for Functional Distinction
Differentiating between broad and specialized functions requires a toolkit that connects community composition to process rates.
Quantifying Ecosystem Functions
Table 2: Methodologies for Measuring Key Ecosystem Functions
| Ecosystem Function | Measurement Protocol | Classification |
|---|---|---|
| Litter Decomposition | Litterbag Experiment: Deploy mesh bags filled with standardized leaf litter (e.g., 5g). Dry litter pre-deployment. Retrieve bags over time series (e.g., 1, 3, 6, 12 months). Clean off soil, oven-dry, and weigh to determine mass loss [36]. | Broad |
| Microbial Carbon Use Efficiency (CUE) | 18O-H₂O Labeling: Incubate soil with 18O-labeled water. Measure 18O incorporation into microbial DNA (growth) and respired CO₂ (catabolic loss). Calculate CUE = Growth / (Growth + Respiration) [53]. | Broad |
| Specialized Pollutant Degradation | Tracer Approach: Amend soil or water with 13C- or 14C-labeled target compound (e.g., an endocrine disruptor). Track the incorporation of the label into microbial biomass (via phospholipid fatty acids or DNA) and its mineralization to CO₂ over a defined incubation period [51]. | Specialized |
| Net Ecosystem Production | Ecosystem Flux Measurements: In aquatic mesocosms, measure dissolved oxygen concentrations in light and dark bottles over 24h. Gross Primary Production (GPP) = Net O₂ production in light + Respiration in dark. Net Ecosystem Production (NEP) = GPP - Ecosystem Respiration [54]. | Broad |
Linking Functions to Microbial Communities
To connect process rates to microbial actors, employ these techniques:
- High-Throughput Sequencing: Use 16S rRNA gene sequencing (bacteria/archaea) and ITS sequencing (fungi) to characterize community composition. The copiotroph-to-oligotroph ratio can be approximated using phylogenetic markers (e.g., Acidobacteria as oligotrophs, Actinobacteria and Proteobacteria as often copiotrophic) [36] [52].
- Quantitative Stable Isotope Probing (qSIP): Combine stable isotope labeling (e.g., 13C from a substrate) with sequencing to identify and quantify the active microbial populations assimilating the substrate, directly linking taxonomy to function [53].
Experimental Protocol: A Targeted Investigation
This section provides a detailed protocol for a controlled experiment designed to test the effects of nutrient enrichment on broad versus specialized functions.
Experimental Design and Setup
- Hypothesis: Nutrient enrichment will enhance broad ecosystem functions by favoring copiotrophic microbes but will destabilize or reduce specialized functions that depend on oligotrophic taxa.
- Treatments: Establish a factorial design with two factors: Nutrient Level (Ambient vs. Enriched) and Community Diversity (Low vs. High). Use 8 replicates per treatment (Total N=32 microcosms).
- Nutrient Enrichment: Achieve using a modified Hoagland's solution to elevate nitrogen and phosphorus levels (e.g., +100 mg N kg⁻¹ as NH₄NO₃ and +50 mg P kg⁻¹ as KH₂PO₄) [55].
- Community Manipulation: For soil systems, create a diversity gradient by serially diluting a soil suspension and reinoculating sterilized soil. For aquatic systems, filter water to create different size fractions controlling for microbial diversity [51].
- Microcosms: Use 1L jars containing 500g of sterile soil or 1L of filtered lake water. Maintain environmental conditions (e.g., 60% water holding capacity, 25°C, 12h/12h light/dark cycle) for 12 weeks.
Data Collection and Analysis
- Week 0 & 12: Collect samples for baseline and endpoint microbial community analysis via DNA sequencing.
- Weekly: Measure soil respiration (CO₂ flux) as a broad function using a portable gas analyzer or alkaline trap method.
- Week 12: Terminate the experiment and measure:
- Broad Function: Total above-ground plant biomass (harvest, dry, weigh) and microbial CUE via 18O-H₂O labeling on a subsample [53].
- Specialized Function: Quantify the degradation rate of a 13C-labeled recalcitrant compound (e.g., lignin or a specific pesticide) by measuring 13CO₂ evolution and 13C incorporation into biomass [51].
- Statistical Analysis: Perform a two-way ANOVA to test the main and interactive effects of nutrients and diversity on each function. Use linear regression to correlate the copiotroph:oligotroph ratio with function rates. Network analysis can relate the presence/absence of specific microbial taxa to specialized function performance.
The workflow for this integrated experiment is summarized below.
The Scientist's Toolkit: Key Reagents and Materials
Table 3: Essential Research Reagents and Solutions for Ecosystem Manipulation Studies
| Reagent/Solution | Function/Application | Technical Notes |
|---|---|---|
| 18O-Labeled Water (H₂18O) | Measurement of in-situ microbial carbon use efficiency (CUE) by quantifying growth (18O-DNA) vs. respiration. | High-cost; requires GC-pyrolysis-IRMS for measurement; considered the gold standard for CUE [53]. |
| 13C- or 14C-Labeled Substrates (e.g., lignin, phenol, pharmaceuticals) | Tracing the fate of specific carbon compounds through the microbial community; identifying degraders via SIP. | 13C is safer and more accessible; 14C allows for highly sensitive detection of mineralization; choice depends on target compound and analytical facilities [51]. |
| Osmocote or Custom NPK Fertilizers | Standardized nutrient enrichment in field and mesocosm studies. | Slow-release formulations provide continuous nutrient supply; allows for precise manipulation of N:P:K ratios [54]. |
| DNA/RNA Extraction Kits (e.g., DNeasy PowerSoil) | High-quality nucleic acid extraction from complex environmental matrices (soil, sediment). | Critical for downstream sequencing; must be efficient for both Gram-positive and Gram-negative bacteria [36] [52]. |
| PCR Primers (e.g., 515F/806R for 16S rRNA) | Amplification of taxonomic marker genes for high-throughput sequencing (Illumina MiSeq). | Standardizes community composition data; allows for comparison across studies and estimation of copiotroph:oligotroph ratios [36] [52]. |
Data Interpretation and Integration
Interpreting data from manipulation experiments requires a multifaceted approach:
- Stable Isotope Data: The efficiency of a specialized function can be calculated from 13C data as:
Degradation Efficiency = (13C in CO₂ + 13C in Biomass) / Total 13C-Compound Added. A high efficiency in low-diversity, nutrient-poor treatments suggests a specialized, oligotroph-driven process [51]. - Linking Community and Function: Analyze sequencing data to calculate the copiotroph:oligotroph (C:O) ratio. A strong positive correlation between the C:O ratio and a broad function (like total respiration) alongside a negative correlation with a specialized function confirms the central hypothesis. Network analysis can further identify keystone taxa whose presence is mandatory for specialized functions, even at low abundance [36] [51].
- Context Dependency: Recognize that the classification of a function is not absolute. For example, litter decomposition is a broad function, but the decomposition of its lignin component is a specialized function reliant on specific fungal taxa. The response will depend on the environmental context, such as the severity of drought or the initial species pool [56].
Distinguishing between broad and specialized ecosystem functions is paramount for understanding and predicting the ecological consequences of global change. Nutrient manipulations, by driving predictable successional patterns from oligotrophic to copiotrophic microbial states, provide a powerful lens through which to observe this functional dichotomy. The experimental and analytical frameworks outlined in this guide provide a pathway for researchers to quantitatively test these concepts. By rigorously applying these protocols—from controlled microcosm experiments using isotopic tracers to the integration of high-throughput sequencing data—scientists can build predictive models of how anthropogenic pressures alter not just biodiversity, but the fundamental workings of ecosystems upon which society depends.
Understanding the mechanisms that govern how microbial communities assemble is a fundamental pursuit in ecology. This process determines the structure, function, and resilience of microbial ecosystems and is governed by the interplay between deterministic processes, which are non-random and niche-based, and stochastic processes, which are random and neutral [57]. For researchers investigating the impact of nutrient flows on oligotroph and copiotroph succession, discerning the balance between these forces is paramount. Oligotrophs, such as Acidobacteria, are slow-growing organisms adapted to nutrient-poor conditions, whereas copiotrophs, like many Actinobacteria and Firmicutes, thrive in nutrient-rich environments with fast growth rates [10]. This technical guide provides an in-depth analysis of the experimental frameworks and methodologies used to decode these community assembly rules, offering a structured toolkit for scientists and drug development professionals engaged in microbial ecology research.
Theoretical Framework: Stochasticity vs. Determinism
The assembly of any biological community is conceptualized as a process whereby species from a regional pool colonize a habitat and interact to form a local community. The following table summarizes the core ecological processes involved [57].
Table 1: Fundamental Ecological Processes in Community Assembly
| Process | Type | Definition |
|---|---|---|
| Selection | Deterministic | A niche-based process that shapes community structure due to fitness differences among organisms, driven by abiotic conditions (environmental filtering) and biotic interactions (e.g., competition, predation) [57]. |
| Dispersal | Both | The movement and successful colonization of organisms from one location to another. Can be stochastic (probabilistic) or deterministic (directed) [57]. |
| Drift | Stochastic | Random changes in the relative abundances of species within a community over time due to stochastic birth, death, and reproduction events [57]. |
| Diversification | Both | The evolutionary generation of new genetic variants, balancing speciation and extinction [57]. |
In the context of oligotroph and copiotroph succession, deterministic processes often manifest through environmental selection. For example, carbon nutrient flows are a key deterministic factor; copiotrophs dominate in environments with high labile carbon availability, while oligotrophs become more prevalent as carbon resources become more recalcitrant [10]. Conversely, stochastic processes like ecological drift and probabilistic dispersal can cause community compositions to diverge in ways that are independent of species' functional traits [57].
The diagram below illustrates the interaction of these processes in shaping microbial community assembly.
Quantitative Data and Analytical Approaches
Quantifying the relative contributions of stochastic and deterministic forces requires robust statistical models and the analysis of specific diversity patterns. Key metrics and models used in this quantification are summarized below.
Table 2: Analytical Models for Quantifying Assembly Processes
| Model/Analysis | Data Input | Output/Interpretation | Application Example |
|---|---|---|---|
| Neutral Community Model (NCM) | Species occurrence frequency & abundance [58] | Estimates the immigration rate and identifies which species fit a neutral expectation. | Quantifying the role of stochastic dispersal and drift in different soil aggregate sizes [58]. |
| Null Model Analysis | Observed community dissimilarity (beta-diversity) | Compares observed beta-diversity to a distribution expected by chance, yielding a value like the Normalized Stochasticity Ratio (NST). | An NST > 50% indicates dominance of stochastic assembly, while < 50% indicates determinism [57]. |
| Redundancy Analysis (RDA) / Mantel Test | Community composition & environmental variables | Quantifies the proportion of community variation explained by environmental factors (deterministic) versus spatial or unexplained factors (stochastic) [58]. | Linking shifts in bacterial communities to specific physicochemical gradients like pH and inorganic N [58]. |
Recent studies applying these models have yielded critical insights. For instance, in a vegetation primary succession chronosequence, a clear deterministic shift in microbial trophic strategies was observed. The copiotroph:oligotroph ratio decreased significantly as soil organic carbon quality declined from early (1.19 ± 0.16) to late (0.84 ± 0.09) successional stages [10]. This shift was directly linked to a change in ecosystem function, with the increasing oligotroph dominance correlating with higher microbial carbon use efficiency (CUE) [10]. Conversely, research on soil aggregates found that in small aggregates (<0.25 mm) under water-unsaturated conditions, deterministic processes prevailed, whereas dispersal limitation (a stochastic process) played a more significant role in larger aggregates [58].
Experimental Protocols and Methodologies
A Protocol for Investigating Assembly in Soil Aggregates
This protocol, adapted from a 2024 study, is designed to tease apart the effects of deterministic and stochastic processes across different microhabitats [58].
1. Sample Collection and Aggregate Fractionation:
- Collect bulk soil from the study site (e.g., surface 5-20 cm).
- Gently sieve the soil through a series of sieves to separate distinct aggregate fractions (e.g., >2 mm, 0.25-2 mm, and <0.25 mm). This process should be done with minimal disruption to preserve the aggregate structure.
2. Experimental Incubation Setup:
- Pack each aggregate fraction into separate experimental units (e.g., microcosms).
- Apply two distinct water potential regimes:
- Water-saturated condition: Maintains high water connectivity between pores.
- Water-unsaturated condition: Achieved by adjusting the water potential to a specific level (e.g., -10 kPa), which limits bacterial motility and dispersal.
- Incubate the systems under controlled temperature for a defined period (e.g., 14 days).
3. Sampling and Analysis:
- Destructively sample microcosms at multiple time points (e.g., days 0, 2, 7, 14).
- Physicochemical Analysis: For each sample, measure pH, electrical conductivity (EC), dissolved organic carbon (DOC), and inorganic nitrogen (N) content.
- DNA Extraction and Sequencing: Extract total genomic DNA from each aggregate sample. Amplify and sequence a phylogenetic marker gene (e.g., 16S rRNA for bacteria, ITS for fungi) using high-throughput sequencing.
- Bioinformatic Processing: Process raw sequences to cluster into Operational Taxonomic Units (OTUs) or Amplicon Sequence Variants (ASVs). Classify taxa and perform downstream statistical analyses.
4. Data Integration and Model Fitting:
- Use the sequencing data to calculate alpha and beta diversity indices.
- Fit the Neutral Community Model (NCM) to the species distribution data to estimate the immigration rate and the fraction of neutrally distributed taxa.
- Perform Redundancy Analysis (RDA) to partition the variance in community composition explained by the measured environmental variables.
Workflow for Tracking Trophic Succession
This workflow is ideal for studying oligotroph and copiotroph dynamics along environmental gradients, such as glacier retreat chronosequences [10].
1. Site Selection and Sampling:
- Identify a study area with a clear ecological gradient (e.g., a vegetation primary succession sequence).
- Establish replicate plots along the gradient.
- Collect soil cores from each plot for soil property and molecular analysis.
2. Soil and Microbial Property Measurement:
- Soil Chemical Analysis: Measure soil organic carbon (SOC), total nitrogen (TN), total phosphorus (TP), and pH.
- Carbon Quality Assessment: Quantify the labile and recalcitrant carbon pools, for instance, through acid hydrolysis.
- Microbial Carbon Use Efficiency (CUE): Determine CUE using an in-situ 13C-labeling approach (e.g., with 13C-glucose) and measuring the incorporation of 13C into microbial biomass versus its respiration as 13CO2.
3. Microbial Community Profiling:
- Conduct DNA sequencing as described in Section 4.1.
- Assign bacterial and fungal taxa to trophic strategies based on established literature (e.g., classifying Acidobacteria as oligotrophs and Firmicutes as copiotrophs).
4. Statistical Linking:
- Use correlation analysis (e.g., Structural Equation Modeling) to link changes in nutrient flows (independent variables) to the copiotroph:oligotroph ratio and, subsequently, to microbial CUE (dependent variable).
The following diagram visualizes the core experimental workflow for investigating community assembly.
The Scientist's Toolkit: Research Reagent Solutions
A successful investigation into community assembly requires a suite of carefully selected reagents and tools. The following table details essential items and their functions.
Table 3: Essential Research Reagents and Materials
| Category | Item | Specific Function / Example |
|---|---|---|
| Nucleic Acid Analysis | DNA Extraction Kits (e.g., MoBio PowerSoil Kit) | Extracts high-quality genomic DNA from complex environmental samples like soil, critical for downstream sequencing. |
| 16S rRNA & ITS Primers | Amplifies specific gene regions for bacterial (16S) and fungal (ITS) community profiling via PCR. | |
| Stable Isotope Tracers (e.g., 13C-Glucose) | Used to measure microbial carbon use efficiency (CUE) by tracking the incorporation of labeled substrate into biomass vs. respiration [10]. | |
| Physicochemical Analysis | Elemental Analyzer | Measures total carbon, nitrogen, and sulfur content in soil samples. |
| pH/EC Meter | Quantifies soil pH and electrical conductivity, key deterministic environmental filters. | |
| Computational Tools | QIIME 2, MOTHUR | Bioinformatic pipelines for processing and analyzing high-throughput sequencing data. |
| R packages (vegan, picante) | Statistical tools for calculating diversity indices, performing RDA, and fitting neutral models. |
Decoding the balance between stochastic and deterministic processes in microbial community assembly is a complex but achievable goal. By employing a combination of carefully designed experiments, such as manipulating micro-habitats and nutrient flows, and applying robust statistical models like the Neutral Community Model and null tests, researchers can effectively partition the influence of these forces. The integration of microbial trophic theory, particularly the oligotroph-copiotroph framework, provides a powerful lens through which to interpret these findings and predict subsequent ecosystem functioning, such as carbon stabilization. As the field advances, the experimental protocols and analytical toolkit outlined in this guide will be indispensable for researchers aiming to build a predictive understanding of microbial community dynamics.
Cross-System Validation: From Soil and Oceans to Clinical Implications
This technical guide addresses a critical interface in microbial and ecosystem ecology: the impact of nutrient flows on the succession of oligotrophic and copiotrophic microorganisms across key terrestrial ecosystems. Oligotrophs, exemplified by bacterial clades like Acidobacteria, are adapted to nutrient-poor conditions with slow growth rates and high-affinity nutrient uptake systems [1] [59]. In contrast, copiotrophs, such as many Proteobacteria and Bacteroidetes, thrive in nutrient-rich conditions, exhibiting rapid growth rates and lower-affinity transport systems [1] [59]. The dynamic interplay between these groups, driven by anthropogenic and natural nutrient enrichment, fundamentally influences ecosystem function, including carbon sequestration, nutrient retention, and organic matter decomposition.
This document provides a structured framework for validating these ecological principles through a synthesis of long-term experimental data, standardized methodological protocols, and quantitative models. Designed for researchers and scientists, the guide facilitates the design, implementation, and interpretation of studies on nutrient-mediated successional pathways in wetlands, forests, and riparian zones.
Theoretical Framework: Oligotroph and Copiotroph Dynamics
The divergent strategies of oligotrophs and copiotrophs are rooted in fundamental trade-offs in metabolic investment and nutrient transport efficiency [1].
Mechanistic Basis of the Dichotomy
The dichotomy is largely governed by trade-offs in nutrient transport systems. Copiotrophs often utilize phosphotransferase systems (PTS), which offer high uptake rates but lower affinity, making them suitable for nutrient-rich environments [1]. Oligotrophs, such as those in the SAR11 clade, predominantly rely on ATP-binding cassette (ABC) transporters. These systems use periplasmic binding proteins that act as highly effective nutrient scavengers [1].
A molecular-level model reveals that the half-saturation constant ((K_M)) for ABC transport is not an intrinsic property of the transporter alone but is a function of binding protein abundance [1]. This allows oligotrophs to achieve nanomolar-level affinity even with binding proteins that have only micromolar dissociation constants. However, this high-affinity strategy demands significant physiological costs: it requires a large periplasm and is limited by the slow diffusion of binding proteins, which inherently constrains maximum growth rates [1]. This trade-off between nutrient affinity and growth rate fundamentally shapes the assembly of microbial communities along nutrient gradients.
Ecosystem-Specific Validation and Protocols
Created Riverine Wetlands
Experimental Validation: A two-decade, whole-ecosystem study at the Olentangy River Wetland Research Park demonstrated that created marshes effectively retain nutrients and sequester carbon, with dynamics shaped by plant succession [60]. Over 19 years, these wetlands retained a significant mass of nutrients from river water inputs, with an average annual retention of 0.61 ± 0.18 g m⁻² P and 36 ± 6 g m⁻² N [60]. Carbon sequestration rates in surface sediments were measured at 180 to 250 g C m⁻² yr⁻¹, highlighting their role as carbon sinks [60]. The study compared a planted wetland with an unplanted control, finding that while planting accelerated initial succession, both basins eventually converged toward a community dominated by Typha spp., driven by the high-nutrient landscape of the U.S. Midwest [60].
Detailed Experimental Protocol:
- Site Setup: Establish two or more 1-ha flow-through wetland basins on a river floodplain. Implement a controlled pumping system to maintain a semi-natural hydrologic regime [60].
- Experimental Manipulation: Designate one wetland to be planted with native macrophytes and leave another as an unplanted control to monitor "self-design" [60].
- Long-Term Monitoring:
- Hydrology: Continuously monitor water stage, inflow, and outflow [60].
- Water Quality: Collect biweekly or monthly water samples from inlets and outlets. Analyze for nitrate (NO₃⁻), ammonium (NH₄⁺), phosphate (PO₄³⁻), total nitrogen (TN), and total phosphorus (TP) using standard automated colorimetric methods [60].
- Vegetation Succession: Conduct annual surveys of species composition and percent cover in permanent quadrats [60].
- Carbon Sequestration: Collect sediment cores annually. Determine bulk density and organic matter content via loss-on-ignition, then calculate carbon mass [60].
- Data Analysis:
- Calculate nutrient mass balance and retention efficiency.
- Analyze successional trends and their correlation with biogeochemical functions.
Table 1: Key Nutrient and Carbon Flux Data from a 20-Year Wetland Study [60]
| Parameter | Value (Mean ± SE) | Measurement Context |
|---|---|---|
| Water Flow Through Wetlands | 38.7 ± 1.5 m yr⁻¹ | Annual inflow, 1994-2012 |
| Nitrogen Retention | 36 ± 6 g N m⁻² yr⁻¹ | Mass retention from river water |
| Phosphorus Retention | 0.61 ± 0.18 g P m⁻² yr⁻¹ | Mass retention from river water |
| Carbon Sequestration Rate | 180 - 250 g C m⁻² yr⁻¹ | In surface sediments (0-35 cm depth) |
Montane Riparian Forests
Experimental Validation: Research along the Wenyu River in North China illustrates dynamic shifts in soil microbial communities during secondary succession from herbaceous cover to climax coniferous forests [59]. Soil organic carbon (SOC) and total nitrogen (TN) typically increase with successional age [59]. Microbial communities often transition from being dominated by oligotrophs (e.g., Acidobacteria) in early stages to copiotrophs (e.g., Proteobacteria) as nutrients accumulate, though a reversal back to oligotroph dominance can occur in late stages as more recalcitrant carbon compounds accumulate [59]. Fungal functional groups also shift, from saprotrophic dominance in early stages to a greater prevalence of arbuscular (AM) and ectomycorrhizal (ECM) fungi in later stages [59].
Detailed Experimental Protocol:
- Chronosequence Approach: Utilize a "space-for-time" substitution by identifying sites representing a sequence of successional stages (e.g., grassland, shrubland, pioneer forest, climax forest) [59].
- Soil Sampling: Collect soil cores from a standardized depth (e.g., 0-10 cm) within each successional stage. Sample across different microtopographic positions (e.g., floodplain vs. terrace) [59].
- Laboratory Analysis:
- Soil Physicochemistry: Analyze pH, SOC, TN, TP, and available nutrients (e.g., NH₄⁺, NO₃⁻, AP) [59].
- Microbial Community: Extract genomic DNA. Perform high-throughput sequencing of bacterial 16S rRNA and fungal ITS genes. Assign taxonomy and infer functional groups (e.g., copiotrophs/oligotrophs, saprotrophs, mycorrhizal fungi) [59].
- Enzyme Activities: Measure the activities of key extracellular enzymes related to C (e.g., β-1,4-glucosidase), N (e.g., N-acetyl-β-glucosaminidase), and P (e.g., acid phosphatase) cycles using microplate fluorometric or colorimetric assays [59] [61].
- Data Analysis:
- Use multivariate statistics (e.g., RDA, PERMANOVA) to link shifts in microbial community structure to soil property changes.
- Calculate enzyme stoichiometry to identify microbial nutrient limitations.
Table 2: Microbial and Soil Characteristics During Riparian Forest Succession [59]
| Successional Stage | Dominant Plant Types | Trends in Soil Nutrients | Shifts in Microbial Community |
|---|---|---|---|
| Early (Grassland) | Herbs (e.g., Carex lanceolata) | Low SOC and TN | Oligotrophs (e.g., Acidobacteria) dominant; high fungal saprotrophs |
| Shrub & Pioneer Forest | Sea-buckthorn, Poplar, Birch | Increasing SOC and TN | Transition to copiotrophs (e.g., Proteobacteria) |
| Late & Climax Forest | Mixed Spruce and Fir | High/recalcitrant SOC | Potential reversal to oligotrophs; rise of mycorrhizal fungi |
Early Secondary Succession Woody Ecosystems
Experimental Validation: A synthesis of four multi-year CO₂ enrichment experiments in temperate woody ecosystems revealed that elevated CO₂ stimulates net primary production (NPP), which in turn increases decadal-scale biomass increment [62]. Across these early-secondary-succession ecosystems, CO₂ enrichment increased biomass increment by 1.05 ± 0.26 kg C m⁻² over a decade, a 29.1 ± 11.7% stimulation compared to ambient conditions [62]. The response of biomass increment was predictable from the CO₂ response of NPP and a CO₂-independent linear relationship between biomass increment and cumulative NPP [62]. This highlights that while nutrient availability can modulate the initial NPP response, carbon allocation patterns (particularly to wood) are crucial for determining long-term carbon storage in biomass.
Detailed Experimental Protocol:
- Site Selection: Identify replicated experimental plots with documented histories of disturbance and succession. Ideal experiments involve multi-year ecosystem-scale CO₂ enrichment (e.g., using FACE or OTC technology) [62].
- Biogeochemical Measurements:
- Net Primary Production (NPP): Quantify all major components: woody biomass increment (using allometric equations), fine root production (e.g., via minirhizotrons or sequential coring), and litterfall (via regular collection in traps) [62].
- Plant Biomass: Conduct periodic destructive harvesting or use non-destructive allometric methods to track changes in above-ground and below-ground biomass over time [62].
- Foliar and Soil Nutrients: Analyze tissue and soil samples for N, P, and other key nutrients to assess nutrient limitation and use efficiency [62].
- Data Analysis:
- Model the relationship between cumulative NPP and biomass increment under ambient and elevated CO₂.
- Analyze trends in NPP, leaf area index (LAI), and fine-root biomass to infer successional stage and resource coupling [62].
The Scientist's Toolkit: Research Reagent Solutions
Table 3: Essential Reagents and Materials for Terrestrial Validation Studies
| Item | Function/Application | Example Protocol & Notes |
|---|---|---|
| Automated Flow Injection Analyzer (e.g., AutoAnalyzer-AA3) | Precise quantification of inorganic nitrogen species (NH₄⁺, NO₃⁻) in soil and water extracts [60] [61]. | Follow manufacturer's protocols for 2 M KCl soil extracts [61]. |
| Extracellular Enzyme Assay Reagents | Fluorogenic or colorimetric substrates (e.g., MUB-cellobioside for CB; MUB-N-acetyl-β-D-glucosaminide for NAG) to measure nutrient-acquisition potential [61]. | Use black microplates for fluorometric assays. Incubate with soil slurries in buffered solutions [61]. |
| DNA Extraction Kits (e.g., MoBio PowerSoil Kit) | Standardized isolation of high-quality microbial genomic DNA from complex soil and sediment matrices. | Critical for downstream 16S/ITS amplicon sequencing. Ensures reproducibility across samples. |
| High-Throughput Sequencing Reagents | Primers for 16S rRNA (bacteria) and ITS (fungi) regions for characterizing microbial community structure [59]. | Follow protocols from Illumina or other sequencing platforms. Include negative controls. |
| Isotopic Tracers (e.g., ¹⁵N-labeled compounds) | Tracing the fate of nutrients through ecosystem compartments and quantifying process rates (e.g., denitrification, N mineralization) [62]. | Requires specialized mass spectrometry (IRMS) for detection. |
Conceptual Workflows and Signaling Pathways
The following diagrams illustrate the core conceptual models and experimental workflows derived from the cited research.
Nutrient-Affinity Trade-off in Bacteria
Microbial Succession in Riparian Forests
Wetland Validation Experimental Workflow
The dynamics of nutrient availability fundamentally shape the structure and function of aquatic microbial communities. Within this context, the "Hunger Games" hypothesis provides a genomic framework for predicting microbial species abundance based on the interplay between nutrient supply, genomic traits, and ecological interactions [11]. This paradigm is central to understanding the contrasting worlds of nutrient-scarce pelagic environments and nutrient-rich coastal sediments. The hypothesis derives its name from the fierce competition for limited resources, where genomic traits determine survival and dominance [11]. The core principle classifies microorganisms along a life-history strategy continuum: copiotrophs are adapted to resource-rich conditions with fast growth rates, while oligotrophs thrive in nutrient-poor environments through efficient resource utilization [20]. This technical guide explores the validation of this hypothesis across aquatic ecosystems, providing methodologies and analytical frameworks for researchers investigating microbial succession patterns in response to nutrient flows.
Theoretical Framework: Genomic Traits and Nutrient Availability
The Genomic Basis of Life History Strategies
The ribosomal RNA (rrn) gene operon copy number serves as a key genomic predictor of bacterial life history strategies [11]. This trait is phylogenetically conserved and correlates with an organism's maximum growth rate and nutrient efficiency [20]. Copiotrophic organisms typically possess higher rrn copy numbers (e.g., 6-11 copies in Bacillales), enabling rapid protein synthesis and growth during nutrient pulses [11]. Conversely, oligotrophic specialists like the abundant SAR11 clade possess minimal rrn copy numbers (often just one copy), prioritizing metabolic efficiency over growth speed in nutrient-depleted conditions [11]. This fundamental trade-off between growth rate and nutrient utilization efficiency forms the mechanistic basis for the observed microbial community structures across nutrient gradients [20].
The "Hunger Games" Hypothesis
The "Hunger Games" hypothesis posits that the relationship between a microbial species' abundance and its rrn copy number is not fixed but depends on environmental nutrient availability [11]. This framework generates two testable predictions for aquatic systems. First, in nutrient-rich coastal sediments, the abundant biosphere should be dominated by high rrn copy number taxa (copiotrophs), with decreasing rrn copy numbers toward the rare biosphere. Second, in nutrient-scarce pelagic zones, the pattern should reverse, with low rrn copy number taxa (oligotrophs) dominating the abundant biosphere, and higher rrn copy numbers appearing in the rare biosphere [11]. This inversion reflects the fundamental adaptive strategies that determine microbial success under different nutrient regimes.
Table 1: Key Genomic and Ecological Traits Differentiating Microbial Life History Strategies
| Trait | Copiotrophs | Oligotrophs |
|---|---|---|
| rrn copy number | High (e.g., 6-11 in Bacillales) | Low (e.g., 1 in SAR11) |
| Growth strategy | Fast growth, rapid response to nutrients | Slow growth, maintenance metabolism |
| Nutrient affinity | Low | High |
| Dominant environment | Nutrient-rich (coastal sediments) | Nutrient-poor (pelagic zones) |
| Codon usage bias | Higher in ribosomal genes | Lower |
| Metabolic emphasis | Ribosome production for rapid protein synthesis | Efficient enzyme systems for nutrient scavenging |
Ecosystem Comparison: Pelagic vs. Coastal Sediment Environments
Environmental Characteristics and Nutrient Dynamics
The pelagic and coastal sediment environments represent contrasting extremes in the aquatic nutrient continuum. The pelagic zone, particularly the open ocean, is characterized by chronic nutrient scarcity, with limited inputs and strong stratification limiting nutrient recycling [63] [11]. In contrast, coastal sediments receive substantial nutrient subsidies from terrestrial runoff, riverine discharge, and organic matter deposition, creating resource-rich environments [11] [64]. The sediment-water interface constitutes a critical ecotone where intense biogeochemical transformations occur, functioning as both a sink and source of nutrients depending on environmental conditions [65] [64]. In shallow coastal systems, the benthic-pelagic coupling is particularly strong, with sediments contributing significantly to water column productivity through nutrient regeneration [64].
Community-Level Genomic Traits
Quantitative comparisons of community-level rrn copy numbers reveal stark contrasts between these environments. Coastal sediment communities exhibit significantly higher abundance-weighted average rrn copy numbers (2.74 ± 0.06, ranging from 1.59 to 7.61) compared to pelagic communities (1.54 ± 0.01, ranging between 1.39 and 2.53) [11]. This pattern persists even when considering phylogenetic structure, confirming the robust relationship between nutrient availability and genomic traits [11]. The abundant biosphere in coastal sediments is frequently dominated by taxa with high rrn copy numbers, including Bacillales (6-11 copies), Clostridiales (5 copies), and Alteromonadales (5 copies) [11]. Conversely, the abundant pelagic biosphere is dominated by SAR11 (1 copy) and other low rrn copy number taxa optimized for nutrient-poor conditions [11].
Table 2: Comparative Analysis of Microbial Communities in Coastal Sediment vs. Pelagic Zones
| Parameter | Coastal Sediment | Pelagic Zone |
|---|---|---|
| Nutrient status | Resource-rich (eutrophic) | Resource-scarce (oligotrophic) |
| Community rrn copy number | 2.74 ± 0.06 (higher) | 1.54 ± 0.01 (lower) |
| Abundant biosphere composition | Bacillales, Clostridiales, Alteromonadales | SAR11, other low rrn taxa |
| rrn copy number gradient | Decreases from abundant to rare biosphere | Increases from abundant to rare biosphere |
| Network negative associations | Higher (14.38% - 80.35%) | Minimal (0.04%) |
| Primary production base | Phytoplankton, benthic microalgae, organic matter deposition | Phytoplankton (limited to epipelagic) |
Ecological Interaction Networks
Analysis of microbial association networks reveals fundamentally different interaction patterns between these ecosystems. Coastal sediment communities exhibit substantially higher proportions of negative associations (indicating competition or co-exclusion), ranging from 14.38% to 80.35% across different locations [11]. In striking contrast, pelagic communities show minimal negative associations (approximately 0.04%) [11]. This suggests that competitive interactions are a dominant structuring force in resource-rich sediments, while pelagic systems may be characterized by more non-competitive coexistence or cooperation among specialists adapted to different micronutrient niches. These network structures provide insights into how biotic interactions reinforce the community patterns predicted by the Hunger Games hypothesis.
Methodological Framework: Experimental Protocols and Validation
Field Sampling and Metagenomic Analysis
Comprehensive validation of the Hunger Games hypothesis requires integrated field sampling and laboratory analysis. The following protocol outlines a standardized approach for comparative aquatic microbial ecology:
Site Selection and Sampling: Collect samples from paired coastal sediment and pelagic environments. For sediments, use a box corer to obtain undisturbed sediment cores and collect overlying water 0.5m above the sediment-water interface [64]. For pelagic samples, employ Niskin bottles or similar sampling devices at multiple depth intervals [11].
Sample Processing: Immediately filter water samples through pre-cleaned 0.45μm acetate cellulose filters (pre-treated with dilute HCl and rinsed with Milli-Q water) [64]. Preserve filters and sediment subsamples at -80°C until DNA extraction.
DNA Extraction and Sequencing: Extract total genomic DNA using standardized kits (e.g., Fast DNA SPIN for Soil Kit with subsequent purification) [20]. Prepare metagenomic libraries using quality-controlled approaches (e.g., QIAseq FX DNA Library Kit) and sequence on Illumina platforms (2 × 150 bp recommended) [20].
Bioinformatic Processing:
- Quality trim reads using Trimmomatic or similar tools [20].
- Perform de novo assembly with Megahit or comparable assemblers [20].
- Predict protein-coding genes on contigs >500bp using Prodigal [20].
- Annotate genes against reference databases (KEGG, eggNOG) [20].
- Calculate rrn copy numbers using the rrnDB database and custom scripts [11].
Nutrient Manipulation Experiments
Microcosm experiments provide critical causal evidence linking nutrient availability to community dynamics. The following protocol tests core predictions of the Hunger Games hypothesis:
Experimental Setup: Establish replicate microcosms containing either sediment cores with overlying water or pelagic water samples. Maintain appropriate temperature, light, and mixing conditions matching field environments [11].
Nutrient Treatments: Apply three treatment regimes:
- Control: Ambient nutrient conditions
- Nutrient Enrichment: Add C, N, and P (e.g., as acetate, nitrate, and phosphate) to achieve elevated concentrations
- Nutrient Reduction: Implement carbon starvation or use nutrient-scavenging resins
Incubation and Monitoring: Incubate for multiple generations (typically 4-8 weeks), periodically monitoring nutrient concentrations (NO₃⁻, NH₄⁺, PO₄³⁻, DOC), dissolved oxygen, and other relevant parameters [65] [64].
Endpoint Analysis: Process final samples for metagenomic sequencing as described in Section 4.1. Specifically analyze shifts in rrn copy number distribution, community composition, and network associations in response to nutrient manipulations [11].
Flux Measurements at Sediment-Water Interface
For benthic-pelagic coupling studies, quantify nutrient fluxes across this critical interface:
In-situ Incubation: Use chamber/lander systems deployed directly on the sediment surface. Incubate for controlled periods (e.g., 3-10 minutes) while measuring concentration changes in the enclosed overlying water [64].
Laboratory Core Incubation: Collect intact sediment cores and incubate in controlled laboratory conditions. Sample overlying water at timed intervals to calculate flux rates based on concentration changes [64].
Porewater Gradient Method: Collect sediment cores and section for porewater extraction. Determine concentration gradients of nutrients (NO₃⁻, NH₄⁺, PO₄³⁻) across the sediment-water interface. Calculate diffusive fluxes using Fick's first law, with appropriate corrections for bioturbation and bioirrigation [64].
Analytical Measurements: Analyze nutrient concentrations using standard methods - NO₃⁻ and NH₄⁺ via colorimetric techniques, PO₄³⁻ by ascorbic acid method, and DOC by high-temperature catalytic oxidation [65].
Essential Research Tools and Reagents
Table 3: Research Reagent Solutions for Aquatic Microbial Ecology Studies
| Reagent/Kit | Specific Function | Application Context |
|---|---|---|
| Fast DNA SPIN for Soil Kit | Extraction of genomic DNA from complex environmental matrices | DNA extraction from coastal sediments and water filters [20] |
| DNeasy PowerClean Pro Cleanup Kit | Purification of environmental DNA to remove inhibitors | Post-extraction purification for metagenomic sequencing [20] |
| QIAseq FX DNA Library Kit | Preparation of Illumina-compatible sequencing libraries | Metagenomic library construction from environmental DNA [20] |
| Acetate Cellulose Filters (0.45μm) | Filtration and collection of microbial biomass from water samples | Preparation of pelagic and overlying water samples for DNA analysis [64] |
| Chamber/Lander Incubation Systems | In-situ measurement of benthic nutrient fluxes | Quantifying sediment-water interface exchanges [64] |
| GhostKOALA/eggNOG-mapper | Functional annotation of metagenomic genes | Metabolic pathway analysis and functional profiling [20] |
| rrnDB Database | Reference database of ribosomal RNA operon information | Estimating rrn copy numbers from metagenomic data [11] |
Data Analysis and Interpretation Framework
Calculation of Community-Level Traits
Derivation of ecologically relevant metrics from metagenomic data requires standardized computational approaches:
Community-level rrn copy number: Calculate as the abundance-weighted average of rrn copy numbers across all community members [11]. This integrates both taxonomic composition and relative abundance data into a single ecosystem trait.
Codon usage bias: Compute using the effective number of codons (ENC') metric, particularly for ribosomal genes. Higher bias indicates translational selection characteristic of copiotrophic strategies [20].
Predicted maximum growth rate: Infer from codon usage bias patterns using established algorithms [20].
Network analysis: Construct microbial association networks using Random Matrix Theory (RMT) approaches. Calculate positive (co-occurrence) and negative (co-exclusion) associations to infer potential ecological interactions [11].
Statistical Validation Approaches
Robust statistical frameworks are essential for hypothesis testing:
Correlation analysis: Examine relationships between community-level rrn copy numbers and environmental nutrient concentrations (NO₃⁻, NH₄⁺, PO₄³⁻) using Pearson's correlation [11].
Partial Mantel tests: Assess trait-environment relationships while controlling for phylogenetic structure [11].
Comparative analysis: Test for significant differences in rrn copy numbers between abundant and rare biospheres using ANOVA or non-parametric equivalents [11].
Multivariate statistics: Apply PERMANOVA and other multivariate techniques to partition variance between nutrient treatments and other environmental factors.
The validation of the Hunger Games hypothesis across pelagic and coastal sediment environments provides a predictive framework for understanding microbial community responses to nutrient flows. The inverse relationship between rrn copy number patterns in these ecosystems demonstrates how genomic traits interact with environmental conditions to determine species abundance distributions. This mechanistic understanding has significant implications for predicting ecosystem responses to anthropogenic nutrient enrichment, climate change, and other disturbances that alter nutrient regimes. The experimental and analytical frameworks presented in this technical guide provide researchers with standardized approaches for further testing and applying these concepts across diverse aquatic systems, ultimately enhancing our ability to model and manage microbial processes in a changing world.
Microbial community assembly and species abundance are governed by a complex interplay between universal physiological rules and context-dependent environmental factors. This analysis, framed within the impact of nutrient flows on oligotroph and copiotroph succession, synthesizes findings from controlled laboratory experiments and field observations. Evidence confirms that genomic traits such as ribosomal RNA gene (rrn) copy number provide a predictive framework for microbial abundance across nutrient gradients. However, the manifestation of these rules is heavily modulated by historical contingencies, ecological interactions, and specific nutrient compositions. This whitepaper provides a comprehensive technical guide, integrating quantitative data summaries, experimental protocols, and visual frameworks to elucidate the principles governing microbial community structure.
A fundamental challenge in microbial ecology is discerning universal principles from context-dependent outcomes in community assembly. The succession of oligotrophic and copiotrophic strategists—microbes with distinct nutrient uptake and growth capabilities—serves as a critical model for understanding this dichotomy. Copiotrophs, adapted to nutrient-rich conditions, typically possess high rrn copy numbers, enabling rapid growth, while oligotrophs, dominant in nutrient-poor environments, have low rrn copy numbers and excel at nutrient scavenging [1] [66]. Nutrient flows directly impact the selection for these life-history strategies, shaping community composition. This document reviews the evidence for universal rules, such as those based on genomic traits, and the contextual factors that cause deviations from these predictions, providing researchers with the methodological toolkit to explore these dynamics further.
Core Concepts and Definitions
Microbial Life-History Strategies
- Oligotrophs: Organisms adapted to nutrient-scarce environments. They are characterized by slow growth rates, high-affinity nutrient uptake systems (e.g., ABC transporters), and typically possess a low number of ribosomal RNA gene (rrn) copies in their genome (e.g., 1 copy in SAR11) [1] [66].
- Copiotrophs: Organisms that thrive in nutrient-rich conditions. They exhibit a "feast-or-famine" lifestyle, with the potential for rapid growth, often mediated by phosphotransferase system (PTS) transporters and a high number of rrn copies [1] [66].
- Rare Biosphere: The vast majority of microbial taxa in a community that exist at low relative abundances. Their presence is critical for community dynamics and functional resilience [66].
- Abundant Biosphere: The small fraction of microbial taxa that constitute the majority of a community's relative abundance [66].
Foundational Ecological Theories
- Growth Rate Hypothesis: Posits that fast-growing organisms require a high phosphorus allocation to manufacture P-rich ribosomes, linking growth rate, rRNA, and nutrient demand [66].
- Historical Contingency: The idea that the initial composition and state of a community can steer its subsequent assembly and final state through priority effects and biotic interactions, leading to multiple stable states [67].
- Nutrient Dominance: In mixed-nutrient environments, the community composition may disproportionately resemble the community from a single, "dominant" nutrient, rather than being a simple blend of the two [68].
Universal Rules: Genomic Traits as Predictors
Genomic traits, particularly the rrn copy number, offer a powerful, universal metric for predicting microbial abundance patterns across global nutrient gradients.
The rrn Copy Number as a Bioindicator
The rrn copy number is a phylogenetically conserved genomic trait strongly correlated with an organism's maximum potential growth rate and nutrient demand [66]. This makes it a robust predictor for a taxon's abundance in different environments.
Table 1: Global Patterns of rrn Copy Number in Microbial Biospheres
| Environment | Nutrient Status | Abundant Biosphere rrn Copy No. | Rare Biosphere rrn Copy No. | Dominant Taxa (Examples) |
|---|---|---|---|---|
| Coastal Sediments | Nutrient-rich | High (e.g., 3-11) [66] | Low [66] | Bacillales, Alteromonadales, Flavobacteriales [66] |
| Ocean Water (Pelagic) | Nutrient-scarce | Low (e.g., 1, as in SAR11) [66] | High [66] | SAR11, Sphingopyxis alaskensis [1] [66] |
As shown in Table 1, the relationship between rrn copy number and abundance is inverted between nutrient-rich and nutrient-poor environments. This supports a universal rule: community-level weighted mean rrn copy number is positively correlated with environmental nutrient availability [66]. This correlation holds across diverse habitats, from coastal sediments to the open ocean.
A Predictive Null Model for Community Assembly
A universal, additive null model can predict family-level community composition in mixed-nutrient environments with remarkable accuracy. This model posits that the relative abundance of a taxon in a mix of two nutrients is the weighted sum of its abundances in each nutrient alone [68].
The mathematical formulation is:
fi,12(null) = w1 fi,1 + w2 fi,2
Where fi,12(null) is the predicted relative abundance of family i in the nutrient mix, fi,1 and fi,2 are its relative abundances in each single nutrient, and w1 and w2 are the relative proportions of cells supported by each nutrient [68]. The high correlation (Pearson’s R = 0.95) between this null model's predictions and observed compositions suggests a underlying additivity in how nutrients independently recruit taxa [68].
Context-Dependent Responses and Deviations
Despite the power of universal rules, systematic deviations are common and reveal the critical role of context.
Historical Contingency and Priority Effects
Initial community composition can have long-lasting, deterministic effects on the trajectory and final state of a community. In pitcher plant microcosm experiments, the richness of a community after only three days of adjustment to lab conditions was a strong predictor (R² = 0.9008, p < 0.0001) of its richness after 63 days of assembly, despite convergence in some functions like respiration [67]. This demonstrates that early differences can propagate to mature communities, conditioning their functional repertoire. The same species can exhibit different dynamics depending on the community context, a phenomenon known as the "conditioning of the environment" [67].
Nutrient Interactions and Dominance
Deviations from the additive null model are not random. Systematic patterns of nutrient dominance occur, where the community in a mixed-nutrient environment more closely resembles the community from one of the two single nutrients [68]. For example, in sugar-organic acid pairs, the resulting community is generally more similar to the sugar-alone community than the acid-alone community [68]. Furthermore, pairs of similar nutrients (e.g., two sugars) are more additive than pairs of dissimilar nutrients (e.g., a sugar and an organic acid) [68].
Ecological Interactions and Network Topology
Interspecies interactions, inferred from co-occurrence networks, are context-dependent and vary with nutrient availability. In nutrient-rich coastal sediments, microbial networks exhibit a higher proportion of negative associations (potential competition or co-exclusion) compared to the nutrient-scarce pelagic ocean [66]. This suggests that nutrient scarcity may reduce competitive exclusion, allowing for more co-existing species. These networks display non-random, complex properties like modularity, indicating that biotic interactions are a key contextual factor shaping abundance patterns [66].
Experimental Protocols and Methodologies
Serial Transfer Enrichment Protocol
This foundational method is used to study microbial community assembly in defined nutrient conditions [68] [67].
Title: Microbial Community Assembly Workflow
Detailed Procedure:
- Inoculation: A natural microbial community (e.g., from soil or pitcher plant fluid) is inoculated into a synthetic minimal medium (e.g., M9) where a single carbon source or a mixture is the growth-limiting nutrient [68] [67].
- Incubation: Cultures are incubated under controlled conditions (e.g., temperature, shaking) for a set period, typically 48-72 hours [68] [67].
- Serial Transfer: A small aliquot (e.g., 1% v/v) of the culture is transferred to fresh, sterile medium. This transfer dilutes the community (e.g., 125-fold) and is repeated for multiple cycles (e.g., 10-21 transfers) to allow for community stabilization and selection [68] [67].
- Monitoring and Harvesting: Community density (e.g., via optical density) and composition (via DNA extraction and 16S rRNA gene amplicon sequencing) are tracked over time. The stabilized community is harvested for detailed analysis [67].
Nutrient Manipulation Experiments in Microcosms
This protocol tests the direct effect of nutrient availability on established communities.
Title: Nutrient Perturbation Experiment Design
Detailed Procedure:
- Microcosm Setup: Natural microbial communities are collected from the environment of interest (e.g., coastal sediment, ocean water) and established in replicate microcosms with a baseline nutrient medium [66].
- Nutrient Amendment: Treatments are applied to the microcosms. These can include:
- Control: No nutrient addition.
- Carbon Addition: Addition of a bioavailable carbon source (e.g., glucose).
- NP Addition: Addition of nitrogen (e.g., NH₄Cl) and phosphorus (e.g., KH₂PO₄) [66].
- Incubation and Sampling: Microcosms are incubated, and samples are taken at multiple time points. DNA is extracted for sequencing and community-level rrn copy number calculation. Association networks are constructed from sequence count data to infer ecological interactions [66].
The Scientist's Toolkit: Research Reagent Solutions
Table 2: Essential Materials and Reagents for Microbial Succession Studies
| Item | Function/Application | Specific Example(s) |
|---|---|---|
| Synthetic Minimal Medium | Provides a defined, nutrient-controlled environment for community assembly. | M9 medium [68] |
| Defined Carbon Sources | Serves as the growth-limiting nutrient to select for specific metabolic strategies. | Glucose, ribose, fructose (sugars); Succinate, fumarate (organic acids); Glutamine, glycine (amino acids) [68] |
| DNA Extraction Kit | Isolates high-quality genomic DNA from microbial communities for downstream analysis. | Various commercial kits (e.g., MoBio PowerSoil Kit) |
| 16S rRNA Gene Primers & Reagents | Amplifies a standardized genomic region for taxonomic identification via sequencing. | 515F/806R primers, PCR master mix [67] |
| Chitin/Substrate Analogs | Measures specific functional potential, such as chitin degradation in pitcher plant systems. | Fluorescently-tagged chitin [67] |
| Nutrient Salts | Used in nutrient amendment experiments to manipulate N and P availability. | NH₄Cl (Nitrogen source), KH₂PO₄ (Phosphorus source) [66] |
Integrated Conceptual Framework
The interplay between universal rules and context-dependent factors can be synthesized into a single conceptual model, which we term the "Hunger Games" Framework [66].
Title: Hunger Games Microbial Ecology Framework
This framework illustrates how environmental nutrient availability acts as a primary filter, selecting for microbes with matching genomic traits (the universal rule). The resulting community structure is then modulated by contextual factors like historical accidents and species interactions. The final outcome—whether a community converges to a predictable state or diverges into multiple stable states—depends on the relative strength of the universal selector versus the contextual modulators [68] [67] [66].
The assembly and abundance of microbial communities are not entirely stochastic nor perfectly predictable. Universal rules, grounded in genomic traits like rrn copy number and metabolic trade-offs of nutrient transport systems, provide a powerful predictive framework for microbial succession, particularly in relation to nutrient flows and the oligotroph-copiotroph dynamic. However, these rules operate within a context defined by historical contingency, specific nutrient interactions, and emergent ecological networks. For researchers and drug development professionals, this implies that while general principles can guide expectations, a comprehensive understanding requires empirical investigation of the specific system in question, utilizing the experimental and analytical tools outlined in this guide.
Soil microorganisms are critical engines of Earth's biogeochemical cycles, whose growth, activity, and interactions with the environment largely control the fate of recent plant carbon inputs as well as protected soil organic carbon [69] [70]. The functional strategies of these microbial communities—broadly categorized into copiotrophic (r-strategist) and oligotrophic (K-strategist) lifestyles—serve as a fundamental organizer of ecosystem outcomes including carbon sequestration, decomposition rates, and overall stability [71] [69] [11]. Copiotrophs are typically fast-growing organisms that thrive in nutrient-rich conditions, achieve high maximum growth rates, and are associated with rapid decomposition of labile carbon compounds [69] [35]. In contrast, oligotrophs are slow-growing, efficient organisms that persist in nutrient-poor environments, often utilizing more recalcitrant carbon substrates [69] [11]. The balance between these strategies is profoundly influenced by nutrient availability, creating a dynamic interplay that governs carbon cycling across terrestrial ecosystems [71] [72] [11]. This technical guide synthesizes current research on how microbial life strategies regulate ecosystem functions, with particular emphasis on the contextual role of nutrient flows in succession dynamics between oligotrophic and copiotrophic regimes.
Theoretical Frameworks: Defining Microbial Life History Strategies
Conceptual Foundations and Trait-Based Classification
Microbial life history strategies represent sets of traits that correlate due to physiological or evolutionary tradeoffs, with different strategies favored under different environmental conditions [69]. These tradeoffs form the theoretical basis for predicting microbial contributions to ecosystem processes:
- The Growth Rate-Yield Tradeoff: Metabolic investments in resource acquisition can reduce the efficiency of cellular growth [69]. This fundamental tradeoff distinguishes copiotrophs (high growth rate, lower yield) from oligotrophs (lower growth rate, higher yield) and directly influences carbon use efficiency (CUE)—a key determinant of soil carbon storage [69] [53].
- The Copiotroph-Oligotroph Spectrum: This continuum classifies microorganisms based on substrate preferences, trophic strategy, and growth rates, serving as a microbial analog to r- and K-selection theory from macroecology [69] [11]. The ribosomal RNA gene operon (rrn) copy number provides a genomic trait marker along this spectrum, with copiotrophs typically possessing higher rrn copy numbers than oligotrophs [11] [35].
- Y-A-S Framework (Yield-Acquisition-Stress Tolerance): A refined life history theory proposes three primary microbial strategies: high yield (Y), resource acquisition (A), and stress tolerance (S) along two main axes of environmental variation: resources and abiotic stress [69]. This framework helps predict species distributions and their functional contributions under varying environmental conditions.
Table 1: Key Traits Differentiating Microbial Life History Strategies
| Trait | Copiotroph (r-strategist) | Oligotroph (K-strategist) |
|---|---|---|
| Growth Rate | High | Low |
| Substrate Preference | Labile, nutrient-rich | Recalcitrant, nutrient-poor |
| Carbon Use Efficiency | Context-dependent [53] | Context-dependent [53] |
| rrn Copy Number | High (e.g., 6-11) [11] | Low (e.g., 1-4) [11] |
| Nutrient Demand | High | Low |
| Response to Disturbance | Rapid growth post-disturbance | Slow recovery |
| Dominant Environments | Early succession, nutrient-rich [35] | Late succession, nutrient-poor [35] |
Diagram: Microbial Life History Strategies Along Environmental Gradients
Quantitative Evidence: Microbial Strategies Regulating Ecosystem Outcomes
Carbon Sequestration and Microbial Community Dynamics
Empirical studies across diverse ecosystems demonstrate how microbial life strategies directly influence carbon sequestration through multiple mechanisms:
- Forest Thinning Experiments: In shelter forests of northern China, thinning reduced soil phosphorus limitation, driving a microbial community shift from K- to r-strategists. This shift was associated with increased soil organic carbon (SOC) sequestration, though carbon use efficiency remained unchanged due to simultaneous increases in carbon limitation [71]. The study found the relative abundance of r-strategist fungi increased significantly after thinning, particularly in Mucoromycota and Mortierellomycota, which correlated with higher SOC storage.
- Ecological Restoration Gradients: During desertification reversal in sandy ecosystems, microbial communities progressively shifted their life history strategies as nutrient conditions improved. Researchers observed that microbial biomass carbon increased by 45-68% along the restoration gradient from mobile dunes to sparse forest grassland, with the most significant shifts occurring when SOC:TN ratios stabilized below 25:1 [72]. This transition enabled more efficient carbon stabilization through microbial necromass formation.
- Carbon Use Efficiency (CUE) Dynamics: CUE represents the fraction of carbon uptake allocated to biomass production rather than respiration [53]. Meta-analyses reveal CUE varies substantially across ecosystems (forests: 0.1-0.3; grasslands: 0.2-0.4; croplands: 0.2-0.35) due to differences in microbial community composition and nutrient availability [53]. The CUE value is highly method-dependent, with isotopic labeling (13C, 18O) and stoichiometric modeling approaches yielding different absolute values and sometimes even contrasting relationships with environmental drivers [53].
Table 2: Ecosystem Outcomes Linked to Microbial Life Strategies Across Studies
| Ecosystem Context | Experimental Manipulation | Microbial Response | Ecosystem Outcome |
|---|---|---|---|
| Shelter Forests [71] | Thinning intensity | Shift from K- to r-strategists; Increased r-strategist fungi | ↑ SOC sequestration; ↓ P limitation |
| Desertification Reversal [72] | Vegetation restoration (5-25+ years) | Shift from oligotrophs to copiotrophs as nutrients increased | Stronger SOC-TN-TP correlations; ↑ C stabilization |
| Marine Systems [11] | Natural nutrient gradient (coastal to open ocean) | Higher rrn copy numbers in abundant biosphere in nutrient-rich sediments | Positive abundance-rrn correlation in high nutrients |
| Dilution-to-Extinction [35] | Diversity reduction via dilution | Copiotroph selection at high dilution; rare species loss | Specialized functions impaired; broad functions maintained |
Decomposition Processes and Temporal Stability
The relationship between microbial life strategies and decomposition dynamics involves complex interactions between community composition, substrate quality, and environmental conditions:
- Litter Decomposition Modeling: Integrating empirical microbial community data into the MIcrobial-MIneral Carbon Stabilization (MIMICS) model demonstrated that representing copiotroph-to-oligotroph ratios improved predictions of leaf litter decomposition under climate change scenarios [36]. Model calibrations that incorporated microbial community data projected up to 5% greater climate change-induced litter mass loss compared to traditional approaches, with implications for carbon cycle-climate feedbacks.
- Temporal Stability Mechanisms: Biodiversity experiments demonstrate that diverse microbial communities stabilize ecosystem functions through asynchronous responses of different taxa to environmental fluctuations [73]. In plant-soil mesocosms, reductions of over 50% in microbial richness led to destabilized plant productivity, plant diversity, litter decomposition, and soil carbon assimilation, with sterile treatments showing "boom and bust" dynamics dominated by a single grass species [73].
- Nutrient Limitation Dynamics: extracellular enzyme stoichiometry reveals how microbial communities adjust resource acquisition strategies based on nutrient limitations. In forest ecosystems, thinning altered microbial resource limitations, reducing phosphorus limitation while increasing carbon limitation, which subsequently influenced life history strategy dominance [71]. These shifts in nutrient limitation directly impact the microbial carbon pump efficiency—the process by which microbial assimilated carbon becomes stabilized in soils [71].
Methodological Approaches: Experimental Protocols and Techniques
Core Methodologies for Investigating Microbial Life Strategies
Dilution-to-Extinction (DTE) Experiments
Protocol Purpose: To manipulate microbial diversity and establish biodiversity-ecosystem functioning relationships by selectively removing rare taxa [35].
Detailed Methodology:
- Sample Collection: Collect natural microbial communities from target environment (e.g., lake water, soil suspensions).
- Size Filtration: Sequentially filter through 5-μm and 0.8-μm membranes to exclude microeukaryotes and larger particles.
- Dilution Series: Prepare serial dilutions (typically 1:10 dilution factors) in sterilized background medium.
- Incubation: Incubate diluted communities under controlled conditions with periodic shaking for oxygen exchange.
- Sampling: Monitor cell density regularly and harvest biomass for molecular analysis after a regrowth period (typically 8-14 days).
- DNA Extraction & Sequencing: Extract microbial DNA, amplify 16S rRNA genes (e.g., with 515F/806R primers), and perform high-throughput sequencing.
- Bioinformatic Analysis: Process sequences to determine operational taxonomic units (OTUs), predict rrn copy numbers from databases, and calculate community-weighted traits [35].
Technical Considerations: DTE experiments selectively favor copiotrophs at high dilution levels due to reduced competition and relatively high nutrient availability, which must be accounted for in interpreting biodiversity-ecosystem functioning relationships [35].
Enzyme Stoichiometry and Vector Analysis
Protocol Purpose: To quantify microbial nutrient limitations and resource acquisition strategies through extracellular enzyme activities [71] [72].
Detailed Methodology:
- Soil Sampling: Collect fresh soil samples (0-20 cm depth), homogenize, and sieve to 2 mm.
- Enzyme Assays: Conduct fluorometric assays for carbon-acquiring enzymes (β-glucosidase, β-xylosidase), nitrogen-acquiring enzymes (N-acetyl-glucosaminidase, leucine aminopeptidase), and phosphorus-acquiring enzymes (acid phosphatase).
- Activity Calculation: Calculate enzyme activities based on standard curves (nmol·g⁻¹·h⁻¹).
- Stoichiometric Ratios: Determine enzyme C:N, C:P, and N:P ratios.
- Vector Analysis: Compute vector length (indicating C limitation) and vector angle (indicating P vs N limitation) using the formulas:
- Vector length = √(ln(C enzyme)² + (ln(N enzyme)²) / √2
- Vector angle = degrees(arctan(ln(N enzyme)/ln(P enzyme))) [71]
Applications: This approach revealed that thinning in shelter forests reduced phosphorus limitation (decreased vector angle) while increasing carbon limitation (increased vector length), driving shifts in microbial life history strategies [71].
Diagram: Experimental Workflow for Microbial Strategy Research
The Scientist's Toolkit: Essential Research Reagents and Materials
Table 3: Key Research Reagents and Methodologies for Microbial Life Strategy Research
| Reagent/Material | Function/Application | Technical Considerations |
|---|---|---|
| Isopore Membrane Filters (0.2-5 μm) | Size-based fractionation of microbial communities; biomass collection [35] | Different pore sizes select for different microbial groups; 0.2 μm retains most bacteria |
| FastDNA Spin Kit for Soil | DNA extraction from complex environmental matrices | Effective for difficult-to-lyse microorganisms; consistent yield required for comparative studies |
| 18O-Labeled Water | Measurement of in situ microbial growth and carbon use efficiency [53] | Avoids substrate addition artifacts; technically demanding with assumptions about DNA:biomass ratio |
| 13C/14C-Labeled Substrates | Tracing substrate-specific microbial metabolism and CUE [53] | Choice of substrate influences results; reflects only active fraction of community |
| Fluorometric Enzyme Substrates (MUB/MUC conjugates) | Quantifying extracellular enzyme activities for nutrient acquisition [71] [72] | Standardized protocols essential for cross-study comparisons; pH and temperature control critical |
| rrnDB Database | Predicting rrn copy numbers from taxonomic information [11] [35] | Enables inference of copiotroph/oligotroph ratios from sequence data; requires careful taxonomic assignment |
| MIMICS Model | Microbial-explicit modeling of carbon cycling [36] | Incorporates copiotroph-oligotroph dynamics; allows testing of mechanistic hypotheses |
The interplay between microbial life history strategies and ecosystem functioning represents a critical frontier in microbial ecology with significant implications for carbon cycling, climate feedbacks, and ecosystem management. Evidence across diverse ecosystems consistently demonstrates that nutrient availability serves as a primary driver of succession between oligotrophic and copiotrophic strategies, which in turn regulates carbon sequestration potential, decomposition rates, and temporal stability of ecosystem functions [71] [72] [11]. The ribosomal RNA operon copy number emerges as a valuable genomic predictor of these life history strategies, with higher copy numbers associated with copiotrophic lifestyles dominant in high-nutrient conditions [11] [35].
Methodologically, the field is advancing toward more integrated approaches that combine molecular techniques, enzyme stoichiometry, and microbial-explicit modeling [36] [53]. However, important challenges remain, including the method-dependent nature of CUE measurements and the context-dependent outcomes of microbial community manipulations [53] [35]. Future research should prioritize: (1) standardized protocols for assessing microbial life strategies across ecosystems, (2) long-term experiments tracking microbial succession and ecosystem outcomes, and (3) improved integration of microbial trait data into ecosystem and Earth system models. As recognition grows of microbes as vital allies in addressing climate change [74], understanding and harnessing the relationships between microbial life strategies and ecosystem functioning will become increasingly crucial for informing climate-smart ecosystem management and conservation practices.
Conclusion
The succession of oligotrophs and copiotrophs is a fundamental ecological process directly regulated by nutrient flows, with profound implications for ecosystem functioning and stability. Key takeaways confirm that these microbial strategies are underpinned by distinct genomic, physiological, and metabolic trade-offs. Methodologically, the integration of genomic traits like rrn copy number into models and the careful application of techniques like DTE are powerful, yet require vigilance against selection biases. Validated across diverse ecosystems, these dynamics influence critical processes from carbon cycling to decomposition pathways. For biomedical research and drug development, these principles offer a new lens through which to view clinical microbiomes. Future directions should focus on harnessing these ecological rules to manipulate microbial communities for therapeutic ends, such as promoting health-associated oligotrophs or disrupting pathogenic copiotrophs, and on exploring the role of nutrient availability in antibiotic efficacy and resistance evolution.
References
- 1. Mechanistic model of nutrient uptake explains dichotomy ... [https://pmc.ncbi.nlm.nih.gov/articles/PMC8168909/]
- 2. Shaping of microbial phenotypes by trade-offs - PMC [https://pmc.ncbi.nlm.nih.gov/articles/PMC11102524/]
- 3. Oligotrophs versus copiotrophs [https://pubmed.ncbi.nlm.nih.gov/11462219/]
- 4. Slower growth of Escherichia coli leads to longer survival ... [https://pmc.ncbi.nlm.nih.gov/articles/PMC7273699/]
- 5. An RNA sponge directs the transition from feast to famine ... [https://www.nature.com/articles/s41467-025-65274-1]
- 6. The selection of copiotrophs may complicate biodiversity ... [https://pmc.ncbi.nlm.nih.gov/articles/PMC10024408/]
- 7. Shifting of nutrient limitation dominates the recovery ... [https://www.sciencedirect.com/science/article/abs/pii/S0048969723040019]
- 8. rrndb: the Ribosomal RNA Operon Copy Number Database [https://pmc.ncbi.nlm.nih.gov/articles/PMC29826/]
- 9. Microbial Carbon Use Efficiency and Growth Rates in Soil [https://pubmed.ncbi.nlm.nih.gov/39834337/]
- 10. Microbial assemblies with distinct trophic strategies drive ... [https://www.sciencedirect.com/science/article/abs/pii/S0048969723002024]
- 11. Nutrient supply controls the linkage between species ... [https://www.nature.com/articles/s41467-021-27857-6]
- 12. Variability of rRNA Operon Copy Number and Growth Rate ... [https://www.frontiersin.org/journals/microbiology/articles/10.3389/fmicb.2015.01486/full]
- 13. Soil microbial carbon use efficiency and the constraints [https://annalsmicrobiology.biomedcentral.com/articles/10.1186/s13213-024-01780-9]
- 14. Ribosomal RNA gene operon copy number, a functional ... [https://www.sciencedirect.com/science/article/abs/pii/S0304389423013833]
- 15. Microbial carbon use efficiency along an altitudinal gradient [https://www.sciencedirect.com/science/article/pii/S0038071722002565]
- 16. Evolution of nutrient acquisition: when adaptation fills the ... [https://pmc.ncbi.nlm.nih.gov/articles/PMC3013406/]
- 17. Structure, Function, and Evolution of Bacterial ATP-Binding ... [https://pmc.ncbi.nlm.nih.gov/articles/PMC2415747/]
- 18. The involvement of transport proteins in transcriptional and ... [https://www.sciencedirect.com/science/article/abs/pii/S1369527414000046]
- 19. Global Transcriptional Analysis of Streptococcus mutans ... [https://pmc.ncbi.nlm.nih.gov/articles/PMC1951856/]
- 20. Life-history strategies of soil microbial ... [https://pmc.ncbi.nlm.nih.gov/articles/PMC8027408/]
- 21. The physiology and ecological implications of efficient growth [https://pmc.ncbi.nlm.nih.gov/articles/PMC4478692/]
- 22. Microbial physiology conserves phosphorus across long ... [https://www.nature.com/articles/s41561-025-01696-2]
- 23. Ecological networks of dissolved organic matter and ... [https://www.nature.com/articles/s41467-022-31251-1]
- 24. SOC bioavailability significantly correlated with the ... [https://www.sciencedirect.com/science/article/pii/S0160412024001740]
- 25. Integrating Microbial Community Data Into an Ecosystem ... [https://pubmed.ncbi.nlm.nih.gov/40673352/]
- 26. Modeling Microbial Community Networks: Methods and Tools [https://pmc.ncbi.nlm.nih.gov/articles/PMC8822226/]
- 27. MIMIC: a Python package for simulating, inferring, and ... [https://pubmed.ncbi.nlm.nih.gov/40408146/]
- 28. Mimicking the Conditional Formatting/Colour Scales... [https://community.qlik.com/t5/Visualization-and-Usability/Mimicking-the-Conditional-Formatting-Colour-Scales-from-Excel-in/td-p/2072336]
- 29. Predictive Ecosystem Modeling → Area [https://climate.sustainability-directory.com/area/predictive-ecosystem-modeling/]
- 30. Modelling and Inference of MICrobiomes Project (MIMIC) is ... [https://github.com/ucl-cssb/MIMIC]
- 31. Modelling approaches for studying the microbiome [https://www.nature.com/articles/s41564-019-0491-9]
- 32. Trait-trait relationships and tradeoffs vary with genome size ... [https://pmc.ncbi.nlm.nih.gov/articles/PMC9634001/]
- 33. Bacterial rrn copy numbers linked to soil function and crop ... [https://www.sciencedirect.com/science/article/abs/pii/S0929139325001866]
- 34. Forest succession improves the complexity of soil microbial ... [https://www.frontiersin.org/journals/microbiology/articles/10.3389/fmicb.2022.1021258/full]
- 35. The selection of copiotrophs may complicate biodiversity ... [https://environmentalmicrobiome.biomedcentral.com/articles/10.1186/s40793-023-00478-w]
- 36. Integrating Microbial Community Data Into an Ecosystem ... [https://pmc.ncbi.nlm.nih.gov/articles/PMC12268835/]
- 37. Bacterial community composition impacts the transformation of ... [https://enigma.lbl.gov/bacterial-community-composition-impacts-the-transformation-of-carbon-in-soils/]
- 38. Substrate Utilization and Competitive Interactions Among ... [https://pubmed.ncbi.nlm.nih.gov/35756023/]
- 39. Succession comprises a sequence of threshold-induced ... [https://www.nature.com/articles/s42003-022-03372-2]
- 40. Dilution-to-extinction - (General Biology I) [https://fiveable.me/key-terms/college-bio/dilution-to-extinction]
- 41. Losses in microbial functional diversity reduce the rate of ... [https://www.sciencedirect.com/science/article/abs/pii/S0038071719301427]
- 42. Evaluating agar-plating and dilution-to-extinction isolation ... [https://pmc.ncbi.nlm.nih.gov/articles/PMC11878766/]
- 43. Oligotroph [https://en.wikipedia.org/wiki/Oligotroph]
- 44. High-Throughput Cultivation and Dilution-to-Extinction ... [https://www.protocols.io/view/high-throughput-cultivation-and-dilution-to-extinc-du336yqn.html]
- 45. - Long Enrichment of an Oligotroph-Dominated Term ... Nutrient Wetland [https://pubmed.ncbi.nlm.nih.gov/32434837/]
- 46. Throughfall Reduction × Fertilization: Deep Soil Water ... [https://www.frontiersin.org/journals/forests-and-global-change/articles/10.3389/ffgc.2019.00093/full]
- 47. Fertilization has negligible effects on nutrient export and ... [https://www.sciencedirect.com/science/article/abs/pii/S0378112720302292]
- 48. Frontiers | Detecting Terrestrial Nutrient Limitation: A Global... [https://www.frontiersin.org/journals/earth-science/articles/10.3389/feart.2016.00023/full]
- 49. Darkness to Discovery: A Comprehensive Mini-Review on ... [https://pmc.ncbi.nlm.nih.gov/articles/PMC12274225/]
- 50. Community-level signatures of ecological succession in ... [https://pmc.ncbi.nlm.nih.gov/articles/PMC7220908/]
- 51. Changes in community assembly may shift the relationship ... [https://pmc.ncbi.nlm.nih.gov/articles/PMC4131499/]
- 52. Forest succession improves the complexity of soil microbial ... [https://pmc.ncbi.nlm.nih.gov/articles/PMC9742230/]
- 53. Emerging multiscale insights on microbial carbon use ... [https://www.nature.com/articles/s41467-024-52160-5]
- 54. Nutrient Enrichment and Food Web Composition Affect ... [https://journals.plos.org/plosone/article?id=10.1371/journal.pone.0007473]
- 55. Nutrient Manipulations in Terrestrial Ecosystems [https://link.springer.com/chapter/10.1007/978-1-4612-1224-9_20]
- 56. An excess of niche differences maximizes ecosystem ... [https://www.nature.com/articles/s41467-020-17960-5]
- 57. Stochastic Community Assembly: Does It Matter in Microbial ... [https://pmc.ncbi.nlm.nih.gov/articles/PMC5706748/]
- 58. Stochastic and deterministic assembly processes of ... [https://www.sciencedirect.com/science/article/abs/pii/S0929139323003517]
- 59. Dynamic changes in soil characteristics, enzyme activity ... [https://www.sciencedirect.com/science/article/abs/pii/S0929139325002963]
- 60. Validation of the ecosystem services of created wetlands: Two decades of plant succession, nutrient retention, and carbon sequestration in experimental riverine marshes - ScienceDirect [https://www.sciencedirect.com/science/article/abs/pii/S0925857414005199]
- 61. Rare microbial taxa as the major drivers of nutrient acquisition ... [https://pmc.ncbi.nlm.nih.gov/articles/PMC11094542/]
- 62. Decadal biomass increment in early secondary succession ... [https://pmc.ncbi.nlm.nih.gov/articles/PMC6376023/]
- 63. Pelagic zone [https://en.wikipedia.org/wiki/Pelagic_zone]
- 64. Nutrient fluxes across sediment-water interface in Bohai ... [https://www.sciencedirect.com/science/article/abs/pii/S0025326X16308736]
- 65. Nutrient Dynamics at the Sediment-Water Interface [https://link.springer.com/article/10.1007/s40710-021-00540-0]
- 66. Nutrient supply controls the linkage between species ... [https://pmc.ncbi.nlm.nih.gov/articles/PMC8748817/]
- 67. Context-dependent dynamics lead to the assembly of ... [https://pmc.ncbi.nlm.nih.gov/articles/PMC7080782/]
- 68. Nutrient dominance governs the assembly of microbial ... [https://pmc.ncbi.nlm.nih.gov/articles/PMC8057819/]
- 69. Defining trait-based microbial strategies with ... [https://www.nature.com/articles/s41396-019-0510-0]
- 70. The role of soil microbes in the global carbon cycle [https://pmc.ncbi.nlm.nih.gov/articles/PMC4283042/]
- 71. Microbial life history strategies regulate soil organic carbon ... [https://www.sciencedirect.com/science/article/abs/pii/S0378112725007674]
- 72. Microbial drivers of soil C:N:P stoichiometry dynamics ... [https://www.sciencedirect.com/science/article/abs/pii/S0929139325004597]
- 73. Diversity and asynchrony in soil microbial ... [https://pmc.ncbi.nlm.nih.gov/articles/PMC7987343/]
- 74. Microbiology Leaders Launch Global Climate Change ... [https://asm.org/press-releases/2025/september/microbiology-leaders-launch-global-climate-change]