Optimizing Surface Materials to Control Bacterial Adhesion: A Strategic Guide for Biomedical Research and Anti-Biofilm Development
This article provides a comprehensive framework for researchers and drug development professionals on the rational design of surface materials to control bacterial adhesion, a critical first step in biofilm formation...
Optimizing Surface Materials to Control Bacterial Adhesion: A Strategic Guide for Biomedical Research and Anti-Biofilm Development
Abstract
This article provides a comprehensive framework for researchers and drug development professionals on the rational design of surface materials to control bacterial adhesion, a critical first step in biofilm formation and implant-associated infections. It explores the fundamental physicochemical forces governing bacterial-surface interactions, reviews advanced material strategies and characterization methodologies, and addresses common challenges in translating in vitro results to complex in vivo environments. By synthesizing foundational principles with applied troubleshooting and validation techniques, this guide aims to equip scientists with the knowledge to select, optimize, and evaluate anti-adhesive surfaces for specific biomedical applications, ultimately contributing to the development of next-generation infection-resistant medical devices and materials.
The Science of Bacterial Adhesion: Core Principles and Surface Interaction Mechanisms
Troubleshooting Guides
Common Experimental Challenges in Bacterial Adhesion Studies
Problem: High Variability in Adhesion Force Measurements
- Potential Cause: Inconsistent bacterial probe preparation for Atomic Force Microscopy (AFM).
- Solution: Ensure bacterial cells are harvested in mid-exponential growth phase and rinsed thoroughly with the appropriate buffer to remove residual culture media. Verify single-bacterium contact on the AFM probe [1] [2].
- Prevention: Standardize culturing, harvesting, and probe functionalization protocols across all experiments.
Problem: Unexpectedly Low Biofilm Formation
- Potential Cause: Surface properties (charge, wettability) are repulsive to the bacterial strain being used.
- Solution: Characterize your surface's physicochemical properties. Consider using a positively charged or hydrophobic surface if studying negatively charged bacteria, as these can enhance initial attachment [3].
- Prevention: Consult literature on the adhesion preferences of your specific bacterial strain and select surface materials accordingly.
Problem: Failure of Anti-Adhesion Compound
- Potential Cause: The compound's activity may be strain-specific, or it may induce upregulation of alternative adhesion pathways [4].
- Solution: Test the compound against a panel of bacterial strains. Verify that the target adhesion factor (e.g., type I pili) is actually expressed under your experimental conditions.
- Prevention: Use a combination of anti-adhesion agents targeting different pathways to minimize the chance of bacterial evasion [4] [5].
Frequently Asked Questions (FAQs)
Q1: What fundamentally differentiates reversible adhesion from irreversible adhesion? A: Reversible adhesion is characterized by bacteria that remain near a surface but can still move laterally, often by swimming or Brownian motion. They are not firmly anchored and can leave the surface. In contrast, irreversibly adhered bacteria are immobilized and do not move from their position for the duration of observation. The transition is mediated by stronger molecular interactions and the production of extracellular polymeric substances (EPS) [1].
Q2: How do surface properties like charge and wettability influence initial bacterial attachment? A: These are critical factors. Most bacteria are negatively charged, so they are more attracted to positively charged surfaces. Regarding wettability, both superhydrophilic and superhydrophobic surfaces can generally inhibit bacterial adhesion. Superhydrophilic surfaces form a strong hydration layer that acts as a physical barrier, while superhydrophobic surfaces minimize contact area due to their water-repelling nature [3].
Q3: Can you target bacterial adhesion without killing the bacteria, and why would you? A: Yes, this is known as an anti-virulence strategy. By inhibiting adhesion factors like pili or MSCRAMMs using anti-adhesion agents or pilicides, you prevent colonization and infection without exerting a lethal force on the bacteria. This approach is promising because it may reduce the selective pressure that drives the emergence of antibiotic-resistant mutants [4] [5].
Q4: What is the role of "moonlighting proteins" in adhesion? A: Moonlighting proteins are multifunctional proteins that perform an entirely different second function without being split into separate domains. Some ubiquitous intracellular enzymes, such as metabolic enzymes or chaperones, are also found on the bacterial surface where they can act as adhesins, binding to host molecules [4].
Bacterial Adhesion Forces and Vibration Characteristics
Table 1: Experimentally measured adhesion forces and vibration amplitudes for various bacterial strains on glass surfaces. Data adapted from [2].
| Bacterial Strain | Adhesion Force (nN) | Vibration Amplitude (nm) |
|---|---|---|
| Staphylococcus aureus NCTC8325-4 | 1.1 | 90 |
| Staphylococcus aureus ATCC12600 | 1.4 | 55 |
| Staphylococcus epidermidis 242 | 1.5 | 48 |
| Staphylococcus epidermidis HB | 0.8 | 135 |
| Streptococcus mutans IB03987 | 1.0 | 70 |
| Streptococcus mutans LM7 | 1.5 | 42 |
| Lactococcus lactis MG1363 | 1.6 | 40 |
| Lactococcus lactis NZ9000 | 1.3 | 60 |
Impact of Surface Properties on Bacterial Adhesion
Table 2: How surface chemistry and physics influence the initial attachment of bacteria. Based on data from [3].
| Surface Property | Mechanism of Action | Effect on Bacterial Adhesion |
|---|---|---|
| Positive Charge | Electrostatic attraction to generally negatively charged bacterial cells. | Increases adhesion |
| Negative Charge | Electrostatic repulsion of similarly charged cells. | Decreases adhesion |
| Zwitterionic | Forms a stable, energetic hydration barrier via strong ionic solvation. | Significantly decreases adhesion |
| Superhydrophilic | Creates a physical barrier of tightly bound water molecules. | Decreases adhesion |
| Superhydrophobic | Minimizes contact area due to extreme water repellency. | Decreases adhesion |
| Increased Roughness | Provides more anchor points and protects cells from shear forces. | Increases adhesion |
Experimental Protocols
Protocol 1: Measuring Single-Cell Adhesion Force using AFM
Objective: To quantify the force required to detach a single bacterial cell from a substrate surface [1] [2].
Bacterial Probe Preparation:
- Grow the bacterial strain of interest to mid-exponential phase in a suitable liquid medium.
- Harvest cells by gentle centrifugation (e.g., 4000 rpm for 10 minutes) and rinse the pellet three times in an appropriate buffer (e.g., phosphate motility buffer).
- Resuspend the cells in fresh buffer at a concentration of approximately 10^7 cells/mL.
- Functionalize a tipless AFM cantilever with a single bacterium using a bio-compatible adhesive like poly-L-lysine or by electrostatic trapping. Validate single-bacterium contact under a microscope [2].
Surface Preparation:
- Clean the substrate (e.g., quartz, polyethylene) rigorously. For quartz, use sonication in a detergent solution, rinse thoroughly with purified water and methanol, and perform argon-ion plasma cleaning for 10 minutes to remove organic contaminants [1].
Force Measurement:
- Mount the bacterial probe and substrate in the AFM fluid cell.
- Submerge in the desired buffer solution.
- Approach the bacterial probe to the surface with a defined loading force (e.g., 0.5 to 5 nN) and allow for a set contact time (e.g., 1-10 seconds) to simulate initial adhesion.
- Retract the probe at a constant speed (e.g., 0.5-1 µm/s) to record a force-distance curve.
- Repeat the measurement at numerous random locations on the substrate surface (n ≥ 100) to ensure statistical significance.
Data Analysis:
- Analyze the retraction curves. The adhesion force is the maximum force required to detach the bacterium from the surface, measured as the depth of the lowest minimum in the curve.
- Report the mean adhesion force and standard deviation from all successful measurements.
Protocol 2: Quantifying Irreversible Adhesion via Confined Brownian Motion Analysis
Objective: To distinguish between reversibly and irreversibly adhered cells by analyzing their nanoscopic motion [2].
Sample Preparation:
- Allow bacteria to adhere to a glass slide in a flow cell or static well for a defined period (e.g., 15-60 minutes).
- Gently rinse with buffer to remove non-adhered, planktonic cells.
Time-Lapse Imaging:
- Use phase-contrast or fluorescence microscopy to capture a time-lapse video of the adhered bacteria. A high frame rate (e.g., 10-30 frames per second) over several minutes is required.
Particle Tracking:
- Use particle tracking software to track the x-y coordinates of each adhering bacterium over time.
- Generate a position map for individual cells.
Data Analysis:
- Mean-Squared Displacement (MSD): Calculate the MSD for each track. For irreversibly adhered cells, the MSD will plateau over time, indicating confined motion. The motion can be described by MSD ~ t^α, where α is much less than 1 [2].
- Autocorrelation Analysis: Calculate the autocorrelation function of the bacterial positions. Long autocorrelation times (up to several seconds) indicate that the cell resides in the same nanoscopic region, confirming irreversible adhesion on a microscopic scale, even while tethers detach and re-attach at the nanoscale [2].
Signaling Pathways and Workflows
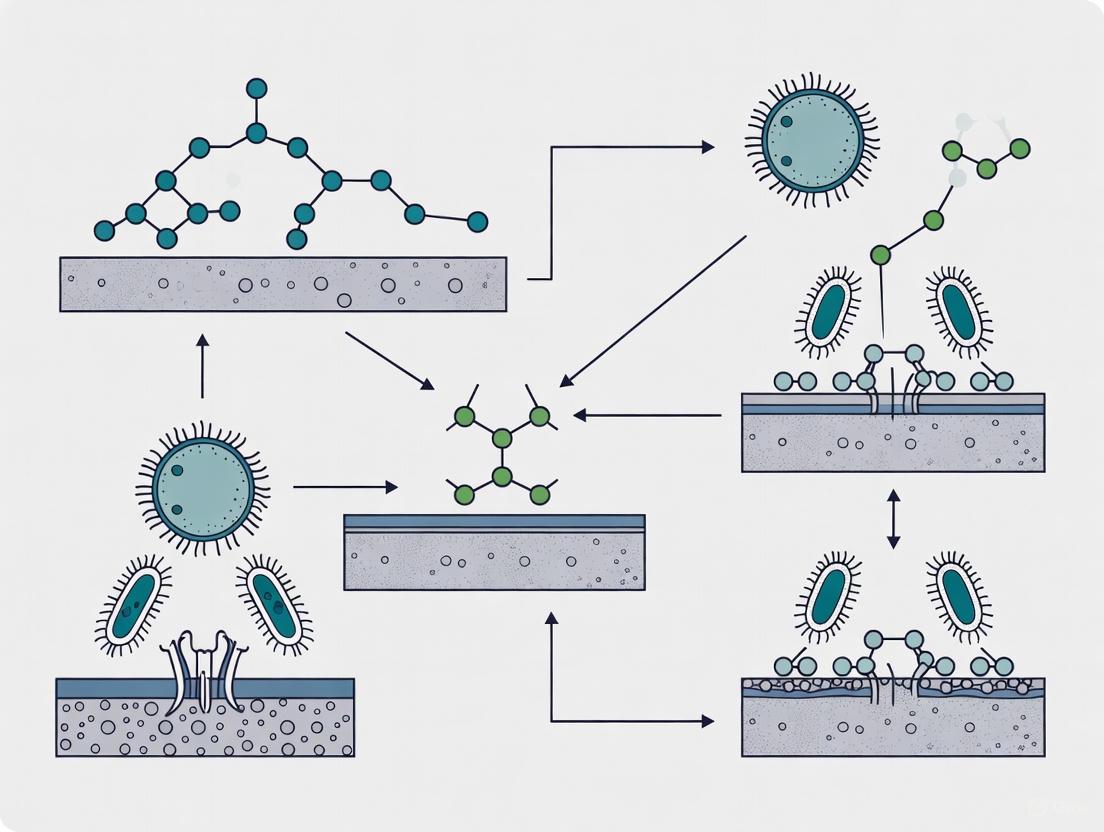
Bacterial Adhesion to Biofilm Maturation
Experimental Workflow for Surface Adhesion Optimization
The Scientist's Toolkit: Research Reagent Solutions
Table 3: Essential materials and reagents for studying bacterial adhesion and biofilm formation.
| Item | Function / Application | Example Use in Context |
|---|---|---|
| Atomic Force Microscope (AFM) | Measures single-cell adhesion forces between a bacterium and a surface with pico-Newton sensitivity. | Quantifying the force required to detach a specific bacterial strain from a newly developed biomaterial [6] [2]. |
| Tipless AFM Cantilevers | Probes for AFM that can be functionalized with a single bacterial cell for force spectroscopy. | Creating a bacterial probe to perform single-cell adhesion force measurements [2]. |
| Poly-L-Lysine | A bio-adhesive used to immobilize bacterial cells onto AFM cantilevers. | Functionalizing a tipless cantilever to create a stable bacterial probe for AFM [2]. |
| Quartz Slides | Provide an ultra-clean, hydrophilic surface for fundamental adhesion studies. | Used as a standardized abiotic surface in TIRAF microscopy to study reversible adhesion distances [1]. |
| Octadecyltrichlorosilane (OTS) | A silane used to create hydrophobic monolayers on glass or quartz surfaces. | Modifying a quartz slide to create a hydrophobic surface to study the effect of wettability on adhesion [1]. |
| Microfluidic Flow Cells | Devices that generate controlled shear stress to study adhesion under flow conditions. | Mimicking physiological fluid flow to observe the transition from reversible to irreversible attachment [7]. |
| Pilicides / Anti-adhesion Compounds | Small molecules that inhibit the biogenesis or function of specific pili. | Testing as a potential anti-virulence agent to prevent initial attachment without killing bacteria [4] [5]. |
| Fluorescein-Dextran / Other Fluorophores | Used as tracers in TIRAF microscopy and to visualize biofilm matrix components. | Dissolving in bacterial suspension for TIRAF to measure cell-surface separation distances [1]. |
For researchers in biomedical materials and drug development, controlling bacterial adhesion is a critical challenge in the design of implants, medical devices, and antibacterial surfaces. The initial attachment of microorganisms is primarily governed by the physicochemical properties of the material surface. This guide details the key surface properties—roughness, wettability, surface free energy, and charge—that control bacterial adhesion, providing standardized experimental protocols and troubleshooting advice to support your research in optimizing surface materials for specific bacterial adhesion studies.
Key Surface Properties and Their Quantitative Effects
The following table summarizes the core surface properties and their documented influence on bacterial adhesion.
Table 1: Key Surface Properties Governing Bacterial Adhesion
| Surface Property | Key Influence on Bacterial Adhesion | Quantitative Data & Research Findings |
|---|---|---|
| Roughness | A critical threshold exists above which bacterial adhesion increases significantly [8]. | Surfaces with an average roughness (Sa) < 1 µm showed bacterial adhesion equivalent to a machined surface. Surfaces with Sa > 1 µm had significantly more adherent bacteria after 4 hours [8]. |
| Wettability & Surface Free Energy | Adhesion is often highest on surfaces with moderate wettability. Both highly hydrophilic and superhydrophobic surfaces can reduce adhesion [9] [10]. | Highly hydrophilic surfaces form a stable hydration shell that repels bacteria, while superhydrophobic surfaces minimize contact area [9]. Surface Free Energy (SFE) is calculated from contact angle data using models like OWRK [11]. |
| Surface Charge | Positively charged surfaces typically promote higher bacterial adhesion due to electrostatic attraction to negatively charged bacterial cell walls [9] [10]. | Most bacterial cell walls are negatively charged. Pseudomonas aeruginosa adhesion was 2-fold higher on positively charged poly(methacrylates) compared to negative ones [10]. A charge density threshold of ~1013–1014 N+/cm2 is needed for membrane disruption [9]. |
Essential Experimental Protocols
Protocol: Measuring Surface Roughness via Non-Contact Profilometry
This method provides a 3D topography profile without contacting and potentially damaging the sample surface [12].
Workflow Diagram: Surface Roughness Measurement
Materials & Equipment:
- Non-Contact 3D Optical Profilometer (e.g., Bruker Nano GmbH) [12]: Measures surface topography using light interference.
- Polishing Machine (e.g., Struers Rotopol-11) [12]: For standardized surface preparation.
- Abrasive Papers (e.g., 1200 to 4000-grit FEPA) [12]: For sequential polishing.
Step-by-Step Procedure:
- Sample Preparation: Prepare disk-shaped specimens and polish sequentially using 1200-grit, 2000-grit, and finally 4000-grit abrasive papers under water cooling on an automatic grinding machine (e.g., at 300 rpm) [12].
- Instrument Calibration: Ensure the profilometer is calibrated according to manufacturer specifications.
- Parameter Configuration: Place the specimen in the profilometer. Use a 5x objective lens with a 0.5 multiplier. Set the scan length and width (e.g., 60 µm and 20 µm, respectively) in the VSI/VXI mode [12].
- Scan Execution: Initiate the scan to generate a 3D representation of the specimen surface.
- Data Analysis: Use the accompanying software (e.g., Vision 64) to calculate the roughness average (Ra), which is the arithmetic average of the absolute values of the profile height deviations from the mean line [12].
Protocol: Determining Wettability and Surface Free Energy via Contact Angle Goniometry
This technique characterizes surface wettability by measuring the contact angle of a liquid droplet, which is used to calculate Surface Free Energy (SFE) [11] [13].
Workflow Diagram: Contact Angle and SFE Analysis
Materials & Equipment:
- Automated Goniometer/Tensiometer (e.g., ramé-hart Model 260/295) [13]: Automates droplet dispensing, image capture, and angle calculation.
- High-Purity Test Liquids: Ultrapure water and diiodomethane (DIM) are standard for SFE calculation using the OWRK model [11].
Step-by-Step Procedure:
- Sample Preparation: Ensure the sample surface is clean, dry, and free of contamination.
- Droplet Dispensing: Use the automated dispensing system to place a sessile droplet (typically 2-5 µL) onto the sample surface [13].
- Image Capture: The instrument's camera automatically captures a high-resolution image of the droplet.
- Angle Measurement: The software (e.g., DROPimage Advanced) analyzes the droplet image and calculates the contact angle (θ) at the three-phase boundary with a resolution of 0.01° [13].
- SFE Calculation: Repeat steps 2-4 with at least two liquids of known Surface Tension (SFT) and their polar/disperse components. Input the contact angle and SFT data into an SFE model (e.g., Owens, Wendt, Rabel, and Kaelble - OWRK) within the software to calculate the total SFE and its polar and disperse components [11].
Protocol: In Vitro Bacterial Adhesion Assay (e.g.,Streptococcus mutans)
This protocol assesses the initial adhesion of bacteria to material surfaces under controlled conditions [12].
Materials & Equipment:
- Bacterial Strain (e.g., Streptococcus mutans) [12]: A common initial colonizer.
- Culture Media: Blood plates (Orion Diagnostica) and Mitis Salivarius Agar supplemented with bacitracin [12].
- Adsorption Buffer: Phosphate-buffered saline (PBS) [12].
- Anaerobic Incubator: For cultivating bacteria under anaerobic conditions at 37°C [12].
- Vortex Machine and Centrifuge: For processing cell suspensions [12].
Step-by-Step Procedure:
- Bacterial Cultivation: Cultivate S. mutans on blood plates under anaerobic conditions at 37°C for 16 hours [12].
- Cell Suspension Preparation: Harvest cells and rinse twice in PBS via centrifugation (10,000 g for 10 min). Resuspend the cell pellet in an adsorption buffer to an optical density of 0.35 (A550), corresponding to approximately 5 × 10^8 colony-forming units per milliliter (CFU/mL) [12].
- Sample Pre-incubation: Place material specimens in diluted saliva for 30 minutes at room temperature with gentle rolling to form a saliva pellicle [12].
- Adhesion Phase: Wash pre-incubated specimens in saline and transfer them to test tubes containing the bacterial cell suspension. Incubate for 30 minutes with gentle rolling [12].
- Removal of Non-Adhered Bacteria: Carefully wash the specimens three times with saline to remove loosely attached cells [12].
- Cell Enumeration (CFU Count): Adherent cells are removed from the disc surface by vigorous scraping and vortexing in a transport medium. This suspension is then serially diluted, plated on Mitis Salivarius Agar plates, and incubated anaerobically for 48 hours at 37°C before counting CFUs [12].
The Scientist's Toolkit: Research Reagent Solutions
Table 2: Essential Materials for Bacterial Adhesion Research
| Item | Function in Research | Example Use Case |
|---|---|---|
| Short Fiber-Reinforced Composites (SFRC) | Dental restorative material with isotropic short-fiber fillers to resist crack propagation [12]. | Testing bacterial adhesion and surface roughness for dental application biocompatibility [12]. |
| Polyelectrolyte Multilayers (PEM) | Surfaces with tunable, precise surface charge density built via Layer-by-Layer (LbL) assembly [10]. | Systematically studying the effect of surface charge on initial bacterial attachment and biofilm structure [10]. |
| Cationic Polymers (e.g., Chitosan, Quaternary Ammonium Compounds) | Positively charged materials that attract and disrupt negatively charged bacterial membranes [9]. | Creating contact-killing surfaces; studying the threshold charge density required for bactericidal activity [9]. |
| Ultrapure Test Liquids (Water, Diiodomethane) | Liquids with known surface tension and polar/disperse components for contact angle measurement [11]. | Experimental input for OWRK and other models to calculate a solid surface's Surface Free Energy [11]. |
Troubleshooting FAQs
Q1: My bacterial adhesion results are highly variable across replicate samples. What could be the cause?
- A: Inconsistent surface preparation is a common culprit. Ensure your polishing protocol is strictly followed for all samples to achieve uniform roughness [12]. Contamination from airborne organics or fingerprints can also alter surface energy. Implement rigorous cleaning (e.g., plasma treatment) and handle samples with clean tools. Furthermore, ensure the bacterial cell suspension is homogeneous by vortexing immediately before use to avoid settling, which leads to inconsistent inoculum density [12].
Q2: According to theory, my negatively charged surface should repel bacteria, but I'm still observing strong adhesion. Why?
- A: Electrostatic repulsion can be overcome by other factors. Bacterial surface appendages like fimbriae and pili can facilitate attachment to negatively charged surfaces [10]. Additionally, surface polymers such as lipopolysaccharides (LPS) in Gram-negative bacteria can mediate adhesion to negative charges [10]. The presence of a protein conditioning film (e.g., from saliva or serum) can completely mask the underlying surface chemistry, providing specific receptors for bacterial adhesins [14].
Q3: I modified my surface to be super-hydrophilic, but it did not reduce bacterial adhesion as expected. What might have gone wrong?
- A: The relationship between wettability and adhesion is bacterial strain-specific. For instance, S. aureus favors hydrophilic surfaces, while S. epidermidis prefers hydrophobic ones [14]. Your modification may have also unintentionally increased surface roughness beyond the critical 1 µm Sa threshold, promoting adhesion despite hydrophilicity [8]. Characterize the final surface thoroughly to confirm all properties were modified as intended.
Q4: What is the most accurate way to determine Surface Free Energy, and why are test inks not recommended?
- A: The most accurate method is contact angle goniometry using multiple test liquids (e.g., water and diiodomethane) and an appropriate model like OWRK for calculation [11]. Test inks only provide a single value (critical surface tension) and do not account for the polar and disperse interaction components. This can be misleading, as surfaces with the same critical surface tension but different polarities will interact differently with other liquids and bacteria [11].
The prediction and control of bacterial adhesion to surfaces are critical in fields ranging from biomedical implants to industrial processes. Two primary theoretical frameworks—thermodynamic models and DLVO/xDLVO theories—provide the foundation for understanding and predicting adhesion behavior based on surface free energy (SFE) differences. Thermodynamic models evaluate adhesion through the work of adhesion, which represents the energy required to separate two phases [15]. The classical Derjaguin-Landau-Verwey-Overbeek (DLVO) theory describes interactions between surfaces in terms of van der Waals attractive forces and electrical double layer repulsive forces [16]. The extended DLVO (XDLVO) theory incorporates additional short-range interactions, including polar acid-base and hydrophobic interactions, providing a more comprehensive prediction of bacterial adhesion behavior [17] [16].
Frequently Asked Questions (FAQs)
Q1: What is the fundamental difference between DLVO and XDLVO theories in predicting bacterial adhesion?
- DLVO Theory considers bacterial adhesion as a balance between two primary forces: Lifshitz-van der Waals (LW) attractive forces and electrostatic double layer (EL) repulsive forces. It operates under the assumption that these long-range forces primarily govern adhesion behavior [16].
- XDLVO Theory extends this framework by incorporating short-range Lewis acid-base (AB) interactions, which include hydrophobic/hydrophilic interactions. This addition makes XDLVO more accurate for predicting adhesion in aqueous biological environments where these polar forces significantly influence adhesion outcomes [17] [16]. Studies have demonstrated that XDLVO provides more accurate predictions of bacterial adhesion and its reversibility compared to classical DLVO theory [17].
Q2: How does surface free energy difference correlate with bacterial adhesion propensity?
Research has established that the difference in surface free energy between bacterial cells and substratum surfaces directly mediates adhesion behavior. A lower SFE difference corresponds to a higher degree of bacterial adhesion [18]. This relationship forms the basis for predicting bacterial adhesion through thermodynamic analysis. The adhesion energy (ΔFadh) becomes more negative as the SFE difference diminishes, making adhesion thermodynamically favorable [18].
Q3: Why do my experimental results sometimes contradict theoretical predictions?
Several factors can cause discrepancies between theoretical predictions and experimental outcomes:
- Production of Extracellular Polymeric Substances (EPS): Bacteria can secrete EPS that significantly alters their surface properties and interaction energies [16].
- Surface Heterogeneity: Real-world surfaces often have chemical and topographical variations not accounted for in idealized models [19].
- Dynamic Biological Processes: Living bacteria can actively modify their surface properties and behavior in response to environmental conditions [18] [16].
- Measurement Limitations: Technical challenges in accurately determining the SFE of live bacterial cells can introduce uncertainty in theoretical predictions [18].
Q4: How can I accurately determine the surface free energy of bacterial cells?
Traditional methods involving contact angle measurements on bacterial lawns face challenges related to controlling compactness, roughness, and drying time [18]. A novel spectrophotometric method has been developed that relies on DLVO analysis of colloidal stability through simple spectrophotometric measurements. This approach is accurate, inexpensive, easy-to-use, and high-throughput, overcoming many limitations of traditional techniques [18].
Troubleshooting Common Experimental Issues
Inconsistent Adhesion Results
Problem: Significant variability in bacterial adhesion measurements across experimental replicates.
Solutions:
- Standardize Cell Preparation: Ensure consistent bacterial growth phase, harvesting methods, and washing procedures. Cells should be harvested at the same growth phase (typically stationary phase at OD600 of approximately 2) [18].
- Control Surface Properties: Use well-characterized model surfaces with known SFE values. Clean glass (high energy, hydrophilic, γsv = 70 ± 1 mJ/m²) and silanized glass (low energy, hydrophobic, γsv = 38 ± 1 mJ/m²) are recommended standards [18].
- Standardize Environmental Conditions: Maintain consistent temperature, pH, and ionic strength across experiments, as these factors significantly influence interfacial interactions [18].
Discrepancies Between Theoretical Predictions and Experimental Observations
Problem: Experimental adhesion results contradict predictions from DLVO/XDLVO models.
Solutions:
- Verify SFE Measurements: Utilize the spectrophotometric method for more accurate determination of bacterial SFE [18].
- Include Polar Interactions: Apply XDLVO theory to account for acid-base interactions, especially for hydrophilic surfaces or in complex biological media [17] [16].
- Consider Biological Factors: Account for EPS production and bacterial motility, which can significantly alter adhesion behavior [16].
Challenges in Quantifying Adhesion Strength
Problem: Difficulty in reproducibly measuring the strength of bacterial adhesion to surfaces.
Solutions:
- Implement Jet Impingement Technique: This method assesses adhesion strength by measuring the detachment stress required to remove bacterial cells [17].
- Classify Adhesion Behavior: Use detachment stress values to distinguish between reversible adhesion (secondary energy minimum) and irreversible adhesion (primary energy minimum) [17].
Experimental Protocols & Data Presentation
Core Experimental Workflow
The following diagram illustrates the standard workflow for predicting bacterial adhesion using thermodynamic and DLVO/XDLVO models:
Quantitative Data Presentation
Table 1: Surface Free Energy Components and Bacterial Adhesion Correlation
| Bacterial Strain | Solid Surface | γsv (mJ/m²) | γbv (mJ/m²) | γbv - γsv | Adhesion Degree | Adhesion Type | ||
|---|---|---|---|---|---|---|---|---|
| P. stutzeri PS | Glass | 70 ± 1 | 44.4 | 25.6 | High | Irreversible (Primary Minimum) | ||
| P. stutzeri PS | ITO-coated glass | 38 ± 1 | 44.4 | 6.4 | Very High | Irreversible (Primary Minimum) | ||
| S. epidermidis SE | Glass | 70 ± 1 | 35.2 | 34.8 | Low | Reversible (Secondary Minimum) | ||
| S. epidermidis SE | ITO-coated glass | 38 ± 1 | 35.2 | 2.8 | Moderate | Reversible (Secondary Minimum) | ||
| E. coli DH5α | Glass | 70 ± 1 | 31.9 | 38.1 | Low | Not Specified | ||
| E. coli DH5α | Silanized glass | 38 ± 1 | 31.9 | 6.1 | High | Not Specified |
Data compiled from multiple studies [17] [18]. γsv: Surface free energy of solid substrate; γbv: Surface free energy of bacterial cells.
Table 2: Comparison of DLVO vs. XDLVO Prediction Accuracy
| Theoretical Model | Interactions Considered | Prediction Accuracy | Best Application Context |
|---|---|---|---|
| Classical DLVO | Lifshitz-van der Waals (LW), Electrostatic Double Layer (EL) | Limited, especially in complex media | Simple electrolytes, inert surfaces |
| Extended DLVO (XDLVO) | LW, EL, Lewis Acid-Base (AB) | Higher accuracy for biological systems | Aqueous environments, complex media |
| Thermodynamic Approach | Surface Free Energy Difference | Good correlation with experimental data | Rapid screening of material combinations |
Based on experimental validation studies [17] [16].
Standardized Protocol for Bacterial Adhesion Assessment
Protocol 1: Surface Preparation and Characterization
Clean Glass Surface Preparation:
- Use thoroughly cleaned microscopy glass slides (e.g., Millicell EZ SLIDE)
- Clean with appropriate solvents (acetone) and dry under nitrogen flow [18]
- Verify hydrophilicity through water contact angle measurement (<10°)
Hydrophobic Surface Preparation:
- Silanize clean glass slides using 1,1,1,3,3,3-hexamethyldisilazane (HMDS) vapor
- Place cleaned slides in glass Petri dish at 70°C for 12 hours with HMDS [18]
- Verify hydrophobicity through water contact angle measurement (>90°)
Surface Characterization:
Protocol 2: Bacterial Surface Free Energy Measurement
Bacterial Culture and Preparation:
Spectrophotometric SFE Determination:
- Perform simple spectrophotometric measurements based on colloidal stability
- Apply DLVO analysis to determine bacterial SFE accurately [18]
- Compare with traditional contact angle method when possible
Protocol 3: Adhesion Experiment and Validation
Adhesion Assay:
- Prepare bacterial suspension at 10⁸ cells/mL in appropriate medium [18]
- Expose surfaces to bacterial suspension under controlled conditions
- Incubate with gentle agitation for specified duration
- Rinse gently to remove non-adhered cells
Adhesion Quantification:
The Scientist's Toolkit: Essential Research Reagents and Materials
Table 3: Key Research Reagents and Materials for Adhesion Studies
| Item | Function/Specification | Application Notes |
|---|---|---|
| Microscope Glass Slides | Millicell EZ SLIDE or equivalent | Standard hydrophilic substrate [18] |
| 1,1,1,3,3,3-hexamethyldisilazane (HMDS) | Silanizing agent for creating hydrophobic surfaces | Creates surfaces with γsv ≈ 38 mJ/m² [18] |
| Phosphate Buffered Saline (PBS) | Standard washing and suspension buffer | Maintains physiological ionic strength [18] |
| Diiodomethane (DIM) | Dispersive reference liquid for contact angle measurements | γlv = 50.8 mJ/m² (non-polar) [19] |
| Water | Polar reference liquid for contact angle measurements | γlv = 72.8 mJ/m² (strongly polar) [19] |
| Optical Tensiometer | Instrument for contact angle measurements | Essential for surface free energy determination [19] |
| Jet Impingement Device | Measures bacterial adhesion strength | Quantifies detachment stress for reversibility classification [17] |
Theoretical Framework Diagrams
Energy Profiles in DLVO vs. XDLVO Theories
The diagram below illustrates the key differences in energy profiles between classical DLVO and extended XDLVO theories:
Surface Free Energy Components in Wettability
The following diagram shows how surface free energy components influence wettability and adhesion:
In the quest to optimize surface materials for bacterial adhesion studies, researchers are increasingly turning to nature for inspiration. Biological surfaces such as the lotus leaf and cicada wing have evolved sophisticated physical structures that effectively prevent microbial attachment and fouling. These bioinspired strategies offer promising alternatives to conventional chemical-based antibacterial approaches, which often contribute to the growing problem of antimicrobial resistance [20]. This technical support center provides essential guidance for implementing these natural designs in laboratory settings, offering detailed protocols, troubleshooting advice, and reagent solutions to support your research in surface material optimization.
Natural Models and Their Mechanisms
Bioinspired antibacterial surfaces are broadly classified into two categories based on their operational mechanisms: bacteria-repellent and contact-killing surfaces [21].
- Bacteria-Repellent Surfaces: These surfaces, inspired by the lotus leaf, minimize bacterial adhesion through superhydrophobicity and self-cleaning capabilities. The combination of micro- and nanostructures traps air cushions, significantly reducing the contact area between the surface and bacterial cells [21].
- Contact-Killing Surfaces: Exemplified by the cicada wing, these surfaces feature nanoscale topographic patterns that mechanically rupture bacterial cell membranes upon contact, leading to cell death [22] [21].
The following table summarizes the key characteristics of these natural models:
Table 1: Characteristics of Natural Anti-Adhesive Surfaces
| Natural Model | Primary Mechanism | Key Topographical Features | Representative Species | Contact Angle (°) |
|---|---|---|---|---|
| Lotus Leaf | Bacteria-repelling via superhydrophobicity [21] | Hierarchical micro-bumps (1-5 μm height) covered with epicuticular wax crystals (80-120 nm) [23] [21] | Nelumbo nucifera [22] | 142 ± 8.6 [22] |
| Cicada Wing | Contact-killing via mechanical rupture [22] [21] | Nano-pillar arrays (e.g., height: 241 nm, diameter: 156 nm, spacing: 165 nm) [22] | M. intermedia [22] | 135.5 [22] |
| Gecko Skin | Contact-killing [21] | Hair-like nanostructures (4 μm length, top radius: 10-20 nm) [22] | L. steindachneri [22] | 150 [22] |
| Shark Skin | Bacteria-repelling [21] | 3D riblet microstructure (200-500 nm height, 100-300 μm spacing) [22] | Spiny Dogfish [22] | - |
Frequently Asked Questions (FAQs) and Troubleshooting
Q1: Our fabricated superhydrophobic surface, inspired by the lotus leaf, shows inconsistent water repellency and poor roll-off behavior. What could be the cause?
- A1: Inconsistent superhydrophobicity typically stems from issues in hierarchical structuring or surface chemistry.
- Insufficient Hierarchical Roughness: The lotus effect requires both micro- and nanoscale features. Verify using SEM that your surface has structures mimicking the leaf's papillae (micro-scale, several μm) and epicuticular wax crystals (nano-scale, ~100 nm) [23]. A lack of nanoscale roughness can prevent effective air pocket formation.
- Inadequate Low Surface Energy Coating: Ensure a uniform, stable hydrophobic coating (e.g., silanized hydrocarbons [23] or fluorinated compounds) is applied. Chemical vapor deposition (CVD) methods, such as with hexamethyldisiloxane (HMDSO), can provide more uniform coverage than solution-based coating [24].
- Mechanical Damage: Nanoscale features are fragile. If subjected to abrasion, the topography can be damaged. Consider approaches that enhance robustness, such as using structured aggregates (supraparticles) as intermediate building blocks, which anchor nanoscale primary particles within a larger microstructure [23].
Q2: The bactericidal efficacy of our cicada-wing-mimetic nanopillars is lower than expected, especially against Gram-positive bacteria. How can we improve this?
- A2: Bactericidal efficiency is highly dependent on the precise geometry of the nanostructures.
- Optimize Nanopillar Dimensions: Gram-positive bacteria, with their thicker peptidoglycan cell wall, are generally more resistant to mechanical rupture than Gram-negative bacteria [21]. To enhance efficacy, tailor the height, diameter, and spacing of the nanopillars. Research indicates that high-aspect-ratio nanostructures, like those on dragonfly wings, are more effective against a broader spectrum of bacteria, including Gram-positive strains [21]. Refer to Table 1 for natural dimensions and use these as a starting point for optimization.
- Ensure Fabrication Uniformity: Use characterization techniques like AFM and SEM to confirm that the fabricated nanopillars are uniform in size and distribution across the substrate. Variations can create "safe zones" where bacteria can adhere without being stretched [22].
- Consider a Hybrid Approach: For implants requiring high efficacy, combine physical nanostructures with a non-fouling chemical strategy. For example, a self-adhesive coating integrating lubricious and antimicrobial components has been shown to work via both bacteriostatic and anti-adhesion mechanisms [25].
Q3: The anti-adhesive performance of our bioinspired surface degrades over time in aqueous environments. How can we improve long-term stability?
- A3: Degradation often relates to the instability of surface chemistry or physical topography under application conditions.
- Stability of Hydrophobic Coating: Verify the long-term stability of your hydrophobic layer. Accelerated aging tests (e.g., immersion in buffers) and periodic contact angle measurements over weeks or months can track wettability changes. One study confirmed the presence of a stable HMDSO coating via FTIR analysis over six months [24].
- Explore Alternative Strategies: For applications in wet or complex biological environments, superhydrophobic surfaces may fail under pressure or high humidity [26]. As an alternative, consider Immobilized Liquid (IL) layers, also known as Slippery Liquid-Infused Porous Surfaces (SLIPS). These surfaces, inspired by the pitcher plant, create a smooth, omniphobic, and self-healing interface by locking a lubricating liquid (e.g., medical-grade silicone oil or perfluorocarbons) within a textured substrate, proving highly effective against biofouling [26].
Experimental Protocols for Fabrication and Characterization
Protocol: Fabricating a Lotus-Leaf-Inspired Hierarchical Coating Using Supraparticles
This protocol describes a scalable, fluorine-free method for creating robust superhydrophobic coatings [23].
- Materials: Silica colloidal primary particles (~200 nm), octyl-trichlorosilane, ethanol, polydimethylsiloxane (PDMS) primer, glass substrate.
- Equipment: Spray dryer, spray coater or airbrush, oven, fume hood.
Workflow:
- Synthesize Primary Particles: Prepare monodisperse silica nanoparticles (~200 nm) using the Stöber method [23].
- Fabricate Supraparticles (SPs): Assemble the primary particles into SPs with an average diameter of ~15 μm via spray drying. This creates the micro-scale roughness [23].
- Surface Functionalization: Render the SP powder hydrophobic via gas-phase silanization with octyl-trichlorosilane in a vacuum desiccator to avoid solvents [23].
- Apply Primer Layer: Coat a clean glass substrate with a thin layer of PDMS, which acts as a sticky, elastic primer to anchor the SPs [23].
- Spray Coat SPs: Disperse the functionalized SPs in ethanol and spray coat them onto the uncured PDMS primer layer to form a hierarchical coating.
- Cure: Harden the coating by curing in an oven at 80°C.
Diagram 1: Supraparticle coating fabrication workflow.
Protocol: Characterizing Anti-Adhesive Properties
Surface Morphology:
Surface Wettability:
- Technique: Static Contact Angle (CA), Contact Angle Hysteresis (CAH), and Roll-off Angle (RA) measurements [23].
- Procedure:
- Place a 5 µL water droplet on the surface.
- Measure the static CA using a goniometer. A CA > 150° indicates superhydrophobicity.
- Measure CAH by calculating the difference between the advancing and receding contact angles. A CAH < 10° is excellent.
- Measure the RA by tilting the stage until the droplet rolls off. A RA < 10° indicates low adhesion [23].
Ex Vivo Antiadhesive Testing:
- Technique: Peel Test 90° with biological tissue [24].
- Procedure: Adhere the fabricated material to intestinal tissue (or other relevant tissue) ex vivo and perform a 90° peel test to quantify the adhesive strength. A significant reduction in adhesion force compared to a control surface confirms antiadhesive performance [24].
Bactericidal Efficacy Assessment:
- Technique: Bacterial viability assay and fluorescence microscopy.
- Procedure:
- Incubate the surface with a bacterial suspension (e.g., P. aeruginosa for Gram-negative, S. aureus for Gram-positive) for a set time.
- Stain with a live/dead bacterial viability kit.
- Use fluorescence microscopy to visualize and count live (green) vs. dead (red) cells adherent to the surface [24] [21].
- Quantify cell viability using a metabolic assay like MTT [24].
The Scientist's Toolkit: Essential Research Reagent Solutions
Table 2: Key Reagents and Materials for Bioinspired Surface Research
| Item Name | Function/Application | Key Characteristics | Example/Reference |
|---|---|---|---|
| Poly-ε-caprolactone (PCL) | A biodegradable polymer used to create nanofibrous mats via electrospinning/electrospraying. | Biocompatible, suitable for large-scale fabrication. | Used for anti-adhesive barriers inspired by lotus leaf [24]. |
| Hexamethyldisiloxane (HMDSO) | Used in Chemical Vapor Deposition (CVD) to create a stable, hydrophobic coating on nanostructures. | Decreases surface wettability, stability verified over 6 months [24]. | Cold plasma modification with HMDSO [24]. |
| Octyl-trichlorosilane | A silane used for fluorine-free hydrophobization of metal oxide surfaces (e.g., silica). | Provides hydrocarbon chains for low surface energy [23]. | Surface functionalization of silica supraparticles [23]. |
| Medical-Grade Silicone Oil | Lubricant for creating Immobilized Liquid (IL) surfaces (SLIPS). | Biocompatible, used in clinical applications (e.g., ocular tamponades) [26]. | Infusing liquid for omniphobic, self-healing coatings [26]. |
| Dopamine Methacrylamide | A monomer for creating self-adhesive, mussel-inspired coatings on various substrates. | Enables strong adhesion to material surfaces in aqueous environments [25]. | Component of a self-adhesive copolymer for medical devices [25]. |
| Polydimethylsiloxane (PDMS) | An elastic polymer used as a primer layer or substrate for anchoring nanostructures or creating IL layers. | Biocompatible, sticky when uncured, can be infused with lubricants [23] [26]. | Primer for supraparticle coating; substrate for liquid-infused surfaces [23] [26]. |
Material Strategies and Advanced Techniques for Anti-Adhesion Surface Design
Frequently Asked Questions
What are the primary mechanisms by which zwitterionic polymers prevent bacterial adhesion? Zwitterionic polymers prevent bacterial adhesion primarily through the formation of an ultra-hydrophilic surface that binds water molecules via ionic solvation [27]. This creates a dense and stable hydration layer that acts as a physical and energetic barrier, preventing proteins and bacteria from adhering to the surface [28]. The simultaneous presence of cationic and anionic groups in their repeating units makes them electrically neutral overall but confers extremely high polarity [29]. The strength of this hydration layer is key; zwitterionic polymers like polysulfobetaine can bind 7–8 water molecules per repeating unit, a significantly stronger hydration than materials like PEG, which binds only one water molecule per unit via hydrogen bonding [27].
My anti-adhesion hydrogel is mechanically weak and brittle. How can I improve its strength without compromising its antifouling properties? The poor mechanical strength of zwitterionic hydrogels is a known challenge due to their superhydrophilicity, which limits chain entanglement and weakens intermolecular interactions [28]. Several reinforcement strategies have been developed:
- Nanocomposite Approach: Incorporating nanoparticles like Laponite clay or cellulose nanocrystals (CNCs) as physical crosslinkers can significantly enhance mechanical properties. These fillers form ionic interactions with zwitterionic groups, creating a denser network that dissipates energy [28].
- Double-Network (DN) Structure: Creating an interpenetrating network with a second, tough polymer can provide substantial mechanical reinforcement while maintaining the surface antifouling properties of the zwitterionic component [28]. These strategies can drastically improve properties, with some nanocomposite hydrogels achieving a breaking strength of 0.27 MPa and an elongation at break of up to 1750% [28].
Why is surface preparation so critical for the performance of anti-adhesion coatings? Surface preparation is foundational because contamination directly undermates adhesion and performance. Inadequate preparation is a primary cause of coating failures like blistering, cracking, and delamination [30] [31]. The substrate must be thoroughly cleaned of all contaminants (oils, grease, rust, dust) and profiled through abrasive blasting or chemical etching to provide mechanical anchorage for the coating [30]. Even on a molecular level, contaminants can interfere with the intended surface chemistry of the anti-adhesion material, reducing its effectiveness.
Can the physicochemical properties of the bacterial surface itself be targeted to reduce adhesion? Yes, modulating the physicochemical properties of bacterial cells is a promising anti-adhesion strategy. Research on skin bacteria has shown that compounds like Rhamnolipids can significantly inhibit adhesion by altering key bacterial surface properties, notably by increasing hydrophilicity and modulating Lewis acid-base characteristics [32]. This change in surface physicochemistry reduces the driving force for adhesion to host tissues or biomaterials without necessarily killing the bacteria, which may help slow the development of resistance [32].
Troubleshooting Guides
Problem: Poor Coating Adhesion or Premature Failure
Potential Causes and Solutions:
Cause: Inadequate Surface Preparation
- Solution: Ensure the substrate is meticulously cleaned and profiled. Remove all contaminants (oils, salts, debris) via solvent wiping or alkaline washing. Use abrasive blasting or etching to create a surface profile for mechanical interlocking. Remove all residual dust after profiling [30].
Cause: Improper Curing Conditions
- Solution: Follow the manufacturer's cure schedule precisely. Confirm oven calibration and uniform heat distribution. Meet the minimum required cure time and temperature to ensure full cross-linking and bonding strength [30].
Cause: Surface Contamination During Application
- Solution: Maintain a clean application environment. Thoroughly clean coating guns, hoses, and tanks to prevent cross-contamination. Filter coatings before application. Avoid touching prepared surfaces with bare hands [30].
Cause: Mismatch Between Coating and Substrate
- Solution: Select coatings specifically formulated for your substrate (e.g., metal, plastic). Consider using a primer to improve the adhesion of the topcoat. Consult with coating suppliers for optimal product selection [30].
Problem: Bacterial Adhesion Persists on Anti-Fouling Surfaces
Potential Causes and Solutions:
Cause: Incomplete Surface Coverage or Defects
- Solution: Ensure the anti-adhesion layer is applied uniformly without defects like pinholes or cracks. Characterize the coated surface using techniques like atomic force microscopy (AFM) to verify homogeneity and the presence of a continuous hydration layer [33].
Cause: Competing Interactions in Complex Biological Media
- Solution: Test the anti-adhesion performance in conditions that mimic the final application environment (e.g., specific pH, ion concentration, presence of proteins). The anti-polyelectrolyte effect of zwitterionic polymers can be leveraged, as their performance often improves in salt solutions [29] [28].
Cause: Expression of Specific Bacterial Adhesins
Data Presentation
Table 1: Comparison of Anti-Adhesion Material Classes
| Material Class | Key Mechanism | Advantages | Limitations / Challenges |
|---|---|---|---|
| Zwitterionic Polymers (e.g., PCB, PSB) [29] [27] [28] | Strong ionic solvation forms a robust hydration layer; anti-polyelectrolyte effect. | Superior hydrophilicity & antifouling vs. PEG; low immunogenicity; pH/salt responsive. | Often poor mechanical strength & brittleness; can be challenging to process. |
| Zwitterionic Hydrogels [27] [28] | Hydrated polymer network provides a physical and thermodynamic barrier to adhesion. | High biocompatibility; excellent permeability; tunable mechanical properties. | High water content can lead to swelling and deformation; generally weak mechanical properties. |
| Fouling-Release Coatings | Minimize surface adhesion strength, allowing attached organisms to be removed by shear force. | Effective against a wide range of fouling organisms; does not rely on biocides. | Requires presence of shear force (e.g., water flow); may not prevent initial adhesion. |
Table 2: Quantified Adhesion Inhibition by Selected Compounds
Data derived from a study using a 3D skin model, showing the reduction in bacterial adhesion after application of various compounds [32].
| Compound | S. aureus Adhesion Reduction (Log CFU/cm²) | S. epidermidis Adhesion Reduction (Log CFU/cm²) | C. acnes Adhesion Reduction (Log CFU/cm²) | Primary Physicochemical Change Induced |
|---|---|---|---|---|
| Rhamnolipid (RHM) | 3.3 | ~1.0 (estimated) | N/A | Strongly increased bacterial hydrophilicity & Lewis acidity |
| Carrageenan (CARR) | 1.1 | 1.3 | 0.6 | Decreased bacterial hydrophobicity |
| Sodium Hyaluronate (SH) | ~0.8 (estimated) | ~0.9 (estimated) | ~0.5 (estimated) | No significant change for S. aureus |
| Guar Hydroxypropyltrimonium Chloride (GUAR) | 0.6 | ~0.8 (estimated) | 0.4 | Shifted bacterial surface to mild hydrophily |
Experimental Protocols
Protocol 1: Measuring Bacterial Adhesion Force via Atomic Force Microscopy (AFM)
Principle: AFM quantitatively measures the physical forces involved in the adhesion between a single bacterial cell and a substrate at the nanonewton (nN) scale [33].
Materials:
- Atomic Force Microscope
- Cantilevers (can be functionalized with a specific bacterial strain or adhesin)
- Bacterial culture
- Substrate material of interest
- Appropriate liquid medium (e.g., PBS)
Methodology:
- Probe Preparation: A single live bacterium is attached to the end of a tipless AFM cantilever using a bio-compatible glue [33].
- Surface Approach: The bacterium-functionalized cantilever is moved towards the substrate surface in a liquid environment until contact is made with a defined force [33].
- Retraction and Force Measurement: The cantilever is then retracted. The force required to detach the bacterium from the surface is recorded as a function of distance, generating a force-distance (FD) curve. The adhesion force is determined by the maximum pull-off force observed during retraction [33].
- Data Analysis: Multiple force curves are collected across the surface to map adhesion and obtain statistical data. Adhesion strength is typically categorized as: weak (<1 nN), intermediate (1-10 nN), or strong (>10 nN) [33].
AFM Bacterial Adhesion Workflow
Protocol 2: Evaluating Anti-Adhesion Performance Using a 3D Skin Model
Principle: This protocol uses a reconstructed human epidermis to study the modulation of bacterial adhesion in a system that closely mimics the morphological and molecular characteristics of in vivo skin [32].
Materials:
- 3D reconstructed human skin model
- Bacterial strains (e.g., S. aureus, S. epidermidis, C. acnes)
- Test compounds (e.g., Rhamnolipid, Carrageenan)
- Phosphate Buffered Saline (PBS)
- Equipment for viability plating (CFU counting)
Methodology:
- Pre-treatment: Topically apply the test compound to the epidermal surface of the 3D skin model. A water-treated control is essential [32].
- Bacterial Inoculation: Apply a standardized suspension of bacteria onto the treated skin surface and allow for an adhesion period under controlled conditions [32].
- Washing and Recovery: Gently wash the skin model to remove non-adhered bacteria. Recover the adhered bacteria by swabbing or sonicating the skin surface [32].
- Quantification: Serially dilute the recovered bacteria, plate on agar, and count Colony Forming Units (CFU) after incubation. The adhesion is expressed as Log CFU per unit area [32].
- Surface Analysis: Characterize changes in the physicochemical properties (e.g., hydrophobicity, Lewis acid-base) of both the skin surface and the bacteria after compound treatment using methods like contact angle measurement [32].
The Scientist's Toolkit: Key Research Reagent Solutions
Table 3: Essential Materials for Anti-Adhesion Research
| Reagent / Material | Function in Research | Key Consideration |
|---|---|---|
| Zwitterionic Monomers (e.g., SBMA, CBMA) [27] [28] | Building blocks for synthesizing zwitterionic polymers and hydrogels via radical polymerization. | Purity is critical for consistent polymer properties and antifouling performance. |
| Laponite XLG Nanoclay [28] | Nanocomposite filler used as a physical crosslinker to dramatically improve the mechanical strength of zwitterionic hydrogels. | Concentration must be optimized to balance toughness with transparency/swelling. |
| AFM Cantilevers (Colloidal Tips) [33] | Used for single-cell force spectroscopy; can be functionalized with a bacterium to probe specific adhesion forces. | Spring constant of the cantilever must be calibrated for accurate force measurement. |
| FimH Antagonists (e.g., Biphenyl Mannosides) [34] | High-affinity, synthetic receptor analogs used in anti-adhesion therapy to competitively inhibit bacterial attachment. | Offers high species specificity (e.g., for UPEC) and is orally bioavailable. |
| Rhamnolipids [32] | Biosurfactants that potently inhibit bacterial adhesion by modulating the hydrophobicity and Lewis acidity of the bacterial cell surface. | Effective at sub-inhibitory concentrations, acting via anti-adhesion rather than biocidal activity. |
Anti-Adhesion Strategy Selection
This technical support center provides troubleshooting and methodological guidance for researchers optimizing surface materials for bacterial adhesion studies. The guides below address common experimental challenges in applying three key surface modification technologies to control and study microbial attachment, a critical factor in preventing biomedical device-associated infections [9].
Troubleshooting Guide: Plasma Electrolytic Oxidation (PEO)
FAQ: How can I control the porosity and roughness of my PEO coating to minimize bacterial adhesion? The surface morphology of PEO coatings is highly dependent on process parameters. Adjusting electrical settings and electrolyte composition can help you achieve the desired topography.
- Problem: Excessive roughness promoting bacterial adhesion.
- Solution: Optimize voltage and process duration. High voltage and prolonged treatment can create larger discharge channels and increased roughness [36]. A moderately rough surface (e.g., Ra = 0.8 μm) can reduce bacterial adhesion while still promoting tissue integration [37].
- Preventative Action: Standardize electrical parameters (voltage, current density, frequency) and electrolyte composition (e.g., silicate-based electrolytes often produce denser layers than phosphate-based ones) [36]. Consistently monitor processing time.
FAQ: Why is the antibacterial efficacy of my antibiotic-loaded PEO coating inconsistent? Controlled release of antibacterial agents from the porous PEO layer is crucial for long-term efficacy.
- Problem: Burst release of antibiotics, leading to short-term effectiveness.
- Solution: Utilize a post-sealing treatment or a layered structure. Integrating a Layered Double Hydroxide (LDH) top layer on the PEO coating can provide anion exchangeability for more controlled release of antibacterial ions [38].
- Preventative Action: Characterize the coating's release profile in a simulated physiological environment before biological testing. Ensure the loading method (e.g., electrolyte doping or post-impregnation) is optimized for the specific antibiotic [36].
FAQ: My PEO-coated titanium samples show poor wettability. How can I improve hydrophilicity? Wettability is a key surface property influencing bacterial and cellular behavior.
- Problem: Hydrophobic surface (high contact angle).
- Solution: PEO treatment typically enhances hydrophilicity. If results are poor, verify your electrolyte composition. Treatments in electrolytes containing calcium and phosphorus (Ca-P) have been shown to produce hydrophilic surfaces favorable for osteoblast attachment [36]. A study demonstrated PEO treatment reduced the contact angle on titanium from 92.5° to 68.3°, significantly enhancing hydrophilicity [37].
- Preventative Action: Ensure proper cleaning of substrates before PEO and characterize contact angle immediately after processing, as surface aging can alter wettability.
Table 1: Quantitative Analysis of PEO Coating Performance on Titanium Implants
| Surface Property / Bacterial Strain | Untreated Implants (Group A) | PEO-Treated Implants (Group B) | Percentage Improvement | P-value |
|---|---|---|---|---|
| S. aureus Adhesion (CFU) | 1.2 × 10⁵ ± 1.5 × 10³ | 4.2 × 10⁴ ± 1.1 × 10³ | 65% reduction | < 0.01 |
| E. coli Adhesion (CFU) | 1.5 × 10⁵ ± 1.8 × 10³ | 6.3 × 10⁴ ± 1.2 × 10³ | 58% reduction | < 0.01 |
| Surface Roughness (Ra, µm) | 0.4 ± 0.05 | 0.8 ± 0.07 | - | < 0.01 |
| Contact Angle (°) | 92.5° ± 2.1° | 68.3° ± 1.8° | Increased Hydrophilicity | < 0.01 |
Data adapted from a comparative study on titanium implants [37].
Experimental Protocol: PEO Coating for Antibacterial Surfaces
- Sample Preparation: Use commercially pure titanium implants. Clean substrates ultrasonically in acetone, ethanol, and deionized water to remove organic contamination [37] [39].
- PEO Process: Utilize a bipolar pulsed power supply. Employ an aqueous electrolyte solution containing potassium hydroxide and sodium silicate. Maintain a stable current density and process for a defined duration (e.g., 10-30 minutes). Keep electrolyte temperature controlled with a cooling system [37].
- Post-treatment: Rinse coated samples with deionized water and air dry. For drug-loaded coatings, immerse the porous PEO layer in an antibiotic solution (e.g., gentamicin) for 24 hours, then dry [36].
- Characterization: Assess surface roughness with profilometry, wettability with contact angle goniometry, and morphology with Scanning Electron Microscopy (SEM). Quantify bacterial adhesion using Colony Forming Unit (CFU) counts after incubating with bacterial suspensions like S. aureus and E. coli [37].
Diagram 1: PEO coating development and testing workflow.
Troubleshooting Guide: Chemical Grafting
FAQ: What is the difference between "grafting-to" and "grafting-from," and which should I use for antibacterial polymer brushes? The choice between grafting techniques impacts the density and stability of your functional polymer brushes.
- Problem: Uncertainty in selecting the appropriate grafting strategy.
- Solution:
- "Grafting-to": Pre-synthesized polymer chains are attached to the surface. It offers well-defined chains but can result in low grafting density due to steric hindrance [40] [41].
- "Grafting-from": Polymerization is initiated from the surface, allowing for high grafting density and precise control over brush thickness. This is often preferred for creating dense, contact-killing antibacterial surfaces [40] [41].
- Preventative Action: Base your selection on the application. Use "grafting-from" for high-density brushes needed to disrupt bacterial membranes effectively.
FAQ: My grafted polymer brushes are desorbing during bacterial culture. How can I improve stability? Desorption indicates weak attachment to the substrate.
- Problem: Polymer brush desorption during experiments.
- Solution: Ensure covalent bonding between the brush and the substrate. Physical adsorption is not sufficient for long-term stability in aqueous or complex biological environments. Use initiators that form strong covalent bonds with the substrate surface in "grafting-from" approaches [40].
- Preventative Action: Always include a step to verify grafting success and stability, such as using spectroscopic techniques (XPS, FTIR) or testing stability in buffer solutions before biological assays.
FAQ: How can I create a surface that both resists bacterial adhesion and kills on contact? Hybrid surfaces integrating multiple mechanisms offer enhanced functionality.
- Problem: Single-mechanism surfaces are insufficient.
- Solution: Design a dual-function surface. For example, graft zwitterionic polymer brushes (e.g., from 2-methacryloyloxyethyl phosphorylcholine or MPC) for their highly hydrophilic, antifouling properties to resist adhesion [9] [41]. Subsequently, incorporate cationic groups (e.g., quaternary ammonium compounds) within or alongside these brushes to achieve contact-killing of any bacteria that do adhere [9].
- Preventative Action: Carefully plan the surface chemistry to balance antifouling and killing motifs, ensuring one does not interfere with the other.
Table 2: Comparison of Chemical Grafting Strategies for Surface Modification
| Strategy | Mechanism | Advantages | Limitations | Best for Antibacterial Applications |
|---|---|---|---|---|
| Grafting-To | Pre-formed polymer chains covalently attach to the surface. | Polymer can be characterized before grafting; mature methodology. | Low grafting density due to steric hindrance; uneven layer thickness. | Attaching specific, pre-made bioactive polymers. |
| Grafting-From | Polymer chains grow from initiators anchored to the surface. | High grafting density; precise control over brush thickness and functionality. | Requires immobilization of an initiator on the surface. | Creating dense, non-leaching contact-killing or antifouling surfaces. |
| Grafting-Through | Surface-attached monomers are incorporated into a growing polymer chain. | A powerful surface modification process. | Specific mechanism needs further research and demonstration. | Applications requiring specific architectural control. |
Information synthesized from polymer grafting literature [40] [41].
Experimental Protocol: "Grafting-From" Polymer Brushes for Bacterial Adhesion Resistance
- Substrate Activation: Clean the polymer substrate (e.g., polycaprolactone) thoroughly. Immerse the substrate in a solution containing an initiator for radical polymerization (e.g., azobisisobutyronitrile - AIBN) to immobilize initiators on the surface [41].
- Surface-Initiated Polymerization: Place the initiator-bound substrate in a degassed solution containing the desired monomer (e.g., MPC for antifouling or a cationic monomer for contact-killing). Seal the reaction vessel and heat to the polymerization temperature (e.g., 60-70°C for several hours) [41].
- Post-polymerization: Remove the grafted substrate and wash thoroughly with an appropriate solvent to remove any physisorbed polymer or unreacted monomer.
- Characterization: Verify grafting success using techniques like FTIR, XPS, and ellipsometry to measure brush thickness. Assess antibacterial efficacy by quantifying bacterial adhesion (CFU counts) and viability (Live/Dead staining) against relevant pathogens [9].
Troubleshooting Guide: Topographical Patterning
FAQ: What is the optimal feature size for topographical patterns to reduce bacterial adhesion? Bacterial response is species-specific and depends on the scale and arrangement of features.
- Problem: Ineffective topographical patterns.
- Solution: Design features with dimensions similar to or smaller than the target bacteria (typically in the sub-micron to nano-scale). Research shows that S. aureus (~1 μm) adheres most strongly to features on the same scale, but features that limit the available contact area can inhibit adhesion [42]. Nanostructured surfaces can create physico-mechanical stresses that prevent strong attachment [9] [42].
- Preventative Action: Study the dimensions of your target bacterial strain and design patterns that minimize the total surface area available for contact.
FAQ: My patterned surfaces are difficult to clean and characterize after bacterial adhesion tests. Surface roughness and feature geometry can complicate downstream processes.
- Problem: Challenges in cleaning and imaging patterned surfaces.
- Solution: Use materials that are compatible with harsh cleaning protocols (e.g., autoclaving, strong solvents) if needed. For characterization, use non-destructive techniques like Confocal Laser Scanning Microscopy (CLSM) to visualize biofilms on complex topographies before proceeding to destructive CFU counts [42].
- Preventative Action: When designing patterns, consider the entire experimental workflow, including cleaning, sterilization, and characterization methods.
FAQ: Can surface topography alone prevent biofilm formation, or are chemical modifications also needed? While topography is powerful, a combined approach is often most effective.
- Problem: Biofilm formation occurs even on micro-patterned surfaces.
- Solution: For high-risk applications, consider hybrid surfaces. Combine topographical patterning with a low-surface-energy chemical coating (e.g., a fluorinated silane) to create a super-repellent surface, or integrate nanoscale features with a chemical grafting layer for synergistic effects [9].
- Preventative Action: Evaluate the clinical or environmental challenge. For long-term implantation where even a low level of adhesion is unacceptable, a hybrid active/passive strategy is recommended [9].
Experimental Protocol: Creating Micro-Patterned Silica Surfaces for Adhesion Studies
- Substrate Selection: Use commercially available silicon wafers with a thermally grown silicon dioxide layer [42].
- Patterning: Use Deep UV (DUV) lithography with an appropriate photomask to define the desired micron or sub-micron pattern (e.g., arrays of pillars or wells). Subsequently, use dry etching (e.g., reactive ion etching) to transfer the pattern into the silica layer to a controlled depth [42].
- Verification: Confirm feature dimensions (size, spacing, depth) using Scanning Electron Microscopy (SEM) and surface profilometry [42].
- Bacterial Adhesion Assay: Incubate patterned substrates and flat control substrates in bacterial suspension (e.g., E. coli or S. aureus) under static conditions for a set time (e.g., 2-4 hours for initial adhesion). Rinse gently to remove non-adherent cells, detach adherent cells by vortexing or sonication in PBS, and perform serial dilution and plating for CFU counts [37] [42].
Diagram 2: Topographical patterning and bacterial testing workflow.
The Scientist's Toolkit: Essential Research Reagents & Materials
Table 3: Key Reagents and Materials for Surface Modification and Antibacterial Testing
| Item Name | Function / Application | Specific Examples / Notes |
|---|---|---|
| Titanium Substrates | Base material for orthopedic/dental implant research. | Commercially pure titanium (cp-Ti) or Ti-6Al-4V alloy are standard [37]. |
| PEO Electrolyte Salts | Forms the coating from the substrate and electrolyte. | Potassium hydroxide (KOH), Sodium silicate (Na₂SiO₃), Calcium glycerophosphate (for bioactivity) [37] [36]. |
| Antibacterial Agents for Loading | Active agents for release-killing strategies. | Antibiotics (Gentamicin), Silver nanoparticles (AgNPs), Copper ions (Cu²⁺) [36]. |
| Polymerization Initiators | Starts the "grafting-from" process on surfaces. | Azobisisobutyronitrile (AIBN), other radical initiators [41]. |
| Functional Monomers | Building blocks for polymer brushes with specific properties. | 2-Methacryloyloxyethyl phosphorylcholine (MPC - antifouling), Cationic monomers (e.g., quaternary ammonium - contact-killing) [9] [41]. |
| Lithography Photomasks | Defines the topographical pattern on a substrate. | Chrome-on-quartz masks with custom designs for UV lithography [42]. |
| Bacterial Strains | Model organisms for adhesion and biofilm assays. | Staphylococcus aureus (Gram-positive), Escherichia coli (Gram-negative) [37] [42]. |
| Culture Media | Grows and maintains bacterial suspensions for assays. | Tryptic Soy Broth (TSB), Nutrient Agar [37] [42]. |
Smart responsive antibacterial materials (SRAMs) represent a paradigm shift in preventing and treating bacterial infections on surfaces. These advanced coatings are engineered to deliver a controlled antibacterial effect specifically when triggered by a bacterial presence, thereby minimizing non-target effects and the development of resistance [43]. Two of the most prominent and well-researched triggering mechanisms are the local acidic pH at an infection site and external near-infrared (NIR) light used for photothermal activation.
This technical support center is framed within a broader thesis on optimizing surface materials for bacterial adhesion studies. It is designed to assist researchers and scientists in diagnosing and resolving common experimental challenges encountered during the development and application of pH-triggered and photothermal antibacterial coatings. The guidance below is based on current literature and aims to ensure the reproducibility, efficacy, and accuracy of your research.
Troubleshooting Guides & FAQs
pH-Responsive Coatings
FAQ: What defines a coating as "pH-responsive"? A pH-responsive coating is designed to undergo a specific physical or chemical change—such as swelling, dissolution, or a change in surface charge—in response to a shift in pH. In the context of bacterial infections, this trigger is typically the acidic microenvironment (pH ~5-6) created by bacterial metabolism [44]. This change facilitates the targeted release of encapsulated antimicrobial agents (e.g., antibiotics, ions) precisely where needed.
Common Issues and Solutions:
Problem: Premature or Insufficient Release of Antimicrobial Agent The coating exhibits a "burst release" under neutral conditions or fails to release an adequate amount of the agent at the target acidic pH.
Potential Causes and Troubleshooting Steps:
- Incorrect Nanomaterial Selection or Synthesis: The chosen nanocarrier (e.g., MOF, polymeric micelle) may not have the appropriate pKa or degradation kinetics for the target pH range.
- Action: Review the synthesis protocol. Ensure the monomer ratios and cross-linking density are correct, as these directly affect the sensitivity of the material to pH changes. Characterize the material's swelling or degradation profile across a pH gradient (e.g., from pH 7.4 to 5.5).
- Inefficient Agent Encapsulation: The drug loading process may be suboptimal, leading to agent molecules being loosely bound to the surface (causing burst release) or trapped too deeply within the matrix (preventing release).
- Action: Optimize the drug loading method. Consider techniques like solvent evaporation or double emulsion. Measure encapsulation efficiency and loading capacity, and correlate these with the release profile data [44].
- Inaccurate Simulation of Infection Microenvironment: Testing the coating release profile only in standard buffer solutions may not replicate the complex conditions of a real biofilm.
- Action: Validate release kinetics in a more biologically relevant medium, such as a bacterial culture supernatant, which contains enzymes and other biomolecules that could influence the trigger mechanism.
- Incorrect Nanomaterial Selection or Synthesis: The chosen nanocarrier (e.g., MOF, polymeric micelle) may not have the appropriate pKa or degradation kinetics for the target pH range.
Problem: Loss of Coating Stability or Adhesion The coating delaminates, swells excessively, or loses its structural integrity before or after the pH trigger.
Potential Causes and Troubleshooting Steps:
- Poor Substrate Preparation: Inadequate cleaning, priming, or surface activation of the underlying material (e.g., titanium implant, resin composite) prevents strong coating adhesion.
- Action: Follow rigorous surface preparation protocols, including solvent cleaning, plasma treatment, or the application of a compatible primer to ensure covalent bonding [31].
- Internal Stress from Swelling: The repeated swelling and deswelling of pH-sensitive polymers can generate mechanical stress, leading to cracking or delamination over time.
- Action: Formulate the coating with a blend of responsive and non-responsive (structural) polymers. Incorporate cross-linkers to enhance mechanical stability while retaining responsiveness.
- Poor Substrate Preparation: Inadequate cleaning, priming, or surface activation of the underlying material (e.g., titanium implant, resin composite) prevents strong coating adhesion.
Photothermal Antibacterial Coatings
FAQ: How do photothermal antibacterial coatings work? These coatings are embedded with photothermal agents (e.g., gold nanoparticles, carbon-based materials, MXenes) that efficiently absorb light energy, typically from a Near-Infrared (NIR) laser. Upon irradiation, this energy is converted into localized heat, rapidly elevating the temperature to a level that is lethal to bacteria (often >50 °C) and can disrupt biofilms [44] [45].
Common Issues and Solutions:
Problem: Inconsistent or Inadequate Temperature Rise The coating fails to reach the required bactericidal temperature upon NIR irradiation, or the heating is uneven across the surface.
Potential Causes and Troubleshooting Steps:
- Inhomogeneous Distribution of Photothermal Agents: Agglomeration of nanoparticles within the coating matrix creates "hot spots" and areas with poor heat generation.
- Action: Improve nanoparticle dispersion by using surfactants or surface functionalization. Use sonication during the coating formulation process and confirm homogeneity with microscopy (e.g., SEM).
- Suboptimal Irradiation Parameters: The laser power density, wavelength, or exposure time is not calibrated for the specific photothermal agent and coating thickness.
- Action: Systemically optimize the irradiation parameters. Perform a calibration curve of temperature increase versus laser power and time. Ensure the laser wavelength matches the absorption peak of the photothermal agent (e.g., 808 nm for many agents) [44].
- Quenching of Photothermal Efficiency: In dense coatings, the photothermal agents may interact with each other, leading to energy quenching instead of heat conversion.
- Action: Reduce the loading concentration of the photothermal agent to an optimal level that balances efficacy with dispersion. Consider using agents with higher photothermal conversion efficiencies.
- Inhomogeneous Distribution of Photothermal Agents: Agglomeration of nanoparticles within the coating matrix creates "hot spots" and areas with poor heat generation.
Problem: Photothermal Damage to Coating or Substrate The intense local heat causes cracking, bubbling, or degradation of the coating, or even damages the underlying substrate.
Potential Causes and Troubleshooting Steps:
- Excessive Temperature or Irradiation Time: The thermal stress exceeds the thermal stability limit of the polymer matrix or substrate material.
- Action: Determine the maximum safe operating temperature for your coating system. Use the minimum laser power and time required to achieve the desired antibacterial effect (e.g., 50-60°C for 3-10 minutes) [44].
- Poor Thermal Compatibility: A mismatch in the coefficient of thermal expansion between the coating and the substrate creates stress during rapid heating/cooling cycles.
- Action: Incorporate flexible cross-linkers or use an intermediate primer layer with better thermal properties to buffer the stress.
- Excessive Temperature or Irradiation Time: The thermal stress exceeds the thermal stability limit of the polymer matrix or substrate material.
The following tables summarize key quantitative data from recent studies on controlled-release antimicrobial nanomaterials, providing a reference for expected performance and experimental design.
Table 1: Performance Data of pH-Responsive Antimicrobial Nanomaterials
| Nanomaterial | Material Type | Trigger pH | Release Kinetics | Key Outcomes | Cited Study |
|---|---|---|---|---|---|
| PMs@NaF-SAP | Polymeric micelles | 5.0 | 70% Tannic Acid, 80% NaF within 24 hrs | Multi-stimuli responsive; efficacy in vitro & in vivo | [44] |
| Eu@B-UiO-66/Zn | MOF composite | Acidic | Sustained release over 60 days | Synergistic release & ROS generation; biofilm disruption | [44] |
| BioUnion | Bioactive glass | 4.5 - 5.5 | Enhanced Zn²⁺/Ca²⁺ release | Multi-ion synergy & remineralization | [44] |
| CaF₂ nanoparticles | Resin additive | 4.0 | Enhanced F⁻ release; rechargeable | Long-term, rechargeable fluoride release | [44] |
Table 2: Performance Data of Light/Heat-Responsive Antimicrobial Nanomaterials
| Nanomaterial | Stimulus | Activation Parameters | Key Outcomes | Cited Study |
|---|---|---|---|---|
| CG-AgPB hydrogel | NIR Light (808 nm) | >50 °C within 3 min | Synergistic photothermal & ion (Fe²⁺/Ag⁺) release | [44] |
| Sr-ZnO@PDA | Yellow Light & Ultrasound | N/A | ROS generation; Sr²⁺ release promotes remineralization | [44] |
| MX/AgP-GOx | NIR Light | Instant response to NIR | Multi-modal: phototherapy, chemotherapy, metabolic intervention | [44] |
Experimental Protocols
Protocol: Fabrication of a Model pH-Responsive Polymeric Micelle Coating
This protocol outlines the synthesis of polymeric micelles loaded with an antimicrobial agent (e.g., Tannic Acid and Sodium Fluoride) for integration into a experimental coating system [44].
Materials:
- Amphiphilic block copolymer (e.g., PEG--PCL)
- Antimicrobial agent (e.g., Tannic Acid, NaF)
- Organic solvent (e.g., Acetone, DMSO)
- Phosphate Buffered Saline (PBS) at various pH levels (7.4, 6.5, 5.0)
- Dialysis tubing
Method:
- Dissolution: Dissolve 50 mg of the amphiphilic block copolymer and 10 mg of the antimicrobial agent in 5 mL of a suitable organic solvent.
- Micelle Formation: Slowly add this solution dropwise into 20 mL of vigorously stirred deionized water. The sudden change in solvent environment will cause the polymer to self-assemble into micelles, with the hydrophobic cores encapsulating the agent.
- Purification: Transfer the entire solution into dialysis tubing (appropriate MWCO). Dialyze against 2 L of deionized water for 24 hours to remove the organic solvent and unencapsulated agent, changing the water every 6 hours.
- Characterization: Determine the size and zeta potential of the micelles using Dynamic Light Scattering (DLS). Measure encapsulation efficiency via UV-Vis spectroscopy of the dialysate.
- Integration and Testing: Incorporate the purified micelles into your coating matrix (e.g., a resin or polymer solution) and cast onto substrates. To test release, immerse the coated samples in PBS at different pH values and use UV-Vis or HPLC to quantify agent release over time.
Protocol: Evaluating Photothermal Antibacterial Efficacy
This protocol describes a standard method to assess the antibacterial performance of a photothermal coating in vitro.
Materials:
- Coated substrates and uncoated controls
- Bacterial strain (e.g., S. aureus)
- Tryptic Soy Broth (TSB) and Agar plates
- NIR Laser (e.g., 808 nm diode laser) with power meter
- Infrared thermal camera
Method:
- Biofilm Formation: Inoculate coated substrates with a bacterial suspension (e.g., 10⁷ CFU/mL in TSB) and incubate for 24-48 hours to allow biofilm formation.
- Photothermal Treatment: Irradiate the biofilm-covered coatings with the NIR laser at a predetermined power density (e.g., 1.5 W/cm²) for a set time (e.g., 5-10 minutes). Use an infrared thermal camera to monitor the temperature rise in real-time.
- Viability Assessment:
- Post-treatment: Immediately after irradiation, gently wash the substrates to remove loose bacteria.
- CFU Counting: Place the substrates in PBS and sonicate to dislodge the biofilm. Serially dilute the PBS, plate on TSB agar, and incubate for 24 hours. Count the Colony Forming Units (CFUs).
- Viability Staining: As a complementary method, use a Live/Dead bacterial viability kit (e.g., SYTO9 and Propidium Iodide) and visualize with confocal laser scanning microscopy (CLSM).
- Analysis: Compare the CFU counts and viability staining results from the irradiated experimental group to non-irradiated coated controls and irradiated uncoated substrates to determine the specific contribution of the photothermal effect.
Mechanism and Workflow Visualizations
Diagram Title: Mechanism of pH-Triggered Antibacterial Action
Diagram Title: NIR-Triggered Photothermal Antibacterial Mechanism
The Scientist's Toolkit: Research Reagent Solutions
Table 3: Essential Materials for Smart Antibacterial Coating Research
| Reagent/Material | Function in Research | Example Applications |
|---|---|---|
| Polymeric Micelles (e.g., PEG--PCL) | Nanocarrier for controlled drug release; shell can be engineered for targeting. | pH-responsive release of antibiotics, tannic acid, fluoride [44]. |
| Metal-Organic Frameworks (MOFs) | Highly porous nanostructures for high-capacity agent loading; can be functionalized. | pH-triggered release of eugenol; synergistic ROS generation [44]. |
| Photothermal Agents (e.g., AuNRs, MXenes) | Convert light energy to localized heat for thermal ablation of bacteria. | NIR-triggered hyperthermia; combo therapy with ion release [44]. |
| Bioactive Glass | Source of bioactive ions (e.g., Zn²⁺, F⁻, Ca²⁺); promotes remineralization. | Multi-ion synergistic antibacterial effect at acidic pH [44]. |
| Enzymes (e.g., Glucose Oxidase - GOx) | Catalyzes substrate to shift local microenvironment (e.g., produce acid/H₂O₂). | Creates self-amplifying, bacteria-triggered cascade reactions [44]. |
Frequently Asked Questions (FAQs)
Q1: What are the primary mechanisms behind the sustained antimicrobial activity of silver ions? Silver ions (Ag+) exhibit potent, prolonged antimicrobial activity through multiple mechanisms. Once silver enters a bacterial cell, it accumulates as silver nanoparticles, causing cell death; the dead bacterial cell itself then becomes a reservoir for silver, providing sustained release [46]. The silver ions are active through an "oligodynamic" effect, disrupting bacterial cell membranes, inhibiting reproduction, and binding to DNA and RNA to condense them, which disrupts protein synthesis and cell division [46]. The sustained release is crucial for long-term efficacy, as a steady, prolonged release of silver cations in trace amounts (as low as 0.1 ppb) is sufficient to render antimicrobial efficacy [47].
Q2: My sustained-release system is depleting its antimicrobial agent too quickly. What factors control the release rate? The release rate from a sustained-release system is controlled by several physical and chemical parameters. Key factors include:
- Soaking time/Diffusion rate: The release rate is often higher initially and may stabilize over time [47].
- Concentration of the active agent: Composites with higher concentrations of the active agent (e.g., silver powder) typically possess a higher release rate [47].
- Specific surface area of the agent: A larger specific surface area of the active agent (e.g., silver powder) can enhance the release rate [47].
- Carrier material properties: The inherent hygroscopicity (water-absorbing ability) of the polymer matrix (e.g., polyamide) is critical for facilitating the ion release process [47].
- Environmental pH: Release can be pH-sensitive. For instance, the chelation between minocycline and metal ions decreases with pH, allowing for a 'smart,' accelerated release in acidic environments often found at sites of severe pathology [48].
Q3: How can I quantify the release of metal ions, like silver, from my biomaterial composite? A validated method for quantifying very low concentrations of released silver ions (in the micro molar level) is Anodic Stripping Voltammetry (ASV) [47]. This electrochemical technique involves depositing silver ions onto an electrode and then stripping them off, with the resulting current being proportional to the ion concentration. A calibration curve is first established using standard solutions with known silver ion concentrations, which is then used to quantitatively estimate the silver ion release from experimental samples [47].
Q4: Can natural compounds be used for anti-adhesion strategies, and how do they work? Yes, natural compounds can effectively reduce bacterial adhesion by modulating physicochemical surface properties rather than necessarily killing bacteria. Compounds like Rhamnolipids (a biosurfactant), Carrageenan (a polysaccharide), and Vitreoscilla filiformis extract have been shown to significantly inhibit the adhesion of skin bacteria like S. aureus [32]. The primary mechanism is altering the hydrophobicity and Lewis acid-base characteristics (electron donor/acceptor potential) of either the bacterial surface or the substrate material. This modification disrupts the attractive forces that facilitate the initial, reversible adhesion of bacteria to a surface [32].
Troubleshooting Guides
Problem: Inconsistent or Insufficient Antimicrobial Ion Release
| Symptoms | Possible Root Cause | Recommended Steps for Resolution |
|---|---|---|
| Low initial release rate, poor long-term efficacy. | Low loading or poor dispersion of the active agent (e.g., silver) within the matrix. | Increase the concentration of the antimicrobial agent. Use agents with a higher specific surface area to improve contact with the environment [47]. |
| Rapid initial release ("burst release") followed by no long-term activity. | Matrix material is too hydrophilic or porous, or the agent is not properly integrated for sustained release. | Select a less hygroscopic polymer matrix to slow water diffusion and ion release. Explore coacervation-based complex formation using metal ion linkers (e.g., Ca²⁺) for more stable, long-term release [48]. |
| Release rate varies significantly with small pH changes. | The formulation is overly sensitive to environmental pH. | Characterize the pH sensitivity of your system. If a steady release is desired, reformulate to use a polymer/agent combination with less pH-dependent release kinetics [48]. |
Diagnostic Steps:
- Measure Release Profile: Use Anodic Stripping Voltammetry (ASV) or UV-Vis spectroscopy to accurately quantify the ion release over time and create a release profile [47] [48].
- Characterize Material: Analyze the composite using electron microscopy (SEM/TEM) to verify the dispersion and distribution of the active agent within the polymer matrix [46] [47].
- Test Bioactivity: Confirm that the released ions remain bioactive using standard antimicrobial assays like agar well diffusion or time-kill assays against relevant bacterial strains [46].
Problem: Bacterial Adhesion is Not Reduced Despite Antimicrobial Agent Presence
| Symptoms | Possible Root Cause | Recommended Steps for Resolution |
|---|---|---|
| High bacterial load on material surface, evidence of biofilm. | The surface topography or chemistry inadvertently promotes adhesion, overpowering the release-based strategy. | Modify the surface to have passive anti-adhesion properties. Incorporate hydrophilic or zwitterionic polymers to create a hydration barrier that repels bacteria [9] [32]. |
| Antimicrobial agent is released but bacteria persist. | Developed bacterial resistance to the specific agent. | Implement a hybrid strategy. Combine the releasing agent with a contact-killing mechanism (e.g., cationic surfaces that disrupt membranes) or an anti-adhesion coating to create a multi-targeted approach [9]. |
| Adhesion is reduced for some bacterial species but not others. | Species-specific differences in surface physicochemical properties. | Characterize the hydrophobicity and Lewis acid-base properties of your target bacteria [32]. Tailor your anti-adhesion strategy by selecting compounds (e.g., Rhamnolipids) known to alter these specific properties effectively against your target strains [32]. |
Diagnostic Steps:
- Surface Analysis: Perform contact angle measurements to determine surface wettability and use Microbial Adhesion To Solvents (MATS) tests to characterize the physicochemical properties of bacterial surfaces after treatment [32].
- Check for Viability vs. Adhesion: Distinguish between bacteria that are dead but still attached and those that are viable and adhering. Use live/dead staining in conjunction with adhesion counts.
- Gene Expression Analysis: Conduct transcriptomic analysis (RNA-seq) to check if adhesion-related genes in the bacteria are being upregulated in response to your material, indicating an adaptive response [32].
Experimental Protocols for Key Methodologies
Protocol 1: Assessing Sustained Release and Efficacy of Silver-Treated Bacteria
This protocol details a method to create and test silver-killed bacteria that act as a sustained-release reservoir for silver ions [46].
Workflow Diagram: Preparation and Efficacy Testing of Silver-Killed Bacteria
Research Reagent Solutions:
- Bacterial Strain: Escherichia coli O104:H4 (or target pathogen) [46].
- Silver Source: Silver Nitrate (AgNO₃) solution [46].
- Culture Medium: Nutrient Broth and appropriate agar [46].
- Buffer: Pyrogen-free water and saline for dilutions [46].
Detailed Steps:
- Culture Preparation: Inoculate E. coli O104:H4 into nutrient broth and incubate at 37°C for 24 hours [46].
- Harvesting: Centrifuge the overnight culture at 4000 rpm for 10 minutes. Discard the supernatant and wash the pellet three times by resuspending it in pyrogen-free water and re-centrifuging [46].
- Standardization: Resuspend the final pellet in pyrogen-free water and adjust the turbidity to a 0.5 McFarland standard [46].
- Silver Treatment: Add 1.0 mL of the bacterial suspension to a tube containing 2 mL of AgNO₃ solution (to achieve a final concentration, e.g., 6 ppm). Incubate the mixture overnight at 37°C under dark conditions [46].
- Separation: Centrifuge the silver-treated bacteria at 4000 rpm for 10 minutes. Separate the pellet (silver-killed bacteria) from the supernatant. Filter the supernatant through a 0.2 µm syringe filter [46].
- Activity Testing:
- Agar Well Diffusion: Use the pellet suspension and filtered supernatant as test substances in an agar well diffusion assay against fresh, viable cells of target bacteria (e.g., E. coli O157:H7, MRSA). Measure zones of inhibition after 24h incubation at 37°C [46].
- Time-Kill Assay: Inoculate tubes of Mueller-Hinton Broth with fresh viable bacteria. Add silver nitrate solution, pellet suspension, or supernatant. Incubate at 37°C with shaking. Take samples at defined time intervals (0, 15, 30, 60, 90, 120 min), perform serial dilutions, and pour-plate to count viable colonies [46].
- Characterization (TEM): Place a drop of the silver-killed bacterial suspension onto a carbon-coated copper grid, air dry, and analyze using Transmission Electron Microscopy to visualize the accumulation of silver nanoparticles on and inside the cells [46].
Protocol 2: Forming Metal Ion-Assisted Sustained Release Complexes
This protocol describes creating sustained-release complexes using divalent metal ions (Ca²⁺ or Mg²⁺) to form a coacervate with a charged polymer and a drug [48].
Workflow Diagram: Preparation of Metal Ion-Assisted Complexes
Research Reagent Solutions:
- Polymer: Dextran Sulfate (500 kDa) [48].
- Divalent Metal Ions: Calcium Chloride (CaCl₂) or Magnesium Chloride (MgCl₂) solutions [48].
- Active Agent: Minocycline Hydrochloride (MH) or other metal-ion-binding drugs [48].
- Release Medium: Hank's Balanced Salt Solution (HBSS) [48].
Detailed Steps:
- Solution Preparation: Dissolve Dextran Sulfate (DS) in a CaCl₂ or MgCl₂ solution. Separately, prepare a minocycline (MH) solution at 2 mg/ml in deionized water [48].
- Complex Formation: Mix 150 µL of the DS solution with an equal volume (150 µL) of the MH solution. Vortex the mixture for 10 seconds to induce the formation of an insoluble complex [48].
- Harvesting Complexes: Collect the complexes by centrifugation at 10,000 rpm for 10 minutes. Wash the pellet three times with deionized water to remove any unbound metal ions or agents [48].
- Characterization:
- Entrapment & Loading Efficiency: Determine the amount of MH and DS loaded by measuring their concentrations in the supernatant using UV-Vis spectroscopy (for MH) and toluidine blue titration (for DS) [48].
- Morphology: Analyze the lyophilized complex morphology using Scanning Electron Microscopy (SEM) [48].
- Zeta Potential: Measure the surface charge of the complexes suspended in water using a zeta-sizer [48].
- Release Study: Incubate complexes encapsulating a known amount of MH (e.g., 300 µg) in release medium (e.g., 300 µL HBSS) at 37°C. Change the release medium every 24 hours. Quantify the amount of MH released each day by measuring the UV absorbance of the release medium at 245 nm [48].
The Scientist's Toolkit: Essential Research Reagents
| Reagent / Material | Function in Research | Key Consideration |
|---|---|---|
| Silver Nitrate (AgNO₃) | Source of silver ions (Ag⁺) for creating antimicrobial composites and treating bacteria [46] [47]. | Purity is critical; solutions should be prepared fresh and stored in the dark to prevent reduction to metallic silver. |
| Dextran Sulfate (DS) | A charged polymer used to form sustained-release complexes via metal-ion-assisted coacervation [48]. | Molecular weight (e.g., 500 kDa) influences complex formation and release kinetics. |
| Calcium Chloride (CaCl₂) | Divalent metal ion linker that facilitates the formation of insoluble complexes between DS and drugs like minocycline [48]. | Concentration controls the density of the complex and the subsequent release profile of the active agent. |
| Polyamide (Nylon) | A hygroscopic thermoplastic polymer used as a matrix for silver composites; its water absorption facilitates Ag⁺ release [47]. | The degree of hygroscopicity and processing temperature are key selection factors. |
| Rhamnolipids | A natural biosurfactant used in anti-adhesion strategies; modulates surface hydrophobicity of bacteria and materials [32]. | Effective at non-biocidal concentrations, making it suitable for preventing adhesion without selecting for resistance. |
| Toluidine Blue | A cationic dye used to titrate and quantify the concentration of anionic polymers like Dextran Sulfate in solution [48]. | The assay relies on a metachromatic shift (color change) upon binding to sulfate groups. |
Overcoming Research Hurdles: From In Vitro- In Vivo Translation to Long-Term Stability
Troubleshooting Guide & FAQs
Why do my in vitro bacterial adhesion results not predict clinical outcomes?
Clinical environments introduce numerous variables absent in controlled labs. A 2025 study on temporary prostheses found that 3D-printed difunctional methacrylate resin (3Dresin) demonstrated the highest microbial adhesion despite its low surface roughness, a result that conventional surface property theories would not predict [49]. This highlights that material composition and manufacturing methods can override individual surface properties in complex clinical settings.
- Primary Issue: Over-reliance on single-property analysis (e.g., only roughness or only wettability).
- Solution: Adopt a multi-factorial experimental design that accounts for the synergistic effects of surface properties and the complex biofilm life cycle.
How do surface roughness (Ra) and hydrophobicity jointly influence bacterial adhesion?
The relationship is not linear or independent. Research on collagen films for food packaging demonstrated that both surface roughness and hydrophobicity are major factors affecting bacterial adhesion, and their effects are interconnected [50]. A smoother surface reduces the effective contact area and adhesion sites for bacteria, while hydrophobicity influences thermodynamic interactions via the "hydration layer" [50].
- Primary Issue: Assuming that a lower Ra or specific contact angle will universally reduce adhesion.
- Solution: Characterize both properties and understand that an optimal combination exists, which is specific to the material and microbial strain.
What is a robust methodology for standardized bacterial adhesion testing?
A standardized protocol ensures reproducible and comparable results. The following table summarizes the key steps from a 2025 study on resin composites [12].
Table: Key Steps for Bacterial Adhesion Testing with S. mutans
| Step | Description | Key Parameters |
|---|---|---|
| 1. Specimen Preparation | Fabricate disk-shaped specimens and polish to a standardized smoothness. | Diameter: 6.5 mm; Polish with 2000-grit & 4000-grit abrasive paper [12]. |
| 2. Surface Characterization | Measure surface roughness (Ra) using a non-contact 3D optical profilometer. | Report Ra in micrometers (µm); Use multiple specimens (e.g., n=5/group) [12]. |
| 3. Bacterial Cultivation | Grow microorganisms anaerobically and prepare a standardized cell suspension. | Incubate for 16h at 37°C; Adjust suspension to 5x10⁸ CFU/mL [12]. |
| 4. Adhesion Phase | Immerse specimens in the bacterial suspension to allow for initial adhesion. | Incubation time: 30 minutes; Use gentle rolling to ensure even coverage [12]. |
| 5. Analysis | Quantify adhered bacteria and perform statistical analysis. | Remove unbonded bacteria by washing; Determine CFU count; Use ANOVA for data analysis [12]. |
The Scientist's Toolkit: Research Reagent Solutions
Table: Essential Materials for Bacterial Adhesion Studies
| Item | Function & Rationale |
|---|---|
| Phosphate-Buffered Saline (PBS) | Provides an isotonic and pH-stable environment for rinsing cells and preparing suspensions, preventing osmotic shock that could affect bacterial viability [12]. |
| Mitis Salivarius Agar (with Bacitracin) | A selective growth medium used for the specific cultivation and enumeration of Streptococcus mutans from adhered samples [12]. |
| High-Purity Polishing Abrasives | (e.g., 4000-grit FEPA abrasive paper) Ensures a consistent and reproducible surface finish across all specimens, which is critical for reliable Ra measurement and adhesion comparison [12]. |
| Short Fiber-Reinforced Composites (SFRC) | A class of modern restorative materials. A 2025 study confirmed they show similar initial bacterial adhesion to traditional materials, making them a relevant subject for research into durable, low-fouling surfaces [12]. |
| Collagen Films with Zein | A bio-based material used in research to investigate how the addition of hydrophobic plant proteins (Zein) can reduce bacterial adhesion by modifying surface hydrophobicity [50]. |
Visualizing the Multi-Factorial Adhesion Workflow
The following diagram maps the logical relationship between surface properties, experimental variables, and the final outcome of bacterial adhesion studies, helping to identify where discrepancies between lab and clinic may arise.
Frequently Asked Questions (FAQs)
Q1: What are the primary environmental factors that lead to coating degradation and subsequent bacterial adhesion? Environmental factors such as intense UV irradiation, high humidity, and wide temperature fluctuations are primary drivers of coating degradation [51]. UV exposure causes polymer degradation, leading to surface roughness and reduced gloss, while humidity promotes hydrolysis, weakening the coating's adhesion to the substrate [51]. These physical changes create micro-roughness and cracks that facilitate bacterial attachment and biofilm formation, compromising the coating's biostability [9] [52].
Q2: How can I quickly determine if my coating's physical properties have been compromised, increasing the risk of biofilm formation? You can monitor these four key physical properties, which are early indicators of coating degradation [51]:
- Adhesion Strength: Measured in MPa; a decrease indicates a weakening bond to the substrate.
- Water Contact Angle (WCA): Measured in degrees; a shift from the original value signifies a change in surface wettability.
- Glossiness: Measured in Gloss Units (Gu); a reduction suggests surface roughening.
- Yellowness Index: An increase signals polymer aging, often due to UV exposure.
Q3: Our coatings show good initial antibacterial performance but fail quickly. What strategies can enhance long-term durability? Relying on a single release-based antimicrobial mechanism can lead to short-lived efficacy. For enhanced durability, consider implementing hybrid strategies that combine multiple mechanisms [9] [53]. For example, integrate a contact-killing component (e.g., cationic polymers) with a passive antifouling surface (e.g., zwitterionic coatings) to achieve sustained antibacterial action even after any releasable agents are depleted [9] [54].
Q4: What are the best surface modification techniques to prevent the initial adhesion of bacteria? Two highly effective approaches are:
- Topographical Patterning: Creating micro- or nano-scale patterns (e.g., lines, squares) inspired by insect wings (bioinspired nano-daggers) can physically inhibit bacterial attachment [53] [55].
- Chemical Modification: Applying zwitterionic polymer brushes or highly hydrophilic coatings forms a hydration layer that acts as a physical and energetic barrier, repelling bacteria and preventing the initial reversible attachment from becoming irreversible [9] [54].
Troubleshooting Guides
Problem 1: Rapid Coating Degradation in Harsh Environments
Issue: Coating shows premature failure, including cracking, loss of adhesion, and discoloration when exposed to specific environmental conditions.
| Troubleshooting Step | Description & Experimental Protocol | Key Parameters to Measure |
|---|---|---|
| 1. Identify Key Degradation Factors | Conduct a controlled aging experiment. Expose coating samples to individual stressors: UV radiation (using a UV chamber), elevated humidity (humidity cabinet), and cyclic temperatures [51]. | Glossiness (Gloss meter), Yellowness Index (Spectrophotometer), Adhesion (Pull-off test per ASTM D4541) [51]. |
| 2. Analyze Surface Hydrophobicity | Measure the Water Contact Angle (WCA) before and after aging. A significant decrease in WCA indicates increased surface hydrophilicity and potential degradation [51]. | Water Contact Angle (WCA) (Goniometer). Compare values before/after aging [51]. |
| 3. Implement a Predictive Model | Use a two-stage machine learning model. First, input environmental data (UV, humidity, temp) to predict physical property changes. Second, use these predicted properties to forecast corrosion failure risk [51]. | Input: Temperature, Humidity, UV Dose. Output: Predicted Adhesion, WCA, Gloss. Final Output: Coating Damage Risk (Intact/Damaged) [51]. |
Problem 2: Uncontrolled Bacterial Adhesion and Biofilm Formation
Issue: Despite having an antimicrobial coating, bacteria continue to adhere and form robust biofilms on the surface.
| Troubleshooting Step | Description & Experimental Protocol | Key Parameters to Measure |
|---|---|---|
| 1. Characterize Surface Physicochemistry | Analyze the surface properties that directly influence bacterial attachment. Use a goniometer for wettability, atomic force microscopy (AFM) for topography and roughness, and zeta potential measurements for surface charge [9] [52]. | Surface Roughness (Ra in nm), Surface Charge (Zeta potential in mV), Wettability (WCA in degrees) [9]. |
| 2. Evaluate Anti-Adhesive Properties | Perform a bacterial adhesion assay. Incubate the coated surface in a bacterial suspension (e.g., S. aureus or E. coli) for a set time, gently rinse to remove non-adhered cells, and quantify adhered cells [55]. | Number of Adhered Cells (via microscopy counting or Colony Forming Units (CFU)), Biofilm Biomass (via crystal violet staining) [55]. |
| 3. Switch to a Hybrid Active-Passive Strategy | If the coating is purely passive, add an active component. Modify the surface to have a passive antifouling layer (e.g., PEG or zwitterionic polymer) and incorporate a contact-killing agent (e.g., antimicrobial peptides or quaternary ammonium compounds) [9] [54]. | Zone of Inhibition (for release-based), Contact-Killing Efficiency (compare CFU on test vs. control surfaces), Cytocompatibility (for medical applications) [9]. |
Experimental Protocols for Key Characterizations
Protocol 1: Quantifying Bacterial Adhesion and Biofilm Formation
Objective: To assess the efficacy of a modified surface in resisting bacterial adhesion and biofilm development.
- Surface Preparation: Sterilize the test coatings (e.g., topographically patterned COC substrates [55]) and control surfaces using UV plasma for 30 minutes.
- Bacterial Culture: Grow a standardized inoculum of the target bacterium (e.g., Candida albicans or Staphylococcus epidermidis) in an appropriate liquid medium like YEPD to an OD600 of approximately 4.0 [55].
- Inoculation and Incubation: Dilute the culture 1:10 into a fresh medium supplemented with 10% fetal bovine serum. Submerge the test surfaces in the culture and incubate at 37°C with agitation (200 rpm) for 24 hours to promote biofilm formation [55].
- Analysis:
- Quantification: Gently rinse the samples to remove planktonic cells. Detach the adhered biofilm by sonication in a saline solution. Plate the serial dilutions of the solution on agar plates and count the Colony Forming Units (CFU) after 24 hours of incubation [55].
- Visualization: Fix the biofilm with 4.5% glutaraldehyde, dehydrate with a graded ethanol series, and sputter-coat for analysis using Scanning Electron Microscopy (SEM) to observe the biofilm structure [55].
Protocol 2: Evaluating Coating Durability via Accelerated Aging
Objective: To predict the long-term stability of a coating under specific environmental stressors.
- Baseline Characterization: Measure and record the initial glossiness, adhesion strength, water contact angle, and color/yellowness of the pristine coatings [51].
- Environmental Chamber Setup: Place the coated samples in an environmental chamber. Program the chamber to simulate the target conditions, for example:
- UV Aging: Expose samples to UV-A (340 nm) at 0.7 W/m² for 8 hours at 60°C, followed by 4 hours of condensation at 50°C, repeated in cycles [51].
- Humidity/Temperature Aging: Subject samples to cyclic variations, such as 24 hours at 40°C and 95% relative humidity, followed by 24 hours at 25°C and 50% RH [51].
- Periodic Sampling: Remove samples at predetermined intervals (e.g., 250, 500, 1000 hours).
- Post-Test Analysis: Re-measure the same physical properties from Step 1. Analyze the data to determine the degradation rate and identify the primary failure mode for each environmental condition [51].
Coating-Bacteria Interaction Workflow
Research Reagent Solutions
The following table lists key materials and reagents essential for developing and testing durable, biostable coatings.
| Reagent/Material | Function & Explanation | Key Characteristics |
|---|---|---|
| Zwitterionic Monomers (e.g., SBMA) | Forms highly hydrophilic, antifouling polymer brushes that resist protein adsorption and bacterial adhesion via a strong surface hydration layer [9] [54]. | Electrically neutral; creates a steric and energetic barrier [9]. |
| Cationic Polymers (e.g., Quaternary Ammonium, Chitosan) | Provides contact-mediated killing by disrupting negatively charged bacterial membranes through electrostatic interactions [9] [52]. | Positive surface charge; charge-density-dependent efficacy [9]. |
| Cyclic Olefin Copolymer (COC) | A substrate material for fabricating topographical patterns to study and inhibit bacterial attachment; excellent biocompatibility and low extractables [55]. | Low water absorption; easily patterned via photolithography [55]. |
| Antimicrobial Peptides (AMPs) | Biological contact-killing agents; can be tethered to surfaces to provide broad-spectrum antimicrobial activity with potential biocompatibility [54]. | Broad-spectrum activity; membrane-disrupting mechanisms [54]. |
| Polyurethane (PU) Varnish | A model polymer coating system for studying environmental degradation and predicting service life via machine learning models [51]. | Widely used; well-characterized degradation profile [51]. |
Mitigating Dead Cell and Debris Accumulation on Anti-Fouling Surfaces
FAQs: Addressing Common Experimental Challenges
Q1: My anti-fouling coating shows good bacterial repulsion but accumulates significant non-viable cell debris, skewing my adhesion metrics. How can I mitigate this?
A1: Accumulation of non-viable material often indicates a passive repulsion mechanism that is ineffective against non-motile, adhesive debris. Consider these strategies:
- Transition to Active & Passive Dual-Functionality: Integrate a bioactive agent that disrupts the integrity of dead cells and debris. For example, incorporating nitric oxide (NO)-releasing donors like S-nitrosoglutathione (GSNO) into a slippery surface creates a dual-action material. The passive surface repels adherent foulants, while the continuous, low-level release of NO helps disrupt accumulated dead cells and biofilms by inducing nitrosative stress [56].
- Optimize Surface Hydration: Ensure your surface maintains a strong hydration layer. Zwitterionic polymer brushes, such as poly(sulfobetaine methacrylate) (pSBMA), form a robust physical and energetic barrier via a tightly bound water layer. This layer is highly effective at resisting the adhesion of both live cells and non-viable debris, as it presents a neutral, hydrophilic interface that minimizes hydrophobic and electrostatic interactions [57].
Q2: How can I differentiate between the adhesion of live bacteria and the accumulation of debris in my assay results?
A2: Accurately distinguishing between live cells and debris is critical for data interpretation.
- Employ Fluorescent Staining Assays: Use a combination of fluorescent dyes, such as SYTO 9 and propidium iodide (PI), in a Live/Dead viability assay. SYTO 9 stains all cells green, while PI only penetulates cells with compromised membranes (dead cells or debris), staining them red. This allows for simultaneous quantification and spatial localization of live vs. dead/damaged material on your surface [52].
- Validate with ATP-based Assays: For surfaces where fluorescence imaging is not feasible, an ATP-based bioluminescence assay can be used. This method quantifies metabolically active cells by measuring cellular ATP. A significant discrepancy between the total cell count (e.g., from DNA staining) and the viable cell count (from ATP measurement) indicates substantial debris accumulation [52].
Q3: My anti-fouling coating is unstable under physiological flow conditions, leading to rapid fouling. How can I improve its durability?
A3: Coating stability is a common translational challenge.
- Enhance Surface Anchoring: For polymer brush coatings, ensure a robust anchor. The DOPA homopolypeptide anchor has been shown to provide exceptional stability on various implant materials (Ti6Al4V, PEEK, silicone) over one month in aqueous buffer at physiological pH and temperature. This strong anchorage prevents coating delamination under shear stress [57].
- Adopt a Self-Replenishing Design: Implement a Slippery Liquid-Infused Porous Surface (SLIPS) or Slippery Nanoemulsion-Infused Porous Surface (SNIPS) strategy. These surfaces feature a lubricant reservoir within a porous matrix that continuously replenishes the surface, maintaining anti-fouling properties even under mechanical abrasion or dynamic fluid flow [56].
Troubleshooting Guide: Surface Performance Issues
| Problem | Potential Cause | Solution |
|---|---|---|
| High debris accumulation despite low live cell adhesion | Purely physical/chemical repulsion; debris is more adhesive. | Incorporate a bioactive component (e.g., NO donor) to disrupt debris integrity [56]. |
| Rapid coating failure under flow | Weak anchorage to substrate. | Utilize a high-strength anchor like a DOPA homopolypeptide for covalent, stable binding [57]. |
| Biofilm formation initiates despite anti-adhesion claims | Microbes are confined in a way that triggers virulence. | Re-evaluate surface topography; use machine learning to identify patterns that trigger beneficial behaviors like autolubrication instead of biofilm formation [58]. |
| Protein fouling compromises anti-bacterial properties | The surface does not resist non-specific protein adsorption. | Apply a zwitterionic polymer coating (e.g., pSBMA) which demonstrates superior resistance to protein adsorption, preventing the conditioning layer that facilitates adhesion [57]. |
| Inconsistent performance across bacterial strains | Surface properties favor the adhesion of specific strains. | Employ a High-Throughput Platform (HTP) to screen a library of surface chemistries and identify the optimal one for your specific bacterial challenge [59]. |
Experimental Protocols for Key Anti-Fouling Strategies
This protocol describes creating a stable, antifouling surface on medical implant materials like titanium alloys (Ti6Al4V) or poly(ether ether ketone) (PEEK).
1. Synthesis of Azide-Terminated DOPA Homopolypeptide Anchor:
- Method: Utilize N-carboxyanhydride ring-opening polymerization (NCA ROP).
- Key Parameters: Aim for a high molecular weight polymer with narrow polydispersity. The homopolymer of DOPA has been identified as the optimal anchor, significantly outperforming copolymers.
- Product: Azide-terminated DOPA homopolypeptide.
2. Dip-Coating and Conjugation:
- Substrate Preparation: Clean substrates (e.g., Ti6Al4V, PEEK) thoroughly with solvents and plasma treatment to ensure a clean, hydrophilic surface.
- Dip-Coating: Immerse the substrate in a solution of the DOPA homopolypeptide anchor. Withdraw at a controlled, slow rate to ensure uniform deposition.
- Conjugation via Click Chemistry: React the azide-functionalized surface with alkyne-terminated zwitterionic poly(sulfobetaine methacrylate) (pSBMA) using a strain-promoted azide-alkyne cycloaddition (SPAAC) reaction. This creates a covalent bond between the anchor and the antifouling polymer.
3. Validation and Characterization:
- Surface Hydrophilicity: Use water contact angle goniometry. A significant decrease in the contact angle indicates successful coating application.
- Surface Chemistry: Validate with X-ray Photoelectron Spectroscopy (XPS) to confirm the presence of sulfur and nitrogen from the pSBMA.
- Stability Test: Incubate coated substrates in aqueous buffer (e.g., PBS, pH 7.4, 37°C) for up to one month and re-characterize to confirm coating integrity.
- Performance Assay: Test resistance to nonspecific protein adsorption (e.g., using fibrinogen or serum) and bacterial colonization (e.g., with S. aureus or E. coli) over 24-48 hours.
This protocol combines passive fouling resistance with active antimicrobial/anti-debris action, ideal for blood-contacting devices.
1. Synthesis of S-Nitrosoglutathione (GSNO) NO Donor:
- Dissolve reduced L-glutathione in a mixture of 2M HCl and deionized water.
- Chill the solution in an ice bath. Add sodium nitrite to the stirring, chilled solution.
- Allow the reaction to proceed for 40 minutes in the dark (light-sensitive).
- Precipitate the product using chilled acetone. Collect the crystalline GSNO via filtration and dry in a dark, cool environment.
2. Preparation of GSNO-Loaded Nanoemulsion (GSNO-NE):
- Aqueous Phase: Dissolve the synthesized GSNO in 10 mM PBS with 100 µM EDTA (acts as a stabilizer).
- Oil Phase: Prepare a mixture of n-hexadecane and surfactants (Span 80 and Tween 80).
- Emulsification: Slowly introduce the oil phase into the aqueous phase under low-energy magnetic stirring. Follow with high-energy sonication to form a stable water-in-oil (w/o) nanoemulsion with the GSNO encapsulated in the aqueous nano-droplets.
3. Infusion into Porous Substrate:
- Use a porous substrate such as expanded polytetrafluoroethylene (ePTFE).
- Infuse the GSNO-NE into the ePTFE, allowing the lubricant to swell the polymer matrix and form a continuous, slippery surface.
4. Characterization and Testing:
- Slippery Behavior: Measure the sliding angle (SA) for a water droplet; a low SA (<10°) confirms a slippery surface.
- NO Release Profile: Use a chemiluminescent NO analyzer to measure real-time NO flux over 24 hours, ensuring it remains at physiological levels.
- Anti-fouling Efficacy: Conduct bacterial adhesion studies against relevant pathogens (e.g., S. aureus, E. coli) for 4 hours. Compare adhesion on the test surface to an unmodified control.
- Biocompatibility: Perform cytocompatibility assays (e.g., with NIH 3T3 fibroblasts) and hemocompatibility tests with diluted whole blood.
Visualizing Anti-Fouling Surface Design Strategies
The following diagrams illustrate the core mechanisms of the surface strategies discussed.
Surface Action Mechanisms
Experimental Optimization Workflow
The Scientist's Toolkit: Essential Research Reagents & Materials
| Item | Function/Application | Key Characteristics |
|---|---|---|
| DOPA (3,4-Dihydroxyphenylalanine) Homopolypeptide | High-strength surface anchor for dip-coating on metals and polymers. Enables stable grafting of antifouling polymers [57]. | Excellent anchorage to diverse materials; synthesized via NCA ROP; narrow polydispersity. |
| Poly(sulfobetaine methacrylate) (pSBMA) | Zwitterionic antifouling polymer. Creates a strong surface hydration layer to resist protein, cell, and debris adhesion [57]. | Superior hydrophilicity; resists nonspecific adsorption; biocompatible. |
| S-Nitrosoglutathione (GSNO) | Nitric oxide (NO) donor. Provides bioactive, antibacterial, and anti-biofilm activity to coatings. Disrupts accumulated debris [56]. | Water-soluble; releases NO catalytically; integrates into nanoemulsions. |
| Water-in-Oil (w/o) Nanoemulsion | Carrier for hydrophilic agents (like GSNO) into hydrophobic substrates. Forms the core of SNIPS technology [56]. | Composed of n-hexadecane, Span 80, Tween 80; stabilizes aqueous nano-droplets in oil. |
| Expanded PTFE (ePTFE) | Porous substrate for infusion of nanoemulsions. Creates a lubricant reservoir for durable slippery surfaces [56]. | Highly porous; chemically inert; swells with oil-based lubricants. |
| SYTO 9 / Propidium Iodide (PI) | Fluorescent viability stain. Critical for differentiating and quantifying live vs. dead/damaged cells and debris on surfaces [52]. | SYTO9 stains all cells green; PI stains compromised cells red. |
Frequently Asked Questions (FAQs)
1. Why are combined physical and chemical strategies more effective against biofilms than single approaches? Biofilms possess a complex extracellular polymeric substance (EPS) matrix that acts as a formidable barrier, restricting the penetration of antimicrobial agents and contributing to high levels of antibiotic resistance [60] [61]. A single strategy often fails to disrupt this robust structure sufficiently. Integrated approaches use a physical force, like ultrasound, to mechanically break apart the biofilm matrix and enhance the diffusion of chemicals or antibiotics deep into the biofilm, resulting in a synergistic effect that is more effective than either method alone [61] [62].
2. What are the primary targets of combined anti-biofilm strategies in the biofilm lifecycle? Combined strategies typically target multiple stages of the biofilm lifecycle to maximize efficacy. Key intervention points include:
- Initial Adhesion: Modifying surface materials to prevent bacterial attachment [63] [64].
- EPS Matrix: Disrupting the structural integrity of the matrix to facilitate the penetration of antimicrobials [65] [60].
- Quorum Sensing (QS): Interfering with cell-to-cell communication to prevent coordinated behavior and biofilm maturation [65] [60].
- Mature Biofilm: Using physical forces to disaggregate the biofilm and expose dormant cells to chemical agents [61] [62].
3. My chemical antibiofilm agents are not penetrating the biofilm effectively. What can I do? This is a common challenge due to the dense, negatively charged EPS matrix [60] [61]. Consider these solutions:
- Employ a Physical Disruption Method: Incorporate low-frequency ultrasound to create micro-currents and cavitation that physically disrupt the matrix [61].
- Utilize Nanoparticle Carriers: Use nano-delivery systems (e.g., liposomes, polymeric nanoparticles) that are engineered to penetrate the biofilm and release their antimicrobial payload in response to the specific biofilm microenvironment (e.g., low pH, enzymes) [61].
- Combine with Matrix-Targeting Enzymes: Pre-treat with enzymes such as DNase (targeting eDNA) or dispersin B (targeting polysaccharides) to degrade key EPS components before applying your chemical agent [60] [64].
4. How can I optimize my surface material to reduce bacterial adhesion for my specific bacterial strain? Bacterial adhesion is influenced by surface properties and is often species-specific [63] [64].
- Characterize Your Strain: Determine if your bacterial strain adheres more strongly to hydrophobic or hydrophilic surfaces and how its adhesion is affected by surface charge (most bacteria are negatively charged) [65] [61].
- Tune Material Properties: Modify your polymer surface with anti-adhesive coatings (e.g., PEG) to reduce adhesion forces [64].
- Quantify Adhesion: Use techniques like Atomic Force Microscopy (AFM) to directly measure the adhesion forces between your bacterial strain and the candidate surface materials, as adhesion can vary significantly with substrate stiffness and other physicochemical parameters [63].
Troubleshooting Guides
Issue: Inconsistent Biofilm Disruption with Ultrasound
Potential Causes and Solutions:
- Cause: Sub-optimal ultrasound parameters.
- Solution: Systematically optimize frequency, power, and treatment duration. Low frequencies (e.g., 20-40 kHz) are often more effective for cavitation and biofilm disruption. Avoid excessive power that may cause unwanted heating or cell lysis that can interfere with downstream analysis. Establish a dose-response curve for your specific biofilm model.
- Cause: Inadequate coupling of the chemical agent.
- Solution: The choice of chemical agent is critical. Ensure the antimicrobial is effective against the target bacterium in its planktonic state. Time the application so that the chemical agent is present during or immediately after sonication to maximize infiltration into the disrupted matrix. Refer to the table below for chemical agent classes.
- Cause: High variability in biofilm maturity and density.
- Solution: Standardize your biofilm growth conditions (media, incubation time, surface type). Use validated assays (e.g., crystal violet, confocal microscopy) to confirm consistent biofilm biomass and 3D structure across experimental replicates before applying treatments.
Issue: Failed Translation from In Vitro to In Vivo/Ex Vivo Models
Potential Causes and Solutions:
- Cause: The in vitro model does not recapitulate the complexity of the natural environment.
- Solution: Move beyond simple static cultures. Use flow-cell systems or bioreactors that simulate fluid shear stress, which profoundly influences biofilm architecture and physiology [64]. For material studies, consider using conditioned surfaces or media that more closely mimic the host environment.
- Cause: Lack of consideration for the host immune response and tissue integration.
- Solution: When testing anti-biofilm surfaces for implants, evaluate their performance in the presence of host proteins (e.g., serum), as these can form a conditioning film that alters bacterial adhesion [64]. Collaborate with biologists to incorporate tissue culture models where feasible.
Quantitative Data on Anti-Biofilm Strategies
Table 1: Comparison of Physical Anti-Biofilm Strategies
| Strategy | Mechanism of Action | Key Parameters | Advantages | Limitations |
|---|---|---|---|---|
| Ultrasound | Cavitation; mechanical disruption of EPS; enhanced drug diffusion [61]. | Frequency, power density, duty cycle, duration. | Can be non-invasive; enhances efficacy of co-administered antibiotics. | Potential for tissue damage at high power; optimization required. |
| Surface Modification | Reducing initial bacterial attachment by altering surface physicochemistry [63] [64]. | Stiffness, hydrophobicity, surface charge, topography. | Preventive strategy; can be long-lasting. | Effect is species-specific; performance can degrade over time. |
| Nanoparticle Penetration | Utilizing small size and surface properties to infiltrate EPS and deliver antimicrobials [61]. | Particle size, surface charge, functionalization. | High drug-loading capacity; targeted and responsive release. | Potential cytotoxicity; complex synthesis and characterization. |
Table 2: Common Chemical Anti-Biofilm Agents and Their Targets
| Agent Class | Example(s) | Primary Target | Mode of Action | Considerations for Combination |
|---|---|---|---|---|
| Quorum Quenchers | Acylase, halogenated furanones [65] [60]. | Quorum Sensing (QS) system | Inhibits cell-cell communication and virulence gene expression. | Does not kill bacteria, reducing selective pressure for resistance. |
| EPS Disrupting Enzymes | DNase, dispersin B, proteases [60] [64]. | Extracellular DNA, polysaccharides, matrix proteins. | Degrades specific structural components of the biofilm matrix. | Can be used as a pre-treatment to sensitize biofilms to other antimicrobials. |
| Antibiotics | Gentamicin, Ciprofloxacin [61] [62]. | Bacterial cell walls, protein synthesis, DNA replication. | Kills or inhibits growth of bacterial cells. | Use antibiotics known to penetrate EPS (e.g., fluoroquinolones); required concentration is often 10-1000x higher for biofilms [60] [62]. |
| Cationic Peptides | LL-37, nisin [60]. | Bacterial cell membrane. | Disrupts membrane integrity, often bactericidal. | Can be effective against slow-growing or dormant cells within biofilms. |
Experimental Protocols for Key Integrated Experiments
Protocol 1: Evaluating Ultrasound-Enhanced Antibiotic Efficacy on Biofilms
Objective: To quantify the synergistic effect of low-frequency ultrasound and a standard antibiotic in eradicating mature biofilms.
Materials:
- Bacterial Strain: e.g., Pseudomonas aeruginosa PAO1
- Growth Medium: Tryptic Soy Broth (TSB) or Lysogeny Broth (LB)
- Antibiotic: Tobramycin or Ciprofloxacin
- Equipment: Low-frequency ultrasonic bath (e.g., 40 kHz), 96-well polystyrene plates with lid, microplate reader, colony counter.
- Staining: Crystal violet solution, methanol, acetic acid.
Methodology:
- Biofilm Growth: Grow a mature biofilm in a 96-well plate for 48-72 hours under static or mild agitation conditions. Replace medium every 24 hours.
- Treatment Groups: Establish four groups in replicates of 6-8: (i) Untreated control, (ii) Ultrasound alone, (iii) Antibiotic alone, (iv) Ultrasound + Antibiotic.
- Ultrasound Treatment: Dilute the antibiotic in fresh medium to a sub-inhibitory concentration (e.g., 1x MIC or lower for planktonic cells). Add the solution to the biofilm wells. Immediately subject the plate to ultrasound in a water bath for a set duration (e.g., 5-15 minutes), ensuring consistent coupling.
- Post-treatment Analysis:
- Viability (CFU Count): Gently wash wells to remove non-adherent cells. Scrape biofilm into PBS, vortex vigorously to disaggregate, serially dilute, and plate on agar. Incubate and count CFUs after 24h.
- Biomass (Crystal Violet Assay): After washing, fix biofilms with methanol, stain with 0.1% crystal violet for 15 min, wash, and elute dye with 33% acetic acid. Measure absorbance at 595 nm.
Visualization of the Experimental Workflow:
Protocol 2: Testing Anti-Adhesive Polymeric Surfaces with Integrated Biofilm Removal
Objective: To assess the efficacy of a novel polymeric surface in both preventing biofilm formation and facilitating its removal via a combined physical-chemical treatment.
Materials:
- Surfaces: Test polymer vs. control polymer (e.g., unmodified PDMS).
- Equipment: Flow-cell system or orbital shaker, confocal laser scanning microscope (CLSM).
- Staining: LIVE/DEAD BacLight bacterial viability kit or similar.
Methodology:
- Surface Characterization: Quantify surface properties (hydrophobicity via contact angle, stiffness via AFM, topography via SEM) for both test and control surfaces [63] [64].
- Adhesion & Biofilm Prevention Assay: Inoculate flow-cells with the bacterial strain and allow biofilm to develop under defined shear stress for 24h.
- Integrated Removal Challenge: Apply a combined treatment (e.g., a brief ultrasound pulse followed by a flow of solution containing an EPS-degrading enzyme like DNase I) to the mature biofilm.
- Analysis:
- Prevention: Image surfaces after 24h of growth using CLSM to quantify initial adhesion (biomass, surface coverage).
- Removal: Image the same locations pre- and post-treatment to quantify the percentage of biofilm removed. Use image analysis software (e.g., ImageJ, COMSTAT) to calculate biovolume and surface coverage.
Visualizing Key Signaling Pathways for Intervention
Quorum Sensing (QS) Inhibition Pathway:
The Scientist's Toolkit: Research Reagent Solutions
Table 3: Essential Materials for Anti-Biofilm and Adhesion Studies
| Item | Function/Application | Key Considerations |
|---|---|---|
| Low-Melting-Point (LMP) Agarose | Used to create hydrogels with tunable stiffness for studying the effect of substrate mechanics on bacterial adhesion and biofilm growth [63]. | Stiffness can be precisely controlled by concentration; allows for quantification of stiffness-dependent adhesion forces via AFM. |
| Atomic Force Microscopy (AFM) | A cell-level force–distance spectroscopy technique to simultaneously quantify the cell–surface adhesion force and the stiffness of the underlying substrate [63]. | Critical for directly measuring species-specific adhesion forces and understanding biophysical interactions. |
| DNase I | An enzyme that degrades extracellular DNA (eDNA), a key structural component of the EPS matrix in many bacterial biofilms [65] [60]. | Useful as a pre-treatment to weaken biofilm structure and enhance penetration of other antimicrobial agents. |
| Quorum Sensing Reporter Strains | Genetically modified bacteria that produce a measurable signal (e.g., luminescence, fluorescence) in response to Quorum Sensing activation [65]. | Enable high-throughput screening for potential Quorum Quenching compounds. |
| Liposomal Nanoparticles | Lipid-based nano-delivery systems that can encapsulate antibiotics and fuse with bacterial membranes, enhancing drug delivery into biofilms [61]. | Their surface charge can be modified to optimize interaction with the negatively charged EPS matrix. |
| Confocal Laser Scanning Microscope (CLSM) | Used to generate high-resolution, three-dimensional images of biofilms, allowing for analysis of architecture, thickness, and live/dead cell distribution [64]. | Essential for qualitative and quantitative assessment of biofilm disruption treatments. |
Evaluating Performance: Standardized Assays, Model Selection, and Comparative Material Analysis
Within the broader scope of a thesis focused on optimizing surface materials to control bacterial colonization, selecting the appropriate in vitro adhesion assay is paramount. The chosen method directly influences the interpretation of how effectively a surface resists or promotes bacterial attachment. This technical resource center provides a comparative overview of three foundational techniques—CFU counting, spectrophotometry, and bioluminescence imaging—to guide researchers in selecting, optimizing, and troubleshooting these assays for their specific material studies.
Method Comparison at a Glance
The table below summarizes the core characteristics, strengths, and limitations of the three key adhesion assay methods.
| Method | Key Principle | Quantitative Output | Key Advantages | Key Limitations |
|---|---|---|---|---|
| Colony Forming Unit (CFU) Count | Viable bacteria detached from a surface are cultured on agar plates to form countable colonies. [37] | Direct count of viable bacteria (e.g., CFU/mL). [37] | Considered the "gold standard"; directly measures cell viability. [66] | Labor-intensive, time-consuming (24-48 hr delay); limited to viable cells only. [66] |
| Spectrophotometry | Measures the optical density (OD) of a bacterial suspension, which correlates with cell concentration. [67] | Optical Density (OD) at a specific wavelength (e.g., OD600). [67] | Rapid, simple, and high-throughput. | Measures total cells (viable and non-viable); cannot distinguish between attached and suspended cells without a separation step. |
| Bioluminescence Imaging (BLI) | Detects light emission from luciferase-expressing bacteria, using substrates like D-luciferin or coelenterazine. [68] [69] | Total Flux (photons/second) or Relative Light Units (RLU). [66] [67] | Highly sensitive, rapid readout; allows for real-time, longitudinal monitoring on the same sample. [66] [69] | Requires genetically engineered bacteria; signal can be absorbed by pigments or material surfaces. [68] |
Detailed Experimental Protocols
Colony Forming Unit (CFU) Count Assay
This protocol is adapted from a study on bacterial adhesion to titanium implants. [37]
- Sample Preparation: Prepare your material samples (e.g., 1x1 cm squares) and sterilize them appropriately. Include a control group (e.g., untreated implants) and test groups (e.g., surface-modified implants). [37]
- Bacterial Inoculation: Incubate each sample in a bacterial suspension (e.g., 5 mL of ~1x10⁶ CFU/mL) under static conditions for the desired adhesion period (e.g., 24 hours at 37°C). [37]
- Rinsing: Gently rinse each sample with phosphate-buffered saline (PBS) to remove non-adherent bacteria. [37]
- Detachment & Dilution: Vortex the samples in a known volume of PBS to detach adherent bacteria. Prepare serial dilutions of this resulting suspension. [37]
- Plating & Incubation: Plate the dilutions onto nutrient agar plates. Incubate the plates (e.g., 24 hours at 37°C) to allow colonies to form. [37]
- Counting & Calculation: Count the colonies on plates with 30-300 colonies. Calculate the original concentration of adherent bacteria (CFU/mL) using the dilution factor. [37]
Bioluminescence Imaging (BLI) Assay
This protocol leverages engineered bioluminescent bacteria, as used in studies on microbial barrier properties. [67]
- Bacterial Strain Preparation: Use a bioluminescent bacterial strain, such as E. coli Lux, which constitutively produces light. [67]
- Calibration: Correlate bioluminescence signal with bacterial concentration. Perform a titration assay by measuring the bioluminescence of serial dilutions of the bacterial culture using an imaging system (e.g., IVIS). Generate a standard curve of Total Flux vs. CFU/mL. [67]
- Sample Inoculation: Apply a small aliquot of the calibrated bioluminescent bacterial inoculum (e.g., 5 µL containing ~1x10⁹ CFU/mL) directly onto the surface of the test material. [67]
- Image Acquisition: Place the inoculated samples in an imaging chamber. Acquire bioluminescence images using the appropriate settings (e.g., binning: 8, f/stop: 1, exposure time: 0.5-60 seconds). [67]
- Data Analysis: Use dedicated software (e.g., Living Image) to quantify the total flux (photons/second) from the region of interest (your material sample). Convert the flux values to estimated bacterial counts using the standard curve. [67]
Troubleshooting Guides & FAQs
Common Problems and Solutions for Adhesion Assays
| Problem | Possible Cause | Solution |
|---|---|---|
| High Variation Between Replicates (CFU/BLI) | Inconsistent washing of samples, leaving non-adherent cells. [70] | Standardize washing protocol; ensure consistent pipette angle, volume, and number of washes. [70] |
| Cell clumping, leading to uneven inoculation. [70] | Ensure a homogenous bacterial suspension by thoroughly mixing samples before pipetting. [70] | |
| Weak or No Bioluminescence Signal | Sub-optimal health of the reporter bacteria. | Check culture conditions (medium, temperature). Use fresh aliquot of bacterial stock. [71] |
| Substrate degradation or incorrect use. [71] [72] | Use fresh, high-quality substrate (e.g., D-luciferin). For in vivo applications, optimize delivery route (IP vs. IV). [72] | |
| Signal absorption by the material or media. | Consider using red-shifted luciferase reporters (e.g., Akaluc) for better penetration. [72] | |
| High Background Signal (BLI) | Substrate auto-oxidation or contamination. [70] | Use purified substrates; protect substrate from light during storage and use. [70] [71] |
| Contamination of buffers or equipment with residual HRP or cells. [70] | Prepare fresh, clean buffers and use disposable reagent reservoirs. [70] | |
| Poor Cell Adhesion to Surface Material | Inappropriate surface properties (e.g., charge, wettability). [73] | Characterize and modify surface (e.g., plasma electrolytic oxidation to increase hydrophilicity). [37] |
| Environmental stress on cells (e.g., contamination, temperature fluctuations). [73] | Ensure sterile technique and stable incubator conditions. Rule out media/gas mixture issues. [73] |
Frequently Asked Questions (FAQs)
Q1: For studying the anti-fouling properties of a new material, which assay is most suitable? For an initial, high-throughput screening of a large number of material variants, spectrophotometry offers the best speed and efficiency. Once promising candidates are identified, CFU counts can be used to provide definitive, viability-based confirmation of reduced adhesion, while BLI can be employed to study the dynamics of biofilm formation on the selected materials over time.
Q2: My bacterial strain is not naturally bioluminescent. Can I still use BLI? Yes, but it requires genetic engineering. You can transform your strain of interest with a plasmid vector that encodes a luciferase gene (e.g., Firefly luciferase, NanoLuc). [68] [72] This creates a stable, bioluminescent reporter strain for your specific studies.
Q3: Why is my CFU data so variable even with careful technique? CFU counts are inherently variable due to the random nature of colony formation and the potential for bacterial aggregation. Ensure you are counting plates within the statistically valid range (30-300 colonies) and perform a sufficient number of biological replicates (typically n ≥ 3). Using multichannel pipettes for dilutions and thoroughly vortexing samples before plating can also minimize technical variation. [70]
Q4: How does surface hydrophilicity, as mentioned in my thesis, affect bacterial adhesion? Surface wettability is a critical factor. Studies on modified titanium implants have demonstrated that increased hydrophilicity (indicated by a lower water contact angle) is strongly correlated with reduced bacterial adhesion for common pathogens like S. aureus and E. coli. Hydrophilic surfaces may repel initial bacterial attachment and promote host protein adsorption that discourages colonization. [37]
Research Reagent Solutions
The table below lists key reagents and their functions in these adhesion assays.
| Reagent / Material | Function in Assay | Example Use Case |
|---|---|---|
| D-luciferin | Substrate for Firefly luciferase (FLuc); oxidation produces light. [69] [72] | Detecting adhesion of FLuc-expressing bacteria in BLI assays. [72] |
| Furimazine | Substrate for NanoLuc luciferase (NLuc); generates a bright, ATP-independent blue light. [72] | Highly sensitive tracking of bacterial populations, useful for deep-tissue imaging with BRET systems. [72] |
| Nutrient Agar | Solid growth medium supporting bacterial proliferation and colony formation. [37] | Culturing and enumerating viable bacteria in the CFU assay. [37] |
| Polyurethane-based Tissue Adhesive | A synthetic polymer used to create a defined surface or barrier for testing. [67] | Serves as a test material in studies evaluating the microbial barrier properties of wound closure devices. [67] |
| Fibronectin/Collagen Mix | Extracellular matrix (ECM) proteins used to coat surfaces. [74] | In cell adhesion studies, promotes the attachment of eukaryotic cells to cultureware; can be used to create a more biologically relevant surface. [74] |
Advanced Concepts: Signaling and Detection Pathways
Bioluminescence relies on specific enzymatic pathways. Understanding these can help in selecting the right reporter system.
Frequently Asked Questions (FAQs)
FAQ 1: What are the primary surface properties that influence bacterial adhesion, and how can I control them in my experiments? The key properties are surface chemistry, wettability (hydrophilicity/hydrophobicity), surface charge, and topography (roughness). These factors work synergistically, not in isolation [75] [9]. You can control them through specific surface modification techniques. For instance, creating hydrophilic surfaces with functional groups like hydroxyl or carboxyl can form a hydration barrier that repels bacteria [9]. Surface chemistry can be altered by immobilizing polymers like chitosan [76] or by incorporating antibacterial ions such as silver or copper [75].
FAQ 2: My antibacterial surface is cytotoxic to mammalian cells. How can I achieve selectivity? A promising strategy is to design surfaces that preferentially promote host cell adhesion over bacterial adhesion. Research on chitosan-immobilized titanium (SA-CS-Ti) demonstrates this principle: it showed significantly higher osteoblast adhesion and lower bacterial adhesion compared to untreated titanium in co-culture systems [76]. This creates a "race for the surface" that the host cells win. Focusing on anti-adhesive (passive) mechanisms that resist protein adsorption and bacterial attachment, such as zwitterionic polymers, can also reduce cytotoxicity [9] [77].
FAQ 3: Why do my long-term antibacterial assays show different results compared to initial adhesion tests? Bacterial adhesion is a time-dependent process that evolves from reversible, short-range interactions to irreversible, strong adhesion through molecular bonding and biofilm matrix secretion [75] [78]. A surface that shows good anti-adhesion properties in short-term tests might not prevent the "locking" phase of adhesion. Your assay protocol should standardize contact times. Atomic Force Microscopy (AFM) studies reveal that adhesion forces can strengthen exponentially within the first second of contact before plateauing [79]. Ensure your testing windows align with the specific adhesion stage you are investigating.
FAQ 4: How do I accurately measure the very first stage of bacterial adhesion? Quantifying early-stage, transient adhesion requires techniques that can capture interactions at short time scales and with high force sensitivity. PeakForce Quantitative Nanomechanics (PF-QNM) AFM is a high-resolution method that can quantify atomic adhesion forces between a single bacterial cell and a material surface within milliseconds of contact [75] [79]. This technique allows you to map the distribution of adhesive nano-domains on a bacterial cell and measure the force of initial binding events, providing direct evidence of the interaction before bond maturation occurs [79].
Troubleshooting Guides
Issue: High Variability in Bacterial Adhesion Force Measurements
Possible Causes and Solutions:
- Cause 1: Inconsistent surface roughness. Even within the same material, variations in surface roughness can significantly alter adhesion forces [75] [9].
- Solution: Characterize your surface topography using techniques like Atomic Force Microscopy (AFM) or profilometry before adhesion assays. Ensure your surface preparation protocol (e.g., polishing, etching) is highly reproducible.
- Cause 2: Uncontrolled environmental conditions.
- Solution: The ionic strength and pH of your suspension medium can affect surface charge and electrostatic interactions [9]. Carefully control the chemical composition, temperature, and pH of the buffer used in all experiments.
- Cause 3: Biological heterogeneity.
- Solution: Bacterial surface adhesins can vary. Use bacteria from the same growth phase (e.g., mid-logarithmic) and standardize your culture conditions. When using AFM, perform a high number of force curves to account for natural biological variation [79].
Issue: Inconsistent Results Between Co-culture and Mono-culture Models
Possible Causes and Solutions:
- Cause: Competitive interactions in co-culture are not accounted for in mono-culture. A material might perform well against bacteria alone but fail when host cells are competing for the same surface.
- Solution: Validate your findings in a co-culture system that more closely mimics the in vivo environment. For example, use a bacteria/osteoblast co-culture model for orthopedic implants [76]. Distinguish between low-bacteria and high-bacteria challenge scenarios to test the robustness of your antibacterial strategy.
Table 1: Bacterial Adhesion on Different Biomaterial Surfaces
| Material Category | Specific Material / Treatment | Test Organism | Key Quantitative Finding | Measurement Technique | Reference |
|---|---|---|---|---|---|
| Metals | Titanium (Untreated, UN-Ti) | Staphylococcus aureus | 5367 ± 1662 CFU recovered at 4h | Co-culture & Quantification | [76] |
| Chitosan immobilized Ti (SA-CS-Ti) | Staphylococcus aureus | 2233 ± 681 CFU recovered at 4h (significantly lower) | Co-culture & Quantification | [76] | |
| Ti-13Nb-13Zr (TNZ) | Staphylococcus aureus | Lower adhesion force compared to other β-Ti alloys | PFQNM-AFM | [75] | |
| Polymers | PEEK | S. aureus, S. mutans, E. coli | Higher bacterial adhesion than titanium for some strains | In vitro adhesion assays | [80] |
| PEEK-Ag with AC (5 mA) | Pseudomonas aeruginosa | Most significant decrease in CFUs/mL | Electric current application | [81] | |
| Natural Materials | 58S Bioactive Glass (Amorphous) | E. coli | Adhesion force of ~6 nN | AFM Force Spectroscopy | [79] |
| 58S Bioactive Glass (Amorphous) | Staphylococcus aureus | Adhesion force of ~3 nN | AFM Force Spectroscopy | [79] | |
| Ceramics | Zirconia | Mixed oral bacteria | Least microbial adhesion in vivo | In vivo study | [80] |
Table 2: Comparison of Material Surface Properties
| Material | Key Advantage | Key Disadvantage | Key Surface Properties for Bacterial Adhesion |
|---|---|---|---|
| Titanium | Excellent osseointegration, high strength [80] | Higher risk of peri-implantitis, metallic color [80] | Roughness and chemistry can promote adhesion; modifiable via coatings [76] [75] |
| Zirconia | Excellent aesthetics, soft tissue compatibility [80] | Brittleness, potential for fracture [80] | Generally demonstrates lower biofilm accumulation than titanium [80] |
| PEEK | Metal-free, low modulus, radiolucency [80] | Poor inherent osseointegration, requires surface modification [80] | Variable colonization; surface properties can be tuned with additives (e.g., Ag) [81] |
| Chitosan | Biocompatible, antibacterial, promotes osteoblast adhesion [76] | Mechanical properties may not be sufficient for load-bearing implants | Immobilized on metals to create anti-infective, bioactive surfaces [76] |
| Bioactive Glass | Osteostimulation, antibacterial ion release [79] | Brittleness, dissolution rate must be controlled | Dissolution increases local pH and osmotic pressure, providing antibacterial action [79] |
Detailed Experimental Protocols
Protocol 1: Quantifying Early-Stage Bacterial Adhesion using Atomic Force Microscopy (AFM)
This protocol is based on studies that used AFM to gain nanoscale insights into initial bacterial adhesion [75] [79].
- Sample Preparation: Prepare material substrates as discs (e.g., 5 mm diameter, 1 mm thick). Standardize the surface by polishing to a consistent roughness. Clean and sterilize samples appropriately for biological assays [75].
- Bacterial Probe Functionalization:
- A single bacterial cell is attached to a tipless AFM cantilever using a UV-curable glue or a specific chemical linker under a microscope [79].
- Alternatively, a cell pellet can be placed directly on the material surface for force mapping.
- Force Measurement:
- Submerge the functionalized probe and material sample in the desired liquid medium (e.g., PBS) to simulate physiological conditions.
- Approach the cantilever to the surface until it makes contact. The contact force and dwell time (e.g., 250 ms to 1 second) must be carefully controlled and kept consistent across measurements [79].
- Retract the cantilever to obtain a force-distance curve. The adhesion force is measured as the maximum negative force during retraction.
- Data Acquisition and Analysis:
Protocol 2: Evaluating the "Race for the Surface" in a Co-culture Model
This protocol assesses a material's ability to preferentially attract host cells over bacteria, as described in the chitosan-titanium study [76].
- Surface Modification: Develop your test and control surfaces. For example: Untreated Titanium (UN-Ti), Acid-treated Titanium (SA-Ti), and Chitosan-immobilized Titanium (SA-CS-Ti) [76].
- Cell and Culture Preparation:
- Culture osteoblasts (e.g., MG63 cell line) and bacteria (e.g., Staphylococcus aureus) separately.
- Establish two co-culture systems:
- Low-Bacteria/Osteoblast (L-B) System: A lower concentration of bacteria challenged onto the surface with osteoblasts.
- High-Bacteria/Osteoblast (H-B) System: A higher concentration of bacteria to test the material's efficacy under a severe challenge [76].
- Seeding and Incubation: Seed the osteoblasts and bacteria onto the material surfaces simultaneously. Incubate for set time points (e.g., 30 minutes for initial attachment, 4 hours for adhesion).
- Quantification and Imaging:
- Quantification: After incubation, gently rinse surfaces to remove non-adherent cells. Use quantification assays (e.g., cell counting, CFU plating for bacteria) to determine the number of adhered osteoblasts and bacteria separately.
- Imaging: Fix the samples and analyze them using Scanning Electron Microscopy (SEM) and Confocal Microscopy to visualize cell spreading and the surface area occupied by osteoblasts versus bacteria [76].
The Scientist's Toolkit: Research Reagent Solutions
Table 3: Essential Materials for Bacterial Adhesion Experiments
| Reagent / Material | Function in Experiment | Key Considerations |
|---|---|---|
| Ti-6Al-4V Alloy | Gold standard control for orthopedic/dental implant studies [75] | Be aware of potential ion release; consider beta-titanium alloys (e.g., Ti-35Nb-7Zr-5Ta) as bio-inert alternatives with lower elastic modulus [75]. |
| Polyether Ether Ketone (PEEK) | Polymer for metal-free, radiolucent implants with bone-like stiffness [80] [81] | Requires surface activation (e.g., with conductive Ag) to enhance antibacterial properties or osseointegration [81]. |
| Chitosan | Natural polymer for creating anti-infective, bioactive coatings [76] | Its cationic nature disrupts bacterial membranes via electrostatic interactions; can be immobilized on metals to promote osteoblast adhesion [76] [9]. |
| 58S Bioactive Glass | Bioactive material with inherent antibacterial properties [79] | Antibacterial effect is composition-dependent; 58S (high Ca, no Na) shows excellent bactericidal activity via pH rise and ion release [79]. |
| Quaternary Ammonium Compounds | Cationic agents for contact-killing surfaces [9] | Achieve bactericidal effect by disrupting bacterial membranes; efficacy is charge-density dependent, requiring a threshold (~1013–1014 N+/cm2) [9]. |
| Zwitterionic Polymers | Used to create anti-adhesive (passive) surfaces [9] [77] | Form a hydration barrier via their balanced positive and negative charges, effectively resisting protein adsorption and subsequent bacterial adhesion [77]. |
Experimental Workflow and Signaling Pathways
Bacterial Adhesion Experimental Workflow
The diagram below outlines the key decision points and pathways for designing a bacterial adhesion study.
Technical Support Center
Troubleshooting Guides
Issue 1: Inconsistent Bacterial Adhesion Results Across Replicate Samples
- Problem: Measured bacterial reduction rates show high variability between samples intended to be identical.
- Solution:
- Verify Surface Characterization: Confirm that surface properties like roughness and wettability are consistent across all samples using profilometry and contact angle goniometry. Inconsistent patterning during fabrication is a common cause [82].
- Standardize Inoculum Preparation: Ensure bacterial cultures are grown to the same optical density and are in the same growth phase for each experiment. Check for bacterial aggregation in the inoculum, which can lead to clumping and uneven adhesion [83].
- Control Hydrodynamic Conditions: Use a controlled flow system or orbital shaker to ensure consistent and uniform shear forces across all samples during adhesion assays. Stagnant conditions can cause irregular settlement [10].
Issue 2: Antifouling Surface Shows Initial Efficacy but Rapidly Fails
- Problem: A surface designed to resist bacterial adhesion works well in short-term experiments but fails after prolonged exposure.
- Solution:
- Check for Surface Degradation: Examine the surface for chemical leaching, plasticizer loss, or physical wear that alters its topography. Consider using more robust materials or coatings [9].
- Assess Protein Fouling: The surface might be resisting bacteria initially but accumulating a conditioning film of proteins, which then facilitates bacterial adhesion. Test adhesion in the presence of relevant biological fluids like serum or plasma [9].
- Evaluate for Adaptive Bacterial Response: Some bacteria can alter their surface appendages or EPS production to overcome repulsive forces. Isolate bacteria from the failed surface and re-test their adhesion to pristine surfaces to check for adapted phenotypes [10].
Issue 3: Cytotoxicity of an Active Contact-Killing Surface
- Problem: A surface designed to kill bacteria on contact is also toxic to mammalian cells, limiting its biomedical application.
- Solution:
- Optimize Charge Density: For cationic surfaces (e.g., quaternary ammonium compounds), fine-tune the surface charge density. The goal is to exceed the bactericidal threshold (≥ 10¹³–10¹⁴ N⁺/cm²) while minimizing non-specific toxicity to host cells [9].
- Introduate Zwitterionic Chemistry: Incorporate zwitterionic or mixed-charge motifs. These can provide a non-fouling background that resists both bacterial and mammalian cell adhesion, improving overall biocompatibility [9].
- Employ a Hybrid Strategy: Combine a passive antifouling polymer brush (e.g., PEG) with a low concentration of an active killing agent. This reduces the need for a highly charged, cytotoxic surface [9].
Frequently Asked Questions (FAQs)
Q1: What is the most influential surface property for reducing bacterial adhesion? There is no single most influential property; efficacy depends on the specific bacterial strain and environment. However, two key strategies are:
- Passive Anti-Adhesive Surfaces: Creating hydrophilic, nano-scale topographies can significantly reduce attachment. Hierarchical (micro + nano) structures have shown reductions of over 80% for E. coli and S. aureus by minimizing contact area [82].
- Active Contact-Killing Surfaces: Engineering surfaces with a high density of positive charge can electrostatically disrupt negatively charged bacterial membranes, leading to cell death [9] [10]. The combination of both mechanisms in a hybrid system is often most effective [9].
Q2: My positively charged surface attracts more bacteria instead of repelling them. Is this a failure? Not necessarily. This is a known phenomenon. Positively charged surfaces initially attract negatively charged bacteria via electrostatic forces [9] [10]. The key is whether the surface can then kill the attached bacteria. Evaluate bacterial viability (e.g., using Live/Dead staining) on the surface, not just the number of attached cells. A successful contact-killing surface will have many attached but dead bacteria [9].
Q3: How does surface roughness correlate with bacterial adhesion? The relationship is complex and depends on the scale of the roughness relative to the bacterial cell size.
- Sub-micron roughness (smaller than bacteria) can reduce adhesion by decreasing the available contact area.
- Micron-scale roughness (similar to or larger than bacteria) can promote adhesion by providing shelter from shear forces and increasing surface area. Surfaces with hierarchical structures that combine micro and nano features have proven particularly effective at minimizing bacterial attachment [82].
Q4: What are the key differences when testing adhesion for Gram-positive vs. Gram-negative bacteria? The primary difference lies in their cell wall structure, which affects their surface charge and interaction forces.
- Gram-negative bacteria have an outer membrane rich in lipopolysaccharides (LPS), which can sometimes facilitate adhesion to negatively charged surfaces [10] [83].
- Gram-positive bacteria have a thick peptidoglycan layer with teichoic acids, contributing to their overall negative charge [83]. Due to these differences, a surface optimized against one type may not be equally effective against the other. It is crucial to include representative strains of both in your benchmarking studies [10].
Table 1: Correlation of Surface Properties with Bacterial Adhesion
| Surface Property | Target Value / Condition | Observed Effect on Bacterial Adhesion | Key Bacterial Strains Tested | Reported Reduction / Effect |
|---|---|---|---|---|
| Surface Charge | High Positive Density (≥10¹³ N⁺/cm²) | Increased attachment, but contact-killing; reduced biofilm viability [9] [10] | S. aureus, E. coli, P. aeruginosa | Induces bacterial membrane disruption; retarded biofilm growth [9] [10] |
| Surface Topography | Hierarchical (Micro + Nano) Structures | Significant reduction in initial attachment [82] | E. coli, S. aureus | 82-86% reduction in bacterial attachment [82] |
| Wettability | Highly Hydrophilic / Superhydrophilic | Forms a hydration barrier, inhibiting bacterial adhesion [9] | Various | Creates steric and energetic repulsion [9] |
| Wettability | Superhydrophobic | Minimizes contact area, reducing bacterial retention [9] | Various | Reduces adhesion force and biofilm formation [9] |
Table 2: Essential Research Reagent Solutions
| Reagent / Material | Function in Anti-Adhesive Efficacy Benchmarking |
|---|---|
| Polypropylene (PP) Films | A common polymer substrate for imprinting micro- and nano-topographies to study the physical effects on bacterial adhesion without chemical agents [82]. |
| Cationic Polymers(e.g., Chitosan, Polyethyleneimine, Quaternary Ammonium Compounds) | Used to create contact-killing surfaces by providing a high positive charge density that disrupts bacterial membranes [9]. |
| Zwitterionic Polymers(e.g., poly(sulfobetaine methacrylate)) | Used to create highly hydrophilic, antifouling surfaces that resist protein adsorption and subsequent bacterial adhesion via a strong hydration layer [9]. |
| Layer-by-Layer (LbL) Polyelectrolytes(e.g., PAH, PSS, PDADMAC) | Allows for precise nanoscale control over surface charge and chemistry to systematically study its effect on bacterial attachment [10]. |
Detailed Experimental Protocols
Protocol 1: Fabrication of Hierarchical Topographies via Nanoimprint Lithography
This protocol details the creation of surfaces with combined micro- and nano-scale features on polypropylene (PP) substrates to study the physical inhibition of bacterial adhesion [82].
- Master Mold Fabrication: Create a silicon master mold featuring the desired hierarchical pattern using standard photolithography and etching techniques.
- Polymer Substrate Preparation: Clean a PP film thoroughly with ethanol and deionized water, then dry it in a nitrogen stream.
- Thermal Nanoimprinting: a. Heat the PP substrate above its glass transition temperature (typically ~160°C). b. Press the master mold onto the softened PP film with a controlled pressure (e.g., 30 bar) for a set time (e.g., 5 minutes) to ensure pattern transfer. c. Cool the system below the glass transition temperature before demolding.
- Quality Control: Characterize the imprinted topographies using Scanning Electron Microscopy (SEM) or Atomic Force Microscopy (AFM) to verify feature dimensions and uniformity.
Protocol 2: Quantifying Bacterial Adhesion under Static Conditions
A standard assay for initial screening of anti-adhesive surfaces.
- Surface Sterilization: Sterilize all test surfaces by UV irradiation for 30 minutes per side.
- Bacterial Inoculum Preparation: Grow the target bacterial strain (e.g., E. coli or S. aureus) to mid-log phase. Centrifuge, wash, and resuspend in the appropriate buffer (e.g., PBS or a minimal nutrient medium) to a standard optical density (OD₆₀₀ ≈ 0.1).
- Adhesion Incubation: Place each sterile surface in a well of a 24-well plate. Add 1 mL of the bacterial suspension to cover each surface. Incubate without agitation for 2 hours at 37°C.
- Removal of Non-Adhered Cells: Gently rinse each surface three times with PBS to remove loosely attached bacteria.
- Viability Staining and Enumeration:
a. For total adhered cells: Detach bacteria by sonication in PBS, then serially dilute and plate on agar. Count Colony Forming Units (CFU) after incubation.
b. For viability on the surface: Use a Live/Dead BacLight bacterial viability kit. Stain the surface according to the manufacturer's instructions and visualize under a confocal laser scanning microscope (CLSM). Calculate the percentage reduction in adhesion compared to a control unpatterned surface using the formula:
% Reduction = [(CFU_control - CFU_test) / CFU_control] * 100[82].
Protocol 3: Measuring Bacterial Adhesion under Hydrodynamic Flow
This method provides a more physiologically relevant assessment of adhesion under shear stress.
- Setup a Flow Cell System: Assemble a parallel plate flow chamber or use a commercially available system. Secure the test surface into the chamber.
- Prime with Buffer: Pump sterile buffer through the system at the desired shear rate (e.g., 100 s⁻¹) to remove air bubbles and equilibrate the surface.
- Perfuse with Bacterial Suspension: Switch the inflow to the bacterial inoculum (prepared as in Protocol 2, step 2) and perfuse for a set time (e.g., 4 hours).
- Rinse and Image: After perfusion, switch back to buffer to rinse off non-adhered cells.
- Real-Time Monitoring and Analysis: Use an inverted microscope coupled with a camera to record time-lapse images of the surface during the experiment. Software analysis can be used to quantify the number of adhered bacteria per unit area over time [10].
Experimental Workflows and Relationships
Surface Property - Bacterial Adhesion Relationship
Bioluminescence Imaging (BLI) is a powerful, non-invasive technology that enables the real-time monitoring of biological processes, such as infections, in living animals. It harnesses light-producing enzymatic reactions, primarily from luciferase enzymes, to track and quantify pathogens or cellular events over time.
How does BLI work for infection monitoring? In the context of infection studies, pathogens (like bacteria or fungi) are genetically engineered to express luciferase enzymes. When a corresponding substrate is administered to the animal, the enzyme catalyzes a light-producing reaction. This light, emitted from the site of infection, is then detected by a highly sensitive camera system located outside the animal, allowing researchers to localize and quantify the infection in real-time without the need for euthanasia [84] [85].
Key Advantages for Material and Adhesion Studies:
- Real-Time Data: Enables longitudinal studies on the same cohort of animals, significantly reducing inter-animal variability and the total number of animals required [86].
- High Sensitivity: Capable of detecting very low numbers of cells, making it ideal for tracking the initial stages of bacterial adhesion and colonization [87] [85].
- Low Background: Unlike fluorescence, bioluminescence does not require excitation light, resulting in virtually no background autofluorescence from tissues and a high signal-to-noise ratio [84] [88].
Frequently Asked Questions (FAQs) & Troubleshooting
Q1: We are studying bacterial adhesion to a new implant coating in a mouse model. Why is our bioluminescent signal weak or undetectable?
Weak signals can arise from several factors. Systematically check the following:
- Substrate Administration: The method and timing of substrate delivery are critical. Intraperitoneal (IP) injection is common, but the signal peaks at different times depending on the substrate (e.g., ~10-20 minutes for Furimazine with NLuc; ~10-15 minutes for IV D-luciferin). Ensure you are imaging at the correct post-injection time [88].
- Pathogen Viability: Confirm that your engineered bioluminescent strain is metabolically active and that the infection has been established. The bioluminescent reaction requires ATP and oxygen, so non-viable or dormant bacteria will not produce a signal [87] [85].
- Reporter Expression: Verify that the luciferase gene is being stably expressed by your pathogen. Using a promoter that is active during the adhesion and biofilm formation stage is crucial [85].
- Optical Interference: Fur and skin pigment can absorb and scatter light. For optimal imaging, shave or depilate the area of interest and use a luciferase reporter with red-shifted emission (e.g., Akaluc, Click Beetle Red) for deeper tissue penetration [87] [88].
Q2: Our negative control groups are showing a high background signal. What could be the cause?
A high background is often related to substrate handling or experimental conditions.
- Substrate Auto-luminescence: The coelenterazine-based substrates used for Renilla (RLuc) and Gaussia (GLuc) luciferases are particularly prone to auto-oxidation and high background. Use newly formulated, stable substrates like ViviRen and prepare them immediately before use, protecting them from light [89] [88].
- Contamination: Ensure that all reagents, surgical tools, and implants are sterile. Background signal could indicate a low-level contaminating infection.
- Media Components: For in vitro adhesion assays, culture media containing phenol red can increase background. Use phenol red-free media for imaging experiments [90].
Q3: We see high variability in signal between replicate animals. How can we improve consistency?
High variability compromises data integrity. Address these potential sources:
- Substrate Delivery: Inconsistent injection technique (e.g., failed IP injections) is a major source of variability. Standardize injection protocols and have personnel trained accordingly. Using an injector-integrated imaging system can help [89] [88].
- Data Normalization: For cell-based studies, normalize the bioluminescence signal to the number of viable cells using a second method, such as a colony-forming unit (CFU) count from explained tissues or implants [87] [91].
- Master Mixes: When preparing reagents for in vitro assays, always create a master mix to ensure equal distribution across all samples [89].
Key Experimental Protocols
Protocol 1: Validating Anti-Adhesion Coatings in a Subcutaneous Implant Model
This protocol outlines the use of BLI to evaluate the efficacy of novel biomaterial coatings in preventing bacterial adhesion in vivo [87] [86].
Objective: To longitudinally monitor the ability of a test coating to reduce Staphylococcus aureus adhesion and biofilm formation on a subcutaneous implant compared to an uncoated control.
Materials:
- Bioluminescent S. aureus (e.g., strain Xen29 with integrated luxABCDE operon) [87]
- Test-coated and control (uncoated) implant material discs
- Mice (e.g., SKH1-e hairless or shaved/depilated strains)
- In Vivo Imaging System (IVIS) with cooled CCD camera
- VivoGlo D-Luciferin or equivalent substrate
- Anesthesia system (e.g., isofluorane)
Method:
- Implant Surgery: Aseptically implant the test and control material discs into subcutaneous pockets on the dorsum of anesthetized mice.
- Inoculation: Directly inoculate the implant sites with a standardized inoculum (e.g., 10^5 CFU) of bioluminescent S. aureus.
- Image Acquisition:
- At defined timepoints post-infection (e.g., days 1, 3, 7), administer D-luciferin via IP injection.
- Anesthetize mice and place them in the imaging chamber.
- Acquire images using the IVIS system at the predetermined peak signal time (typically 10-15 minutes post-injection for IV, longer for IP). Use consistent exposure times (e.g., 1-5 minutes) [90] [84].
- Data Analysis:
- Quantify the total flux (photons/second) within a fixed Region of Interest (ROI) over each implant site.
- Compare the mean bioluminescent signal from test-coated implants versus control implants over time. A significant reduction in signal indicates successful inhibition of bacterial adhesion and growth.
- Ex Vivo Validation: At the endpoint, explant the discs and adjacent tissue for correlative CFU counting and histological analysis to confirm the BLI data [87].
Protocol 2: Quantitative In Vitro Adhesion Assay Using Bioluminescent Bacteria
This method provides a rapid, non-destructive alternative to traditional CFU counting for screening material coatings against bacterial adhesion [91].
Objective: To quantify the adhesion of a bioluminescent Pseudomonas aeruginosa (PAO1-lux) strain to various material surfaces in real-time.
Materials:
- Recombinant bioluminescent P. aeruginosa (PAO1-lux) [91]
- Material samples (e.g., polymers, metals with different coatings)
- 6-well or 24-well microtiter plates
- M9 medium, pH 6.2
- Ultrasonic cleaning bath
- Luminometer or IVIS system
Method:
- Bacterial Preparation: Grow the PAO1-lux strain to mid-log phase and dilute to an optical density (OD600) of 0.1 (~10^8 CFU/mL) in M9 medium, pH 6.2.
- Adhesion Phase: Place material samples in wells and inoculate with the bacterial suspension. Incubate statically for 6 hours at 37°C to allow for adhesion.
- Signal Measurement:
- Direct Reading: Gently rinse samples to remove non-adherent cells and transfer to a clean plate. Measure bioluminescence directly using a luminometer or IVIS. The signal intensity is proportional to the number of adherent, metabolically active bacteria.
- Ultrasonic Recovery: Alternatively, subject the rinsed samples to ultrasonic vibration to detach adherent bacteria. Measure the bioluminescence of the resulting suspension, which correlates with the total number of adherent cells [91].
- Calibration: Establish a standard curve by correlating bioluminescence readings with CFU counts for the strain to convert future luminescence data into estimated bacterial numbers.
The workflow for this protocol is summarized in the following diagram:
The Scientist's Toolkit: Research Reagent Solutions
Table 1: Essential Luciferase Reporters and Substrates for BLI
| Reagent | Key Characteristics | Primary Applications in Infection Studies | Example Use Case |
|---|---|---|---|
| Firefly Luciferase (FLuc) | Requires D-luciferin, ATP, O₂; emission peak ~560-610 nm [85] [88] | Monitoring bacterial burden, tumor models, drug efficacy [87] [84] | Tracking S. aureus biofilm development on an implant over 7 days [87]. |
| NanoLuc (NLuc) | Small size (19 kDa), ATP-independent, uses Furimazine; very bright; emission peak ~460 nm [85] [88] | Ideal for viral reporters, protein fusions, tracking extracellular vesicles (EVs) [88]. | Studying biodistribution of engineered pathogens or viral vectors. |
| Bacterial Lux Operon | Self-contained; requires no exogenous substrate; genes (luxCDABE) produce enzyme and substrate [85] | Longitudinal Gram-positive/Gram-negative bacterial infection studies without repeated injection [85]. | Continuous, real-time monitoring of P. aeruginosa wound infection without disturbing the animal. |
| Renilla Luciferase (RLuc) | Uses coelenterazine; ATP-independent; emission peak ~480 nm [85] [88] | Multiplexing with FLuc; studies in hypoxic environments (ATP-independent) [88]. | Dual-imaging of two different pathogens or cellular processes. |
| Akaluc/AkaLumine | Engineered FLuc variant; red-shifted emission; high signal intensity [88] | Deep-tissue infection imaging, such as osteomyelitis or endocarditis [87] [88]. | Monitoring relapsing infective endocarditis in the heart with improved signal penetration [87]. |
Table 2: Key Instrumentation and Software for BLI
| Tool | Function | Key Considerations |
|---|---|---|
| IVIS Imaging System | In vivo optical imaging using a cooled CCD camera to detect low-light bioluminescence [87] [84]. | Look for features like gas anesthesia, heated stage, and sensitive CCD cameras cooled to -80°C to -90°C to reduce noise [84]. |
| Living Image Software | Image acquisition and data analysis software; overlays luminescent data on a photographic image [87]. | Used for defining Regions of Interest (ROI) and quantifying total flux (photons/sec) [87]. |
| GloMax Galaxy Imager | Luminometer and imager for in vitro and limited in vivo applications [90]. | Ideal for quantifying adhesion in 6- to 96-well plate formats during initial material screening [91] [90]. |
Visualizing Signaling Pathways and Workflows
The following diagram illustrates the core chemical pathway of the firefly luciferase reaction, which is the basis for signal generation in many BLI experiments.
Conclusion
Optimizing surface materials to control bacterial adhesion requires a multidisciplinary approach that integrates materials science, microbiology, and clinical insight. The key takeaway is that no single property dictates bacterial behavior; instead, a combination of surface free energy, topography, and chemistry must be strategically engineered. Future directions point toward the development of intelligent, multifunctional coatings that can respond dynamically to the biological environment, release antimicrobials on demand, and resist the accumulation of biological debris. Furthermore, standardizing validation protocols and improving in vitro models to better predict in vivo performance will be crucial for accelerating the translation of these advanced materials from the laboratory to clinical practice, ultimately reducing the burden of biofilm-associated infections in healthcare.
References
- 1. Reversible and Irreversible Adhesion of Motile Escherichia ... [https://pmc.ncbi.nlm.nih.gov/articles/PMC123977/]
- 2. Detachment and successive re-attachment of multiple ... [https://www.nature.com/articles/s41598-017-04703-8]
- 3. Surface Design for Antibacterial Materials [https://pmc.ncbi.nlm.nih.gov/articles/PMC8498904/]
- 4. Bacterial adherence: much more than a bond - PMC [https://pmc.ncbi.nlm.nih.gov/articles/PMC6604948/]
- 5. Recent Developments in the Inhibition of Bacterial ... [https://pmc.ncbi.nlm.nih.gov/articles/PMC10002502/]
- 6. Enhanced bacterial adhesion force by rifampicin resistance ... [https://www.sciencedirect.com/science/article/abs/pii/S0043135423007558]
- 7. Mechanisms of antimicrobial resistance in biofilms [https://www.nature.com/articles/s44259-024-00046-3]
- 8. The Role of Implant Coronal Surface Properties on Early ... [https://pubmed.ncbi.nlm.nih.gov/39748485/]
- 9. Strategies and applications of antibacterial surface-modified ... [https://pmc.ncbi.nlm.nih.gov/articles/PMC12274879/]
- 10. Implication of Surface Properties, Bacterial Motility, and ... [https://pmc.ncbi.nlm.nih.gov/articles/PMC7907602/]
- 11. Surface free energy (SFE), surface energy [https://www.kruss-scientific.com/en/know-how/glossary/surface-free-energy]
- 12. Bacterial adhesion and surface roughness of particulate- ... [https://link.springer.com/article/10.1007/s10266-024-00997-z]
- 13. Contact Angle [https://www.mri.psu.edu/materials-characterization-lab/characterization-techniques/contact-angle]
- 14. Hostile Environments: Modifying Surfaces to Block ... [https://www.mdpi.com/2218-273X/15/6/754]
- 15. Work of Adhesion | Measurements [https://www.biolinscientific.com/measurements/work-of-adhesion]
- 16. interpretation in terms of DLVO and XDLVO theories [https://www.sciencedirect.com/science/article/abs/pii/S0927776599000314]
- 17. Assessing bacterial adhesion using DLVO and XDLVO ... [https://pubmed.ncbi.nlm.nih.gov/19493661/]
- 18. Quantitatively Predicting Bacterial Adhesion Using Surface ... [https://pmc.ncbi.nlm.nih.gov/articles/PMC4854535/]
- 19. Surface Free Energy (SFE) [https://www.nanoscience.com/techniques/tensiometry/surface-free-energy-sfe/]
- 20. Bioinspired strategies for antibacterial surface design [https://www.sciencedirect.com/science/article/pii/S2950387625000054]
- 21. Recent Progress on Bioinspired Antibacterial Surfaces for ... [https://pmc.ncbi.nlm.nih.gov/articles/PMC9326651/]
- 22. Bio-mimicking nano and micro-structured surface fabrication ... [https://pmc.ncbi.nlm.nih.gov/articles/PMC5625685/]
- 23. A Supraparticle‐Based Approach to Robust Biomimetic ... [https://pmc.ncbi.nlm.nih.gov/articles/PMC12548018/]
- 24. Biomimetic hierarchical nanofibrous surfaces inspired by ... [https://www.sciencedirect.com/science/article/pii/S0264127522002829]
- 25. Bioinspired self-adhesive coating for surface ... [https://www.sciopen.com/article/10.26599/FRICT.2025.9440926?issn=2223-7690]
- 26. Immobilized liquid layers: A new approach to anti-adhesion ... [https://pmc.ncbi.nlm.nih.gov/articles/PMC4950346/]
- 27. Recent Advances in Zwitterionic Hydrogels - PubMed Central [https://pmc.ncbi.nlm.nih.gov/articles/PMC8775195/]
- 28. Recent Advances in High-Strength Zwitterionic Polymer ... [https://link.springer.com/article/10.1007/s12209-025-00440-6]
- 29. Structures, properties, and applications of zwitterionic ... [https://www.sciencedirect.com/science/article/pii/S2772571522000237]
- 30. How to Fix Common Coating Adhesion Problems [https://www.suncoating.com/blog/how-to-fix-common-coating-adhesion-problems/]
- 31. Coating Failure Troubleshooting [https://marvelcoatings.com/blog/coating-failure-troubleshooting-fixing-blistering-cracking-delamination]
- 32. Preventing bacterial adhesion to skin by altering their ... [https://www.nature.com/articles/s41522-024-00568-8]
- 33. Bacterial adhesion to biomaterials: What regulates this ... [https://pmc.ncbi.nlm.nih.gov/articles/PMC8215285/]
- 34. Targeting the bacteria–host interface: Strategies in anti- ... [https://pmc.ncbi.nlm.nih.gov/articles/PMC3710331/]
- 35. A review on anti-adhesion therapies of bacterial diseases [https://link.springer.com/article/10.1007/s15010-018-1222-5]
- 36. Plasma Electrolytic Oxidation (PEO) Coatings for ... [https://www.mdpi.com/2079-6412/15/8/925]
- 37. Comparative Analysis of Bacterial Adhesion on Titanium ... [https://pmc.ncbi.nlm.nih.gov/articles/PMC12244593/]
- 38. Maximizing the potential applications of plasma electrolytic ... [https://www.sciencedirect.com/science/article/pii/S2213956724002469]
- 39. 10 Most Common Surface Quality Mistakes by Manufacturers [https://www.brighton-science.com/blog/10-most-common-surface-quality-mistakes-by-manufacturers]
- 40. Chemical Surface Modification Strategies for Polymers [https://surface-coating.alfa-chemistry.com/chemical-surface-modification-strategies-for-polymers.html]
- 41. Polymer Grafting and its chemical reactions - PMC [https://pmc.ncbi.nlm.nih.gov/articles/PMC9874337/]
- 42. Effect of Micro- and Nanoscale Topography on the ... [https://pmc.ncbi.nlm.nih.gov/articles/PMC3623177/]
- 43. Smart responsive materials for antibacterial therapy [https://www.sciencedirect.com/science/article/abs/pii/S0079642525001100]
- 44. Recent progress in antimicrobial strategies of controlled ... [https://pmc.ncbi.nlm.nih.gov/articles/PMC12521456/]
- 45. Smart self-defensive coatings with bacteria-triggered ... [https://pubmed.ncbi.nlm.nih.gov/39320148/]
- 46. Antimicrobial Activity of Silver-Treated Bacteria against ... [https://pmc.ncbi.nlm.nih.gov/articles/PMC7235873/]
- 47. Silver ion release from antimicrobial polyamide/ ... [https://www.sciencedirect.com/science/article/abs/pii/S014296120400506X]
- 48. Metal ion-assisted self-assembly of complexes for controlled ... [https://pmc.ncbi.nlm.nih.gov/articles/PMC4314726/]
- 49. Impact of surface roughness and wettability on microbial ... [https://pubmed.ncbi.nlm.nih.gov/40571650/]
- 50. Based on surface roughness and hydrophobicity to reduce ... [https://www.sciencedirect.com/science/article/abs/pii/S2214289425000432]
- 51. Prediction of coating degradation based on “Environmental ... [https://www.nature.com/articles/s41529-025-00614-6]
- 52. Hostile Environments: Modifying Surfaces to Block ... [https://pmc.ncbi.nlm.nih.gov/articles/PMC12190938/]
- 53. Strategies and materials for the prevention and treatment of ... [https://pmc.ncbi.nlm.nih.gov/articles/PMC10582481/]
- 54. Surface modification approaches for prevention of implant ... [https://www.sciencedirect.com/science/article/abs/pii/S0927776520303465]
- 55. Modification of surface topographies to inhibit candida biofilm ... [https://journals.plos.org/plosone/article?id=10.1371/journal.pone.0308705]
- 56. Dual-action prevention of adherent and non ... - RSC Publishing [https://pubs.rsc.org/en/content/articlehtml/2025/bm/d5bm00900f]
- 57. Versatile Polypeptide-Anchored Antifouling Dip-Coatings for ... [https://pubmed.ncbi.nlm.nih.gov/40934863/]
- 58. Scientists develop surfaces that trick bacteria, thwarting ... [https://modernsciences.org/surface-patterns-trick-bacteria-prevent-biofilms-july-2025/]
- 59. High throughput discovery of new fouling-resistant surfaces [https://pmc.ncbi.nlm.nih.gov/articles/PMC5308054/]
- 60. Strategies for combating bacterial biofilms: A focus on anti ... [https://pmc.ncbi.nlm.nih.gov/articles/PMC5955472/]
- 61. Nanomaterial-enabled anti-biofilm strategies - RSC Publishing [https://pubs.rsc.org/en/content/articlehtml/2025/nr/d4nr04774e]
- 62. Strategies for combating bacterial biofilm infections [https://www.nature.com/articles/ijos201465]
- 63. The Dual Role of Substrate Stiffness and Bacterial Growth Stage [https://pmc.ncbi.nlm.nih.gov/articles/PMC11945209/]
- 64. Testing Anti-Biofilm Polymeric Surfaces: Where to Start? [https://www.mdpi.com/1422-0067/20/15/3794]
- 65. Anti-Biofilm Strategies: A Focused Review on Innovative ... [https://pmc.ncbi.nlm.nih.gov/articles/PMC11052202/]
- 66. Comparison between bioluminescence imaging technique ... [https://pubmed.ncbi.nlm.nih.gov/25820122/]
- 67. Novel In Vitro Study to Assess Microbial Barrier Properties ... [https://pmc.ncbi.nlm.nih.gov/articles/PMC9596255/]
- 68. In vivo bioluminescence imaging of natural bacteria within ... [https://pmc.ncbi.nlm.nih.gov/articles/PMC10122673/]
- 69. Bioluminescence in Clinical and Point-of-Care Testing [https://www.mdpi.com/2079-6374/15/7/422]
- 70. 101 ELISA Troubleshooting Tips for Research in 2024 [https://www.assaygenie.com/101-elisa-troubleshooting-tips?srsltid=AfmBOooRW7y7M5DUzFIDa6qhE4I_zLLl7fcRDzZkqjD1PJND-Fduc64W]
- 71. ELISA troubleshooting [https://www.berthold.com/en-us/bioanalytics/applications/elisa/troubleshooting/]
- 72. Navigating In Vivo Bioluminescence Imaging [https://www.promega.kr/en/resources/pubhub/2024/navigating-in-vivo-bioluminescence-imaging/]
- 73. Poor Adherent Cell Attachment Troubleshooting [https://www.sigmaaldrich.com/US/en/technical-documents/technical-article/cell-culture-and-cell-culture-analysis/mammalian-cell-culture/poor-adherent-cell-attachment-troubleshooting?srsltid=AfmBOooMM-IPA8hi3AarMXzyDtAfDyqq4iBiG_079zDYuN9xAVZBmrdW]
- 74. Using xCELLigence RTCA Instrument to Measure Cell ... [https://pmc.ncbi.nlm.nih.gov/articles/PMC5777632/]
- 75. Influence of surface properties of titanium alloys for ... [https://www.sciencedirect.com/science/article/pii/S2352492825028909]
- 76. and osteoblast Bacteria to chitosan immobilized adhesion ... titanium [https://pubmed.ncbi.nlm.nih.gov/26222405/]
- 77. for anti-fouling applications: a review - Environmental... Polymers [https://pubs.rsc.org/en/content/articlehtml/2025/va/d5va00034c]
- 78. Multifunctional antibiofilm materials: surface engineering ... [https://www.sciencedirect.com/science/article/abs/pii/S1742706125005240]
- 79. Quantitative study of early-stage transient bacterial ... [https://www.nature.com/articles/s41598-024-67716-0]
- 80. Unveiling the characteristics and surface modification of ... [https://pmc.ncbi.nlm.nih.gov/articles/PMC12485408/]
- 81. Antibacterial PEEK-Ag Surfaces: Development and In Vitro ... [https://pmc.ncbi.nlm.nih.gov/articles/PMC12565078/]
- 82. Impact of surface topography on the bacterial attachment to ... [https://www.sciencedirect.com/science/article/abs/pii/S246802302100571X]
- 83. Understanding bacterial surface and adhesion properties ... [https://www.sciencedirect.com/science/article/abs/pii/S1359029423000924]
- 84. A Deep Overview of Bioluminescence Imaging (BLI) [https://www.goldbio.com/blogs/articles/deep-overview-of-bioluminescence-imaging-bli?srsltid=AfmBOorFW3r6O1RGIOOqBQleW5-vfmuqtenjzTQIFE0YceOcFxFxFwhL]
- 85. In-vivo monitoring of infectious diseases in living animals ... [https://pmc.ncbi.nlm.nih.gov/articles/PMC6067836/]
- 86. Review The potential for bio-optical imaging of biomaterial- ... [https://www.sciencedirect.com/science/article/abs/pii/S014296120901312X]
- 87. Real-Time In Vivo Bioluminescent Imaging for Evaluating ... [https://pmc.ncbi.nlm.nih.gov/articles/PMC538900/]
- 88. Navigating In Vivo Bioluminescence Imaging [https://www.promega.com/resources/pubhub/2024/navigating-in-vivo-bioluminescence-imaging/]
- 89. Luciferase-based Reporter Assay Troubleshooting Guide [https://www.goldbio.com/blogs/articles/luciferase-based-reporter-assay-troubleshooting-guide?srsltid=AfmBOoqII8qRJquR5VjFDHHyTAPrQEuRchSWJ6qjm4Mxmq8PJZb4JOm5]
- 90. FAQ: GloMax® Galaxy Bioluminescence Imager [https://www.promega.com/resources/pubhub/faq/faq-glomax-galaxy-bioluminescence-imager/]
- 91. A quantitative method to assess bacterial adhesion using ... [https://pmc.ncbi.nlm.nih.gov/articles/PMC10240536/]