Probing Biofilm Dynamics in Liquid: How Physiological AFM is Revolutionizing Antimicrobial Research
This article explores the transformative role of Atomic Force Microscopy (AFM) performed under physiological, fluid conditions in advancing biofilm research.
Probing Biofilm Dynamics in Liquid: How Physiological AFM is Revolutionizing Antimicrobial Research
Abstract
This article explores the transformative role of Atomic Force Microscopy (AFM) performed under physiological, fluid conditions in advancing biofilm research. Biofilms, structured microbial communities responsible for up to 80% of human microbial infections and a major contributor to antimicrobial resistance, present a significant challenge in healthcare and drug development. Traditional imaging techniques often fail to capture their native structure and real-time functionality. This review details how fluid-phase AFM provides unprecedented, nanoscale insights into biofilm architecture, mechanical properties, and the efficacy of anti-biofilm agents in conditions that mimic the human body. Aimed at researchers, scientists, and drug development professionals, the content covers foundational principles, methodological applications for evaluating novel therapies, troubleshooting for experimental fidelity, and validation against established techniques, ultimately outlining a path for accelerating the discovery of much-needed anti-biofilm strategies.
Understanding the Biofilm Challenge: Why Physiological Imaging is Non-Negotiable
Biofilms are structured microbial communities encased in a self-produced extracellular polymeric substance (EPS) matrix, which confer significant resistance to antimicrobial treatments and environmental stresses. This resilience is a primary contributor to persistent infections and treatment failures in clinical settings. The architecture of resistance in biofilms is a multi-faceted phenomenon, primarily governed by three interconnected pillars: the physical and chemical barrier provided by the EPS matrix, the presence of dormant persister cells, and the physiological heterogeneity that arises from nutrient and oxygen gradients within the biofilm structure. Understanding this architecture requires advanced analytical techniques capable of operating under physiologically relevant conditions. Atomic Force Microscopy (AFM) in fluids has emerged as a powerful tool for dissecting these mechanisms, providing unprecedented nanoscale resolution of biofilm topology, mechanics, and cellular responses in their native, hydrated state. This Application Note details how AFM under physiological conditions can be leveraged to quantitatively probe the structural and functional basis of biofilm resistance, providing researchers with robust protocols for high-resolution analysis.
Application Notes: Probing the Pillars of Resistance with AFM
The EPS Matrix: A Structural and Functional Barrier
The EPS matrix is a complex amalgam of polysaccharides, proteins, nucleic acids, and lipids that forms the foundational scaffold of a biofilm. It functions as a mechanical shield, a diffusion modifier, and a platform for intercellular communication. AFM enables direct investigation of the EPS's nanomechanical properties and its role in biofilm cohesion and protection.
- Topographical Mapping: AFM in liquid can resolve the dense, heterogeneous topology of the EPS matrix, revealing its organization around bacterial cells. This allows for the visualization of pores, channels, and structural variations that influence diffusion and confer protection [1].
- Nanomechanical Characterization: By operating in force-volume mode, AFM can quantify the elasticity (Young's modulus) and adhesion of the EPS matrix. Stiffer, more cohesive matrices are often correlated with enhanced resistance to mechanical disruption and antibiotic penetration [1].
- Practical Implication: Measurements have shown that the physical properties of the EPS can create a diffusion barrier, reducing the penetration of antimicrobial agents and contributing to tolerance at the community level.
Persister Cells: The Dormant Reservoir
Persister cells are a small, phenotypically variant subpopulation of metabolically dormant cells that exhibit exceptional tolerance to high doses of bactericidal antibiotics. They are not genetically mutant but are responsible for the recalcitrance of chronic infections and biofilm-related relapses.
- Morphological and Mechanical Profiling: AFM can detect and characterize persister cells within a population based on their distinct physical properties. Studies on E. coli persisters have revealed critical phenotypic adaptations, summarized in Table 1 [2].
- Single-Cell Analysis: The capability of AFM to probe single cells allows for the direct comparison of persisters against their susceptible counterparts, linking morphological changes like cell shrinkage to the dormant state and reduced antibiotic uptake [2].
Table 1: Quantitative Changes in E. coli Persister Cell Properties in Response to Ampicillin (20x MIC)
| Property | Strain A5 (vs. Untreated) | Strain A9 (vs. Untreated) | Proposed Functional Significance |
|---|---|---|---|
| Cell Surface Area | 1.3-fold Decrease | 1.4-fold Decrease | Reduced surface for antibiotic interaction; dormancy |
| RMS Roughness | 1.2-fold Increase | 1.6-fold Increase | Altered surface topography, potentially affecting molecule adhesion |
| Adhesion Force | 3.4-fold Increase | 4.4-fold Increase | Enhanced cell-surface or cell-cell attachment |
| Elasticity (Stiffness) | 3.3-fold Increase | 4.5-fold Increase | Increased membrane rigidity and reduced permeability |
| Surface Biopolymer Thickness | 1.2-fold Decrease | 1.6-fold Decrease | Collapsed surface polymers minimizing interaction with antibiotics |
Physiological Heterogeneity: Gradients and Microenvironments
Biofilms are not homogeneous entities. Gradients of nutrients, oxygen, and waste products create a mosaic of microenvironments, leading to heterogeneous metabolic activity and varied bacterial responses to antibiotics. Cells in the nutrient-depleted, anaerobic core of a biofilm often display reduced metabolic activity, directly contributing to antibiotic tolerance.
- Spatial Mapping: Large-area automated AFM, combined with machine learning for image stitching, can correlate topographical features with local mechanical properties across millimeter-scale areas, revealing the spatial distribution of heterogeneous microenvironments [1].
- Linking Structure to Function: This approach allows researchers to link specific structural features (e.g., cluster density, honeycomb patterns) to functional heterogeneity, visualizing how the biofilm architecture supports the formation of metabolic gradients [1].
Experimental Protocols
Protocol 1: AFM for Nanomechanical Profiling of Biofilms under Physiological Conditions
This protocol describes the procedure for preparing and analyzing biofilms to quantify the mechanical properties of the EPS matrix and individual cells, including persisters.
I. Sample Preparation
- Substrate Selection: Use PFOTS-treated glass coverslips or relevant medical polymer surfaces (e.g., polyethylene, polyurethane) to facilitate bacterial attachment [1] [3].
- Biofilm Growth: Inoculate the substrate with the bacterial strain of interest (e.g., Pantoea sp. YR343, E. coli) in an appropriate growth medium. Incubate for a defined period (e.g., 30 minutes for early attachment studies; 6-48 hours for mature biofilms) under optimal conditions [1].
- Sample Rinsing and Hydration: Gently rinse the sample with a sterile physiological buffer (e.g., PBS, 10mM HEPES) to remove non-adherent cells. Critical: Do not let the sample dry. Immediately mount the sample in the AFM liquid cell, ensuring it remains fully hydrated in the chosen buffer to maintain physiological conditions [1].
II. AFM Imaging and Force Spectroscopy
- Probe Selection: Use sharp silicon nitride tips (nominal spring constant ~0.1 N/m) for high-resolution imaging in soft tapping mode. For force spectroscopy, use tips with a well-defined geometry (e.g., spherical tips) and calibrate their spring constant prior to measurement.
- Data Acquisition:
- Topographical Imaging: Acquire images in tapping mode in fluid to minimize sample damage. For large-area analysis, employ an automated rastering and stitching algorithm [1].
- Force Volume Mapping: Acquire a grid of force-distance curves over the region of interest (e.g., on the EPS matrix, on a single cell, and on a dormant-looking cell). Collect a minimum of 32x32 curves per map.
- Single-Cell Mechanics: Position the AFM tip over the center of a selected cell and acquire multiple force-distance curves to ensure data reproducibility.
III. Data Analysis
- Topographical Analysis: Use machine learning-based segmentation to automatically identify and count cells, and calculate parameters like surface coverage (confluency) and roughness [1].
- Elasticity Calculation: Fit the retraction portion of the force-distance curves to the Hertzian contact model (for spherical tips) to derive the Young's modulus (Elasticity) for each point of measurement.
- Adhesion Force: Extract the maximum adhesion force from the force-distance curve's retraction signature.
The following workflow diagram illustrates the key steps of this protocol:
Protocol 2: Correlative Analysis of Persister Cells
This protocol outlines a method for isolating and physically characterizing persister cells following antibiotic treatment.
I. Persister Cell Isolation
- Culture and Treatment: Grow the bacterial strain to mid-log phase. Treat the culture with a high concentration of a bactericidal antibiotic (e.g., 20x MIC of ampicillin) for an extended period (e.g., 25 hours) [2].
- Confirmation of Persistence: Determine the survival rate via colony-forming unit (CFU) counts. A biphasic kill curve with a surviving subpopulation confirms persister formation [2] [4].
- Washing: Gently wash the antibiotic-treated culture to remove the drug and debris, resuspending the pellet in a suitable physiological buffer.
II. Correlative Microscopy and AFM
- Fluorescence Staining: Use a LIVE/DEAD viability stain (e.g., SYTO 9 and propidium iodide). Persisters will be stained as live (green) despite antibiotic exposure.
- Identification and Correlation: Use fluorescence microscopy to locate clusters of viable cells. Correlate this location with the AFM stage for subsequent nanomechanical analysis [4].
- AFM Characterization: Follow the AFM procedures in Protocol 1 to perform force spectroscopy on the identified persister cells and non-persister cells for comparative analysis of their mechanical properties (refer to Table 1).
Signaling Pathways in Biofilm Resistance
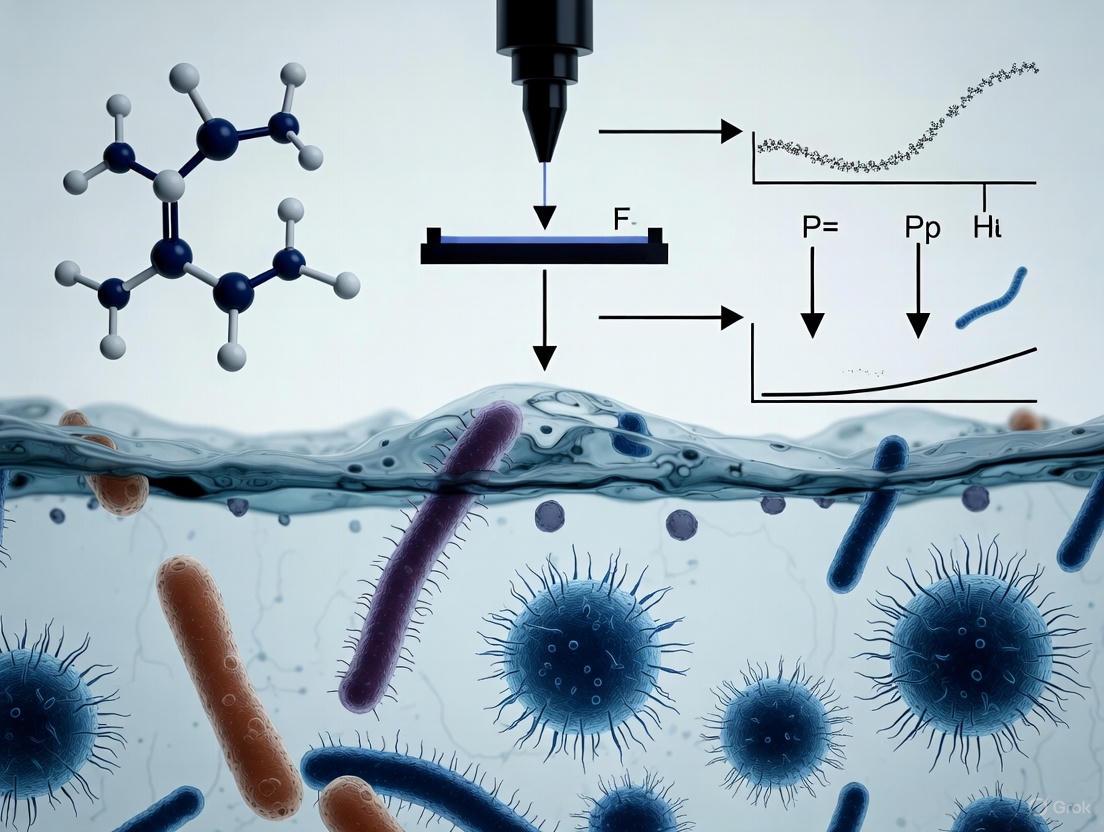
A key signaling molecule governing the transition from planktonic life to the biofilm state and the emergence of persistence is cyclic di-guanosine monophosphate (c-di-GMP). High intracellular levels of c-di-GMP promote biofilm formation by upregulating the production of EPS matrix components and adhesins. Furthermore, the c-di-GMP network interacts with cellular stress response pathways that can induce a dormant, persistent state. Recent studies on natural compounds like flavonoids (e.g., fisetin) have shown that they can target and inhibit diguanylate cyclases (DGCs), the enzymes that synthesize c-di-GMP, thereby disrupting biofilm formation and its associated resistance [5]. The following diagram illustrates this central pathway and a potential intervention point.
The Scientist's Toolkit: Research Reagent Solutions
Table 2: Essential Materials for AFM-Based Biofilm Resistance Research
| Item | Function/Application | Specific Examples |
|---|---|---|
| Functionalized Substrates | To control initial bacterial attachment and study surface-biofilm interactions. | PFOTS-treated glass; Medical-grade polyethylene/polyurethane [1] [3]. |
| Physiological Buffers | To maintain native conditions for AFM imaging and force spectroscopy in liquid. | 10mM HEPES (pH 7.4); Phosphate Buffered Saline (PBS) [1]. |
| AFM Probes | For high-resolution imaging and nanomechanical property quantification. | Sharp silicon nitride tips for imaging; spherical colloidal probes for force spectroscopy. |
| Viability Stains | To correlate cell viability (e.g., persisters) with nanomechanical properties. | LIVE/DEAD BacLight Bacterial Viability Kits (SYTO 9/PI) [4]. |
| c-di-GMP Pathway Modulators | To experimentally manipulate biofilm formation and dissect resistance mechanisms. | Fisetin, a flavonoid that inhibits diguanylate cyclases (DGCs) [5]. |
| Machine Learning Software | For automated analysis of large-area AFM data (cell detection, classification, stitching). | Custom algorithms for image segmentation and feature extraction [1]. |
Biofilms are structured communities of bacterial cells enclosed in a self-produced extracellular polymeric substance (EPS) matrix that pose a significant challenge in medical, industrial, and environmental contexts due to their remarkable resistance to antimicrobial agents [6]. Understanding biofilm assembly, structure, and function is paramount for developing effective control strategies across healthcare sectors, yet researchers face significant methodological limitations when relying on classical characterization techniques. While methods such as crystal violet staining, colony forming unit (CFU) counts, and static electron microscopy have formed the historical backbone of biofilm analysis, they present critical constraints in resolution, quantification, and physiological relevance that hinder comprehensive understanding [7] [8]. These limitations become particularly problematic when investigating the dynamic, three-dimensional architecture of biofilms under conditions that mimic their natural environments. The advent of atomic force microscopy (AFM) operated in fluid under physiological conditions represents a transformative approach that bypasses these constraints, enabling nanoscale investigation of biofilm formation, structure, and response to therapeutic interventions with minimal sample disturbance [1] [9]. This application note delineates the specific limitations of classical biofilm assessment methods and illustrates how fluid-phase AFM addresses these challenges while providing detailed protocols for researchers and drug development professionals.
Quantitative Limitations of Classical Biofilm Assessment Methods
Classical methods for biofilm quantification provide limited and often misleading information about biofilm viability, composition, and structure. The crystal violet assay, while cost-effective and compatible with high-throughput screening, measures total biomass without distinguishing between viable cells, dead cells, and the extracellular matrix components [6]. This limitation becomes particularly problematic when assessing antimicrobial efficacy, as demonstrated in studies where polysaccharide-degrading enzymes caused apparent increases in crystal violet staining despite actual biofilm disruption—a false positive resulting from increased availability of dye-binding sites [7]. Similarly, CFU enumeration, which quantifies viable and culturable bacteria, fails to account for the metabolically dormant "persister" cells within biofilms that remain viable but non-culturable under standard laboratory conditions [6]. This methodological gap can lead to significant underestimation of biofilm survival after antimicrobial treatment. The static nature of these measurements also obscures the dynamic processes central to biofilm development and resilience.
Table 1: Limitations of Classical Biofilm Quantification Methods
| Method | Primary Measurement | Key Limitations | Impact on Data Interpretation |
|---|---|---|---|
| Crystal Violet Staining | Total biomass (cells + EPS) [6] | Cannot distinguish live/dead cells; EPS degradation may falsely increase signal [7] | Overestimation of biofilm viability after treatment; false positives |
| CFU Enumeration | Viable, culturable bacteria [8] [6] | Misses viable but non-culturable cells; requires biofilm disruption; sampling variability [6] | Underestimation of true viable cell count; incomplete efficacy assessment |
| Congo Red Agar | Extracellular polysaccharide production [6] | Semi-quantitative; media-dependent; no viability or structural data [6] | Qualitative assessment only; limited application for therapeutic screening |
Structural and Dynamic Analysis Constraints of Static Imaging
Static imaging techniques, including scanning electron microscopy (SEM) and conventional light microscopy, fail to capture the dynamic structural changes and functional adaptations of living biofilms. SEM provides high-resolution surface images of biofilms but requires extensive sample preparation involving fixation, dehydration, and conductive coating—processes that introduce artifacts and distort the native biofilm architecture [10] [6]. While valuable for examining surface details, these methods eliminate the possibility of observing real-time biofilm development or response to environmental stimuli. Light microscopy techniques, including standard fluorescence microscopy, offer live imaging capabilities but suffer from limited resolution and penetration depth, making them unsuitable for analyzing the three-dimensional complexity of mature biofilms [6]. This resolution gap becomes particularly critical when investigating finer biofilm features such as initial attachment mechanisms, flagellar interactions, and EPS matrix organization, which occur at the nanoscale [1]. The following table compares the capabilities and constraints of various biofilm imaging modalities:
Table 2: Comparison of Biofilm Imaging Techniques
| Technique | Resolution | Sample Preparation | Live Imaging Capability | Key Limitations |
|---|---|---|---|---|
| Light Microscopy | ~200 nm [6] | Minimal (for live cells) [8] | Yes [8] | Limited resolution; poor penetration in thick biofilms [6] |
| Scanning Electron Microscopy (SEM) | <10 nm [10] | Extensive (fixation, dehydration, coating) [10] [6] | No | Artifacts from preparation; no physiological conditions [10] |
| Confocal Laser Scanning Microscopy (CLSM) | ~200 nm [10] | Fluorescent staining often required [10] | Yes | Limited by dye penetration; photobleaching; lower resolution than AFM [1] |
| Atomic Force Microscopy (AFM) in Fluid | <5 nm [1] [9] | Minimal (can image in physiological buffer) [1] [9] | Yes | Limited scan area in conventional systems; specialized equipment required [1] |
Advanced Protocols: Atomic Force Microscopy in Physiological Conditions
Atomic force microscopy operated in fluid under physiological conditions addresses the fundamental limitations of classical techniques by enabling nanoscale resolution imaging of biofilms in their native, hydrated state. This methodology preserves the delicate structures of both bacterial cells and the surrounding EPS matrix while allowing for real-time observation of dynamic processes. The following section provides detailed protocols for assessing biofilms using AFM in physiological conditions, with particular emphasis on the novel large-area AFM approach and force spectroscopy measurements that directly quantify biofilm adhesion properties—capabilities absent in classical methods.
Protocol: Large-Area AFM Imaging of Biofilm Formation Under Physiological Conditions
The limited scan range of conventional AFM (<100 µm) has historically restricted its ability to link nanoscale features to the functional macroscale organization of biofilms [1]. The recently developed automated large-area AFM approach overcomes this constraint by capturing high-resolution images over millimeter-scale areas, providing unprecedented insights into spatial heterogeneity and cellular morphology during biofilm development [1].
Experimental Workflow:
Materials and Reagents:
- Bacterial Strains: Pantoea sp. YR343 (gram-negative, motile, biofilm-forming) or relevant clinical isolates [1]
- Growth Medium: Appropriate nutrient broth (e.g., Tryptic Soy Broth for Pantoea sp.) [1]
- Substrates: PFOTS-treated glass coverslips or silicon substrates (for controlled hydrophobicity) [1]
- Imaging Buffer: Phosphate-buffered saline (PBS, pH 7.4) or specific growth medium without indicators [1] [9]
- AFM System: Atomic force microscope with large-area piezo scanner, liquid cell, and appropriate cantilevers (e.g., MikroMasch HQ:NSC14/Al BS) [1] [11]
Procedure:
- Biofilm Growth: Inoculate petri dishes containing sterile substrate coverslips with bacterial culture diluted to appropriate density (e.g., 0.5 McFarland standard). Incubate at optimal growth temperature for selected time points (e.g., 30 minutes for initial attachment studies, 6-8 hours for microcolony formation) [1].
- Sample Preparation: Gently remove coverslips from growth medium and rinse with imaging buffer to remove non-adherent cells while preserving the native biofilm structure. Avoid dehydration or fixation steps that would alter biofilm morphology.
- AFM Mounting: Secure the prepared sample in the AFM liquid cell and add appropriate imaging buffer to completely submerge the biofilm. Ensure no air bubbles are trapped between the cantilever and sample surface.
- Imaging Parameters: Engage the cantilever in fluid tapping mode to minimize lateral forces. Set appropriate scan parameters (typically 1-2 Hz scan rate, 512-1024 points per line). Implement automated large-area scanning through predefined tile patterns with minimal overlap (5-10%) [1].
- Data Acquisition: Acquire sequential images across the millimeter-scale area. Maintain temperature control if studying temperature-dependent phenomena.
- Image Processing: Use machine learning-assisted stitching algorithms to seamlessly combine individual image tiles into a comprehensive large-area map [1]. Implement automated segmentation and classification to identify cellular features, orientation, and spatial distribution patterns.
Key Applications:
- Visualization of preferred cellular orientation and honeycomb patterning in early biofilm formation [1]
- Mapping of flagellar interactions and their role in surface attachment and cellular coordination [1]
- Correlation of nanoscale surface properties with spatial heterogeneity in bacterial adhesion [1] [11]
Protocol: Quantitative Adhesion Force Measurements Using FluidFM Technology
Traditional single-cell force spectroscopy provides limited representation of realistic biofilm conditions where bacteria exist in communities encased in EPS [9]. FluidFM technology combines AFM with microfluidics to directly measure adhesion forces between entire biofilms and surfaces, offering more clinically relevant data for anti-biofouling therapeutic development.
Experimental Workflow:
Materials and Reagents:
- FluidFM System: Atomic force microscope with FluidFM capability, microfluidic cantilevers with apertures (8-12 µm), and pressure controller [9]
- Biofilm Carriers: COOH-functionalized polystyrene beads (10-15 µm diameter) optimized for bacterial growth [9]
- Bacterial Strains: Relevant biofilm-forming strains (e.g., Pseudomonas aeruginosa for medical applications) [9]
- Surface Modifications: Vanillin-coated polyethersulfone membranes or other anti-biofouling surfaces for therapeutic testing [9]
- Measurement Buffer: Phosphate-buffered saline (PBS) or specific physiological fluid relevant to application [9]
Procedure:
- Biofilm Growth on Beads: Incubate COOH-functionalized polystyrene beads with bacterial suspension in growth medium for 3 hours to establish initial biofilms. Use controlled shaking to ensure even biofilm development on bead surfaces [9].
- Cantilever Preparation: Clean microfluidic cantilevers according to manufacturer specifications. Fill cantilever and tubing with appropriate measurement buffer, ensuring no air bubbles remain in the system.
- Bead Aspiration: Apply negative pressure through the FluidFM system to aspirate a single biofilm-coated bead onto the cantilever aperture. Verify secure attachment through optical microscopy.
- Force Spectroscopy Measurements: Approach the biofilm-bearing cantilever to the test surface at a controlled rate (typically 0.5-1 µm/s). Upon contact, apply a defined contact force (0.5-2 nN) for a set dwell time (0.5-2 seconds) to simulate attachment conditions. Retract the cantilever at the same rate while recording the force-distance curve.
- Data Collection: Collect a minimum of 50-100 force curves across different locations on each surface type to ensure statistical significance. Include control measurements with unmodified surfaces for baseline comparison.
- Analysis Parameters: Quantify maximum adhesion force, adhesion work (area under the retraction curve), and the number of adhesion events from each force curve. Compare results between modified and control surfaces to evaluate anti-biofouling efficacy.
Key Applications:
- Direct quantification of biofilm adhesion reduction by anti-biofouling surface modifications (e.g., vanillin-coated membranes showed significant adhesion force reduction) [9]
- Comparison of biofilm vs. single-cell adhesion behavior, highlighting the contribution of EPS matrix to attachment strength [9]
- Evaluation of therapeutic candidates for their ability to disrupt biofilm-surface interactions under physiologically relevant conditions [9]
Essential Research Reagent Solutions
The following table details key reagents and materials essential for implementing advanced AFM-based biofilm characterization methods, with specific emphasis on maintaining physiological conditions throughout analysis.
Table 3: Essential Research Reagents for AFM Biofilm Studies Under Physiological Conditions
| Reagent/Material | Function | Application Notes |
|---|---|---|
| PFOTS-Treated Glass Substrates | Controlled hydrophobicity for studying attachment dynamics [1] | Enables investigation of surface property effects on initial bacterial adhesion |
| COOH-Functionalized Polystyrene Beads | Biofilm carriers for FluidFM adhesion measurements [9] | Optimal for bacterial growth and biofilm formation; compatible with microfluidic aspiration |
| Physiological Buffers (PBS, etc.) | Maintain hydrated, native state during AFM imaging [1] [9] | Preserves biofilm structure and function; prevents dehydration artifacts |
| Specialized AFM Cantilevers | Nanoscale force sensing and imaging in liquid [1] [11] | Silicon tips with pyramidal geometry; appropriate spring constants (0.1-0.5 N/m) for biofilms |
| Vanillin Coating Solutions | Anti-biofouling surface modification for therapeutic testing [9] | 3 g/L in PBS; quorum sensing inhibitor that reduces EPS production |
Classical biofilm assessment techniques including crystal violet staining, CFU enumeration, and static imaging methods present fundamental limitations in resolution, quantification accuracy, and physiological relevance that constrain research progress and therapeutic development. Atomic force microscopy operated in fluid under physiological conditions directly addresses these constraints by enabling nanoscale resolution imaging of hydrated, living biofilms without requiring destructive sample preparation. The protocols detailed herein for large-area AFM imaging and quantitative adhesion force measurements provide researchers with robust methodologies to investigate biofilm structure, dynamics, and therapeutic responses under conditions that closely mimic native environments. By adopting these advanced AFM approaches, researchers and drug development professionals can overcome the critical gaps inherent in classical techniques and accelerate the development of effective anti-biofilm strategies.
In biofilm research, the environmental context is not merely a background variable but a fundamental determinant of microbial structure and function. Biofilms, defined as assemblages of microbial cells irreversibly associated with a surface and enclosed in a matrix of extracellular polymeric substances (EPS), develop phenotypes that are critically distinct from their free-floating, planktonic counterparts [12] [13]. These phenotypic shifts are not intrinsic properties of the microbes alone; they are emergent traits dictated by the complex interplay between the microbial community and its surrounding fluid environment. Studying biofilms outside their physiological, fluid contexts—such as in dried or air-imaged states—fails to capture the true nature of their architecture, mechanics, and resistance profiles.
Atomic Force Microscopy (AFM) operated in fluid under physiological conditions presents a powerful solution to this challenge. It allows for the high-resolution investigation of biofilms in a state that closely mimics their natural and clinical habitats [1] [14]. This application note details the rationale, protocols, and key applications for employing AFM in fluid to elucidate how fluid environments dictate biofilm structure and function, providing researchers and drug development professionals with a framework for physiologically relevant analysis.
Key Concepts: Biofilm Properties Shaped by Fluid Environments
The formation of a biofilm is a developmental process initiated by the attachment of planktonic cells to a surface, a process heavily influenced by the properties of the aqueous medium, substratum effects, and hydrodynamic conditions [12]. An established biofilm is a hydrogel, a complex three-dimensional ecosystem characterized by gradients of nutrients, oxygen, and metabolic waste products [15] [13]. These gradients, established and maintained within the fluid milieu, lead to heterogeneous zones of cellular activity and are a primary reason for the increased tolerance of biofilms to antimicrobial agents [15].
The following table summarizes core biofilm properties that are directly shaped by their fluid environment and can be probed by AFM.
Table 1: Biofilm Properties Dictated by the Fluid Environment
| Property | Description | Impact of Physiological Fluid Conditions |
|---|---|---|
| EPS Matrix Structure | A hydrated network of polysaccharides, proteins, lipids, and DNA that forms the biofilm scaffold [13]. | Hydration state dictates matrix viscoelasticity, porosity, and stability. Dehydration for imaging collapses this native structure [14]. |
| Cellular Phenotype | The physiological state of cells within the biofilm differs from planktonic cells due to differential gene regulation [12]. | Fluid conditions maintain the phenotypic state, including the presence of persister cells, which contribute to antibiotic tolerance [15]. |
| Mechanical Stability | The viscoelastic behavior of the biofilm, which confers resistance to physical shear forces [14]. | Mechanical properties like elasticity and viscosity are intrinsic to the hydrated state. Measurements in air are not physiologically relevant. |
| Nutrient & Signaling Gradients | The differential distribution of molecules from the biofilm exterior to interior, creating heterogeneous microenvironments [15]. | Fluid flow is essential for establishing and maintaining these gradients, which influence metabolic activity and cellular differentiation. |
| Adhesion Strength | The force with which the biofilm adheres to a substratum or constituent cells cohere to each other [14]. | Adhesive forces are mediated by the hydrated EPS and are sensitive to ionic strength and pH of the surrounding fluid [12]. |
Experimental Protocols for AFM in Fluid
Protocol 1: Sample Preparation for AFM Analysis of Biofilms in Liquid
Objective: To grow and prepare biofilm samples for AFM analysis while preserving their native structure under physiological fluid conditions.
Materials:
- Bacterial Strain: e.g., Pantoea sp. YR343 [1] or Pseudomonas aeruginosa PAO1 [14].
- Growth Medium: Appropriate sterile broth (e.g., Trypticase Soy Broth for P. aeruginosa [14]).
- Substrata: PFOTS-treated glass coverslips [1], pristine glass, or other relevant surfaces (e.g., silicone-based materials).
- AFM Liquid Cell: A sealed fluid cell compatible with the AFM instrument.
Methodology:
- Surface Conditioning (Optional): If studying attachment on conditioned surfaces, expose the sterile substratum to the relevant fluid (e.g., simulated sputum medium SCFM2 for cystic fibrosis models [16]) for a defined period to form a conditioning film [12].
- Biofilm Growth: Inoculate a petri dish containing the chosen substratum with a bacterial suspension in growth medium. For early attachment studies, use a brief incubation period (~30 minutes to 2 hours). For mature biofilms, incubate for 6-24 hours or longer [1].
- Sample Mounting: Carefully remove the substratum with the attached biofilm from the growth medium.
- Gentle Rinsing: Immerse the sample gently in a buffered solution (e.g., PBS or a defined minimal medium) to remove non-adherent planktonic cells. Critical Step: Avoid dehydration or air-drying.
- AFM Fluid Cell Assembly: Place the hydrated sample onto the AFM sample stage. Assemble the liquid cell and fill it with the appropriate buffered solution to fully submerge the biofilm during imaging and force spectroscopy.
Protocol 2: Quantitative Adhesion and Viscoelasticity Measurements via MBFS
Objective: To absolutely quantify the adhesive and viscoelastic properties of a bacterial biofilm under native conditions using Microbead Force Spectroscopy (MBFS) [14].
Materials:
- AFM Instrument: MFP-3D or equivalent closed-loop AFM system.
- AFM Probes: Rectangular tipless silicon cantilevers (e.g., Mikromasch CSC12/Tipless).
- Microbeads: 50 µm diameter glass beads.
- Calibration Materials: Required for the thermal tuning method of cantilever spring constant calibration.
Methodology:
- Probe Functionalization: Attach a sterile 50 µm glass bead to the end of a tipless cantilever using a suitable epoxy.
- Biofilm-Coated Probe: Incubate the bead-probe in a concentrated suspension of the bacterial strain (e.g., OD600 of 2.0 for P. aeruginosa) to coat it with a layer of biofilm cells.
- System Calibration: Calibrate the cantilever's spring constant using the thermal tuning method [14].
- Standardized Force Measurements:
- Approach: Bring the biofilm-coated bead into contact with a clean glass surface in the liquid cell.
- Contact: Apply a predefined loading force (e.g., 500 pN) and maintain contact for a set "hold" time (e.g., 1-2 seconds).
- Retraction: Retract the probe at a constant speed while recording the force vs. distance curve.
- Data Analysis:
- Adhesion Pressure: Calculate from the maximum adhesive force during retraction, divided by the contact area between the bead and surface [14].
- Viscoelastic Parameters: Fit the indentation-versus-time data from the "hold" period to a viscoelastic model (e.g., the Voigt Standard Linear Solid model) to extract parameters such as the instantaneous elastic modulus (E₀), delayed elastic modulus (E₁), and viscosity (η) [14].
Table 2: Standardized MBFS Conditions for Reproducible Quantitation
| Parameter | Standardized Condition | Rationale |
|---|---|---|
| Loading Force | 500 pN | Ensures sufficient contact without damaging cells. |
| Contact Time | 1-2 seconds | Allows for molecular rearrangements and bond formation. |
| Retraction Speed | 1 µm/s | Balances measurement stability and detection of short-lived interactions. |
| Liquid Environment | Buffered Solution (e.g., PBS) | Maintains physiological ionic strength and pH. |
The Scientist's Toolkit: Essential Research Reagents & Materials
Table 3: Key Reagents and Materials for AFM-based Biofilm Research
| Item | Function/Application | Example/Notes |
|---|---|---|
| PFOTS-Treated Glass | Hydrophobic substratum for studying initial bacterial attachment [1]. | Alters surface energy, promoting specific attachment patterns. |
| Synthetic Cystic Fibrosis Sputum Medium (SCFM2) | Physiologically relevant growth medium for clinical isolate studies [16]. | Induces formation of suspended aggregates with high mechanical resilience. |
| Tipless AFM Cantilevers | Base probes for functionalization with microbeads or cells for force spectroscopy [14]. | Enables customized probe geometry for quantifiable contact areas. |
| Glass Microbeads (50 µm) | Spherical probes for Microbead Force Spectroscopy (MBFS) [14]. | Provides a defined contact area for absolute quantitation of adhesion pressure. |
| Closed-Loop AFM System | Instrumentation for accurate force and position measurement without drift [14]. | Critical for reliable long-term experiments and precise indentation measurements. |
Data Presentation & Analysis
AFM in fluid generates rich, quantitative data on the structural and mechanical properties of biofilms. The following table compiles key findings from recent studies, highlighting the quantitative differences observable under physiologically relevant conditions.
Table 4: Quantitative AFM Data on Biofilm Properties under Physiological Conditions
| Biofilm System | Measured Property | Quantitative Finding | Significance |
|---|---|---|---|
| P. aeruginosa PAO1 (Early Biofilm) | Adhesive Pressure [14] | 34 ± 15 Pa | Provides a baseline for the strength of initial surface attachment. |
| P. aeruginosa PAO1 (Mature Biofilm) | Adhesive Pressure [14] | 19 ± 7 Pa | Suggests adhesive properties evolve during biofilm maturation. |
| P. aeruginosa wapR Mutant (Early Biofilm) | Adhesive Pressure [14] | 332 ± 47 Pa | Demonstrates that genetic alterations (LPS deficiency) drastically increase adhesion. |
| P. aeruginosa wapR Mutant (Mature Biofilm) | Adhesive Pressure [14] | 80 ± 22 Pa | Highlights that genetic background and maturation stage interact to determine physical properties. |
| P. aeruginosa Aggregates in SCFM2 | Mechanical Resilience | Increased resistance to deformation vs. planktonic cells [16]. | Shows that environmental cues alone can enhance mechanical robustness, independent of mature matrix. |
| Pantoea sp. YR343 | Cellular Dimensions | ~2 µm length, ~1 µm diameter [1] | High-resolution AFM allows for precise morphological characterization of surface-attached cells. |
| Pantoea sp. YR343 | Flagellar Dimensions | ~20-50 nm height [1] | Visualizes subcellular structures critical for attachment and motility, which are obscured in non-fluid imaging. |
Workflow and Pathway Visualizations
Diagram 1: Experimental AFM Workflow for Biofilm Analysis
Diagram 2: How Fluid Environments Dictate Biofilm Phenotype
Atomic Force Microscopy of Biofilms—Imaging, Interactions, and Mechanics
Atomic force microscopy (AFM) has proven itself to be a powerful and diverse tool for the study of microbial systems on both single and multicellular scales, including complex biofilms [17]. This chapter will review how AFM and its derivatives have been used to unravel the nanoscale forces governing the structure and behavior of biofilms, thus providing unique insight into the control of microbial populations within clinical and industrial environments [17]. Diversification of AFM-based technologies has allowed for the creation of a truly multiparametric platform, enabling the interrogation of all aspects of microbial systems [17]. Advances in traditional AFM operation have allowed, for the first time, insight into the topographical landscape of both microbial cells and spores, which, when combined with high-speed AFM's ability to resolve the structure of surface macromolecules, have provided, with unparalleled detail, visualization of this complex environmental interface [17]. The application of AFM force spectroscopies has enabled the analysis of many microbial nanomechanical properties including macromolecule folding pathways, receptor ligand binding events, microbial adhesion forces, biofilm mechanical properties, and antimicrobial/antibiofilm affectivities [17]. Thus, AFM has offered an outstanding glimpse into the biofilm, how its inhabitants create and use this complex adaptive interface, and perhaps most importantly what can be done to control this [17].
Biofilms remain a primary concern in industrial and clinical fields [17]. The tendency of planktonic cells to form these structures in moist environments and the resulting increase in resistance to antimicrobials, in combination with an increasing frequency of innate antimicrobial resistance, demonstrates the continued need for novel biofilm control strategies and innovative methods to unravel the fundamental properties of biofilms [17]. Atomic force microscopy (AFM) has proven to be a useful addition to the microscopy family providing imaging and force measurement capabilities that can interrogate the nanoscale properties of surfaces [17]. Indeed, AFM has been used with great success to provide novel insight into the structure of biofilms and the interplay of interaction forces and mechanical properties that govern the behavior of biofilms and their response to chemical and physical attack as part of control strategies [17]. AFM can be used to study whole biofilms or the influence of their component parts, from bacterial surface proteins to extracellular polysaccharides (EPSs) and individual cells [17].
AFM Basic Principles
AFM was first developed as part of the family of scanning probe microscopies in 1986 [17]. It was very quickly applied to the imaging of biological materials, including DNA, bacteria, viruses, and mammalian cells [17]. The components of an atomic force microscope are shown in Figure 1. A very small, sharp tip held at the free end of a cantilever systematically scans a surface of interest to generate a topographical image [17]. The tip is held in intimate contact with the surface, and its apex has a radius of curvature in the range of nanometers, which sets the image resolution [17]. As the tip is systematically scanned across the surface, it encounters surface forces that cause the cantilever to be deflected [17]. The deflection of the cantilever is monitored by the displacement of a reflected laser beam and used to create a topographical image [17]. In contact mode, the forces of the bent cantilever keep the tip in intimate contact with the surface [17].
When imaging a soft sample such as a bacterial cell surface or biofilm, the tapping mode or intermittent contact mode is used [17]. The intermittent contact of this imaging mode reduces the degree of friction or drag on a sample compared with imaging in contact mode [17]. To achieve the intermittent contact, a vibrating cantilever technique is used, and the changes in the vibrational parameters are monitored as the cantilever scans the surface [17]. In response to changes in topography, the piezo-scanner moves up and down to maintain a constant vibration of the cantilever, and the feedback signal is used to produce the image data set [17]. A further advantage of this imaging mode is that measurement of the phase angle between the free oscillation at the end of the cantilever and the imposed driving vibration provides a map of phase angle across a surface; this data, referred to as phase imaging, is captured simultaneously as the standard topographical data [17]. This phase angle is often used to qualitatively distinguish between materials on the surfaces of heterogeneous samples as the phase angle change is a function of the mechanical properties of the surface and the area of contact between the AFM tip and the surface [17].
The advantages of tapping mode have meant that this is the most frequently used method when imaging soft biological samples [17]. The authors have found tapping mode in combination with phase imaging extremely useful in identifying structures on the cells and within biofilm [17]. Figure 2 presents AFM tapping mode images of a range of microbial biofilms [17]. When imaging biofilms, the mechanical robustness of a biofilm should be considered; it is simpler to image model biofilms with minimum components, which have been grown on adhesion-promoting substrates, compared to biofilms that have been sampled from natural or industrial settings that consist of multiple components [17]. As AFM imaging is a technique that relies on surface contact, the imaging of a hydrated diffuse biofilm is very difficult without fixation methods [17].
The AFM can measure the forces of interactions between surfaces, which have obvious implications in the study of biofilms [17]. AFM has been added to the group of instruments that can be used to study microbial interactions involved in biofilm formation [17]. Such instruments include flow chambers, micropipette aspiration, and centrifugation devices [17]. However, AFM has the advantage of allowing the imaging and identification of points of interest on a surface prior to the measurement of the forces of interaction [17]. AFM also allows the direct measurement of forces as opposed to techniques that estimate force from the application of shear to a cell population [17]. In addition, surface forces are measured over very small contact areas, minimizing contamination problems [17]. To generate a force–distance curve, the deflection of the cantilever is recorded as a function of tip‐to‐sample separation, as the piezo‐scanner of the AFM brings the sample and tip together [17]. The deflection of the cantilever is converted to a value of force using Hooke's law [17]. Force–distance curves are characteristic of the system under study [17]. For biofilms, they have features that reflect the chemical and physical properties of the surfaces that are interacting, including the substrate, the cells, EPS, and the AFM probe [17]. Figure 3 shows a typical force measurement between an AFM cell probe (Saccharomyces cerevisiae) and a biofilm surface [17].
Operating the AFM as a nanoindenter allows the measurement of microbial cell and biofilm mechanical properties, which include elastic moduli and turgor pressure [17]. Figure 4 shows how the indentation depth is measured by comparison between force curves measured at a reference hard surface and at the softer sample surface [17]. The indentation depth can then be plotted as a function of applied force and compared with a theoretical framework to quantify sample mechanical properties [17]. The most commonly used theoretical framework is based on the Hertz model, which describes the elastic deformation of two perfectly homogeneous smooth bodies touching under load [17]. The geometry of the system is assumed to consist of an indenter with a parabolic shape and a sample that is of much greater thickness than the indentation depth [17]. The Hertz model that describes force on the cantilever ( F ) as a function of indentation ( \delta ) is given by [17]:
[ F = \frac{4}{3} \frac{E}{1 - \nu^2} \sqrt{R} \delta^{3/2} ]
where the tip is approximated with the radius ( R ), and ( E ) and ( \nu ) are the elastic modulus and Poisson's ratio of the sample, respectively [17].
Imaging
Examination of microbial systems in native, aqueous environments is central to the validity of the data collected [17]. However, AFM imaging in such environments is often difficult due to a number of factors [17]. For instance, microbial cells are often attached to the surface via week Lifshitz‐Van der Waals forces, and as a result are easily disrupted by the scanning of an AFM cantilever, resulting in the destruction of the sample [17]. Additionally, microbial cells are often motile with some recent papers suggesting that motility may even be the largest governing factor in the physiological imaging of microbes [17]. Consequently, immobilization of microbial cells prior to analysis has become imperative to the application of AFM in the imaging of microbial systems [17].
Cell Immobilization for Single‐Cell Analysis
Immobilization of microbial cells has often proven to be the most problematic step in the imaging of microbial samples under aqueous conditions [17]. The immobilization must be secure enough to withstand the lateral forces exerted by the tip during scanning, but benign enough to not force physiochemical, physiological, or nanomechanical changes in the sample [17]. As a result, a number of different techniques have arisen; these protocols can be broadly divided into two categories: mechanical, whereby microbial cells are physically trapped within a porous media, and chemical, whereby chemical treatment of the substrate is used to facilitate binding [17].
Initial studies into the use of mechanical protocols to immobilize microbes utilized agar or membranes with pore diameters similar to the cell diameter of the organism to be captured [17]. Later work expanded upon this through the use of more complex or functionalized surfaces such as lithographically patterned silica [17]. Though, while mechanical entrapment offers immobilization secure enough to alleviate the destructive scanning of the cantilever, the immobilization is sporadic and unpredictable, reducing the reproducibility of the results [17]. Recent work by Formosa et al. developed a protocol in which selective tuning of polydimethylsiloxane (PDMS) stamps were used to immobilize spherical microorganisms of various sizes [17]. The protocol requires the creation of a glass and chromium blank that holds the microstructure, from which the pattern is transferred to a silicon wafer by deep reactive ion etching [17]. The dimensions of the silicon master can be varied with the group reporting dimensions of 1.5–6 µm wide, a pitch of 0.5 µm, and a depth of 1–4 µm, accommodating a variety of target cell sizes [17]. A PDMS stamp is then cast from the silicon wafer master and cells deposited through the use of convective and capillary forces [17]. Further work by the group has shown this immobilization technique to be an effective way to immobilize spherical cells, in this case Staphylococcus aureus, for AFM analysis [17].
A number of chemical fixation methods for the immobilization of microbial cells have been used, including, poly‐l‐lysine, trimethoxysilyl‐propyl‐diethylenetriamine, mica, and carboxyl [17].
Advanced AFM Techniques for Biofilm Research
Large Area Automated AFM
While AFM provides detailed structural and mechanical insights in biology and cell research, its impact on biofilm research has been surprisingly limited [1]. Conventional image analysis methods allow for the measurement of individual cell dimensions, but automated techniques are crucial for efficiently characterizing bacterial biofilms, which can contain up to 1012 cells per gram [1]. AFM's small imaging area (<100 µm), restricted by piezoelectric actuator constraints, limits its capacity to study large, millimeter-scale biofilm structures [1]. This scale mismatch makes it difficult to capture the full spatial complexity of biofilms and raises questions about the representativeness of the collected data [1]. Furthermore, the slow scanning process and labor-intensive operation require specialized operators, hindering the capture of dynamic structural changes over extended time and length scales [1]. Developing automated large-area AFM methods and integrating AFM with other multimodal techniques will significantly advance biofilm research by enabling comprehensive analysis of these complex microbial communities [1].
Machine learning (ML) and artificial intelligence (AI) are transforming AFM by enhancing data acquisition, control, and analysis [1]. ML applications in AFM fall into four key areas: sample region selection, scanning process optimization, data analysis, and virtual AFM simulation [1]. AI-driven models optimize scanning site selection, reducing human intervention and accelerating acquisition [1]. ML can be further used to improve scanning by refining tip–sample interactions, correcting distortions, reducing the time by sparse scanning approaches, and automating probe conditioning for more precise imaging [1]. AI frameworks have also enabled autonomous operation of scanning AFM and direct control of through large language models, not by replacing human operators but by automating routine tasks, optimizing decision-making processes, and enhancing scientific discovery through human–ML collaboration and enabling allowing continuous even multiday experiments without human supervision [1]. In data analysis of AFM, ML, and AL tools are enabling automated segmentation, classification, and defect detection in AFM images, aiding in cancer cell identification and molecular structure prediction [1]. These advancements significantly enhance AFM's efficiency, accuracy, and automation, particularly in biological research and nanomaterials characterization [1].
In this work, we address the challenges of biofilm imaging by AFM through the development of an automated large-area AFM which is capable of analyzing microbial communities over extended surface areas with minimal user intervention [1]. By automating the scanning process, we overcome many limitations of traditional AFMs, including small imaging areas, and enable imaging of the inherent millimeter-sized communities [1]. We evaluate image stitching algorithms for performance with minimal matching features between images [1]. Limited overlap between scans maximizes acquisition speed, producing seamless, high-resolution images that capture the spatial complexity of surface attachment [1]. To manage the high-volume, information-rich data, we implement machine learning-based image segmentation and analysis methods [1]. These tools assist in automating the extraction of important parameters, such as cell count, confluency, cell shape, and orientation, and facilitate efficient and quantitative analysis of microbial community characteristics over extensive areas [1]. We demonstrate the applicability and effectiveness of our methods by imaging the initial surface attachment of Pantoea sp. YR343 [1]. Additionally, we apply large-area AFM to gradient-structured surfaces, allowing us to study how varying surface properties influence attachment dynamics and community structure in a combinatorial approach [1]. By integrating these advancements, our work enhances the capabilities of AFM for biofilm research, enabling comprehensive structural and mechanical characterization of biofilms at scales relevant to their natural environments [1].
High-Resolution AFM Imaging of Microbial Systems
In a study focusing on Pantoea sp. YR343, a gram-negative bacterium isolated from the poplar rhizosphere, surface-attached cells observed after a brief incubation (~30 min) were typically around 2 µm in length and 1 µm in diameter, corresponding to a surface area of ~2 μm², aligning with previous findings [1]. AFM imaging provided structural details not achievable with optical microscopy or other methods, enabling visualization of flagellar structures around the cells, measuring ~20–50 nm in height and extending tens of micrometers across the surface [1]. Some appendages appeared to originate from individual cells, while others seemed to adhere to the surface, possibly from detached cells [1]. The identification of these structures as flagella was confirmed using a flagella-deficient control strain, which showed no similar appendages under AFM [1].
In cells allowed to propagate on the surface for a period of 6–8 h formed clusters with characteristic honeycomb-like gaps [1]. AFM's high-resolution capability allowed clear visualization of individual cells and flagella [1]. In Pantoea sp. YR343, AFM revealed flagellar structures bridging gaps during early cell attachment and development [1]. These detailed visualizations are critical, as appendages like flagella are essential for biofilm development, surface attachment, and motility [1]. Without high-resolution imaging, such structural intricacies would be impossible to observe [1].
AFM as a Surface Mapping Tool in Microorganisms Resistant Toward Antimicrobials
The worldwide emergence of antimicrobial resistance (AMR) in pathogenic microorganisms, including bacteria and viruses due to a plethora of reasons, such as genetic mutation and indiscriminate use of antimicrobials, is a major challenge faced by the healthcare sector today [18]. One of the issues at hand is to effectively screen and isolate resistant strains from sensitive ones [18]. Utilizing the distinct nanomechanical properties (e.g., elasticity, intracellular turgor pressure, and Young's modulus) of microbes can be an intriguing way to achieve this; while atomic force microscopy (AFM), with or without modification of the tips, presents an effective way to investigate such biophysical properties of microbial surfaces or an entire microbial cell [18]. Additionally, advanced AFM instruments, apart from being compatible with aqueous environments—as often is the case for biological samples—can measure the adhesive forces acting between AFM tips/cantilevers (conjugated to bacterium/virion, substrates, and molecules) and target cells/surfaces to develop informative force-distance curves [18]. Moreover, such force spectroscopies provide an idea of the nature of intercellular interactions (e.g., receptor-ligand) or propensity of microbes to aggregate into densely packed layers, that is, the formation of biofilms—a property of resistant strains (e.g., Staphylococcus aureus, Pseudomonas aeruginosa) [18]. This mini-review will revisit the use of single-cell force spectroscopy (SCFS) and single-molecule force spectroscopy (SMFS) that are emerging as powerful additions to the arsenal of researchers in the struggle against resistant microbes, identify their strengths and weakness and, finally, prioritize some future directions for research [18].
Biofilm Cohesiveness Measurement Using a Novel Atomic Force Microscopy Method
Biofilms can be undesirable, as in those covering medical implants, and beneficial, such as when they are used for waste treatment [19]. Because cohesive strength is a primary factor affecting the balance between growth and detachment, its quantification is essential in understanding, predicting, and modeling biofilm development [19]. In this study, we developed a novel atomic force microscopy (AFM) method for reproducibly measuring, in situ, the cohesive energy levels of moist 1-day biofilms [19]. The biofilm was grown from an undefined mixed culture taken from activated sludge [19]. The volume of biofilm displaced and the corresponding frictional energy dissipated were determined as a function of biofilm depth, resulting in the calculation of the cohesive energy [19]. Our results showed that cohesive energy increased with biofilm depth, from 0.10 ± 0.07 nJ/μm³ to 2.05 ± 0.62 nJ/μm³ [19]. This observation was reproducible, with four different biofilms showing the same behavior [19]. Cohesive energy also increased from 0.10 ± 0.07 nJ/μm³ to 1.98 ± 0.34 nJ/μm³ when calcium (10 mM) was added to the reactor during biofilm cultivation [19]. These results agree with previous reports on calcium increasing the cohesiveness of biofilms [19]. This AFM-based technique can be performed with available off-the-shelf instrumentation [19]. It could therefore be widely used to examine biofilm cohesion under a variety of conditions [19].
It is essential to understand biofilm stability to both encourage biofilm maintenance in some applications, such as waste treatment, and effectively remove undesired biofilm in others, as in biofilms covering medical implants [19]. Biofilm detachment is one of the critical factors that balance growth and plays a role in the development of biofilm spatial heterogeneity [19]. While factors responsible for biofilm growth are well studied, those controlling the detachment process are not clearly understood [19]. As a consequence, a good understanding of the relationships between operating conditions and biofilm cohesion is lacking [19]. The cohesive strength of the biofilm is influenced by extracellular polymeric substances (EPS) and specific compounds, such as calcium, which fill the space between microbial cells and bind cells together [19]. Understanding the cohesive interactions in the biofilm matrix under a variety of conditions could lead to the design of new strategies for controlling biofilm development based on disrupting or protecting the matrix holding the biofilm together [19].
Because cohesive strength is a primary factor affecting biofilm sloughing, its quantification is essential in understanding detachment [19]. A few methods based on the use of custom devices have been proposed to investigate biofilm cohesive strength [19]. Poppele and Hozalski measured the tensile strength levels of biofilms from activated sludge by using a micromechanical device based on the deflection of a glass micropipette separating a microbial aggregate held by suction [19]. Körstgens et al. used a uniaxial compression measurement device to determine the yield strength levels and the apparent moduli of elasticity of Pseudomonas aeruginosa biofilms [19]. Ohashi and Harada used rotation and collision devices and found that the shear strength levels of denitrifying biofilms were higher than the tensile strength levels by 2 orders of magnitude [19]. In addition, Ohashi et al., by assuming that a biofilm behaves as an elastic material, found a correlation between the elastic coefficient and tensile strength [19]. Not surprisingly, data reported on biofilm strength measured under different types of deformation using custom devices are different and inherently difficult to compare [19].
In the past few years, atomic force microscopy (AFM) has been used to image film morphologies and probe surface properties, such as ligand and receptor interactions and viscoelasticity [19]. AFM provides three-dimensional images of a surface ultrastructure with molecular or near-molecular resolution under physiological conditions and with minimal sample preparation [19]. Benoit et al. attached a single microbial cell to an AFM cantilever and measured cell-cell interactions at a molecular level [19]. Emerson and Camesano investigated pathogenic microbial adhesion to biomaterials by measuring the local interaction forces between an immobilized cell and both biomaterial and biofilm surfaces [19]. Cell surface hydrophobicity and charge have also been investigated using chemically functionalized AFM probes [19]. All of these studies and measurements provide important information on single-cell properties; nevertheless, they do not provide information on the properties of whole biofilms [19].
Because of the difficulties associated with working with biofilms, particularly their softness and gelatinous nature, most biofilms imaged by AFM have been dried first [19]. Drying is expected to significantly change the strength and overall character of a biofilm; therefore, measurements made on dry biofilm must be interpreted and applied carefully [19]. A few AFM studies have investigated biofilm properties, such as interaction and attachment to surfaces under aqueous conditions [19]. Yet, there is a real need to expand this work to study additional properties of whole biofilms under aqueous conditions [19].
AFM also has been extensively employed to image and gauge the frictional properties of organic and polymeric surfaces [19]. The frictional response is well known to have a large contribution from the viscous character of the material being imaged [19]. Some investigators have examined response functions by characterizing friction and/or wear under repeated scanning with variable loads, providing information on the viscoelastic and viscoplastic properties of a material [19].
To our knowledge, concomitant friction and wear processes on biofilms, important for understanding shear-induced detachment, have not been investigated [19]. In this paper, we develop an AFM method for reproducibly measuring, in situ, frictional-energy dissipation on moist biofilms during abrasion via a raster-scanned tip under an elevated load [19]. Also, we quantify the volume of detached biofilm via before/after topographic image comparisons [19]. We use this methodology to reproducibly determine the cohesion, or cohesive energy level, of a volume of moist biofilm (nJ/μm³) [19]. Besides reproducibility and simplicity, this method also has the nanoscale level capability of being able to measure in situ cell/EPS and EPS/EPS interactions within a well-defined volume of biofilm [19].
Quantitative Data Tables
Table 1: AFM-Measured Nanomechanical Properties of Biofilm Components
| Biofilm Component | Elastic Modulus (MPa) | Adhesion Force (nN) | Cohesive Energy (nJ/μm³) | Key Experimental Conditions |
|---|---|---|---|---|
| Young Biofilm (1-day) | N/A | N/A | 0.10 ± 0.07 to 2.05 ± 0.62 | Depth-dependent measurement in moist conditions [19] |
| Biofilm with Calcium | N/A | N/A | 0.10 ± 0.07 to 1.98 ± 0.34 | With 10 mM CaCl₂ addition [19] |
| Microbial Cells | Variable by species | 0.1 - 10 | N/A | Measured via single-cell force spectroscopy [18] |
| EPS Matrix | 0.1 - 100 | 5 - 50 | N/A | Highly dependent on composition and hydration [17] |
Table 2: AFM Imaging Parameters for Biofilm Characterization
| Imaging Mode | Resolution | Optimal Conditions | Applications in Biofilm Research | Limitations |
|---|---|---|---|---|
| Contact Mode | 1-10 nm | Hard, dry samples | High-resolution topology mapping | High lateral forces can damage soft samples [17] |
| Tapping Mode | 1-10 nm | Soft, hydrated samples | Imaging live cells and delicate biofilm structures | Reduced scanning speed [17] |
| Force Spectroscopy | Molecular level | Physiological conditions | Adhesion forces, receptor-ligand interactions, nanomechanics | Point-by-point measurement [17] [18] |
| Large Area Automated AFM | Subcellular level | Machine learning integration | Millimeter-scale biofilm organization | Requires advanced instrumentation [1] |
Experimental Protocols
Protocol 1: Biofilm Preparation and AFM Imaging in Physiological Conditions
Materials Required:
- Membrane-aerated biofilm reactor
- Activated sludge inoculum
- Polyolefin flat sheet membrane (0.1-μm mean pore diameter)
- AFM with humidity control chamber (e.g., PicoSPM)
- V-shaped cantilevers with pyramidal Si₃N₄ tips (spring constant 0.58 N/m)
Procedure:
- Inoculate a 10-liter completely mixed reactor with activated sludge containing diverse bacterial community [19]
- Maintain bulk reactor conditions at 147 ± 37 mg/liter chemical oxygen demand and 28 ± 8 mg/liter ammonia nitrogen [19]
- Submerge membrane test modules in reactor for 1-day biofilm growth [19]
- Remove membrane modules and cut 1 × 1 cm pieces with attached biofilm [19]
- Equilibrate samples in saturated NaCl solution (∼90% humidity) for 1 hour [19]
- Mount samples in AFM humidity chamber controlled at 90% humidity [19]
- Collect non-perturbative topographic images at low applied load (∼0 nN) [19]
- For abrasion studies: zoom into 2.5 × 2.5-μm subregion and abrade under repeated raster scanning at elevated load (40 nN) [19]
Protocol 2: Single-Cell Force Spectroscopy for Antimicrobial Resistance Studies
Materials Required:
- Functionalized AFM cantilevers
- Microbial cell cultures (sensitive and resistant strains)
- Appropriate growth media
- AFM with force spectroscopy capability
- Cell immobilization substrates (e.g., PDMS stamps, poly-l-lysine coated surfaces)
Procedure:
- Immobilize microbial cells using mechanical entrapment or chemical fixation methods [17]
- Functionalize AFM cantilevers with appropriate ligands or cells [18]
- Approach cantilever to surface at controlled velocity (0.5-1 μm/s)
- Record force-distance curves at multiple locations
- Analyze adhesion forces, rupture events, and mechanical properties
- Compare nanomechanical signatures between sensitive and resistant strains [18]
- Perform statistical analysis on multiple cells (typically n > 50)
Protocol 3: Large Area Automated AFM with Machine Learning Integration
Materials Required:
- Automated AFM system with large scan range
- Machine learning software for image analysis
- Biofilm samples on appropriate substrates
- Computational resources for data processing
Procedure:
- Grow biofilms on selected surfaces (e.g., PFOTS-treated glass) [1]
- Implement automated scanning protocol with minimal overlap between images [1]
- Use ML algorithms for seamless image stitching [1]
- Apply automated segmentation for cell detection and classification [1]
- Extract parameters: cell count, confluency, cell shape, and orientation [1]
- Analyze spatial heterogeneity and cellular morphology over millimeter-scale areas [1]
Visualization Diagrams
Diagram 1: AFM Workflow for Biofilm Mechanical Characterization
Diagram 2: Biofilm Resistance Mechanisms Accessible by AFM
Research Reagent Solutions
Table 3: Essential Materials for AFM Biofilm Research
| Reagent/Material | Function | Application Notes |
|---|---|---|
| Polydimethylsiloxane (PDMS) Stamps | Cell immobilization | Customizable pore sizes (1.5-6 µm) for mechanical entrapment [17] |
| Poly-l-lysine Coated Surfaces | Chemical immobilization | Provides charged surface for cell attachment [17] |
| Functionalized AFM Cantilevers | Force spectroscopy | Tips modified with specific ligands or cells [18] |
| Si₃N₄ Tips (Pyramidal) | Standard imaging | 0.58 N/m spring constant for biofilm studies [19] |
| Calcium Chloride (10 mM) | Cohesion modulation | Increases biofilm cohesive energy [19] |
| PFOTS-treated Glass | Adhesion substrates | Promotes bacterial attachment for early biofilm studies [1] |
| Humidity Control System | Environmental control | Maintains 90% humidity for hydrated biofilm measurement [19] |
AFM has proven itself to be a powerful and diverse tool for the study of microbial systems on both single and multicellular scales including complex biofilms [17]. This chapter has reviewed how AFM and its derivatives have been used to unravel the nanoscale forces governing the structure and behavior of biofilms, thus providing unique insight into the control of microbial populations within clinical and industrial environments [17]. Diversification of AFM-based technologies has allowed for the creation of a truly multiparametric platform, enabling the interrogation of all aspects of microbial systems [17]. Advances in traditional AFM operation have allowed, for the first time, insight into the topographical landscape of both microbial cells and spores, which, when combined with high-speed AFM's ability to resolve the structure of surface macromolecules, have provided, with unparalleled detail, visualization of this complex environmental interface [17]. The application of AFM force spectroscopies has enabled the analysis of many microbial nanomechanical properties including macromolecule folding pathways, receptor ligand binding events, microbial adhesion forces, biofilm mechanical properties, and antimicrobial/antibiofilm affectivities [17]. Thus, AFM has offered an outstanding glimpse into the biofilm, how its inhabitants create and use this complex adaptive interface, and perhaps most importantly what can be done to control this [17]. The continued development of automated large-area AFM approaches combined with machine learning analysis promises to further enhance our understanding of biofilm organization and resistance mechanisms at scales relevant to their natural environments [1].
A Practical Guide to Fluid AFM: From Setup to Anti-Biofilm Agent Evaluation
Atomic Force Microscopy (AFM) enables the high-resolution structural and functional characterization of biofilms under native, physiological conditions, a capability critical for understanding their development, resilience, and response to treatments [1]. Performing these investigations in a liquid environment is paramount to maintaining biofilm viability, minimizing disruptive surface forces on delicate samples, and generating biologically relevant data [20] [21]. The configuration of the AFM liquid cell—encompassing the probe, imaging media, and environmental controls—is a foundational step that directly determines the success of the experiment. This application note provides detailed protocols for configuring the liquid cell for AFM-based biofilm research, framed within the context of advanced studies investigating biofilm assembly and nanomechanical properties.
The Scientist's Toolkit: Essential Research Reagents and Materials
The following table catalogues the key materials required for preparing and conducting AFM experiments on biofilms in liquid.
Table 1: Essential Research Reagent Solutions for AFM Biofilm Studies
| Item | Function/Application | Specific Examples & Notes |
|---|---|---|
| AFM Probes | High-resolution imaging and force spectroscopy in liquid. | Small cantilevers (e.g., USC-F1.5-k0.6) for high-frequency measurements; PPP-CONTPt for mechanical mapping [22] [21]. |
| Fluid Cantilever Holder | Enables laser reflection and scanner protection in liquid. | BioScope Resolve Fluid Holder; Electrochemical Cell (ECCell) for specialized setups [20] [21]. |
| Substrates | Surface for biofilm growth and adhesion during AFM. | PFOTS-treated glass; indium-tin-oxide (ITO)-coated glass for superior cell adhesion in liquid [1] [21]. |
| Culture Media | Provides physiological conditions for hydrated, living biofilms. | Phosphate Buffer Saline (PBS); specific liquid growth medium tailored to the bacterial strain (e.g., for Pantoea sp.) [1] [9]. |
| Biofilm Samples | Model systems for investigation. | Pantoea sp. YR343; Rhodococcus wratislaviensis; biofilms grown on functionalized beads [1] [9] [21]. |
Quantitative Configuration Parameters for AFM Liquid Cells
Optimal AFM performance in liquid is achieved by carefully balancing a set of quantitative parameters. The following table summarizes critical settings for different experimental modalities.
Table 2: Quantitative AFM Configuration Parameters for Biofilm Research in Liquid
| Parameter | Typical Range/Specification | Experimental Context & Impact |
|---|---|---|
| Cantilever Stiffness | 0.1 - 0.6 N/m | Softer cantilevers (≈0.3 N/m) are used for high-resolution imaging and force spectroscopy on soft biological samples to minimize sample damage [21] [23]. |
| Imaging Force | < 1 nN | A low setpoint force is critical for non-destructive imaging, preserving native biofilm structure and avoiding cell displacement [21]. |
| Indentation Speed | 17 - 175 mN/s | Used in force mapping modes (e.g., Quantitative Imaging) to derive nanomechanical properties from approach curves [21]. |
| Shear Amplitude | < 7 nm | Applied in nanorheology measurements to probe local viscoelasticity without disrupting the biofilm matrix [22]. |
| Shear Frequency | 1 kHz - 50 kHz | Higher frequencies (e.g., 50 kHz) are necessary to measure the viscous response of fluid membranes and biofilm components [22]. |
| Temperature Control | 24.0 ± 0.2 °C | Precise temperature regulation is essential for maintaining biofilm viability and consistency in nanomechanical measurements [22] [21]. |
Experimental Protocols for Key AFM Biofilm Investigations
Protocol: Large-Area AFM Imaging of Early Biofilm Assembly
This protocol, adapted from Millan-Solsona et al., is designed to capture the spatial heterogeneity of nascent biofilms over millimeter scales [1].
1. Substrate Preparation: - Clean glass coverslips via oxygen plasma or UV-ozone treatment. - Functionalize the coverslips with PFOTS (Perfluorooctyltrichlorosilane) to create a hydrophobic surface that promotes specific bacterial adhesion. - Sterilize the PFOTS-treated coverslips under UV light for 30 minutes before use.
2. Biofilm Growth and Sample Loading: - Inoculate a petri dish containing the prepared coverslips with a liquid culture of the target bacterium (e.g., Pantoea sp. YR343). - Incubate for the desired initial attachment period (e.g., 30 minutes). - Gently rinse the coverslip with sterile buffer to remove non-adherent planktonic cells. - For fixed-timepoint imaging, air-dry the sample briefly before mounting. For live imaging, keep the sample hydrated. - Mount the coverslip onto the AFM metal sample puck using a small amount of double-sided adhesive. - Carefully place the puck onto the AFM scanner.
3. Liquid Cell Assembly and Probe Selection: - Install the fluid cantilever holder onto the AFM head. - Select a sharp, non-contact silicon nitride cantilever with a nominal spring constant of ~0.3 N/m. - Load the cantilever into the holder and align the laser spot to the cantilever's end. - Pipette an appropriate physiological buffer or culture medium into the liquid cell, ensuring the cantilever and sample are fully immersed without introducing air bubbles.
4. Automated Large-Area Scanning: - Engage the AFM in a gentle imaging mode (e.g., AC mode in liquid or Quantitative Imaging mode). - Define a large-area grid (up to millimeter-scale) through the AFM software. - Initiate the automated scanning sequence. The system will acquire multiple contiguous high-resolution images. - Use integrated machine learning algorithms for seamless stitching of individual tiles and subsequent automated cell detection, classification, and morphological analysis [1].
Protocol: Nanomechanical Mapping of Living Biofilms in Liquid
This protocol details the procedure for generating spatially resolved maps of the mechanical properties of a biofilm in its native state [21] [23].
1. Sample Preparation without Immobilization: - Use ITO-coated glass substrates to promote strong, natural bacterial adhesion without chemical fixation or mechanical entrapment [21]. - Pipette a volume of bacterial culture in its exponential growth phase directly onto the ITO substrate. - Allow the cells to settle and adhere for a predetermined time (e.g., 10-30 minutes) within the AFM liquid cell.
2. AFM Setup for Force Mapping: - Install the fluid cell and select a cantilever suitable for force spectroscopy (e.g., PPP-CONTPt, k ≈ 0.3 N/m). - Align the laser and calibrate the cantilever's sensitivity in liquid. - Determine the cantilever's spring constant using the thermal tune method.
3. Quantitative Imaging (QI) Data Acquisition: - Operate the AFM in a force mapping mode such as QI mode, which rapidly acquires a force-distance curve at every pixel of the image. - Set the imaging parameters: typically a 64x64 or 128x128 pixel resolution, with a z-length of 600 nm and a tip velocity of 125 µm/s [21]. - Engage on a region of interest and start the mapping process. The system will record the approach and retract curves for each pixel.
4. Data Analysis for Young's Modulus: - Use the AFM software or custom scripts (e.g., in Matlab or OriginPro) to analyze the force-indentation curves. - For each curve, fit the repulsive contact region with an appropriate contact mechanics model, such as the Sneddon model for a conical indenter: ( F = (2/\pi) * (E/(1-ν^2)) * δ^2 * tan(α) ) where E is the Young's modulus, ν is the Poisson's ratio (assumed to be 0.5 for soft biological materials), δ is the indentation depth, and α is the half-opening angle of the tip [21]. - Generate a spatial map where the color of each pixel corresponds to the calculated Young's modulus value, revealing the mechanical heterogeneity of the biofilm.
Workflow Visualization and System Configuration
The following diagrams illustrate the core experimental workflow and the physical configuration of the AFM liquid cell for biofilm research.
Diagram 1: AFM Biofilm Experiment Workflow. This chart outlines the sequential steps from substrate preparation to data analysis.
Diagram 2: AFM Liquid Cell Configuration. This schematic shows the key components of an AFM operating in a liquid environment, highlighting the probe, sample, and fluid medium interaction.
The precise configuration of the AFM liquid cell is a critical determinant for obtaining meaningful data from biofilm studies under physiological conditions. The selection of appropriate probes, the use of optimal substrates for cell adhesion, and the maintenance of a controlled liquid environment together enable researchers to push the boundaries of biofilm research. By implementing the detailed protocols and configurations outlined in this application note—from large-area structural analysis to nanomechanical property mapping—scientists can reliably investigate the complex architecture and material properties of biofilms, thereby accelerating the development of novel anti-biofilm strategies in drug development and related fields.
Atomic Force Microscopy (AFM) has emerged as a powerful tool for quantifying the nanomechanical properties of live biofilms under physiological conditions. Unlike traditional methods that often require sample dehydration or fixation, AFM enables researchers to probe biofilm elasticity, adhesion, and cohesive strength in their native, hydrated state [17] [24]. This capability provides critical insights into biofilm mechanics that correlate with their functional behavior, including antibiotic resistance, virulence, and environmental persistence.
The application of AFM to live biofilms requires specialized methodologies to maintain biofilm viability while obtaining quantitative mechanical data. This document outlines standardized protocols for preparing, imaging, and mechanically characterizing biofilms using AFM in fluid conditions, providing researchers with reproducible methods for assessing key nanomechanical parameters relevant to biofilm development and control strategies.
Key Research Reagent Solutions
Table 1: Essential materials and reagents for AFM-based nanomechanical analysis of biofilms.
| Item | Function/Application | Examples/Specifications |
|---|---|---|
| AFM Cantilevers | Force application and detection | Soft cantilevers (0.01-0.6 N/m spring constant); Colloidal probes for cohesive measurements; Sharp tips (0.01-0.1 N/m) for single-cell analysis [25] [19] [26]. |
| Biofilm Immobilization Substrates | Secure attachment for scanning | Functionalized glass/silica; Mica; Polydimethylsiloxane (PDMS) micro-wells; Membrane filters [17]. |
| Liquid Cell | Maintain physiological conditions | Sealed fluid cell compatible with buffer/media exchange [24]. |
| Calibration Standards | Cantilever spring constant calibration | Reference cantilevers; Polystyrene beads; Clean glass slide [19]. |
| Chemical Functionalization | Probe modification | Linker molecules (PEG); Biomolecules for specific interactions; Chemical groups [25]. |
AFM Operational Modes for Nanomechanical Mapping
Force Spectroscopy and Force Volume Mapping
Force spectroscopy forms the foundation for quantifying biofilm nanomechanical properties. In this mode, force-distance (FD) curves are generated by approaching the AFM tip to the biofilm surface until contact, applying a defined force, and then retracting the tip [25] [17]. Thousands of FD curves collected in an array create a force-volume map, generating a 3D mechanical profile of the biofilm surface where each pixel contains full force-distance data [25]. This method provides simultaneous information on adhesion forces (from retraction curves) and elastic properties (from approach curves), enabling correlation of mechanical heterogeneity with structural features in living biofilms.
Microbead Force Spectroscopy
Microbead force spectroscopy utilizes AFM cantilevers functionalized with microbeads of defined composition and size, creating a standardized contact geometry for quantitative measurements [26]. This approach enables accurate quantification of adhesive pressure (force per unit area) and viscoelastic parameters over a defined contact area, minimizing variability resulting from irregular tip geometries. The method has demonstrated sensitivity to genetic modifications, revealing significantly different adhesive pressures between wild-type Pseudomonas aeruginosa PAO1 (34 ± 15 Pa) and an isogenic lipopolysaccharide mutant wapR biofilm (332 ± 47 Pa) in early biofilms [26].
Experimental Protocols
Biofilm Preparation and Immobilization
Principle: Proper immobilization is critical for AFM analysis of live biofilms. The biofilm must be securely attached to withstand lateral scanning forces while maintaining native structure and viability [17].
Procedure:
- Substrate Preparation: Use freshly cleaved mica or glass coverslips (2×2 cm) as adhesion-promoting substrates [27] [17]. Clean with 0.2% detergent solution, rinse thoroughly with distilled water, and sterilize by autoclaving or UV exposure.
- Biofilm Growth: Inoculate sterile growth medium (e.g., Tryptic Soy Broth for S. epidermidis) with bacterial culture [27]. Incubate substrates in bacterial suspension for desired biofilm development time (typically 18-24 hours) at appropriate temperature (e.g., 37°C for human pathogens) with mild agitation (130 rpm).
- Sample Mounting: Carefully retrieve biofilm-coated substrate using sterile forceps. Gently rinse with appropriate buffer (e.g., PBS or minimal medium) to remove non-adherent planktonic cells [1] [28]. Mount substrate on AFM steel puck using double-sided adhesive tape.
- Hydration Maintenance: Immediately transfer mounted sample to AFM liquid cell and add appropriate buffer or growth medium to fully submerge biofilm during analysis [24].
Cantilever Selection and Calibration
Principle: Accurate force quantification requires precisely calibrated cantilevers with appropriate stiffness for soft biological samples [25] [19].
Procedure:
- Cantilever Selection: Choose soft cantilevers with spring constants of 0.01-0.1 N/m for high force sensitivity in the piconewton range suitable for molecular-level interactions [25]. For larger-scale cohesion measurements, cantilevers with higher spring constants (e.g., 0.58 N/m) may be appropriate [19].
- Spring Constant Calibration: Perform thermal tuning method or contact-based calibration on clean reference surface prior to biofilm measurements. Verify sensitivity by measuring cantilever deflection on hard, non-deformable surface (e.g., clean glass slide).
- Functionalization (Optional): For specific adhesion measurements, functionalize cantilever tips with chemical groups, biomolecules, or microbeads using appropriate conjugation chemistry [25] [26]. For cell probe applications, attach a single bacterial cell to the cantilever using bioadhesive [25].
Quantitative Elasticity Mapping
Principle: The elastic (Young's) modulus of biofilms is determined by analyzing the indentation depth of the AFM tip into the biofilm surface at applied forces, typically using Hertz contact mechanics model [17] [28].
Procedure:
- AFM Setup: Operate AFM in force spectroscopy mode with calibrated cantilever. Set approach/retraction velocity to 0.5-1 μm/s and maximum applied force to 0.5-5 nN to avoid biofilm damage [17].
- Data Acquisition: Program a grid pattern (e.g., 16×16 or 32×32 points) over the region of interest (typically 5×5 μm to 50×50 μm). Collect force-distance curves at each point with sufficient sampling (≥1024 data points per curve).
- Data Analysis:
- Fit the contact portion of the approach curve to the Hertz model: [ F = \frac{4}{3} \cdot \frac{E}{1-\nu^2} \cdot \sqrt{R} \cdot \delta^{3/2} ] where F is applied force, E is Young's modulus, ν is Poisson ratio (typically assumed 0.5 for biofilms), R is tip radius, and δ is indentation depth [17].
- Generate elasticity map by calculating E at each grid point.
- Segment elasticity ranges corresponding to different biofilm components (cells vs. EPS matrix).
Adhesion Force Quantification
Principle: Adhesion forces are measured from the retraction portion of force-distance curves, where "pull-off" events indicate molecular binding between tip and biofilm surface [25] [28].
Procedure:
- Measurement Parameters: Set contact time between tip and biofilm to 0-1 seconds before retraction to probe transient adhesion [28]. Use constant velocity or force clamp retraction schemes [25].
- Data Collection: Collect multiple force curves (≥1000) across biofilm surface to account for heterogeneity.
- Data Analysis:
- Identify adhesion force as the maximum force required to separate tip from biofilm surface during retraction.
- For single-molecule force spectroscopy, analyze sawtooth patterns indicating sequential unbinding of molecular domains [25].
- Calculate adhesive pressure by dividing adhesion force by contact area (particularly for microbead force spectroscopy) [26].
Cohesive Energy Measurement
Principle: Biofilm cohesive strength is quantified by measuring the energy required to displace biofilm material via AFM tip abrasion under controlled conditions [19].
Procedure:
- Topographic Imaging: First, acquire non-perturbative topographic image of biofilm region (e.g., 5×5 μm) at low applied load (~0 nN).
- Abrasion Phase: Zoom to smaller region (e.g., 2.5×2.5 μm) within originally scanned area. Perform repeated raster scanning (4 scans) at elevated load (40 nN) to induce controlled abrasion.
- Post-Abrasion Imaging: Return to low load and re-image the original larger region (5×5 μm) to quantify volume of displaced biofilm.
- Calculation:
- Calculate displaced biofilm volume from height differences between pre- and post-abrasion images.
- Determine frictional energy dissipated during abrasion from friction force data.
- Compute cohesive energy (γ) as: γ = Efriction / Vdisplaced, where Efriction is frictional energy and Vdisplaced is displaced volume [19]. Reported values typically range from 0.10 ± 0.07 nJ/μm³ at the surface to 2.05 ± 0.62 nJ/μm³ in deeper regions [19].
Data Analysis and Interpretation
Quantitative Parameters for Biofilm Nanomechanics
Table 2: Key nanomechanical parameters quantifiable by AFM for live biofilms.
| Parameter | Description | Typical Values in Biofilms | Biological Significance |
|---|---|---|---|
| Young's Modulus (Elasticity) | Resistance to reversible deformation | 0.1-100 kPa (species and condition dependent) | Structural integrity, protection from mechanical stress [17] |
| Adhesion Force | Force required to separate tip from biofilm | 0.05-10 nN (depending on contact time and molecules) | Initial attachment strength, cell-surface interactions [25] [28] |
| Adhesive Pressure | Adhesion force per unit area | 19-332 Pa (P. aeruginosa strains) [26] | Standardized adhesion measurement for comparisons |
| Cohesive Energy | Energy required to displace unit volume of biofilm | 0.10-2.05 nJ/μm³ (increasing with depth) [19] | Internal strength, resistance to detachment |
| Viscosity | Resistance to flow under deformation | Variable (model-dependent) | Time-dependent mechanical response [26] |
Factors Influencing Nanomechanical Measurements
Multiple experimental parameters significantly affect quantitative AFM measurements of biofilms:
- Contact Time: Adhesion forces increase with contact time due to bond maturation, following the relationship: F(t) = F0 + (F∞ - F0)exp(-t/τk), where F0 is initial adhesion force, F∞ is plateau force, and τk is characteristic time constant [28].
- Environmental Conditions: Ionic strength, pH, and temperature of imaging buffer significantly influence measured forces [28] [24].
- Loading Rate: Rupture forces in single molecule experiments depend on the rate of force application [25].
- Hydration State: Measurements must be performed under fully hydrated conditions to maintain native biofilm mechanical properties [19] [24].
Workflow Visualization
Experimental Workflow for Biofilm Nanomechanics
The AFM protocols outlined herein provide standardized methodologies for quantifying nanomechanical properties of live biofilms under physiological conditions. The integration of force spectroscopy, elasticity mapping, and cohesive energy measurements enables comprehensive characterization of biofilm mechanical heterogeneity, offering insights crucial for understanding biofilm resilience and developing targeted control strategies. As AFM technology continues to advance with automation and machine learning integration [1], these foundational protocols will support increasingly precise and high-throughput analysis of biofilm nanomechanics in diverse research and clinical contexts.
Atomic Force Microscopy (AFM) operated in fluid under physiological conditions has emerged as a powerful tool for biofilm research, enabling the direct, real-time observation of biofilm structure and its disruption by antimicrobial agents at the nanoscale. Biofilms, which are structured communities of microbial cells encased in a self-produced extracellular polymeric substance (EPS), demonstrate remarkable resistance to conventional treatments, contributing to approximately 65-80% of microbial infections and chronic human diseases [29] [30]. This resistance is multifactorial, arising from physical barrier function of the EPS, metabolic dormancy within subpopulations, and enhanced efflux pump activity [30] [6]. Traditional endpoint assays like crystal violet staining or colony-forming unit (CFU) counts provide limited temporal resolution and lack the spatial resolution to observe dynamic interactions at the cellular level [6].
The integration of AFM with fluid cells that maintain physiological conditions (pH, temperature, ionic strength) allows researchers to overcome these limitations. Recent advancements, particularly the development of automated large-area AFM, have transformed the capability of this technology from imaging isolated nanoscale features to capturing broader architectural context by stitching multiple high-resolution images over millimeter-scale areas [1] [31]. When complemented by machine learning algorithms for image analysis, this approach enables quantitative mapping of biofilm morphological changes during treatment interventions, providing unprecedented insights into the kinetics of biofilm disruption [1] [32]. This Application Note details protocols for utilizing AFM under physiological conditions to visualize in real time the effects of enzymes, antibiotics, and nanoparticles on established biofilms, providing researchers with methodologies to quantitatively assess anti-biofilm strategies.
Experimental Design and Workflow
Core Principles of AFM for Biofilm Monitoring
Conventional AFM imaging of biofaces several challenges, including small scan areas (typically <100 μm) that may not represent heterogeneous biofilm architecture, and the labor-intensive nature of imaging which limits throughput [1]. The following workflow incorporates recent technological advancements to address these limitations:
Table 1: Key Advancements in AFM for Biofilm Research
| Technology | Description | Benefit for Biofilm Studies |
|---|---|---|
| Automated Large-Area AFM | Automated collection and stitching of multiple high-resolution images across millimeter-scale areas [1] [31] | Captures biofilm heterogeneity; links cellular-scale events to community organization |
| Machine Learning Integration | AI-driven cell detection, classification, and morphological analysis from AFM data [1] | Enables high-throughput quantification of parameters (cell count, orientation, confluency) from large datasets |
| Functionalized Probes | Probes coated with specific molecules (antibiotics, enzymes) [32] | Measures binding forces and local disruption at the nanoscale |
The generalized workflow for real-time monitoring of biofilm disruption encompasses biofilm cultivation, AFM system setup, treatment application, and automated image analysis. The following diagram illustrates the key stages:
Detailed Protocols
Protocol 1: Real-Time Visualization of Enzymatic Biofilm Disruption
Principle: Hydrolytic enzymes such as DNase, proteases, and polysaccharide-degrading enzymes (e.g., dispersin B) target specific structural components of the EPS matrix. DNase, for instance, degrades extracellular DNA (eDNA), a crucial component for biofilm integrity and stability [30]. Real-time AFM allows observation of the gradual breakdown of the matrix and subsequent release of bacterial cells.
Materials:
- DNase I (e.g., 100 μg/mL in PBS)
- Protease (e.g., Proteinase K, 50 μg/mL in PBS)
- Dispersin B (e.g., 25 μg/mL in PBS)
- AFM Fluid Cell with temperature control (set to 37°C)
- Perfusion System for continuous reagent delivery
- Soft Cantilevers (nominal spring constant: ~0.1 N/m)
Procedure:
- Biofilm Preparation: Grow a mature biofilm (e.g., 48-72 hours) of the target organism (e.g., Staphylococcus aureus or Pseudomonas aeruginosa) on a sterile, plasma-treated glass substrate compatible with the AFM stage.
- Baseline Imaging: Mount the substrate in the AFM fluid cell and perfuse with sterile, temperature-equilibrated growth medium. Using the large-area AFM protocol, capture a minimum of 4 adjacent 50x50 μm images in tapping mode under fluid to establish the baseline biofilm architecture. Set the scan rate to 0.5-1.0 Hz.
- Treatment Perfusion: Without disturbing the setup, switch the perfusion input from growth medium to the enzymatic solution (e.g., DNase I at 100 μg/mL). Ensure a continuous, pulse-free flow (e.g., 0.1 mL/min) to maintain a constant enzyme concentration.
- Time-Series Imaging: Program the AFM to automatically re-scan the same large area every 10-15 minutes for a duration of 2-4 hours. The automated stitching and ML-analysis should run concurrently.
- Data Analysis: Use the integrated ML tools to quantify changes in biofilm height, surface roughness, and the area covered by EPS vs. exposed bacterial cells over time.
Protocol 2: Assessing Antibiotic Penetration and Efficacy
Principle: The EPS matrix acts as a barrier, hindering antibiotic diffusion and contributing to biofilm resistance [29] [30]. This protocol visualizes the limited diffusion and spatial heterogeneity of antibiotic action within a biofilm, including the formation of persister cell niches.
Materials:
- Fluoroquinolone antibiotic (e.g., Ciprofloxacin, 10-100 μg/mL)
- Aminoglycoside antibiotic (e.g., Gentamicin, 50-200 μg/mL)
- AFM Fluid Cell with physiological buffer (e.g., 10 mM PBS or 10 mM HEPES with 150 mM NaCl, pH 7.4)
Procedure:
- Biofilm Preparation & Baseline: Follow Step 1 and 2 from Protocol 1.
- Antibiotic Challenge: Perfuse the fluid cell with the chosen antibiotic at a clinically relevant concentration (e.g., Ciprofloxacin at 50 μg/mL).
- High-Resolution Time-Lapse Imaging: Focus on specific regions of interest (ROIs) showing microcolonies. Acquire high-resolution (1x1 μm to 10x10 μm) images every 5 minutes for the first hour, then every 15-30 minutes for up to 6 hours.
- Nanomechanical Mapping (Optional): Periodically switch to AFM force-volume mode to map nanomechanical properties (e.g., stiffness, adhesion) of individual cells, which may change prior to visible morphological disruption.
- Analysis: The ML algorithm will classify cells as "lysed," "morphologically altered," or "intact" based on topography. Quantify the percentage of each cell type over time and plot the killing kinetics.
Protocol 3: Visualizing Nanoparticle-Mediated Disruption
Principle: Nanoparticles (NPs), including metallic (e.g., silver, gold) and lipid-based systems, can penetrate the biofilm matrix and exert antimicrobial effects through mechanisms like reactive oxygen species (ROS) generation, localized photothermal therapy, or enhanced drug delivery [33] [29] [30]. AFM visualizes NP penetration and subsequent cellular damage.
Materials:
- Citrate-capped Silver Nanoparticles (AgNPs, 20-50 nm diameter, 50 μg/mL)
- Liposomal Nanoformulation of an antibiotic (e.g., Ciprofloxacin-loaded liposomes)
- Functionalized Gold Nanorods (for photothermal therapy)
Procedure:
- Baseline Imaging: As in previous protocols.
- NP Introduction: Perfuse the NP suspension into the fluid cell. For photothermal studies, after NP adsorption, expose the biofilm to a near-infrared (NIR) laser source for brief intervals (e.g., 30 seconds at 2 W/cm²).
- Imaging NP Interaction: Capture images immediately after NP perfusion to visualize adsorption and distribution within the EPS. Continue time-lapse imaging to monitor subsequent cellular damage, such as membrane blebbing or collapse.
- Quantifying Disruption: The ML analysis should be trained to identify and count nanoparticles on the biofilm surface and quantify the rate of biofilm erosion or structural collapse post-treatment.
Table 2: Summary of Anti-Biofilm Agents and Expected AFM Observations
| Agent Class | Example & Concentration | Primary Mechanism of Action | Key AFM Observable Phenomena |
|---|---|---|---|
| Enzyme | DNase I (100 µg/mL) | Degrades eDNA in EPS matrix [30] | Loss of fibrous matrix structures; increased biofilm porosity; cell detachment |
| Antibiotic | Ciprofloxacin (50 µg/mL) | Inhibits DNA gyrase | Progressive cellular elongation (filamentation) followed by cell lysis [6] |
| Nanoparticle | AgNPs (50 µg/mL) | ROS generation; membrane disruption [33] [29] | Rapid nanoparticle adsorption; direct membrane pore formation and cell shrinkage |
Data Analysis and Quantification
Machine Learning-Driven Image Analysis
The large-area AFM datasets necessitate automated analysis. The following workflow, enabled by machine learning, transforms raw image tiles into quantitative metrics:
Quantitative Metrics and Kinetic Modeling
The parameters extracted via ML analysis should be compiled into time-series data to model the kinetics of disruption. The table below summarizes core metrics and their significance.
Table 3: Key Quantitative Metrics for Biofilm Disruption Analysis
| Metric | Description | Significance in Disruption |
|---|---|---|
| Surface Roughness (Rq) | Root-mean-square of height deviations | Increase indicates erosion and heterogeneity [1] |
| Biomass Volume | Total volume of material in scan area | Direct measure of biofilm loss over time |
| Cell Confluency | Percentage of surface covered by cells | Distinguishes between EPS loss and cell killing |
| Porosity Index | Ratio of voids/pores to solid material in EPS | Measures matrix degradation (key for enzymes) |
The Scientist's Toolkit: Research Reagent Solutions
Table 4: Essential Materials for AFM-Based Biofilm Disruption Studies
| Item | Function/Description | Example Use Case |
|---|---|---|
| Automated Large-Area AFM System | High-resolution imaging system with automated stage and stitching software [1] [31] | Core instrument for acquiring temporal data over relevant biofilm areas. |
| Temperature-Controlled Fluid Cell | Maintains physiological conditions (e.g., 37°C) during imaging. | Essential for mimicking in vivo conditions and studying biofilm dynamics. |
| Soft Silicon Nitride Probes | Cantilevers with low spring constants (~0.1 N/m). | Minimizes sample disturbance when scanning delicate biofilm structures. |
| Perfusion System | Enables continuous, pulse-free delivery of treatments during imaging. | Allows for real-time observation of biofilm response to treatment. |
| DNase I | Enzyme that degrades extracellular DNA (eDNA) in the biofilm matrix [30]. | Used to study and disrupt the structural integrity of the EPS. |
| Silver Nanoparticles (AgNPs) | Metallic nanoparticles with inherent antimicrobial properties [33] [29]. | Used to study nanoparticle penetration and ROS-mediated killing. |
| Liposomal Nanoformulations | Lipid-based nanoparticles for enhanced antibiotic delivery [29]. | Used to improve antibiotic penetration and efficacy within biofilms. |
| Machine Learning Analysis Software | Software for automated segmentation and quantification of AFM images [1]. | Crucial for analyzing large datasets from time-series experiments. |
Atomic Force Microscopy (AFM) has established itself as a powerful tool for investigating microbial systems, including complex biofilms, at the nanoscale [17]. When operated under physiologically relevant conditions, AFM provides exceptional capability for quantifying nanomechanical properties and capturing high-resolution topographical images of biological specimens [34]. However, a significant limitation of conventional AFM lies in its inability to visualize internal cellular processes and molecular specificity, creating a critical technological gap in comprehensive biofilm characterization [34] [1].
The integration of AFM with fluorescence microscopy creates a correlative imaging platform that bridges this gap, combining nanoscale surface mapping with molecular specificity [34]. This synergy enables researchers to not only visualize the structural architecture of biofilms but also simultaneously monitor dynamic physiological events occurring within these complex microbial communities [34] [1]. Recent advancements in automation and machine learning have further enhanced these capabilities, enabling high-throughput approaches that can statistically capture the inherent heterogeneity of biofilm systems across biologically relevant scales [1].
This application note details practical methodologies for implementing high-throughput correlative AFM-fluorescence microscopy specifically for biofilm research under physiological conditions, providing researchers with standardized protocols for obtaining multidimensional functional insights.
Background & Significance
The Biofilm Challenge in Biomedical Research
Biofilms are multicellular microbial communities encased in self-produced extracellular polymeric substances (EPS) that demonstrate significantly increased resilience to antimicrobials compared to their planktonic counterparts [1] [17]. This enhanced resistance poses substantial challenges across clinical and industrial domains, particularly with the steady rise of antimicrobial resistance (AMR) projected to cause 10 million annual deaths by 2050 [34]. Understanding the fundamental properties that govern biofilm assembly, stability, and resistance mechanisms is therefore critical for developing effective control strategies [17].
Traditional biochemical methods for studying pathogens often require significant sample processing that introduces bias and represents average population behaviors, obscuring crucial single-cell heterogeneity [34]. While omics technologies provide comprehensive molecular profiles, they typically lack spatial context and require validation through direct phenotypic observation [34]. The correlative approach addressed in this document simultaneously captures structural, mechanical, and molecular information, offering a more holistic investigation of biofilm pathophysiology.
Technical Limitations of Standalone Microscopy Techniques
Table 1: Comparative Analysis of Microscopy Techniques in Biofilm Research
| Technique | Resolution | Key Strengths | Principal Limitations | Sample Requirements |
|---|---|---|---|---|
| Atomic Force Microscopy (AFM) | Sub-nanometer to nanometer [1] | Quantifies nanomechanical properties (elasticity, adhesion); operates under physiological conditions; minimal sample preparation [17] [35] | No molecular specificity; small field of view (<100µm); slow scanning; potential sample damage [34] [1] | Requires immobilization; suitable for surface imaging |
| Fluorescence Microscopy | ~200-300 nm | Molecular specificity; live-cell imaging; intracellular dynamics; high-throughput compatible [36] | Limited resolution; photobleaching; requires labeling [1] | Requires fluorescent probes or staining |
| Confocal Laser Scanning Microscopy | ~180-250 nm | 3D reconstruction capability; optical sectioning; reduced out-of-focus light [1] | Fluorescent labeling required; potential phototoxicity; limited resolution compared to AFM [1] | Fluorescent labeling; often requires fixation |
| Scanning Electron Microscopy (SEM) | ~1-10 nm | High-resolution surface imaging; large depth of field [1] | Requires dehydration and metal coating; vacuum conditions; non-physiological [1] | Dehydration and fixation necessary |
Integrated Methodologies
Automated Large-Area AFM for Biofilm Mapping
Protocol: Large-Area AFM Imaging of Biofilm Architecture
Principle: Conventional AFM imaging is restricted to small scan areas (<100 µm), making it difficult to capture the structural heterogeneity of millimeter-scale biofilms [1]. Automated large-area AFM overcomes this limitation through coordinated image stitching, enabling comprehensive analysis of biofilm organization across relevant spatial scales.
Materials:
- Biofilm Samples: Pantoea sp. YR343 or other relevant biofilm-forming strains [1]
- Substrata: PFOTS-treated glass coverslips or gradient-structured surfaces [1]
- Instrumentation: AFM with large-range piezoelectric scanner and automated stage
- Software: Machine learning-based image stitching and analysis algorithms [1]
Procedure:
- Surface Preparation: Treat glass coverslips with PFOTS to create hydrophobic surfaces that promote bacterial attachment [1].
- Biofilm Cultivation: Inoculate surfaces with bacterial suspension in appropriate growth medium. Incubate for desired timeframe (e.g., 30 minutes for initial attachment studies; 6-8 hours for cluster formation) [1].
- Sample Preparation: Gently rinse coverslips to remove non-adherent cells. For hydrated imaging, maintain in appropriate buffer. For dried imaging, air-dry samples briefly [1].
- Automated Imaging:
- Program the AFM to automatically acquire multiple adjacent high-resolution images (e.g., 5×5 µm or 10×10 µm) across millimeter-scale areas [1].
- Implement machine learning algorithms for optimal region selection and scan parameter adjustment [1].
- Use minimal overlap between individual scans (5-10%) to maximize acquisition speed while ensuring stitchability [1].
- Image Processing:
- Data Extraction:
Technical Notes:
- For Pantoea sp. YR343, expect rod-shaped cells approximately 2 µm in length and 1 µm in diameter [1].
- Flagellar structures typically measure 20-50 nm in height and extend tens of micrometers across surfaces [1].
- After 6-8 hours of growth, anticipate cluster formation with characteristic honeycomb-like patterns [1].
Correlative AFM-Fluorescence Microscopy Workflow
Protocol: Correlative AFM-Fluorescence Imaging of Biofilms
Principle: This protocol synchronizes AFM's nanomechanical capability with fluorescence microscopy's molecular specificity to establish structure-function relationships within biofilms under physiological conditions [34].
Materials:
- Biofilm Samples: Relevant bacterial strains (e.g., Pseudomonas aeruginosa, Staphylococcus aureus)
- Fluorescent Labels: Cell-permeable dyes for viability (e.g., SYTO dyes), EPS staining (e.g., ConA conjugates), metabolic activity probes
- Substrata: Glass-bottom dishes compatible with both fluorescence microscopy and AFM
- Instrumentation: Combined AFM-fluorescence system or separate instruments with relocalization capability
Procedure:
- Sample Preparation:
- Grow biofilms on appropriate substrates for 24-48 hours under desired conditions.
- Apply fluorescent labels according to manufacturer protocols with minimal perturbation to biofilm structure.
- For live-cell imaging, maintain environmental control (temperature, CO₂) throughout the experiment.
Fluorescence Imaging:
- Acquire reference images using confocal or epifluorescence microscopy.
- Capture z-stacks for 3D reconstruction if needed.
- Document precise stage coordinates for relocalization if using separate instruments.
AFM Imaging:
- Transfer samples to AFM if using separate instruments, maintaining physiological conditions.
- Navigate to previously mapped regions using stage coordinates or fiduciary markers.
- Perform tapping-mode AFM in fluid to minimize sample damage [17].
- Acquire simultaneous height and phase images to distinguish material properties [17].
- Optionally perform force mapping to quantify mechanical properties across the biofilm.
Data Correlation:
- Align AFM and fluorescence datasets using registration algorithms.
- Correlate topographic features with fluorescence signals.
- Map mechanical properties to molecular signatures.
Technical Notes:
- For force spectroscopy, typical cantilever spring constants range from 0.01-1.0 N/m for biofilms [19].
- Elastic moduli of biofilms typically range from 0.1-100 kPa, varying with depth and composition [19].
- Maintain consistent hydration throughout correlative imaging to prevent structural artifacts.
High-Content Analysis of Host-Pathogen Interactions
Protocol: HIO-Based Host-Pathogen Screening Platform
Principle: Human Intestinal Organoids (HIOs) provide physiologically relevant models for studying host-pathogen interactions in the gut environment [36]. This protocol adapts HIOs for high-throughput screening using automated confocal imaging and analysis, enabling quantitative assessment of bacterial effects on host cells.
Materials:
- Biological Models: 2D HIO monolayers established from stem cell-derived intestinal organoids [36]
- Platform: 96-well plates with collagen coating [36]
- Instrumentation: High-throughput spinning disk confocal microscope [36]
- Reagents: Microbial supernatants, EdU proliferation assay kit, immunostaining reagents [36]
Procedure:
- HIO Monolayer Preparation:
Treatment Application:
Endpoint Assaying:
Automated Imaging and Analysis:
Technical Notes:
- This platform enables rapid quantification of fluorescent labeling across hundreds of HIO samples simultaneously [36].
- The approach can detect inter-donor variability in host responses to bacterial factors [36].
- Correlation with AFM measurements can reveal how bacterial treatments alter host cell mechanical properties.
The Scientist's Toolkit
Table 2: Essential Research Reagent Solutions for Correlative Biofilm Imaging
| Category | Specific Reagents/Solutions | Function & Application | Key Considerations |
|---|---|---|---|
| Surface Substrata | PFOTS-treated glass [1]; Collagen-coated surfaces [36]; Poly-L-lysine functionalization [17] | Promotes bacterial adhesion and biofilm formation; facilitates cell immobilization for AFM | Surface chemistry significantly influences attachment dynamics and biofilm architecture |
| Immobilization Agents | Poly-L-lysine [17]; Glutaraldehyde [35]; Polydopamine [35] | Secures cells during AFM scanning to prevent displacement by tip forces | Must balance immobilization strength with preservation of native physiological state |
| Fluorescent Probes | SYTO nucleic acid stains; Concanavalin A conjugates (EPS staining); viability indicators | Enables specific visualization of cellular components, viability, and matrix elements | Potential phototoxicity and photobleaching require optimization of imaging parameters |
| Cantilever Types | Silicon nitride tips (soft biological cantilevers) [19]; Functionalized probes [35] | Physical probing of sample surfaces; spring constants typically 0.01-1.0 N/m for biofilms | Proper calibration essential for quantitative force measurements; functionalization enables specific interactions |
| Culture Media | L-WRN conditioned medium [36]; Differentiation medium; MRS broth for lactobacilli [36] | Supports HIO growth and differentiation; cultivates bacterial strains | Medium composition significantly influences biofilm matrix production and structure |
Data Analysis & Interpretation
Multimodal Data Integration
Quantitative Parameters from Correlative Imaging:
Table 3: Key Measurable Parameters in Correlative Biofilm Studies
| Parameter Category | Specific Metrics | Biological Significance | Measurement Techniques |
|---|---|---|---|
| Structural Features | Cellular orientation distribution [1]; Surface roughness [17]; Cluster size and spacing [1] | Reveals organizational principles in biofilm assembly; indicates response to environmental cues | AFM topography; Large-area mapping with ML segmentation [1] |
| Nanomechanical Properties | Elastic modulus (Young's modulus) [17] [35]; Adhesion forces [17] [35]; Cohesive energy [19] | Indicates biofilm stiffness, integrity, and resistance to mechanical disruption | AFM force spectroscopy; Nanoindentation [17] |
| Molecular Composition | EPS distribution [1]; Metabolic activity localization; Cell proliferation patterns [36] | Identifies functional heterogeneity within biofilms; reveals microenvironments | Fluorescence staining; Immuno-labeling; Metabolic markers [36] |
| Dynamic Processes | Antibiotic penetration gradients; Structural remodeling over time; Mechanical property evolution | Elucidates adaptive responses to stressors and treatment interventions | Time-lapse correlative imaging; Repeated measurements |
Workflow for Data Analysis
Applications in Antimicrobial Research
The correlative imaging approach detailed in this application note enables several advanced applications in antimicrobial and drug development research:
Mechanism of Action Studies
Correlative AFM-fluorescence microscopy can visually and quantitatively demonstrate the mechanistic effects of antimicrobial compounds on biofilm structures [35]. This includes:
- Real-time visualization of membrane disruption following antibiotic treatment
- Quantification of changes in cellular stiffness associated with cell wall-targeting agents
- Mapping of altered EPS production in response to anti-biofilm compounds
- Correlation between bacterial death (fluorescence viability markers) and structural degradation (AFM topography)
Resistance Mechanism Investigation
AFM-based single-cell force spectroscopy has revealed that antimicrobial-resistant strains typically exhibit altered nanomechanical properties compared to their sensitive counterparts [35]. Specifically:
- Resistant bacterial strains often demonstrate increased cell wall rigidity and higher adhesive properties [35]
- These biophysical differences contribute to enhanced ability to form densely packed biofilms that are refractory to antibiotic penetration [35]
- Correlative approaches can link these mechanical changes to specific genetic resistance markers through simultaneous fluorescence in situ hybridization (FISH)
Anti-Biofilm Compound Screening
The high-throughput HIO platform enables rapid screening of compound libraries for anti-biofilm activity while simultaneously assessing host cell toxicity [36]. This integrated approach:
- Quantifies reduction in biofilm biomass and viability through automated fluorescence analysis
- Assesses compound effects on host cell proliferation and barrier integrity
- Provides preliminary safety profiles by measuring host cell responses alongside anti-biofilm efficacy
Troubleshooting & Optimization
Common Technical Challenges
Sample Displacement During AFM Imaging: Biofilms are inherently soft and easily displaced by AFM tip forces [17].
- Solution: Optimize immobilization strategies using poly-L-lysine or polydopamine coatings [35]. Implement tapping mode in fluid to minimize lateral forces [17].
Poor Registration Between Modalities: Accurate correlation requires precise alignment of AFM and fluorescence datasets.
- Solution: Incorporate fiduciary markers on substrates. Use automated registration algorithms that reference common structural features.
Maintenance of Physiological Conditions: Hydration and temperature control are critical for preserving native biofilm properties.
- Solution: Use environmental chambers for both AFM and fluorescence imaging. Minimize time between correlated measurements.
Limited Throughput in AFM Imaging: Conventional AFM is inherently slow compared to fluorescence microscopy.
- Solution: Implement large-area automated AFM with machine learning-guided region selection [1]. Use sparse sampling strategies complemented by statistical analysis.
The integration of AFM with fluorescence microscopy through the protocols detailed in this application note provides a powerful correlative platform for advancing biofilm research. By combining nanoscale topographic and mechanical mapping with molecular specificity, researchers can obtain comprehensive insights into biofilm organization, function, and response to therapeutic interventions. The implementation of automated large-area AFM and high-throughput screening approaches addresses the critical challenge of biological heterogeneity, enabling statistically robust analysis across relevant spatial scales.
These methodologies offer particular value in antimicrobial development, where understanding structure-function relationships in biofilms can accelerate the identification of novel therapeutic strategies against resistant infections. As correlative technologies continue to evolve with advancements in machine learning, automation, and probe development, they will undoubtedly yield increasingly sophisticated understanding of microbial communities and their interactions with host systems.
Mastering Fluid AFM: Solving Common Challenges for High-Fidelity Biofilm Data
Atomic force microscopy (AFM) is a powerful, high-resolution technique that has become a prevalent tool in cell biology and biomedical studies, especially those focusing on the mechanical properties of cells and tissues [37]. The technique provides nanometer-resolution maps of cell topography, stiffness, viscoelasticity, and adhesion, often overlaid with matching optical images [37]. For research on biofilms and complex biological systems under physiological conditions, AFM offers the unique capability to study samples directly in their natural, liquid environments without extensive sample preparation [38]. This is particularly valuable for understanding the assembly, structure, and environmental responses of complex microbial communities [1].
However, obtaining accurate measurements in complex fluids presents significant challenges, particularly regarding topographical artifacts that can compromise data integrity. These artifacts frequently stem from improper probe selection, inadequate force calibration, and fluid-specific interactions between the tip and sample. For researchers studying biofilms in physiological conditions, minimizing these artifacts is crucial for obtaining reliable nanomechanical data that can be correlated with biological function. This application note addresses these challenges by providing detailed protocols for probe selection and force calibration specifically optimized for measurements in complex fluids relevant to biofilm research.
Key Challenges in Fluid AFM for Biofilm Research
Biofilms are multicellular communities of microbial cells held together by self-produced extracellular polymeric substances (EPS) [1]. The inherent heterogeneity and dynamic nature of biofilms, characterized by spatial and temporal variations in structure, composition, and mechanical properties, presents unique imaging challenges [1]. In fluid environments, these challenges include:
- Probe-fluid interactions that affect cantilever dynamics and sensitivity
- Adhesive forces between the tip and hydrophobic EPS components
- Soft, viscoelastic properties of hydrated biofilm matrices that complicate mechanical analysis
- Limited scan range and labor-intensive nature of conventional AFM when studying millimeter-scale biofilm architectures [1]
Understanding these challenges is fundamental to developing effective strategies for artifact minimization in physiological fluid conditions.
Probe Selection for Complex Fluid Imaging
The choice of appropriate AFM probes is the first critical step in minimizing topographical artifacts. The probe's physical characteristics directly influence image resolution, force application, and fluid dynamics.
Probe Characteristics and Specifications
|cantilever spring constant (k) | 0.08 - 0.6 N/m | Optimized for soft biological samples; prevents sample deformation | |cantilever resonance frequency | 15 - 60 kHz (in fluid) | Provides sufficient stability for imaging in liquid environments | |tip geometry | Sharp, high-aspect ratio | Reduces drag forces in fluid; improves access to biofilm structures | |tip radius | < 10 nm (imaging), ~30 nm (mechanics) | Balances resolution with reliable contact mechanics modeling | |tip material | Silicon nitride | Low inherent hydrophobicity; reduced adhesion in aqueous solutions | |coating | Uncoated or reflective coating | Minimizes unwanted interactions; maintains laser reflectivity |
For biofilm imaging in complex fluids, sharp, high-aspect ratio tips with minimal radius are essential for resolving fine structures such as flagella, which measure approximately 20-50 nm in height [1]. Commercially available pre-calibrated probes with controlled tip geometry (e.g., rounded tips with nominal radius of 30nm that transition to a cone with a half angle of 25 degrees) provide a controlled contact area for various indentation depths up to 100nm [39]. These probes are particularly valuable for quantitative measurements as they reduce variability in contact mechanics modeling.
Operational Mode Considerations
For biofilm imaging in physiological conditions, PeakForce Tapping mode is recommended over traditional contact or tapping modes [39]. This non-resonant method based on force curves conducted with direct force control at ultralow forces provides several advantages:
- Minimized lateral forces that can distort soft biofilm structures
- Direct force control enabling operation at ultralow forces (typically 50-200 pN)
- Minimal wear on the tip during extended imaging sessions
- Simultaneous topographic and nanomechanical mapping through PeakForce QNM [39]
When coupled with automation features like ScanAsyst, which optimizes critical operating parameters, PeakForce Tapping significantly simplifies setup while improving data quality for fluid imaging [39].
Force Calibration Protocols in Complex Fluids
Accurate force calibration is fundamental to quantitative AFM measurements, particularly in fluid environments where additional factors like buoyancy, viscosity, and meniscus forces come into play.
Comprehensive Calibration Workflow
The following diagram illustrates the integrated workflow for probe selection and force calibration in complex fluids:
Critical Calibration Parameters
|calibration parameter | recommended method | specific considerations for complex fluids | | thermal tune | In the same fluid used for experiments | Accounts for fluid-specific damping effects on cantilever dynamics | | deflection sensitivity | Force curve on rigid substrate (sapphire) in fluid | Essential for converting photodiode voltage to force (F = k×d) | | Z piezo calibration | Sinusoidal Z motion calibration | Calibrates phase (Sync Distance QNM) and amplitude (PFT Amplitude Sens) parameters | | adhesion force mapping | Multiple algorithm options | Baseline fitting methods optimized for fluid-specific adhesion profiles | | frequency calibration | 125Hz to 2000Hz range | Enables frequency-dependent measurements for viscoelastic characterization |
New calibration parameters (Sync Distance QNM for phase and PFT Amplitude Sens for amplitude) have been introduced to manage the sinusoidal Z motion in PeakForce Tapping, where the Z piezo position is defined as: Z = A × sin(2πft + φ) [39]. The calibration process for these parameters can be performed with a guided software dialog that automatically calculates the required values based on force curves conducted at the frequency of the PeakForce Tapping measurement.
Advanced Calibration Techniques
For the highest accuracy in quantitative measurements, consider these advanced approaches:
- Pre-calibrated probes with laser doppler vibrometer (LDV)-calibrated spring constants eliminate user variability in this critical parameter [39]
- FASTForce Volume increases force curve acquisition speed by tenfold, enabling 128×128 pixel maps in approximately 3 minutes instead of 30 minutes [39]
- PeakForce Capture capability saves a force curve for every pixel in the image, allowing post-acquisition analysis with different contact models [39]
Experimental Protocol: Artifact Minimization in Biofilm Imaging
Sample Preparation
- Substrate Selection: Use PFOTS-treated glass coverslips or similarly modified surfaces to promote bacterial attachment while minimizing non-specific adhesion [1]
- Biofilm Growth: Inoculate surfaces with bacterial suspension (e.g., Pantoea sp. YR343) in appropriate growth medium [1]
- Incubation Time: For initial attachment studies, incubate for ~30 minutes; for developed biofilms, 6-8 hours to form characteristic honeycomb patterns [1]
- Rinsing: Gently rinse with buffer solution to remove unattached cells while preserving biofilm integrity [1]
AFM Imaging Procedure
Fluid Cell Setup:
- Mount sample in liquid cell
- Add appropriate physiological buffer (e.g., PBS or growth medium)
- Ensure temperature control at 37°C if simulating physiological conditions
Engagement Procedure:
- Approach slowly (0.5-1 μm/s) to allow stabilization of fluid dynamics
- Set initial engagement parameters to low forces (<100 pN)
- Use automated optimization features if available (e.g., ScanAsyst)
Imaging Parameters:
- Scanning frequency: 0.5-1.5 Hz
- PeakForce frequency: 0.125-2 kHz [39]
- PeakForce setpoint: Adjust to maintain minimal deformation (<50 nm)
- Resolution: 512×512 pixels or higher for structural details
Data Acquisition:
- Acquire height, deflection, and adhesion channels simultaneously
- For mechanical properties, enable DMTModulus or other relevant models
- Save force curves for every pixel if using PeakForce Capture for post-processing
Artifact Identification and Troubleshooting
|artifact type | possible causes | correction strategies | | streaking or smearing | Excessive tracking force; | Reduce PeakForce setpoint; Increase Z feedback gains | | thermal drift | Poor thermal equilibrium; | Allow longer stabilization time; Use active temperature control | | adhesive "pull-offs" | Hydrophobic interactions with EPS | Increase salt concentration in buffer; Use sharper tips to reduce contact area | | inconsistent modulus readings | Improper contact model selection | Validate with reference sample; Switch between DMT/JKR models as appropriate | | fluid meniscus effects | Large tip radius; Contaminated tip | Use sharper tips; Employ UV ozone cleaning before experiments |
Research Reagent Solutions
Essential materials and their specific functions for AFM studies of biofilms in complex fluids:
|reagent/material | function | specific application notes | | PFOTS-treated glass coverslips | Hydrophobic substrate for bacterial attachment | Promotes uniform cell distribution for AFM imaging [1] | | silicon nitride AFM probes | Bio-inert tip material for imaging in fluid | Minimal fluid interactions; Optimal reflectivity for laser alignment | | pre-calibrated probes (e.g., RTESPA-300-30) | Quantitative nanomechanical mapping | 30nm rounded tips with LDV pre-calibrated spring constants [39] | | phosphate buffered saline (PBS) | Physiological ionic strength maintenance | Prevents osmotic shock during live-cell imaging | | sapphire reference sample | Deflection sensitivity calibration | Inert, rigid substrate for force calibration in fluid | | Bruker FASTForce Volume | High-speed force mapping | Enables 128×128 force maps in ~3 minutes instead of 30 minutes [39] |
Data Analysis and Validation
Contact Mechanics Model Selection
For analyzing force curves obtained in fluid environments, appropriate contact mechanics models are essential for accurate property extraction:
- DMT Model: Recommended for most biofilm applications; accounts for moderate adhesion outside the contact area [39]
- JKR Model: Appropriate for soft materials with significant adhesion [39]
- Sneddon Model: Suitable for pyramidal tips on homogeneous samples [39]
- Hertz Model: Basic model for adhesion-free contacts [37]
The improved modeling in data analysis software now offers multiple algorithms to calculate adhesion and differing methods to fit the baseline, providing flexibility in analyzing complex fluid data [39].
Validation Approaches
- Reference Materials: Use polymer blends with known modulus values (e.g., PS/PP/PE) to validate measurements [39]
- Cross-correlation: Compare AFM modulus values with DMA measurements time-temperature superposed to appropriate frequencies [39]
- Multi-technique Validation: Correlate AFM data with optical microscopy or fluorescence imaging to confirm structural features [37]
Minimizing topographical artifacts in AFM imaging of biofilms under physiological conditions requires careful attention to probe selection, comprehensive force calibration, and appropriate operational modes. The protocols outlined in this application note provide a systematic approach to obtaining reliable, quantitative data from complex fluid environments. By implementing these methods, researchers can significantly improve the accuracy of their nanomechanical measurements, enabling more meaningful correlations between structural and functional properties in biofilm systems. The integration of advanced technologies such as pre-calibrated probes, FASTForce Volume, and sophisticated contact mechanics models has dramatically improved the accessibility and reliability of these challenging measurements, opening new possibilities for understanding microbial communities in conditions relevant to medical, environmental, and industrial contexts.
Within the broader context of employing Atomic Force Microscopy (AFM) for biofilm research, a significant technical challenge is maintaining biofilm viability and structural integrity during long-term imaging under physiological conditions. Biofilms are complex, three-dimensional microbial communities that exhibit increased resistance to antimicrobial agents and environmental stresses compared to their planktonic counterparts [8]. When investigating these structures with AFM in fluid, the primary advantage is the ability to observe cellular structures at molecular resolution under native physiological conditions, without the need for staining, labeling, or fixation [40]. This application note details standardized protocols for preserving biofilm viability during extended AFM imaging sessions, enabling researchers to obtain structurally and functionally relevant data on biofilm architecture, mechanics, and dynamics.
The Critical Role of Physiological Buffers
Physiological buffers are fundamental to maintaining biofilm viability during AFM imaging by providing a stable, life-sustaining environment. These buffers mimic the natural milieu of the biofilm, preserving the intricate structures and functions of both the microbial cells and the extracellular polymeric substance (EPS) that constitutes the biofilm matrix [8] [41].
The EPS provides a diffusion barrier that can impede the transport of some molecules, making the internal chemical environment of the biofilm distinct from the surrounding bulk fluid [42]. Therefore, the buffer system must be carefully designed to maintain pH, osmolarity, and ion concentrations that support the metabolic activity and structural integrity of the specific bacterial species under investigation. Working in liquid conditions that mirror physiological environments is a key strength of AFM, allowing for the structural and functional probing of biological systems in a native-like state [43]. This capability is crucial for observing dynamic biological processes, such as the initial adhesion of bacteria and subsequent biofilm development, in real time and with high spatial resolution.
Quantitative Parameters for Buffer Formulation
The table below summarizes key parameters for formulating and validating physiological buffers for long-term biofilm imaging.
Table 1: Key Parameters for Physiological Buffer Formulation and Validation
| Parameter | Target Range/Value | Functional Importance | Validation Method |
|---|---|---|---|
| Imaging Force | < 100 pN [43] | Prevents irreversible deformation of soft biological samples. | AFM force calibration; FD-AFM. |
| pH Stability | As required by species (e.g., 7.0-7.4 for many) | Maintains enzymatic activity & protein structure. | pH meter; phenol red indicator [44]. |
| Osmolarity | Isotonic to bacterial cytoplasm | Prevents osmotic shock and cell lysis. | Osmometer. |
| Essential Ions | e.g., Ca²⁺, Mg²⁺, K⁺, Na⁺ | Stabilizes membrane structures & supports signaling. | Chemical analysis. |
| Nutrient Supply | Minimal growth medium or defined nutrients | Supports basal metabolism without promoting hyper-growth. | Metabolic assays [44]. |
| Temperature Control | 25°C - 37°C (as required) | Maintains native metabolic rates and protein dynamics. | Heated stage; calibrated sensor. |
Experimental Protocols
Protocol: AFM Imaging of Biofilms in Physiological Buffer
This protocol outlines the procedure for preparing and imaging live biofilms using AFM under physiological conditions.
I. Biofilm Cultivation and Sample Preparation
- Substrate Selection: Use thin, sterile substrates (e.g., glass coverslips, mica, or relevant biomaterial surfaces) that fit the AFM liquid cell.
- Biofilm Growth: Inoculate the substrate with the bacterial strain of interest and incubate in an appropriate growth medium for 24-48 hours (or until a mature biofilm forms) under optimal conditions [41].
- Sample Transfer: Gently rinse the biofilm-covered substrate with the pre-warmed physiological buffer to remove non-adherent planktonic cells. Avoid drying the biofilm at any stage.
II. AFM Instrument Setup and Imaging
- Liquid Cell Assembly: Mount the biofilm sample in the AFM fluid cell. Ensure all O-rings are properly sealed to prevent leaks and evaporation during long-term experiments.
- Buffer Introduction: Gently introduce the chosen physiological buffer into the fluid cell, taking care to minimize shear forces on the biofilm.
- Cantilever Selection: Use soft cantilevers (spring constants typically 0.01 - 0.1 N/m) with sharp, non-functionalized tips for topographic imaging [43].
- Imaging Parameter Calibration:
- Set the imaging force to a maximum of 100 pN to prevent sample damage [43].
- Engage the tip and switch to a dynamic (tapping) mode to minimize lateral forces.
- Adjust the setpoint, gains, and scan rate to achieve stable feedback. A lower scan rate may be necessary for initial scans to locate robust areas of the biofilm.
- Initiate Imaging: Begin scanning and monitor the topology in real-time. For long-term experiments, the system should be placed in a temperature-controlled environment.
Protocol: Validating Biofilm Viability Post-Imaging
It is critical to confirm that the imaging conditions have maintained biofilm viability. This can be achieved through metabolic assays.
I. Principle This assay quantifies viable bacteria based on their metabolic production of acidic products, which change the color of the pH indicator phenol red [44]. The time taken to reach a specific color change threshold is inversely related to the initial number of viable bacteria.
II. Procedure
- Prepare Assay Media: Create a solution containing a standard growth medium (e.g., Tryptic Soy Broth) supplemented with 0.001% phenol red.
- Establish a Standard Curve:
- Create a series of planktonic cultures with known concentrations (CFU/mL).
- Add the assay media to each standard and incubate.
- Record the time (
t_detect) for each standard to change from red to yellow. - Plot
log(CFU)againstt_detect. The slope of the line is-μ / ln(10), whereμis the specific growth rate of the bacteria in the assay media [44].
- Test the Imaged Biofilm:
- After AFM imaging, carefully transfer the biofilm sample to a well containing the assay media.
- Record the time it takes for the color change to occur.
- Use the standard curve to interpolate the equivalent starting viable cell count for the biofilm.
III. Key Consideration
Note that the specific growth rate (μ) of bacteria in a biofilm can be significantly lower than in planktonic culture (e.g., 0.70 h⁻¹ for Streptococcus mutans biofilm vs. 1.09 h⁻¹ for planktonic cells) [44]. Using a standard curve derived from the biofilm's own growth rate, or at least acknowledging this difference, is essential for an accurate assessment of viability.
Workflow and Data Analysis
The following diagram illustrates the integrated experimental workflow for viable biofilm imaging and analysis.
Integrated Workflow for Viable Biofilm Imaging and Analysis
The Scientist's Toolkit: Essential Research Reagents and Materials
Table 2: Key Research Reagent Solutions for AFM Biofilm Studies
| Item | Function/Application | Key Considerations |
|---|---|---|
| Soft AFM Cantilevers | High-resolution topographic imaging of soft biological samples. | Spring constant: 0.01 - 0.1 N/m; Sharp tips for high resolution [43]. |
| Physiological Buffer (e.g., PBS) | Maintains ionic strength, pH, and osmolarity during imaging. | Must be isotonic and contain essential ions (Ca²⁺, Mg²⁺); filter-sterilized. |
| Phenol Red Assay Media | Quantitative metabolic assay for post-imaging viability validation. | Contains growth medium and pH indicator; requires standard curve for quantification [44]. |
| Live/Dead Fluorescent Stain | Complementary viability assessment and 3D structural analysis via CLSM. | Stains based on membrane integrity (e.g., SYTO 9 & propidium iodide) [42]. |
| Microfluidic Flow Cell | For controlled nutrient delivery and waste removal during time-lapse studies. | Enables precise environmental control; can be coupled with AFM. |
| Temperature Control System | Maintains optimal temperature for biofilm metabolism during imaging. | Heated stage or environmental chamber; critical for long-term viability. |
The strategies outlined in this application note provide a robust framework for conducting reliable AFM studies on viable biofilms. By prioritizing the maintenance of a physiological environment through carefully formulated buffers and gentle imaging parameters, researchers can exploit the full potential of AFM to generate high-resolution structural and functional data. This approach, coupled with rigorous post-imaging viability validation, ensures that the observed dynamics and structures are biologically relevant, thereby advancing our understanding of biofilm mechanics and informing the development of novel anti-biofilm strategies.
Atomic force microscopy (AFM) enables nanoscale topographical imaging and mechanical characterization of soft biological samples under physiologically relevant conditions, making it indispensable for biofilm research [45] [46]. However, a significant challenge persists in accurately differentiating true sample properties from measurement artifacts introduced by substrate effects and instrumental limitations. Biofilms, as complex microbial communities embedded in extracellular polymeric substances, exhibit inherent heterogeneity in their structural and mechanical properties [1]. When these samples are mounted on substrates for AFM analysis, the underlying surface properties can profoundly influence the obtained data, potentially leading to erroneous interpretations of biofilm architecture, cellular morphology, and nanomechanical behavior. This application note details the primary data interpretation pitfalls encountered when analyzing soft biological samples and provides standardized protocols to differentiate genuine sample characteristics from substrate-induced artifacts within the context of biofilm research.
Key Artifacts and Data Interpretation Challenges
Common AFM Artifacts in Biofilm Imaging
Several recurrent artifacts can compromise data interpretation when imaging biofilms and other soft biological samples:
- Tip Convolution Effects: This fundamental limitation arises when the dimensions of the AFM tip and the scanned features are comparable, leading to significant overestimation of lateral feature sizes and inability to accurately resolve shape [47]. For instance, nanoscale biofilm components like extracellular vesicles or fine fibrils may appear 2-3 times wider than their actual dimensions due to tip geometry.
- Tip Contamination and Damage: Blunt or contaminated tips produce duplicated, irregular, or repeating features across images [48] [49]. In biofilm studies, this can manifest as apparent cellular dimorphism or anomalous extracellular polymeric substance (EPS) structures that are actually imaging artifacts.
- Sample Deformation: Excessive imaging forces can compress or displace soft biofilm components, particularly when using inappropriate cantilever stiffness or imaging modes [50]. This leads to underestimated height measurements and distorted architectural assessments.
- Environmental and Electrical Noise: Vibrations and electrical interference introduce repetitive lines or streaks in images, potentially obscuring genuine nanoscale features of interest [48] [51].
Table 1: Common AFM Artifacts and Their Impact on Biofilm Characterization
| Artifact Type | Visual Manifestation | Impact on Biofilm Data | Primary Confounding Factor |
|---|---|---|---|
| Tip Convolution | Widened features, loss of resolution | Overestimation of EPS fiber diameter, incorrect cellular morphology | Actual sample topography vs. tip geometry |
| Sample Deformation | Flattened structures, reduced height | Underestimation of biofilm thickness, distorted porosity | Sample softness vs. imaging force |
| Substrate Interference | Uniform mechanical properties | Misattribution of substrate stiffness to biofilm regions | Indentation depth relative to sample thickness |
| Adhesive Contamination | Streaking, unexpected patterns | False positive for EPS filaments or matrix components | Surface contamination vs. biological structures |
Substrate Interference in Nanomechanical Characterization
Accurate nanomechanical characterization of biofaces requires careful consideration of substrate effects:
- Elastic Half-Space Assumption Violation: Traditional contact mechanics models (e.g., Hertz, Sneddon) assume the sample is infinitely thick compared to indentation depth. For thin biofilms or EPS layers, this assumption fails as the underlying substrate influences measurements [47] [23]. Indentation depth should not exceed 10-20% of the sample thickness to minimize substrate effects.
- Inadequate Tip Characterization: Uncertainties in tip geometry and dimensions significantly impact mechanical property calculations, particularly for nanofibers and other biofilm components with dimensions similar to the tip radius [47].
- Environmental Factors in Liquid Imaging: Operation in biologically-relevant liquids introduces additional complications including altered quality factors, excitation methods, and thermal noise [50]. These factors can obscure genuine mechanical property differences within biofilm matrices.
Experimental Protocols for Artifact Mitigation
Pre-imaging Sample Validation Protocol
Objective: Confirm sample integrity and appropriate substrate selection before AFM analysis.
Materials:
- Appropriate growth medium for biofilm culture
- Chemically inert substrates (freshly cleaved mica, glass)
- Functionalized substrates (collagen-coated, PFOTS-treated) [1] [52]
- Purified water for rinsing (Milli-Q or equivalent)
- Fixative agents (if required: 2-4% glutaraldehyde or 4% PFA)
Procedure:
- Substrate Selection: Choose substrates with known surface properties. For initial attachment studies, use PFOTS-treated glass to minimize arbitrary bacterial adhesion [1]. For collagen-binding organisms like Streptococcus mutans, use native or glycated type-I collagen coatings to mimic in vivo conditions [52].
- Sample Preparation:
- Grow biofilms for specified duration (e.g., 24-72 hours) under relevant conditions.
- Gently rinse with appropriate buffer or growth medium to remove non-adherent cells. Avoid forceful rinsing that may disrupt biofilm architecture.
- If necessary, apply mild fixation (15-30 minutes in 2-4% glutaraldehyde) followed by buffer rinse to preserve structure while maintaining mechanical properties.
- Sample Integrity Check:
- Perform optical microscopy (phase contrast or epifluorescence) to verify overall biofilm distribution and identify regions of interest.
- Confirm absence of large-scale contamination or detachment.
- Substrate Compatibility Assessment:
- Verify that substrate properties (roughness, stiffness) do not dominate the expected biofilm signals.
- For mechanical characterization, ensure biofilm thickness exceeds 500 nm to allow valid indentation measurements.
AFM Imaging Optimization Protocol for Biofilms
Objective: Acquire high-resolution topographical data while minimizing artifacts.
Materials:
- AFM with acoustic enclosure and anti-vibration table
- Appropriate cantilevers (see Table 2)
- Liquid cell for physiological imaging
- Calibration samples (grating, nanoparticles)
Procedure:
- Cantilever Selection:
- For contact mode: Use soft cantilevers (0.1-1 N/m) with sharp tips (radius < 10 nm).
- For tapping mode: Use stiff cantilevers (10-40 N/m) in liquid to achieve high quality factors [50].
- For high-aspect-ratio features: Implement conical or high-aspect-ratio (HAR) probes to accurately resolve deep trenches and steep structures [48].
- System Calibration:
- Perform thermal tune to determine exact cantilever sensitivity and spring constant.
- Verify tip integrity using calibration samples with known dimensions before and after biofilm imaging.
- Imaging Parameter Optimization:
- Set initial scan size larger than area of interest to identify representative regions.
- Use minimal feasible force (setpoint ratio > 0.8) to prevent sample deformation.
- Employ slow scan rates (0.5-1 Hz) to reduce tracking errors on rough biofilm surfaces.
- Implement engage parameters with minimal contact force.
- Artifact Monitoring During Acquisition:
- Continuously monitor both trace and retrace images for discrepancies indicating tip damage or contamination.
- Check phase images for consistent contrast suggesting stable tip-sample interaction.
- If artifacts appear, pause imaging and verify tip integrity using calibration sample.
Substrate Effect Minimization Protocol for Nanomechanical Mapping
Objective: Obtain accurate mechanical properties of biofilms independent of underlying substrate.
Materials:
- AFM system with force spectroscopy capability
- Colloidal probes or tips with well-defined geometry
- Stiff cantilevers (0.5-5 N/m) for improved force control
- Thermal calibration equipment
Procedure:
- Indentation Depth Optimization:
- Approach multiple locations on the biofilm to estimate thickness variations.
- Set maximum indentation depth to ≤10% of local biofilm thickness.
- For thin biofilms (<200 nm), consider alternative approaches (e.g., QI-mode, PeakForce Tapping) that limit indentation [23].
- Force Volume Acquisition:
- Implement force mapping with sufficient spatial resolution (64×64 to 128×128 points) to capture biofilm heterogeneity.
- Use moderate approach/retract speeds (0.5-1 μm/s) to minimize viscous effects while maintaining stability.
- Include adequate trigger threshold to ensure contact detection on soft regions.
- Data Processing with Substrate Correction:
- Fit force curves using appropriate contact mechanics models (Hertz, Sneddon, JKR).
- Apply correction factors for thin films when biofilm thickness is comparable to indentation depth [47].
- Plot calculated modulus versus indentation depth to identify substrate-influenced regions.
- Validation Measurements:
- Perform measurements on multiple locations with varying biofilm thickness.
- Compare results from different indentation depths to confirm consistency.
- Validate findings with complementary techniques (e.g., confocal microscopy, SEM) when possible.
The Scientist's Toolkit: Essential Materials for Reliable Biofilm AFM
Table 2: Key Research Reagent Solutions for Biofilm AFM Studies
| Material/Reagent | Specification | Function in Biofilm AFM | Example Application |
|---|---|---|---|
| PFOTS-treated Glass | (Perfluorooctyltrichlorosilane) | Creates controlled hydrophobic surface for standardized attachment studies | Analysis of initial bacterial attachment in Pantoea sp. YR343 [1] |
| Type-I Collagen Coatings | Native and glycated forms | Mimics dentin and periodontal tissues for oral biofilm research | Studying Streptococcus mutans biofilm formation [52] |
| qPlus Sensors | Stiffness ≥1 kN/m with electrical detection | Enables high-resolution imaging in opaque biological liquids | Atomic resolution in cell culture medium [50] |
| High-Aspect-Ratio (HAR) Probes | Aspect ratio >5:1 | Accurate imaging of deep biofilm structures and EPS fibers | Resolving honeycomb patterns in bacterial clusters [48] |
| Functionalized Colloidal Probes | Micron-sized spheres with specific chemistry | Controlled mechanical testing with defined contact geometry | Nanomechanical mapping of biofilm elasticity [23] |
Advanced Applications: Large-Area AFM and Machine Learning Integration
Recent technological advances address several fundamental limitations in biofilm characterization:
- Large-Area Automated AFM: Traditional AFM imaging is restricted to small scan areas (<100 μm), making it difficult to capture the spatial complexity of biofilms. Automated large-area AFM approaches now enable high-resolution imaging over millimeter-scale areas, revealing previously obscured heterogeneity and cellular orientation patterns [1].
- Machine Learning Integration: AI-driven algorithms assist with image stitching, cell detection, and classification in large-area AFM datasets. These tools automate extraction of key parameters including cell count, confluency, shape, and orientation across extensive biofilm areas [1].
- qPlus Sensor Technology: Stiff quartz sensors (k ≥ 1 kN/m) with electrical detection enable high-resolution imaging in biologically-relevant environments, including opaque cell culture media that would problematic for optical detection systems [50].
Differentiating soft biological samples from substrate effects requires meticulous experimental design, appropriate control measurements, and critical data interpretation. The protocols outlined herein provide a framework for obtaining reliable, reproducible AFM data from biofilm systems under physiologically relevant conditions. By implementing rigorous calibration procedures, optimizing imaging parameters specifically for soft materials, applying appropriate mechanical models, and utilizing advanced AFM modalities, researchers can effectively minimize interpretation pitfalls and extract meaningful biological insights from their nanoscale investigations.
Atomic force microscopy (AFM) enables the nanoscale characterization of biofilm structure and function under physiologically relevant conditions, providing insights unobtainable with other techniques. However, biofilm heterogeneity—comprising soft extracellular polymeric substances (EPS), rigid bacterial cells, and flagellar appendages—poses a significant challenge for AFM imaging. This application note provides a structured framework for optimizing AFM scan parameters to balance spatial resolution with imaging speed when investigating biofilms in liquid environments. We detail operational modes, parameter selection criteria, and experimental protocols to achieve reproducible, high-quality data from these complex biological systems.
AFM Mode Selection for Biofilm Characterization
Selecting the appropriate imaging mode is fundamental to successful biofilm characterization. Each mode offers distinct trade-offs between resolution, sample preservation, and acquisition speed, making certain modes better suited for specific aspects of biofilm analysis.
Table 1: AFM Mode Selection for Biofilm Imaging in Liquids
| AFM Mode | Principles & Mechanisms | Best For Biofilm Applications | Key Advantages | Key Limitations/Liability |
|---|---|---|---|---|
| Intermittent Contact (Tapping) Mode [53] [54] | Tip intermittently contacts surface, minimizing lateral forces. | High-resolution topography of hydrated biofilm structures [54]. |
|
|
| Force Spectroscopy/Volume [53] [23] | Collects force-distance curves at each pixel to map mechanical properties. | Nanomechanical mapping of stiffness (Young's modulus) and adhesion across heterogeneous biofilm regions [23]. |
|
|
| Force Modulation [53] | Applies high-frequency oscillation to tip while in contact; measures sample response. | Differentiating mechanical properties of EPS and cell surfaces [53]. |
|
|
| Large-Area Automated AFM [1] | Automates collection and stitching of multiple high-resolution images. | Linking cellular-scale features (e.g., flagella) to millimeter-scale biofilm architecture [1]. |
|
|
Core Optimization Parameters and Experimental Protocol
Parameter Optimization Guidelines
Achieving optimal image quality requires careful balancing of key operational parameters. The following workflow provides a systematic approach for parameter adjustment on a heterogeneous biofilm sample.
Detailed Experimental Protocol for Biofilm Nanomechanics
This protocol outlines the steps for measuring the cohesive strength and Young's modulus of a hydrated biofilm using a combination of force spectroscopy and abrasion methods.
Title: Protocol for In Situ Nanomechanical Characterization of Hydrated Biofilms. Primary Application: Quantifying spatial variations in biofilm cohesive energy and elastic modulus under physiological conditions [19]. Sample Preparation: Grow biofilms on relevant substrates (e.g., glass, stainless steel) in a reactor system. For measurement, equilibrate a ~1 cm² biofilm sample in a humidity chamber (e.g., ~90% RH) for one hour to maintain consistent hydration without excess liquid [19]. AFM Setup:
- Instrument: AFM with a humidity-controlled chamber or liquid cell.
- Cantilever: Use a soft, V-shaped silicon nitride cantilever (e.g., nominal spring constant, ( k \approx 0.03 - 0.6 ) N/m) [19] [54].
- Calibration: Calibrate the cantilever's spring constant and the optical lever sensitivity prior to measurement.
Procedure:
- Topographical Imaging:
- Mount the hydrated biofilm sample.
- Engage the surface in Tapping Mode or a low-force Contact Mode.
- Initial Parameters: Set a slow scan rate (e.g., 0.5 Hz), a soft cantilever (0.03 N/m), and a low setpoint to minimize sample disturbance [54].
- Optimize parameters per the workflow in Section 3.1 to obtain a stable, high-resolution topographical image of a region of interest (e.g., 5 × 5 μm).
Cohesive Energy Measurement via Scan-Induced Abrasion [19]:
- Step 2.1: Acquire a non-perturbative topographical image (Image A) of a sub-region (e.g., 5 × 5 μm) at a low applied load (~0 nN).
- Step 2.2: Zoom into a smaller area (e.g., 2.5 × 2.5 μm) within Image A. Perform repeated raster scans (e.g., 4 scans) at an elevated load (e.g., 40 nN) to abrade the biofilm.
- Step 2.3: Return to the low load and acquire a new topographical image (Image B) of the larger 5 × 5 μm area.
- Step 2.4: Subtract Image A from Image B to determine the volume of biofilm displaced.
- Step 2.5: Calculate the cohesive energy (( Ec )) using the frictional energy dissipated during abrasion and the volume displaced: ( Ec = \frac{\text{Energy Dissipated (nJ)}}{\text{Volume Displaced (μm}^3\text{)}} ). This can be repeated at different depths.
Young's Modulus Measurement via Force Spectroscopy:
- Step 3.1: Switch to a force spectroscopy mapping mode (Force Volume).
- Step 3.2: Define a grid of measurement points over a topographical image.
- Step 3.3: Acquire a force-distance curve on each point. Use a sufficient force to achieve a measurable indentation (typically 100-500 nm) but avoid plastic deformation [23].
- Step 3.4: Fit the retraction part of the force curve to an appropriate contact mechanics model (e.g., Hertz, Sneddon, or DMT models) to extract the Young's Modulus (( E )) [23]. The Hertz model is often a suitable first approximation for biological samples.
Reporting: Document all parameters, including cantilever type and spring constant, setpoint, scan rates, applied loads, and the specific contact model used for fitting, to ensure reproducibility [53].
Quantitative Parameter Tables
Optimized Scan Parameters for Different Biofilm Components
Table 2: Empirical Scan Parameters for Heterogeneous Biofilm Features
| Biofilm Feature | Recommended AFM Mode | Scan Size | Scan Rate | Pixel Resolution | Cantilever Spring Constant | Setpoint / Load |
|---|---|---|---|---|---|---|
| EPS Matrix [19] [54] | Tapping Mode in liquid | 1 - 10 μm | 0.5 - 1.0 Hz | 256 × 256 | 0.03 - 0.1 N/m | Low (to minimize deformation) |
| Individual Bacterial Cells [54] | Tapping Mode in liquid | 5 - 20 μm | 0.5 - 1.5 Hz | 512 × 512 | 0.1 - 0.4 N/m | Low to moderate |
| Bacterial Flagella [1] | Tapping Mode or Contact Mode | 1 - 5 μm | 0.3 - 0.8 Hz | 512 × 512 | 0.1 - 0.5 N/m | Very Low |
| Mesoscale Organization [1] | Large-Area Automated AFM | 100 μm - 1 mm (stitched) | Optimized per tile | Varies per tile | 0.2 - 0.5 N/m | Automatically optimized |
| Nanomechanical Map [23] | Force Volume / Nano-DMA | 1 - 5 μm | N/A (dictated by curve rate) | 64 × 64 / 128 × 128 | 0.1 - 0.6 N/m | Set indentation (e.g., 100-500 nm) |
Expected Quantitative Outputs
Table 3: Typical Nanomechanical Properties of Biofilm Components
| Biofilm Component | Young's Modulus (Elasticity) | Cohesive Energy | Adhesion Force | Key Influencing Factors |
|---|---|---|---|---|
| EPS Matrix | 1 kPa - 1 MPa [23] | 0.1 - 2.1 nJ/μm³ [19] | Variable, often high | EPS composition, water content, ionic strength [19]. |
| Bacterial Cell Envelope | 10 kPa - 1 GPa (species-dependent) [23] | N/A | N/A | Cell type, growth phase, environmental stress. |
| Whole Biofilm (Avg.) | 0.1 - 100 kPa [23] | Increases with depth (e.g., 0.1 to 2.05 nJ/μm³) [19] | N/A | Microbial composition, substrate, age, presence of calcium [19]. |
Advanced Integration: Machine Learning and Large-Area Analysis
Advanced computational methods are transforming AFM from a single-image technique into a high-throughput tool for understanding biofilm complexity.
- Machine Learning for Automation: ML algorithms automate tedious processes, including automated region selection to find representative scan areas, and image segmentation, cell detection, and classification from large-area datasets [1]. This drastically reduces user intervention and analysis time.
- Large-Area Automated AFM: This approach automates the collection and stitching of hundreds of high-resolution images, overcoming the traditional field-of-view limitation. It enables the discovery of mesoscale organizational patterns, such as the honeycomb-like cellular arrangements and coordinated flagellar networks observed in Pantoea sp. biofilms, which are previously obscured [1].
The Scientist's Toolkit: Research Reagent Solutions
Table 4: Essential Materials for AFM Biofilm Research
| Item | Specification / Example | Function in Protocol |
|---|---|---|
| Soft Cantilevers | Silicon nitride, nominal ( k ) = 0.03 - 0.5 N/m [54]. | Core transducer; minimizes sample damage and ensures accurate force measurement on soft biofilm components. |
| Liquid Cell / Humidity Chamber | Sealed fluid cell or chamber with humidity control (~90% RH) [19] [54]. | Maintains biofilm hydration and physiological conditions during measurement. |
| Biofilm Reactor | Membrane-aerated biofilm reactor or flow cell [19]. | Grows reproducible, stratified biofilms on suitable substrates for AFM analysis. |
| Calibration Samples | Gratings (for lateral), cleaved mica (for vertical), and reference polymer samples (e.g., PDMS). | Verifies scanner accuracy, tip sharpness, and mechanical property quantification. |
| Image Analysis Software | Software with machine learning modules (e.g., for segmentation) and nanomechanical analysis tools. | Processes large datasets, extracts quantitative parameters (height, volume, modulus), and classifies features. |
Benchmarking Fluid AFM: Correlating Nanoscale Data with Established Biofilm Assays
The resilience of bacterial biofilms contributes significantly to antimicrobial resistance (AMR), with biofilm-associated infections demonstrating up to 1000-fold greater resistance to antimicrobial agents compared to their planktonic counterparts [6]. Traditional biofilm assessment techniques, such as the Microtiter Plate Assay and the Minimum Biofilm Eradication Concentration (MBEC) assay, provide high-throughput data on biofilm biomass and antimicrobial susceptibility but lack the resolution to reveal the underlying nanoscale structural and mechanical determinants of this resilience [6]. Atomic Force Microscopy (AFM) operated in liquid under physiological conditions bridges this gap by enabling high-resolution topographical imaging and nanomechanical mapping of live biofilms in their native state [21] [24].
This Application Note establishes a framework for the cross-platform validation of AFM-based nanomechanics with conventional biofilm assays. We provide detailed protocols for correlating quantitative mechanical properties—such as Young's modulus and adhesion forces—with phenotypic data from MBEC and microtiter plate assays. This integrated approach aims to empower researchers in microbiology and drug development to deconstruct the structure-mechanics-function relationships in biofilms, thereby accelerating the development of novel anti-biofilm strategies.
Comparative Analysis of Biofilm Assessment Techniques
The following table summarizes the core capabilities, outputs, and complementary strengths of AFM, MBEC, and Microtiter Plate assays.
Table 1: Cross-Platform Comparison of Biofilm Assessment Techniques
| Feature | Atomic Force Microscopy (AFM) in Liquid | MBEC Assay | Microtiter Plate Assay |
|---|---|---|---|
| Primary Output | Nanoscale topography & nanomechanical property maps (Young's modulus, adhesion) [21] | Minimum concentration required to eradicate a biofilm [6] | Semi-quantitative measure of total biofilm biomass [6] |
| Key Metrics | Young's Modulus (kPa or MPa), adhesion force (nN), surface roughness (nm) [21] [55] | MBEC value (µg/mL) [6] | Optical Density (OD) or Absorbance (e.g., at 570 nm) [6] |
| Resolution | Nanometer-scale (subcellular) [1] [24] | Population-average | Population-average |
| Throughput | Low (manual or semi-automated) | Medium to High | High |
| Sample Environment | Physiological conditions (liquid buffer, native state) [21] [24] | Static or dynamic exposure to antimicrobials | Growth medium in well plates |
| Key Advantage | Reveals structural heterogeneity and mechanical properties of live biofilms without fixation [21] | Quantifies biofilm-specific tolerance to antimicrobials [6] | Simple, cost-effective, and adaptable for high-throughput screening [6] |
Experimental Protocols
Protocol 1: AFM Nanomechanical Mapping of Biofilms under Physiological Conditions
This protocol details the procedure for characterizing the nanomechanical properties of live biofilms using AFM in liquid, building on methods validated for organisms like Rhodococcus wratislaviensis and Pantoea sp. [21] [1].
Key Research Reagent Solutions:
- Indium-Tin-Oxide (ITO)-coated glass substrates: Provides a smooth, hydrophobic surface that promotes bacterial adhesion without chemical immobilization, enabling stable imaging in liquid [21].
- Liquid Culture Medium: Use the appropriate growth medium specific to the bacterial strain being studied to maintain physiological conditions during AFM imaging [21].
- Quantitative Imaging (QI) Mode AFM probes: Sharp, cantilevered probes (e.g., PPP-CONTPt, stiffness ~0.3 N/m) are essential for high-speed force mapping with minimal lateral forces [21].
Procedure:
- Sample Preparation: Grow the biofilm of interest directly on a sterile ITO-coated glass substrate placed in a culture dish. After a designated incubation period, gently rinse the substrate with a fresh buffer or culture medium to remove non-adherent planktonic cells. Do not use chemical fixatives or dehydrating agents [21].
- AFM Setup: Mount the substrate with the adhered biofilm into the AFM liquid cell. Carefully add the appropriate liquid medium to submerge the sample. Employ an AFM equipped with a temperature control stage, maintaining it at 24.0 ± 0.2°C or the optimal growth temperature for the organism [21].
- Data Acquisition: Engage the AFM probe in Quantitative Imaging (QI) Mode or a similar force mapping mode. Set a total extension of 600 nm at a constant speed of 125 µm/s. Acquire a grid of force-distance curves (e.g., 64x64 pixels) over regions of interest to generate spatially resolved mechanical maps [21].
- Data Analysis: Fit the retraction part of the force-distance curves using the Sneddon model for a conical indenter to calculate the Young's modulus (E) at each pixel. Use the following modified Sneddon equation, where F is force, δ is indentation, α is the semi-top angle of the tip, and ν is the Poisson's ratio (typically assumed to be 0.5 for biological samples) [21]: F = (2/π) * [E / (1-ν²)] * tan(α) * δ²
- Image Stitching (for large areas): For millimeter-scale analysis, use an automated large-area AFM approach with machine learning-based algorithms to stitch multiple high-resolution images seamlessly, capturing spatial heterogeneity [1].
Protocol 2: Minimum Biofilm Eradication Concentration (MBEC) Assay
This protocol determines the lowest concentration of an antimicrobial agent required to eradicate a biofilm.
- Procedure:
- Biofilm Growth: Grow a standardized biofilm in the wells of a 96-well microtiter plate for 24-48 hours.
- Antimicrobial Challenge: Gently rinse the biofilm to remove planktonic cells. Add a series of two-fold dilutions of the antimicrobial agent in fresh medium to the wells. Include growth and sterility controls. Incubate for a predetermined period (e.g., 24 hours).
- Biofilm Recovery & Viability Assessment: Remove the antimicrobial solution and rinse the biofilm. Disrupt the biofilm by sonication or vigorous pipetting. Serially dilute the disrupted biofilm suspension and plate on solid agar medium. Incubate the plates and enumerate the Colony Forming Units (CFU). The MBEC is the lowest antimicrobial concentration that results in no growth [6].
Protocol 3: Microtiter Plate Assay for Biofilm Biomass
This is a high-throughput, colorimetric method for quantifying adherent biofilm biomass, commonly using crystal violet staining.
- Procedure:
- Biofilm Growth & Staining: Grow biofilms in a microtiter plate. After incubation, remove the medium and gently wash the wells with water or PBS to remove non-adherent cells. Air-dry the plate and stain the adherent biomass with a 0.1% crystal violet solution for 15-20 minutes.
- Destaining & Quantification: Rinse the stained plate thoroughly to remove excess dye. Add a destaining solution (e.g., 30% acetic acid in water or ethanol) to solubilize the crystal violet bound to the biofilm and extracellular matrix.
- Measurement: Transfer the solubilized dye to a new plate (if necessary) and measure the absorbance at 570 nm using a plate reader. Higher absorbance correlates with a greater amount of adherent biofilm biomass [6].
Correlative Workflow and Data Integration
A robust correlation between AFM mechanics and conventional assays requires an integrated experimental workflow. The diagram below illustrates the pathway from parallel sample preparation to data synthesis.
Diagram 1: Integrated Experimental Workflow for Cross-Platform Biofilm Analysis
Framework for Data Correlation
The relationship between the data generated by the three techniques forms the core of the validation. The following diagram maps the logical connections between nanomechanical properties and phenotypic assay outcomes.
Diagram 2: Logical Relationships Between Nanomechanics and Biofilm Phenotype
Interpreting correlated data involves several key hypotheses:
- Increased Matrix Production: A significant increase in biofilm biomass (from microtiter assay) coupled with a decrease in average Young's modulus (softer biofilm from AFM) may indicate the production of a hydrous, gel-like extracellular polymeric substance (EPS). This softer, more abundant matrix can act as a diffusion barrier, potentially leading to a higher MBEC [6] [24].
- Treatment Effects: A successful anti-biofilm treatment might be indicated by a reduction in biomass (microtiter), a lower MBEC, and a concurrent increase in biofilm stiffness observed via AFM, suggesting collapse or compaction of the EPS matrix and loss of structural integrity [24].
- Spatial Heterogeneity: AFM's strength lies in identifying sub-populations within a biofilm. Regions with unusually high or low stiffness may represent sub-populations of cells with different metabolic states or local matrix compositions, which could be critical for understanding the basis of tolerance measured in the bulk MBEC assay [1].
The Scientist's Toolkit: Essential Research Reagents and Materials
Table 2: Key Reagent Solutions for Integrated Biofilm Analysis
| Item | Function/Application |
|---|---|
| ITO-coated Glass Substrates | Provides an optimal surface for AFM imaging of live, non-immobilized biofilms in liquid, ensuring minimal perturbation [21]. |
| Quantitative Imaging (QI) AFM Probes | Specialized cantilevers for high-speed, high-resolution nanomechanical mapping with minimal sample damage [21]. |
| Crystal Violet Solution (0.1%) | A classic dye for staining and semi-quantitatively measuring total adherent biofilm biomass in microtiter plate assays [6]. |
| 96-well Polystyrene Microtiter Plates | The standard platform for high-throughput biofilm cultivation for both MBEC and biomass assays [6]. |
| Automated Large-Area AFM with ML | Advanced system that overcomes the limited scan range of conventional AFM, enabling millimeter-scale analysis of biofilm heterogeneity [1]. |
The synergistic use of AFM nanomechanics, MBEC, and microtiter plate assays provides a more comprehensive understanding of biofilm physiology and resistance than any single method alone. AFM reveals the nanoscale structural and mechanical underpinnings, while MBEC and microtiter assays contextualize these findings within established phenotypic frameworks. The protocols and correlation frameworks outlined in this Application Note provide a validated roadmap for researchers to uncover novel insights into biofilm resilience, paving the way for targeted therapeutic interventions against biofilm-associated infections.
Biofilms are structured communities of microbial cells encased in a self-produced extracellular polymeric substance (EPS) that confer resistance to antimicrobial agents, making associated infections challenging to treat [56]. Their resilience is a significant concern in medical, industrial, and environmental contexts, with biofilm-based cells exhibiting up to 1000 times greater tolerance to antibiotics compared to their planktonic counterparts [57]. This case study details the application of Atomic Force Microscopy (AFM) under physiological fluid conditions to validate the anti-biofilm efficacy of novel agents, focusing on bacteriophages and nanoparticles. AFM provides unparalleled nanoscale resolution for topographical imaging and nanomechanical property mapping of biofilms in their native, hydrated state, offering profound insights into the structural and functional disruptions caused by novel antimicrobials [1] [54] [58].
Quantitative Efficacy of Featured Anti-Biofilm Agents
The following table summarizes the performance of several advanced anti-biofilm agents as reported in recent studies, providing a benchmark for efficacy validation.
Table 1: Quantitative Efficacy of Novel Anti-Biofilm Agents
| Anti-Biofilm Agent | Target Biofilm | Key Experimental Conditions | Efficacy Outcomes | Citation |
|---|---|---|---|---|
| Phage-Inorganic Hybrid Magnetic Nanoflowers (T7-NH2MNPs@Cu NFs) | Generic bacterial biofilm | 2 hours of treatment; magnetically controlled physical disruption. | >5-log reduction in biofilm bacteria. | [59] |
| Engineered M13 Phage-Silver Nanoparticle Complexes (AgNP@Li5) | Specific E. coli strains (TG1, F-, O157:H7). | Selective targeting via displayed phage peptides. | Demonstrated targeted antibacterial activity; MIC values corresponded to 1:16 dilution for TG1 and F- strains. | [60] |
| Green Tea Extract-capped Silver Nanoparticles (G-TeaNPs) & Phage Cocktail | Staphylococcus aureus biofilm. | 3 hours of co-incubation. | ~70% bacterial survival with phage alone; ~80% with G-TeaNPs alone; reduced to ~30% with the combination. | [61] |
| Bacteriophage Endolysin (LysSte134_1) | Staphylococcus aureus biofilm. | Treatment of established biofilm; activity enhanced by Zn²⁺ ions. | 50-fold reduction (approx. 1.7-log) in colony-forming units. | [56] |
Experimental Protocol: AFM-Based Validation of Anti-Biofilm Efficacy
This integrated protocol combines the standardized Biofilm Surface Test Protocol (BSTP) for efficacy testing with high-resolution AFM for structural and mechanical analysis under physiological conditions [57] [1] [54].
Phase 1: Cultivating a Relevant Biofilm Model
1. Surface Preparation:
- Select a relevant substrate (e.g., medical device material, glass coverslip, electrospun gelatin-glucose matrix to mimic artificial skin) [62] [57].
- For complex models, pre-condition surfaces with biorelevant fluids like serum, artificial urine, or artificial mucous for at least 1 hour at 37°C to simulate the host environment [57].
- Immobilize the test surfaces to the lid of a multi-well plate using a biocompatible adhesive to facilitate processing.
2. Inoculation and Growth:
- Prepare a microbial suspension of the target organism(s) (e.g., Staphylococcus aureus, Pseudomonas aeruginosa, or dual-species communities) in an appropriate growth medium like DMEM/F-12 supplemented with 10% fetal bovine serum [62].
- Transfer the immobilized test surfaces to the wells containing the inoculum.
- Incubate under static or mild agitation conditions for 24-48 hours at 37°C to allow for mature biofilm formation. Replace the medium every 24 hours for nutrients [62] [57].
Phase 2: Treatment with Novel Anti-Biofilm Agents
1. Agent Application:
- Prepare fresh dilutions of the novel anti-biofilm agent (e.g., phage-nanorobot suspension, phage/nanoparticle cocktail) in a relevant challenge matrix (e.g., PBS, growth medium).
- Carefully aspirate the spent medium from the biofilm-grown surfaces and add the treatment solution.
- Incubate for the desired treatment time (e.g., 2 to 3 hours at 37°C) [59] [61].
2. Control Groups:
- Include appropriate controls: an untreated biofilm (negative control) and a biofilm treated with a known antimicrobial (positive control).
Phase 3: Assessing Efficacy and Structural Damage
1. Conventional Efficacy Analysis (BSTP):
- Post-treatment, gently rinse the surfaces with a neutralizer solution to stop antimicrobial action and remove non-adherent cells.
- Transfer each biofilm-covered surface to a vial containing recovery medium (e.g., PBS with glass beads) and vortex vigorously to disaggregate and suspend the biofilm.
- Serially dilute the suspension, plate on selective agar, and incubate to quantify viable cells as Log10 CFU (Colony Forming Units) per surface [57].
- Calculate the Log10 Reduction in viable cells compared to the untreated control.
2. AFM Imaging and Nanomechanical Analysis under Physiological Conditions:
- Sample Preparation: For AFM, a small section of the biofilm-grown surface (pre- and post-treatment) should be mounted in a liquid cell. Maintain hydration at all times using an appropriate buffer (e.g., PBS) to image under physiological conditions [54] [58].
- AFM Instrument Setup:
- Use a soft cantilever (~0.03 N/m spring constant) to minimize sample damage.
- Set a slow scan rate (~0.5 Hz) to improve resolution on the soft, compliant biofilm.
- Operate in tapping mode in fluid to minimize lateral forces and preserve the native biofilm structure [54].
- Data Acquisition:
- High-Resolution Topography: Capture images of multiple, random locations to assess structural integrity, EPS deformation, and cellular lysis. Automated large-area AFM stitching can link nanoscale features to millimeter-scale biofilm architecture [1].
- Nanomechanical Mapping: Use force spectroscopy mode. Approach the tip to the surface at multiple points to obtain force-distance curves. Fit these curves with appropriate models (e.g., Hertz model) to quantify Young's modulus (stiffness) and adhesion forces, which can reveal biofilm weakening post-treatment [58].
Figure 1: Integrated workflow for validating anti-biofilm efficacy, combining conventional microbiology with advanced AFM characterization.
The Scientist's Toolkit: Essential Research Reagents & Materials
Successful execution of this protocol requires specific reagents and instruments to ensure biorelevance and high-quality data.
Table 2: Essential Research Reagents and Materials
| Item Category | Specific Examples & Specifications | Critical Function in the Protocol |
|---|---|---|
| Biofilm Growth Substrate | Medical-grade polymers; Electrospun Gelatin-Glucose (Gel-Gluc) matrix [62]; PFOTS-treated glass [1]. | Provides a biorelevant surface for consistent and robust biofilm formation, mimicking clinical or environmental conditions. |
| Culture Media & Supplements | Dulbecco’s Modified Eagle Medium (DMEM/F-12); Fetal Bovine Serum (FBS) [62]; Lysogeny Broth (LB). | Supports microbial growth and biofilm development. Serum can be used to pre-condition surfaces. |
| Novel Anti-Biofilm Agents | Phage-inorganic hybrid nanoflowers [59]; Engineered phage-AgNP complexes [60]; Phage/nanoparticle cocktails [61]. | The test interventions whose efficacy is being validated. They often combine biological and chemical mechanisms of action. |
| Atomic Force Microscope | System capable of liquid-cell imaging and force spectroscopy; Soft cantilevers (0.03 N/m) [54]. | Enables high-resolution topographical and nanomechanical characterization of biofilms in a native, hydrated state. |
| Analytical Tools & Reagents | Selective agar (e.g., Mannitol Salt Agar for S. aureus) [62]; Neutralizer solutions; Glass beads for vortexing. | Allows for the quantification of viable bacteria (CFU) and ensures accurate efficacy measurements. |
Advanced AFM Imaging Protocol for Biofilms in Fluid
The following diagram and text detail the specific AFM imaging procedure for analyzing biofilms under physiological conditions.
Figure 2: AFM imaging and analysis workflow for biofilms under physiological fluid conditions.
Procedure Details:
- Sample Mounting: A hydrated biofilm sample, prepared as in Section 3.3, is mounted in the AFM liquid cell. The buffer used should mimic physiological conditions (e.g., PBS) to maintain biofilm viability and structure [58].
- AFM Setup: Install a soft cantilever (nominal spring constant of ~0.03 N/m) to prevent sample damage. Engage the system in tapping mode in fluid, which oscillates the tip to minimize shear forces during scanning, preserving the delicate EPS matrix [54].
- Data Acquisition:
- High-Resolution Topography Imaging: Set a slow scan rate (e.g., 0.5 Hz) and capture images over multiple areas. For large-scale analysis, automated large-area AFM with machine learning-based stitching can be employed to create seamless, high-resolution maps over millimeter-scale areas, revealing patterns like honeycomb structures and flagellar interactions previously obscured [1].
- Nanomechanical Force Mapping: Switch to force spectroscopy mode. Obtain force-distance curves on a grid of points across the biofilm surface. These curves measure the sample's indentation by the tip under a known force.
- Data Analysis:
- 3D Topography: Analyze images for qualitative and quantitative structural changes, such as biofilm roughness, porosity, and the presence of lysed cells post-treatment.
- Mechanical Properties: Fit the force-distance curves with the Hertz model to calculate Young's modulus (E), a measure of stiffness. Treatment with effective agents often results in a significant reduction in biofilm stiffness, indicating structural compromise [58].
The combination of standardized efficacy testing with the high-resolution, physiologically relevant analytical power of AFM provides a robust framework for validating novel anti-biofilm agents. This case study demonstrates that advanced materials like phage-hybrid nanorobots and engineered nanoparticle complexes achieve rapid and significant biofilm eradication, as quantified by both traditional CFU counts and direct nanoscale visualization. The detailed protocols outlined here equip researchers with a comprehensive methodology to critically assess the performance of next-generation antimicrobials, accelerating their development from benchtop to clinical application.
Atomic force microscopy (AFM) has emerged as a powerful tool for characterizing the structural and mechanical properties of biofilms under physiologically relevant conditions. This application note details how high-resolution in vitro AFM data serves as a critical foundation for informing and validating ex vivo and in vivo biofilm models. We present standardized protocols for cross-model experimentation, enabling researchers in biofilm research and drug development to translate nanoscale discoveries into clinically relevant therapeutic insights.
Biofilms are complex microbial communities whose resilience is influenced by structural heterogeneity and mechanical properties at the cellular scale. Atomic Force Microscopy (AFM) operated in fluids provides unique topographical and nanomechanical data under physiological conditions, offering insights unobtainable with other techniques [1]. However, a significant challenge exists in bridging detailed in vitro findings with the increased complexity of ex vivo and in vivo models.
This document provides a structured framework for leveraging in vitro AFM data to enhance the design and interpretation of experiments in more complex models. By establishing a standardized workflow from simplified systems to biologically relevant environments, researchers can more effectively probe biofilm assembly, pathogenicity, and response to antimicrobial agents, thereby accelerating the development of novel therapeutic strategies.
Research Reagent Solutions
Essential materials and reagents for conducting AFM-based biofilm studies across different model systems are listed below.
Table 1: Essential Research Reagents and Materials
| Item | Function/Application | Example Specifications |
|---|---|---|
| Spherical AFM Probe | Nanomechanical mapping of soft biological samples; increased contact area prevents tissue damage [63] [64]. | Borosilicate glass or polystyrene, diameter: 5-10 µm, spring constant: ~0.01-0.03 N/m (soft cantilevers) [63] [65]. |
| PFOTS-Treated Glass | Hydrophobic surface for studying early-stage bacterial attachment and biofilm assembly in in vitro models [1]. | Glass coverslips treated with (Heptadecafluoro-1,1,2,2-tetrahydrooctyl)trichlorosilane. |
| Electrospun Fibrous Matrices | In vitro and ex vivo biofilm growth substrate mimicking wound dressing materials and tissue structures [66]. | Polycaprolactone (PCL), Poly(ethylene oxide) (PEO), or gelatin-glucose (GEL-Glu) matrices. |
| Ex Vivo Tissue Substrates | Biologically relevant surface for biofilm growth, bridging the gap between in vitro and in vivo models [66] [67]. | Porcine or canine skin explants, often with superficial burn wounds. |
| Cryo-Embedding Medium (OCT) | For snap-freezing and cryosectioning tissues for ex vivo AFM analysis, preserving structural and mechanical properties [63]. | Optimal Cutting Temperature (OCT) compound. |
| Fluorescent Tracer (FITC-Albumin) | Enables identification of compromised tissue regions (e.g., ischemic brain areas) for targeted AFM measurements in ex vivo models [64]. | Fluorescein Isothiocyanate-conjugated albumin. |
Protocol: An Integrated Workflow from In Vitro to Ex Vivo Analysis
This protocol outlines the key steps for utilizing in vitro AFM to guide mechanical analysis in complex ex vivo models.
In Vitro AFM on Bacterial Biofilms
Objective: To establish a baseline understanding of bacterial cell morphology, adhesion, and nanomechanics on a controlled surface [1] [68].
Sample Preparation:
- Use PFOTS-treated glass coverslips as a standardized hydrophobic substrate [1].
- Inoculate with the bacterial strain of interest (e.g., Pantoea sp. YR343) suspended in a suitable growth medium.
- Incubate for a defined period (e.g., 30 minutes to 6 hours) to study early attachment and microcolony formation.
- Gently rinse with buffer (e.g., PBS) to remove non-adherent cells. Air-dry or maintain in liquid for imaging [1].
Automated Large-Area AFM Imaging:
- Utilize an AFM system equipped with a large-area scanner and automation software.
- Employ a soft cantilever (nominal spring constant ~0.01 N/m) with a spherical tip (e.g., 10 µm diameter) for mechanical integrity [63].
- Acquire multiple high-resolution images (e.g., 50x50 µm) over a millimeter-scale area. Use minimal overlap between scans to maximize acquisition speed [1] [68].
- Perform all imaging in an appropriate liquid medium to maintain physiological conditions.
Data Analysis with Machine Learning:
- Image Stitching: Use integrated algorithms to create a seamless, large-area topographic map [1].
- Feature Detection: Apply machine learning models for automated cell detection, classification, and extraction of quantitative parameters [1] [68].
- Key Parameters: Quantify cellular dimensions (length, diameter), surface coverage (confluency %), and observe the presence and organization of extracellular appendages like flagella [1].
Ex Vivo AFM on Tissue-Biofilm Constructs
Objective: To characterize biofilm formation and its biomechanical impact on a biologically relevant tissue substrate [66] [67].
Ex Vivo Model Preparation:
- Tissue Acquisition: Obtain fresh, sterile porcine or canine skin explants. A superficial burn wound can be induced to mimic a compromised tissue environment [66] [67].
- Biofilm Inoculation: Apply the bacterial pathogen directly onto the tissue surface and incubate in a humidified chamber for 24-48 hours to allow biofilm development [66].
- Cryosectioning: Embed the tissue in OCT compound, snap-freeze, and section into thin slices (10-20 µm thick) using a cryostat [63]. Wash slides to remove OCT prior to AFM.
Correlative Fluorescence and AFM:
- Target Identification: Use fluorescence microscopy (e.g., FITC-albumin signal for ischemic regions or stained bacterial cells) to locate specific regions of interest (ROIs) on the tissue section [64].
- AFM Force Mapping: On the identified ROIs, perform force-volume mapping. This involves acquiring a raster scan of force-displacement curves over a defined grid (e.g., 40x40 µm area with a 4x4 or higher point grid) [63] [64].
- Measurement Parameters: Use a spherical probe. Set a maximum force of 7.5 nN, a approach velocity of 20 µm/s, and a data point spacing of 10 µm [64].
Robust Data Analysis Pipeline:
- Curve Fitting: Fit a Hertz contact model to each force-indentation curve to calculate the local Young's modulus (E), a measure of tissue stiffness [63] [64].
- Data Cleaning: Exclude outliers resulting from measurements on voids, debris, or excessively rough areas [63].
- Statistical Summary: Log-transform the data to manage non-normal distributions common in heterogeneous biological samples. Report the median and interquartile range (25th/75th percentiles) for each ROI [63] [64].
Data Integration and Analysis
The quantitative data extracted from in vitro and ex vivo models should be systematically compared to draw meaningful conclusions about biofilm behavior in different environments.
Table 2: Key AFM-derived Parameters for Cross-Model Comparison
| Parameter | In Vitro Model (PFOTS Glass) | Ex Vivo Model (Tissue Explant) | Bridging the Gap: Interpretation |
|---|---|---|---|
| Young's Modulus | Single-cell stiffness: ~1-100 kPa (Bacteria). Measures intrinsic mechanical properties of surface-attached cells [1]. | Tissue stiffness: ~0.1-5 kPa (Naive brain); can increase in ischemia [64]. | Contrast reveals mechanical interaction between biofilm and soft tissue (e.g., cell swelling, ECM remodeling). |
| Surface Roughness | Controlled, low roughness of engineered substrate [69]. | High, native roughness of biological tissue [66]. | Highlights role of tissue topology in guiding bacterial attachment and biofilm architecture. |
| Cellular Orientation | Can show preferred, ordered patterns (e.g., "honeycomb") [1] [68]. | Likely disordered, influenced by tissue microstructures. | Ordered in vitro patterns may signify inter-cellular coordination, absent in complex ex vivo environment. |
| Flagellar Presence | Clearly visible, can be mapped interacting with surface/other cells [1]. | Difficult to resolve within dense tissue and EPS matrix. | In vitro data confirms flagellar expression, suggesting their potential role in ex vivo colonization despite being obscured. |
Visualizing the Experimental Workflow
The following diagram summarizes the logical flow of information from sample preparation through to data integration, illustrating how each step connects to bridge the model systems.
The study of bacterial biofilms, complex microbial communities encased in a self-produced extracellular polymeric substance (EPS), is crucial across medical, environmental, and industrial fields [70]. A significant challenge in this research is characterizing biofilm structure, assembly, and mechanical properties under physiologically relevant conditions—namely, in liquid environments that maintain native biofilm physiology [1] [21]. This application note provides a comparative analysis of Atomic Force Microscopy (AFM) against established techniques like Scanning Electron Microscopy (SEM) and Confocal Laser Scanning Microscopy (CLSM), and situates it alongside emerging biosensing technologies. Framed within a broader thesis investigating AFM in fluid under physiological conditions for biofilm research, this document provides detailed protocols and a structured toolkit to guide researchers and drug development professionals in selecting and implementing the most appropriate characterization strategies.
Table 1: Core Technique Comparison for Biofilm Characterization
| Feature | Atomic Force Microscopy (AFM) | Scanning Electron Microscopy (SEM) | Confocal Laser Scanning Microscopy (CLSM) |
|---|---|---|---|
| Maximum Resolution | Sub-nanometer (vertical), <1 nm to a few nm (lateral) [71] [72] | 1-10 nm (lateral) [71] [72] | ~200 nm (lateral), limited by light diffraction [70] |
| Imaging Dimensionality | True 3D Topography [73] | 2D Projection (pseudo-3D) [73] | 3D Optical Sections [70] |
| Operational Environment | Vacuum, air, liquid (physiological conditions) [73] [21] | High vacuum typically (except ESEM) [73] [71] | Air or liquid (with specialized chambers) [70] |
| Sample Preparation | Minimal; no fixation or coating required [71] [74] | Extensive; dehydration, fixation, conductive coating [73] [71] | Moderate; may require fluorescent staining [70] |
| Primary Biofilm Data | Nanoscale topography, nanomechanical properties (stiffness, adhesion), molecular interactions [1] [23] | High-depth-of-field surface morphology, ultrastructure [73] | 3D architecture, cell viability, spatial organization of labeled components [70] |
| Live Cell Imaging | Excellent (in liquid) [21] | Poor (requires vacuum) [74] | Good (with viable dyes) [70] |
Detailed Technique Analysis and Protocols
Atomic Force Microscopy (AFM) in Biofilm Research
AFM operates by scanning a sharp probe attached to a flexible cantilever across a sample surface. The probe interacts with surface forces, and a laser system detects cantilever deflection, generating a topographical map and enabling the measurement of nanomechanical properties [71] [75]. Its unparalleled ability to operate in liquid environments makes it uniquely suited for investigating biofilms under physiological conditions, providing insights into their structural and functional properties at the cellular and sub-cellular level [1] [21].
Key Strengths:
- True 3D Quantification: AFM provides quantitative, three-dimensional topographical data with sub-nanometer vertical resolution, enabling precise measurement of biofilm height, roughness, and volume [73] [72].
- Nanomechanical Property Mapping: AFM can map mechanical properties like Young's modulus (stiffness), adhesion, and viscoelasticity, which are critical for understanding biofilm stability and resistance [1] [23]. For example, a lower Young's modulus in bacterial nanotubes suggests flexibility, underscoring their role in intercellular communication [21].
- Minimal Sample Preparation: Biofilms can be imaged in their native, hydrated state without the need for fixation, dehydration, or conductive coatings that can introduce artifacts [71] [74].
- Single-Cell and Molecular Force Spectroscopy: Using a single cell or molecule attached to the cantilever, AFM can quantify the minute adhesive forces between a bacterium and an implant surface or other cells, providing deep insights into biofilm initiation and adhesion strength [76].
Key Limitations:
- Limited Field of View: Conventional AFM has a relatively small imaging area (typically <100×100 μm), restricting the analysis of large, heterogeneous biofilm structures [1] [72].
- Slow Scanning Speed: Image acquisition can take several minutes, making it challenging to capture very rapid dynamic processes [72].
- Surface Sensitivity: The technique requires samples to be firmly attached to a substrate and is sensitive to surface contaminants [72].
Protocol: AFM for Nanomechanical Mapping of Live Biofilms in Liquid
Title: Nanomechanical Mapping of Bacterial Nanotubes in Liquid Using Quantitative Imaging (QI) Mode.
Background: This protocol details the procedure for visualizing and mechanically characterizing intercellular structures like nanotubes on living bacteria in physiological conditions, a key for understanding communication and material transfer within biofilms [21].
Reagents and Equipment:
- Atomic Force Microscope (e.g., JPK Nanowizard, Bruker Multimode) equipped with a liquid cell [21].
- AFM probes (e.g., PPP-CONTPt, Nanosensors; nominal spring constant ~0.3 N/m) [21].
- Indium-Tin-Oxide (ITO) coated glass substrates [21].
- Liquid growth medium appropriate for the bacterial strain (e.g., for Rhodococcus wratislaviensis) [21].
- Bacterial culture in exponential growth phase.
Procedure:
- Sample Preparation: Pipette 500 μL of bacterial culture in exponential growth phase onto an ITO-coated glass substrate. Allow cells to adhere for a designated time (e.g., 30 minutes) [21]. Note: The hydrophobic nature of ITO facilitates better bacterial adhesion without chemical or mechanical immobilization, preserving native cell physiology [21].
- AFM Setup: Assemble the liquid cell on the AFM. Carefully inject fresh, pre-warmed liquid growth medium to submerge the sample. Select a cantilever and calibrate its spring constant in fluid.
- System Engagement: Use an optical microscope integrated with the AFM to locate a region of interest with well-spaced bacterial cells. Engage the AFM tip onto the substrate near the cells.
- QI Mode Imaging: Set imaging parameters for Quantitative Imaging mode:
- Total extension: 600 nm
- Constant speed: 125 μm/s
- Imaging setpoint: Minimal force to maintain contact (e.g., 0.5-1 nN)
- Pixel resolution: 64 x 64 or higher for detail [21].
- Data Acquisition: Initiate the scan. The QI mode will rapidly acquire force-distance curves at every pixel in the image, simultaneously capturing topographical and nanomechanical data.
- Data Analysis: Use the instrument's software and a Hertz/Sneddon contact mechanics model to process the force curves. Generate maps of topographical height and Young's modulus. Analyze approach curves to calculate the Young's modulus of specific features, such as the bacterial cell body and connecting nanotubes [21].
AFM Nanomechanical Mapping Workflow
Scanning Electron Microscopy (SEM)
SEM generates images by scanning a focused electron beam across a sample and detecting secondary or backscattered electrons. It excels in providing high-resolution images with a large depth of field, making it ideal for visualizing the complex 3D morphology of dehydrated biofilms [73] [71].
Key Strengths:
- High Resolution and Depth of Field: Reveals intricate surface details and the overall architecture of biofilms over relatively large areas [73].
- Rapid Imaging: Faster image acquisition compared to AFM, allowing for quicker screening of samples [72].
- Elemental Analysis: Can be equipped with Energy-Dispersive X-ray Spectroscopy (EDS) for elemental composition analysis [73] [75].
Key Limitations:
- Vacuum Requirement: The high-vacuum environment is incompatible with hydrated, living biofilms [73] [71].
- Extensive Sample Preparation: Requires chemical fixation, dehydration, and conductive coating (e.g., gold, platinum), which can distort delicate biofilm structures and introduce artifacts [1] [74].
- No Native Mechanical Data: Provides only morphological information without quantitative mechanical properties [73].
Protocol: SEM Preparation for Biofilm Ultrastructure
Title: Standard Sample Preparation for SEM Imaging of Biofilm Morphology.
Background: This protocol aims to preserve the structural integrity of biofilm samples for high-resolution surface imaging in a vacuum environment.
Reagents and Equipment:
- Glutaraldehyde solution (2.5% in buffer)
- Ethanol or acetone for dehydration
- Critical point dryer
- Sputter coater
- Conductive adhesive tape
Procedure:
- Fixation: Immerse the biofilm-covered substrate in a 2.5% glutaraldehyde solution (in an appropriate buffer, e.g., cacodylate) for several hours at 4°C to cross-link and stabilize the structure.
- Dehydration: Gradually dehydrate the sample through a series of ethanol solutions (e.g., 30%, 50%, 70%, 90%, 100%) to remove all water.
- Critical Point Drying: Transfer the sample to a critical point dryer to replace the ethanol with liquid CO₂, then remove the CO₂ under supercritical conditions. This avoids surface tension artifacts caused by air-drying.
- Mounting and Coating: Mount the dried sample on a stub using conductive tape. Sputter-coat the sample with a thin layer (a few nanometers) of gold or platinum to render it conductive.
- SEM Imaging: Insert the sample into the SEM vacuum chamber and acquire images using secondary electron detectors.
Confocal Laser Scanning Microscopy (CLSM) and Emerging Biosensors
CLSM uses a laser to scan a focused beam across a sample, with a pinhole to eliminate out-of-focus light, enabling the collection of sharp optical sections from various depths. These sections can be reconstructed into 3D models of the biofilm [70]. It is particularly powerful for visualizing spatial organization and viability in living biofilms when combined with fluorescent markers.
Key Strengths:
- 3D Non-Invasive Imaging: Allows for the real-time observation of biofilm development and structure in living samples [70].
- Cell Viability and Composition: Can be used with fluorescent probes to distinguish live/dead cells and localize specific EPS components or species in multi-species biofilms [70].
- Correlative Microscopy: Serves as an excellent bridge between low-resolution light microscopy and high-resolution AFM/SEM, providing context for smaller-scale analysis [1].
Key Limitations:
- Resolution Limit: Resolution is fundamentally limited by the diffraction of light (~200 nm laterally) [70].
- Photobleaching and Phototoxicity: Fluorescent dyes can bleach over time, and the laser light can be toxic to living cells, potentially altering biofilm behavior.
- Indirect Imaging: Requires staining, which may not label all components equally and can interfere with native biofilm properties.
Emerging Biosensors and Methodologies include microfluidics, which simulates food-relevant environments to study biofilm dynamics; CRISPR-based systems for detecting specific biofilm-associated genes; and qPCR/NGS for quantifying genes and profiling microbial communities [70]. These techniques are powerful for functional and molecular studies but lack the direct topographical and mechanical measurement capabilities of AFM.
The Scientist's Toolkit: Research Reagent Solutions
Table 2: Essential Materials for AFM-Based Biofilm Research in Liquid
| Item | Function/Benefit | Example Use Case |
|---|---|---|
| ITO-coated Glass Substrates | Provides a smooth, hydrophobic surface that promotes adhesion of bacterial cells without chemical treatments, enabling imaging of living, native bacteria [21]. | Imaging Rhodococcus wratislaviensis to visualize intercellular nanotubes without immobilization [21]. |
| Sharp AFM Probes (Si₃N₄) | High-resolution topographical imaging in liquid. Specialized tips (e.g., conductive) enable additional property mapping. | Standard topography and nanomechanical mapping in physiological buffer [21]. |
| Liquid Cell (Flow Cell) | Enclosed chamber to maintain sample hydration and permit the introduction of fresh media or chemical stimuli during imaging. | Studying real-time effects of antibiotics on biofilm mechanical properties. |
| Quantitative Imaging (QI) Mode | An AFM operational mode that acquires high-speed force-distance curves at each pixel, providing simultaneous topographical and nanomechanical data with high resolution [21]. | Mapping the stiffness (Young's modulus) of individual bacterial cells and extracellular matrix components [21]. |
| Machine Learning (ML) Software | Automates image stitching for large-area analysis, cell detection, and classification, overcoming AFM's limited field of view [1]. | Creating seamless, high-resolution AFM images over millimeter-scale areas of a nascent biofilm [1]. |
Integrated Workflow and Comparative Decision Framework
The most powerful approach for comprehensive biofilm characterization often involves the correlative use of multiple techniques. CLSM can first identify regions of interest within a large biofilm based on fluorescence. AFM can then be used on these specific regions to obtain high-resolution nanomechanical data under physiological conditions. Subsequently, fixed samples from adjacent areas can be analyzed by SEM to gain ultrastructural details with high depth of field [1] [70].
Technique Selection Decision Framework
Table 3: Synergistic Use of Techniques for a Comprehensive Biofilm Study
| Research Goal | Recommended Technique(s) | Rationale |
|---|---|---|
| Initial adhesion forces & single-cell mechanics | AFM (particularly Single-Cell Force Spectroscopy) | Directly quantifies pico-Newton forces of adhesion and local nanomechanical properties of living cells [76]. |
| 3D biofilm architecture & live/dead cell distribution | CLSM | Provides non-invasive, real-time 3D visualization of hydrated biofilms using fluorescent viability markers [70]. |
| High-resolution surface topography of mature biofilm | SEM | Offers excellent depth of field and resolution for detailed surface morphology of fixed, dehydrated samples [73]. |
| Elemental composition of biofilm & substrate | SEM-EDS | Provides qualitative and semi-quantitative elemental analysis co-localized with morphological features [71]. |
| Large-area analysis & cellular orientation | AFM with Machine Learning | Automated large-area AFM can image mm-scale areas, revealing patterns (e.g., honeycomb structures) previously obscured [1]. |
Conclusion
Atomic Force Microscopy under physiological fluid conditions is no longer a niche technique but an essential tool for demystifying biofilm-mediated resistance. By enabling the direct observation of biofilm structure, mechanics, and response to treatments in a near-native state, fluid AFM provides a critical bridge between conventional susceptibility testing and clinical outcomes. The key takeaways are the direct correlation between nanomechanical properties and antibiotic tolerance, the ability to visualize the real-time action of anti-biofilm agents, and the power of this technique to validate novel therapeutic strategies, from enzyme-based matrix disruption to nanoparticle penetration. Future directions must focus on standardizing protocols, increasing throughput for drug screening, and further integrating AFM with omics technologies to create a multi-dimensional understanding of biofilm pathophysiology. For biomedical and clinical research, the adoption of physiological AFM promises to accelerate the preclinical pipeline, leading to more effective anti-biofilm therapies and ultimately improving the management of chronic, device-related, and multidrug-resistant infections.
References
- 1. Analysis of biofilm assembly by large area automated AFM [https://www.nature.com/articles/s41522-025-00704-y]
- 2. Variations in the Morphology, Mechanics and Adhesion of ... [https://pmc.ncbi.nlm.nih.gov/articles/PMC7277365/]
- 3. Preparation and Performance Evaluation of Antibacterial ... [https://www.sciencepublishinggroup.com/article/10.11648/j.sd.20251304.12]
- 4. Antibiotic Resistance and Presence of Persister Cells in the ... [https://www.mdpi.com/2079-6382/13/11/1014]
- 5. 靶向多药耐药霍乱弧菌DGCs的黄酮类化合物抗生物膜机制研究 [https://www.ebiotrade.com/newsf/2025-11/20251112030535550.htm]
- 6. Biofilms Exposed: Innovative Imaging and Therapeutic ... [https://pmc.ncbi.nlm.nih.gov/articles/PMC12466655/]
- 7. Advantages and limitations of microtiter biofilm assays in ... [https://pmc.ncbi.nlm.nih.gov/articles/PMC7683578/]
- 8. Quantitative and Qualitative Assessment Methods for Biofilm ... [https://pmc.ncbi.nlm.nih.gov/articles/PMC6133255/]
- 9. Probing the reduction of adhesion forces between biofilms ... [https://www.sciencedirect.com/science/article/abs/pii/S0927776523005957]
- 10. A novel dual-staining method for cost-effective visualization ... [https://www.nature.com/articles/s41598-024-80644-3]
- 11. Biofilms on Plastics Slow Photo-Oxidation while Promoting ... [https://pmc.ncbi.nlm.nih.gov/articles/PMC12573796/]
- 12. Biofilms: Microbial Life on Surfaces - PMC - PubMed Central [https://pmc.ncbi.nlm.nih.gov/articles/PMC2732559/]
- 13. Biofilm [https://en.wikipedia.org/wiki/Biofilm]
- 14. Absolute Quantitation of Bacterial Biofilm Adhesion and ... [https://pmc.ncbi.nlm.nih.gov/articles/PMC2711294/]
- 15. Biofilms: Understanding the structure and contribution ... [https://www.sciencedirect.com/science/article/pii/S2590097823000095]
- 16. AFM characterization of early P. aeruginosa aggregates ... [https://pubmed.ncbi.nlm.nih.gov/41070956/]
- 17. Atomic Force Microscopy of Biofilms—Imaging, Interactions, and Mechanics | IntechOpen [https://www.intechopen.com/chapters/50739]
- 18. Atomic Force Microscopy (AFM) As a Surface Mapping Tool in Microorganisms Resistant Toward Antimicrobials: A Mini-Review - PubMed [https://pubmed.ncbi.nlm.nih.gov/33123004/]
- 19. Biofilm Cohesiveness Measurement Using a Novel Atomic ... [https://pmc.ncbi.nlm.nih.gov/articles/PMC1892862/]
- 20. Fluid Cells (By Accessory Type) [https://www.brukerafmprobes.com/c-220-fluid-cells.aspx?srsltid=AfmBOooTTG01ly_txCSuS7u-JFYPpBucr3esMOiPUTzP1sV8v0vH1d8f]
- 21. Atomic Force Microsocopy: Key Unconventional Approach for ... [https://pmc.ncbi.nlm.nih.gov/articles/PMC11603319/]
- 22. Local mapping of the nanoscale viscoelastic properties ... [https://www.nature.com/articles/s41467-025-59260-w]
- 23. Advances in nanomechanical property mapping by atomic ... [https://pubs.rsc.org/en/content/articlehtml/2025/na/d5na00702j]
- 24. The use of atomic force microscopy for studying ... [https://www.sciencedirect.com/science/article/abs/pii/S0927776501002338]
- 25. Quantifying molecular- to cellular-level forces in living cells [https://pmc.ncbi.nlm.nih.gov/articles/PMC8635116/]
- 26. Article Absolute Quantitation of Bacterial Biofilm Adhesion ... [https://www.sciencedirect.com/science/article/pii/S0006349509004226]
- 27. Quantitative analysis of adhesion and biofilm formation on ... [https://pmc.ncbi.nlm.nih.gov/articles/PMC1356821/]
- 28. Quantitative study of early-stage transient bacterial ... [https://www.nature.com/articles/s41598-024-67716-0]
- 29. Nanomaterial-enabled anti-biofilm strategies - RSC Publishing [https://pubs.rsc.org/en/content/articlehtml/2025/nr/d4nr04774e]
- 30. Advancing Nanotechnology: Targeting Biofilm-Forming ... [https://pmc.ncbi.nlm.nih.gov/articles/PMC11876546/]
- 31. New imaging approach transforms study of bacterial biofilms [https://scientificinquirer.com/2025/08/19/new-imaging-approach-transforms-study-of-bacterial-biofilms/]
- 32. Advances in imaging techniques for real-time microbial ... [https://www.sciencedirect.com/science/article/abs/pii/S0165993625000950]
- 33. Nanoparticles targeting biofilms: A new era in combating ... [https://www.sciencedirect.com/science/article/pii/S2590097825000370]
- 34. AFM-Based Correlative Microscopy Illuminates Human ... [https://pmc.ncbi.nlm.nih.gov/articles/PMC8138568/]
- 35. Atomic Force Microscopy (AFM) As a Surface Mapping ... [https://www.frontiersin.org/journals/pharmacology/articles/10.3389/fphar.2020.517165/full]
- 36. A pipeline for rapid, high-throughput imaging and quantitative ... [https://pmc.ncbi.nlm.nih.gov/articles/PMC12507275/]
- 37. A beginner's guide to atomic force microscopy probing for ... [https://pmc.ncbi.nlm.nih.gov/articles/PMC5217064/]
- 38. Atomic Force Microscopy Application in Biological Research [https://pmc.ncbi.nlm.nih.gov/articles/PMC3700051/]
- 39. Application Note: Improving the Accuracy of ... [https://www.bruker.com/en/products-and-solutions/microscopes/materials-afm/resource-library/an-149-improving-the-accuracy-of-nanomechanical-measurements-with-force-curve-based-afm-techniques.html]
- 40. Atomic Force Microscopy in Microbiology: New Structural ... [https://pmc.ncbi.nlm.nih.gov/articles/PMC4120197/]
- 41. Methods to probe the formation of biofilms: applications in ... [https://pubs.rsc.org/en/content/articlehtml/2020/ay/c9ay02214g]
- 42. Biofilm viability checker: An open-source tool for automated ... [https://www.nature.com/articles/s41522-021-00214-7]
- 43. Recent advances in the application of atomic force ... [https://www.sciencedirect.com/science/article/abs/pii/S1047847723000266]
- 44. A Method for Quantitative Determination of Biofilm Viability [https://www.mdpi.com/2079-4983/3/2/418]
- 45. Atomic Force Microscopy on Biological Materials Related ... [https://pmc.ncbi.nlm.nih.gov/articles/PMC6535871/]
- 46. Soft matter analysis via atomic force microscopy (AFM) [https://www.sciencedirect.com/science/article/pii/S266652392300082X]
- 47. Overcoming Challenges and Limitations Regarding the ... [https://www.mdpi.com/2079-6439/11/10/83]
- 48. 4 Common Imaging Problems (and how to fix them) - NuNano [https://www.nunano.com/blog/2020/11/23/4-common-imaging-problems-and-how-to-fix-them]
- 49. Artifacts and Practical Issues in Atomic Force Microscopy [https://pubmed.ncbi.nlm.nih.gov/30374859/]
- 50. Imaging in Biologically-Relevant Environments with AFM ... [https://www.nature.com/articles/s41598-018-27608-6]
- 51. Four Common AFM Mistakes [https://www.afmhelp.com/index.php?option=com_content&view=article&id=143:four-common-afm-mistakes&catid=39&Itemid=186]
- 52. Biofilm formation on collagen substrates modulates ... [https://pubs.rsc.org/en/content/articlehtml/2025/na/d5na00248f]
- 53. A guide for nanomechanical characterization of soft matter ... [https://www.sciencedirect.com/science/article/pii/S2666166725002151]
- 54. AFM structural characterization of drinking water biofilm ... [https://pubs.rsc.org/en/content/articlelanding/2016/ra/c5ra20606e]
- 55. Advances in nanomechanical property mapping by atomic ... [https://pubs.rsc.org/en/content/articlelanding/2025/na/d5na00702j]
- 56. Efficacy of phage therapy in controlling staphylococcal biofilms [https://eurjmedres.biomedcentral.com/articles/10.1186/s40001-025-02781-3]
- 57. E3435 Standard Practice for Testing Antimicrobial or ... [https://store.astm.org/e3435-25.html]
- 58. applications of atomic force microscopy in disease [https://pmc.ncbi.nlm.nih.gov/articles/PMC12075069/]
- 59. Phage-inorganic hybrid magnetic nanorobots for enhanced ... [https://www.sciencedirect.com/science/article/pii/S1385894725072997]
- 60. Engineered phage-silver nanoparticle complexes as a new ... [https://www.nature.com/articles/s41598-025-05069-y]
- 61. Phage/nanoparticle cocktails for a biocompatible and ... [https://pmc.ncbi.nlm.nih.gov/articles/PMC12122614/]
- 62. Preparing a Dual-Species In Vitro Biofilm Model for Testing ... [https://pmc.ncbi.nlm.nih.gov/articles/PMC12587443/]
- 63. A Method for Analyzing AFM Force Mapping Data Obtained ... [https://pmc.ncbi.nlm.nih.gov/articles/PMC11128031/]
- 64. Combining atomic force microscopy and fluorescence ... [https://www.nature.com/articles/s41598-023-39277-1]
- 65. A Toolbox to Study Tissue Mechanics In Vivo and Ex Vivo [https://link.springer.com/protocol/10.1007/978-1-0716-2035-9_29]
- 66. Development of In Vitro and Ex Vivo Biofilm Models for the ... [https://pmc.ncbi.nlm.nih.gov/articles/PMC9907351/]
- 67. Different Ways of Biofilm Characterization and Drug ... [https://pubmed.ncbi.nlm.nih.gov/37732719/]
- 68. New Imaging Approach Transforms Study of Bacterial ... [https://statnano.com/news/75028/New-Imaging-Approach-Transforms-Study-of-Bacterial-Biofilms]
- 69. AFM image analysis: a comprehensive guide [https://www.digitalsurf.com/blog/demystifying-afm-image-analysis-a-comprehensive-guide/]
- 70. New Methodologies as Opportunities in the Study of ... [https://www.mdpi.com/2076-2607/13/5/1062]
- 71. Choosing the Right Nanoscale Imaging Technique [https://www.nanosurf.com/insights/choosing-the-right-nanoscale-imaging-technique]
- 72. Atomic Force Microscopy Vs SEM: Resolution, Cost, ... [https://eureka.patsnap.com/report-atomic-force-microscopy-vs-sem-resolution-cost-efficiency]
- 73. A Comparative Technical Analysis of SEM and ... [https://www.afmworkshop.com/newsletter/a-comparative-technical-analysis-of-sem-and-afm-for-surface-characterization?srsltid=AfmBOooyQrG-ycGkdEw5DXRc1gQ33KrANfx20ok1d5LBaci9MTvRXhTj]
- 74. comparing AFM with TEM and SEM [https://biocubic.com/afm-vs-tem-and-sem/]
- 75. AFM Or Electron Microscopy A Battle Of Imaging Titans [https://www.photonicsonline.com/doc/afm-or-electron-microscopy-a-battle-of-imaging-titans-0001]
- 76. Profiling to Probing: Atomic force microscopy ... [https://www.sciencedirect.com/science/article/pii/S1742706123004580]