qPCR vs ddPCR: Choosing the Optimal Tool for Absolute Quantification in Fecal Samples
Absolute quantification of microbial targets in complex fecal samples is crucial for gut microbiome research, probiotic development, and clinical diagnostics.
qPCR vs ddPCR: Choosing the Optimal Tool for Absolute Quantification in Fecal Samples
Abstract
Absolute quantification of microbial targets in complex fecal samples is crucial for gut microbiome research, probiotic development, and clinical diagnostics. This article provides a comprehensive comparison between quantitative PCR (qPCR) and droplet digital PCR (ddPCR) for researchers and drug development professionals. We explore the fundamental principles of each technology, present optimized methodological protocols for challenging fecal matrices, and offer troubleshooting strategies for common issues like inhibition and false positives. By synthesizing recent validation studies and direct comparative data, we deliver actionable insights to guide method selection, ensuring accurate, sensitive, and cost-effective quantification in fecal samples.
Understanding qPCR and ddPCR: Core Principles and Their Role in Gut Microbiome Analysis
In the study of complex microbial ecosystems like the gut microbiome, the method of quantification—whether relative or absolute—can fundamentally shape research outcomes and biological interpretations. Relative quantification, derived from next-generation sequencing (NGS), describes the proportion of a specific microbe within a community but obscures changes in the overall microbial load. In contrast, absolute quantification measures the exact number of target microorganisms per unit of sample, providing a direct picture of microbial abundance that is critical for many clinical and research applications [1] [2]. This distinction is particularly crucial when investigating fecal samples, where absolute bacterial abundance can serve as a key health indicator but is lost with standard metagenomic sequencing [3]. The choice between quantitative PCR (qPCR) and droplet digital PCR (ddPCR) for achieving absolute quantification represents a significant methodological crossroads for researchers requiring precise measurements of bacterial strains, pathogens, or specific genes in complex sample matrices.
Theoretical Foundations: Relative vs. Absolute Quantification
Relative Quantification: A Compositional Perspective
Relative quantification methods, primarily through NGS techniques like 16S rRNA gene sequencing and whole metagenome sequencing, revolutionized microbiome research by providing a comprehensive, community-wide profile. The data generated is compositional, meaning the abundance of each microbe is expressed as a percentage of the total community. A major limitation of this approach is its inability to distinguish between true expansion of a pathogen and the mere decline of other community members—both scenarios would appear as an increased "relative abundance" of the pathogen [2] [3]. This compositional nature can potentially lead to biased or misleading results in association studies linking microbes to disease states.
Absolute Quantification: Capturing True Biological Changes
Absolute quantification measures the concrete number of a target molecule (e.g., a specific gene or RNA transcript) or microorganism per unit volume or mass of the original sample (e.g., copies/μL or cells/gram of feces). This approach preserves information about the true density of microbes, which is essential for understanding dynamics in probiotic interventions, pathogen shedding, or microbial translocation [1] [4]. For instance, in clinical diagnostics, knowing whether a patient is shedding 10³ versus 10⁷ Cryptosporidium oocysts per gram of feces provides critical information about infection severity and transmission risk [5]. Absolute quantification can be achieved using culture-based methods, flow cytometry, or nucleic acid-based methods like qPCR and ddPCR.
Table 1: Core Characteristics of Relative and Absolute Quantification
| Feature | Relative Quantification | Absolute Quantification |
|---|---|---|
| Fundamental Output | Proportion of a target within a community | Exact number of targets per unit of sample |
| Primary Technologies | Next-Generation Sequencing (NGS) | qPCR, ddPCR, Flow Cytometry, Culture |
| Impact of Total Load Changes | Obscured; relative abundance can change without actual target change | Directly reflected in the measurement |
| Data Interpretation | Can be misleading without context of total load | Biologically intuitive, direct |
| Ideal Use Cases | Community ecology profiling, hypothesis generation | Probiotic tracking, pathogen load, biomarker validation |
Technological Showdown: qPCR vs. ddPCR for Absolute Quantification
How qPCR Achieves Absolute Quantification
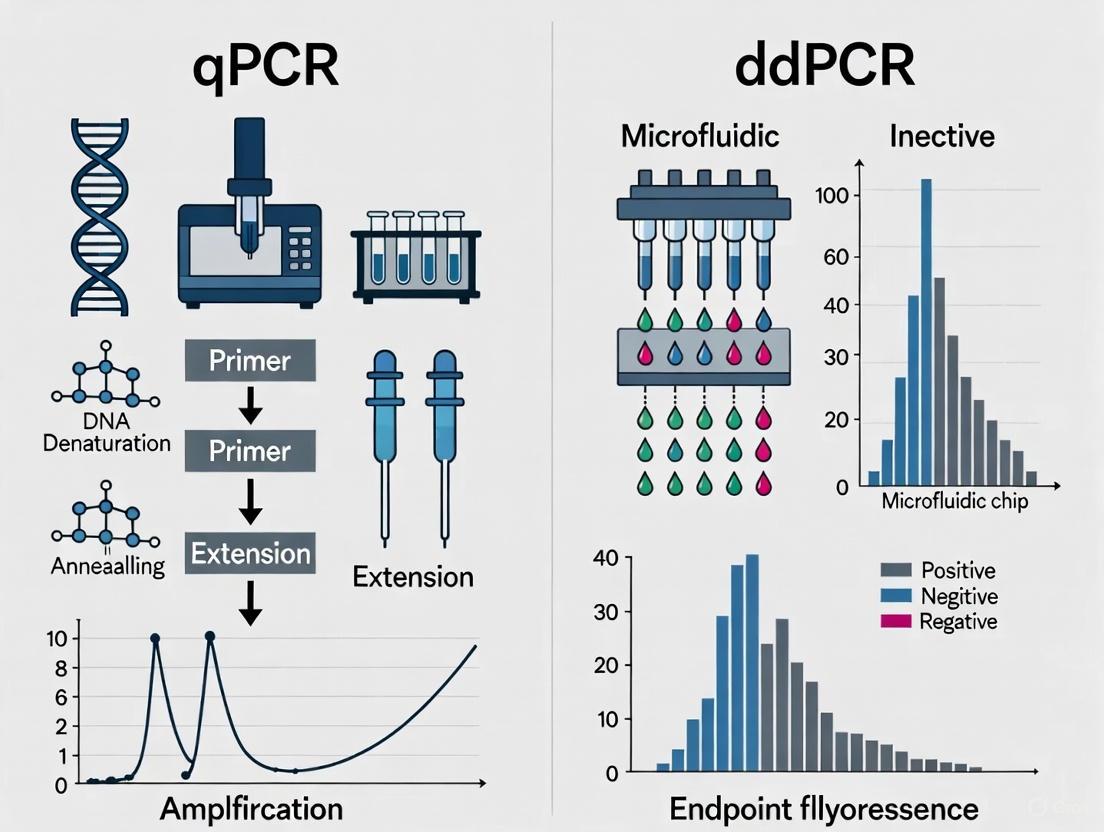
Quantitative PCR (qPCR) estimates the initial amount of a nucleic acid target by monitoring the amplification of DNA in real-time during the exponential phase of the PCR reaction. The cycle at which the fluorescence signal crosses a predefined threshold (Cq value) is inversely proportional to the logarithm of the initial target concentration. To achieve absolute quantification, a standard curve with known concentrations of the target (e.g., a plasmid of known copy number) must be run in parallel with the unknown samples. The Cq values of the standards are plotted against the logarithm of their known concentrations, creating a curve that is used to interpolate the concentration of the unknown samples [6] [7]. While powerful, this method's accuracy is dependent on the quality and accuracy of the external standard curve.
How ddPCR Achieves Absolute Quantification
Droplet Digital PCR (ddPCR) takes a different approach by partitioning a single PCR reaction into thousands to millions of nanoliter-sized droplets. After end-point PCR amplification, each droplet is analyzed individually for fluorescence. Droplets are scored as positive (containing at least one target molecule) or negative (containing no target). The absolute concentration of the target in the original sample is then calculated directly from the ratio of positive to total droplets using binomial Poisson statistics, without the need for a standard curve [6] [4] [5]. This partitioning also dilutes PCR inhibitors across the droplets, making the technology more robust to inhibitors commonly found in fecal samples [4] [7].
Direct Comparative Data: Performance in Fecal Samples
Independent studies have systematically compared these two technologies for quantifying microorganisms in complex fecal samples, providing critical performance data.
A 2024 study in Microbiome directly compared qPCR and ddPCR for the absolute quantification of Limosilactobacillus reuteri strains in human fecal samples. The researchers found that with kit-based DNA isolation, both methods showed comparable sensitivity (Limit of Detection, LOD ~10⁴ cells/g feces) and excellent linearity (R² > 0.98). ddPCR demonstrated slightly better reproducibility, but qPCR offered a wider dynamic range and was faster and more cost-effective. The study concluded that for this application, qPCR held practical advantages over ddPCR [1] [2].
Conversely, a study on Shiga toxin-producing E. coli (STEC) in bovine feces found that ddPCR and qPCR using an Environmental Master Mix performed similarly, with good correlation and no significant inhibition. However, qPCR using a Universal Master Mix was clearly prone to PCR inhibition, highlighting that reagent choice in qPCR is critical for accurate quantification in complex matrices [4].
Table 2: Experimental Comparison of qPCR and ddPCR in Fecal Sample Analysis
| Performance Metric | qPCR | ddPCR | Supporting Evidence |
|---|---|---|---|
| Absolute Quantification | Requires standard curve | Direct, without standard curve | [6] [4] |
| Sensitivity (LOD) | ~10³ to 10⁴ cells/g feces | ~10³ to 10⁴ cells/g feces | [1] [4] |
| Tolerance to PCR Inhibitors | Moderate (kit-dependent) | High (due to sample partitioning) | [4] [7] [8] |
| Reproducibility | High | Slightly better | [1] [7] |
| Dynamic Range | Wider | Saturated at high concentrations | [1] [4] |
| Cost & Speed | Lower cost, faster | Higher cost, slower | [1] [5] |
| Detection in Complex Samples | Good with optimized DNA kits | Superior for low-abundance targets in inhibitors | [7] [8] |
Experimental Protocols for Absolute Quantification in Fecal Samples
A Step-by-Step Workflow for Strain-Specific qPCR
The 2024 Microbiome study provides an optimized, step-by-step protocol for the absolute quantification of bacterial strains in fecal samples using strain-specific qPCR [1] [2]:
- Strain-Specific Primer Design: Begin with whole genome sequences of the target strain and related strains. Identify unique genomic regions for the target strain and design specific primers. Validate specificity in silico.
- Fecal Sample Processing: Homogenize fecal samples in phosphate-buffered saline (PBS). To eliminate background interference, confirm the absence of the target strain in control samples using pre-validated assays.
- DNA Extraction: Use a kit-based DNA isolation method (e.g., QIAamp Fast DNA Stool Mini Kit). Include a washing step with PBS to remove PCR inhibitors. Assess DNA purity spectrophotometrically.
- qPCR Standard Curve Preparation: Grow the target bacterial strain in culture. Harvest cells during the late exponential phase and determine cell density by quantitative plating on agar plates. Serially dilute the cells and spike them into control fecal samples to create a standard curve for absolute quantification.
- qPCR Setup and Execution: Perform reactions using a master mix suitable for complex samples (e.g., TaqMan Environmental Master Mix). Run samples and standards in triplicate. Use the Cq values from the standard curve to interpolate the absolute quantity of the target strain in unknown samples.
Workflow for ddPCR-Based Host DNA Quantification
For quantifying low-abundance host DNA in stool, a 2019 Scientific Reports paper details a robust ddPCR pipeline [9]:
- Sample Preservation: Preserve stool samples immediately upon collection in 0.5 M EDTA (pH 8.0) to stabilize host DNA, which is often present in low amounts and in a fragmented state.
- DNA Extraction: Use a commercial kit designed to recover DNA without size bias (e.g., from Norgen Biotek Corp.) to ensure efficient recovery of both long and short host DNA fragments.
- Assay Design for Sensitivity and Specificity: Design short-amplicon assays (60-80 bp) to target multi-copy genomic elements, such as LINE-1 repeats in the nuclear genome or specific mitochondrial genes (e.g., ND5). This enhances detection sensitivity for degraded DNA.
- ddPCR Reaction Partitioning and Amplification: Partition the PCR reaction into ~20,000 droplets per sample. Perform end-point PCR amplification with optimized annealing temperatures.
- Droplet Reading and Absolute Quantification: Use a droplet reader to count the number of positive and negative droplets. The concentration of the target DNA in copies/μL is calculated directly from this ratio, providing an absolute count without reference to standards.
The following diagram illustrates the core logical and procedural relationship between these two main quantification paradigms and the two featured PCR technologies.
The Scientist's Toolkit: Essential Reagents and Materials
Successful absolute quantification in challenging samples like feces relies on a carefully selected set of reagents and tools.
Table 3: Key Research Reagent Solutions for Absolute Quantification
| Item | Function | Example/Best Practice |
|---|---|---|
| Kit-Based DNA Extraction Kits | Isolate high-purity DNA while removing PCR inhibitors from feces. | QIAamp Fast DNA Stool Mini Kit [1] [2] |
| Inhibitor-Resistant Master Mixes | Enhance PCR robustness against remaining sample contaminants. | TaqMan Environmental Master Mix 2.0 [4] |
| Strain-Specific Primers/Probes | Enable precise detection and quantification of a specific bacterial strain. | Designed from unique genomic regions [1] [8] |
| Digital PCR Partitioning Reagents | Generate thousands of droplets for ddPCR absolute counting. | DG8 Cartridges and Droplet Generation Oil [9] |
| DNA Stabilization Buffers | Preserve sample integrity from point-of-collection, crucial for host DNA. | 0.5 M EDTA (pH 8.0) [9] |
The choice between relative and absolute quantification is fundamental, dictated by the specific biological question. For studies where understanding the true density of a microorganism is critical—such as in probiotic efficacy, pathogen load monitoring, or when relating bacterial abundance to a quantitative host response—absolute quantification is indispensable. The decision between qPCR and ddPCR then hinges on practical considerations: qPCR offers a proven, cost-effective, and high-throughput solution for many applications, especially when optimized with kit-based DNA extraction and inhibitor-resistant chemistry [1] [4]. ddPCR, while more costly, provides superior robustness against inhibitors and direct absolute quantification, making it the technology of choice for analyzing low-abundance targets in highly complex or contaminated samples, or when the highest level of precision without reference standards is required [7] [8] [9]. As the field moves towards more integrated analyses, the combination of NGS for broad community profiling and either qPCR or ddPCR for absolute validation of key targets represents a powerful and rigorous approach to microbiome research and molecular diagnostics.
Why Fecal Samples Are a Challenging Matrix for Molecular Diagnostics
Fecal samples represent a critical yet complex biological matrix for molecular diagnostics in both clinical and research settings. The accurate detection and quantification of microbial or host DNA in stool is essential for diagnosing infections, profiling gut microbiota, and monitoring therapeutic interventions. However, the inherent properties of feces introduce significant analytical challenges, including the presence of potent PCR inhibitors, low abundance of target nucleic acids, and general sample complexity. This guide objectively compares the performance of two principal molecular technologies—quantitative PCR (qPCR) and droplet digital PCR (ddPCR)—for absolute quantification in fecal samples, drawing on experimental data to inform method selection for researchers and drug development professionals.
Fecal material is a heterogeneous mixture consisting of not only gut microorganisms but also undigested food, host cells sloughed from the intestinal lining, and various metabolic byproducts. This composition creates a challenging environment for nucleic acid-based detection methods. The accurate quantification of specific bacterial species, virulence genes, or host DNA in stool is crucial for multiple applications, from tracking Shiga toxin-producing Escherichia coli (STEC) in cattle [10] to diagnosing tuberculosis in children [11] and quantifying specific probiotic strains in clinical trials [12].
The primary obstacles for molecular diagnostics in feces include:
- PCR inhibitors: Substances such as bile salts, complex polysaccharides, and hemoglobin derivatives can co-extract with nucleic acids and suppress polymerase activity [10] [13].
- Low target abundance: Pathogen or host DNA often represents a tiny fraction (<1%) of the total DNA in a sample, which is predominantly from the gut microbiome [9].
- Sample degradation: Nucleases and varying pH levels can lead to the degradation of target nucleic acids before analysis [14] [9].
- Dynamic range requirements: Target concentrations can vary enormously, from a few copies to over 109 copies per gram of sample [15].
Both qPCR and ddPCR are cornerstone technologies in molecular diagnostics, yet they operate on different principles for quantification.
Quantitative PCR (qPCR) relies on the monitoring of fluorescence accumulation during PCR cycles to estimate the initial template concentration relative to a standard curve. Its performance can be significantly affected by the presence of inhibitors in the sample, which reduce amplification efficiency [10] [13].
Droplet Digital PCR (ddPCR) is an end-point method that partitions a single PCR reaction into thousands of nanoliter-sized droplets. Each droplet acts as an individual PCR reactor. After amplification, droplets are counted as positive or negative, and the absolute initial target concentration is calculated using Poisson statistics, without the need for a standard curve. This partitioning mitigates the effect of inhibitors, as inhibitors are similarly diluted and only affect a subset of reactions [10] [13] [12].
The experimental workflow for analyzing fecal samples, from collection to analysis, involves critical steps to ensure data quality and reliability.
Performance Comparison: Experimental Data
Direct comparisons of qPCR and ddPCR using fecal samples reveal distinct performance differences. The following tables summarize key experimental findings from recent studies.
Table 1: Comparative Sensitivity and Limit of Detection (LOD) in Fecal Samples
| Target / Application | Technology | Limit of Detection (LOD) | Reference |
|---|---|---|---|
| Limosilactobacillus reuteri (spiked) | qPCR | ~104 cells/g feces | [1] |
| Limosilactobacillus reuteri (spiked) | ddPCR | ~103 cells/g feces | [1] |
| Salmonella & Shigella (duplex assay) | ddPCR | 550 CFU/mL (Shigella), 1.0 × 10⁴ CFU/mL (Salmonella) | [16] |
| Sulfonamide resistance genes (sul) | ddPCR | 3.98 to 6.16 copies/reaction | [15] |
| Multi-strain probiotics | ddPCR | 10-100 fold lower than qPCR | [12] |
Table 2: Resistance to PCR Inhibition and Quantitative Performance
| Parameter | qPCR | ddPCR | Experimental Context |
|---|---|---|---|
| Inhibition by Bile Salts | Affected (dependent on mastermix) [10] | Resistant up to 0.5 µg/µL [10] | STEC quantification in cattle feces [10] |
| Quantification Basis | Relative (requires standard curve) | Absolute (no standard curve) | General principle [10] [13] [12] |
| Precision at Low Target Levels | Lower | Higher (reduced variance) [13] | Microbial source tracking [13] |
| Dynamic Range | Wider dynamic range [1] | Upper limit due to partition saturation [10] [13] | Bacterial strain quantification [10] [1] |
Detailed Experimental Protocols
To ensure reproducible and reliable results, the following core protocols are essential.
Sample Collection, Preservation, and DNA Extraction
Sample Collection and Preservation:
- Collection: Collect stool in a sterile, sealed container. For human studies, samples can be collected at home by participants [11].
- Preservation: Immediate freezing at -20°C or lower is standard. Chemical preservatives can be used for room temperature storage. While some studies indicate that Salmonella and Campylobacter DNA remains detectable even at room temperature for 30 days without preservation [14], best practice for host DNA and broader microbiome integrity involves stabilization.
- Stabilization Buffer: 0.5 M EDTA (pH 8.0) has been validated as an effective preservative for host DNA in stool samples, helping to maintain DNA stability during storage and transport [9].
Nucleic Acid Extraction:
- Lysis: Mechanical lysis via bead beating is critical for disrupting robust bacterial cell walls. A typical protocol uses lysis/binding buffer and homogenization with a Precellys homogenizer (2 cycles of 3 pulses for 30 s at 6800 RPM) [12].
- Extraction Kits: Commercial kits are preferred for consistency. Examples include the QIAamp Fast Stool Kit [14] and the MagMax Total Nucleic Acid Isolation Kit for automated extraction [12]. The Norgen Biotek Corp. kit has been specifically noted for efficient host DNA recovery [9].
- Inhibitor Removal: Most commercial kits incorporate steps to remove PCR-inhibitory substances. The efficacy of this step varies between kits and can significantly impact downstream analysis [10] [14].
qPCR and ddPCR Setup and Analysis
Primer and Probe Design:
- For absolute quantification of host DNA, targets with high copy number per cell are essential due to low abundance. LINE-1 repetitive elements (nuclear DNA) and mitochondrial genes (e.g., ND5, CO2) are highly sensitive targets [9].
- For bacterial detection, strain-specific primers and probes are required, particularly for probiotics that share species with commensal bacteria [12].
- Amplicon length should be kept short (<100-150 bp) to maximize the detection of potentially degraded DNA in stool [9].
qPCR Protocol:
- Master Mix Selection: The choice of master mix can critically impact inhibition resistance. TaqMan Environmental Master Mix 2.0 (EMM) has demonstrated superior resistance to fecal inhibitors compared to TaqMan Universal PCR Master Mix (UMM) [10].
- Reaction Setup: A typical 20 µL reaction contains 1x Master Mix, primers/probes at optimized concentrations, and 2-10 µL of template DNA (e.g., 10 ng of fecal DNA) [12].
- Amplification and Analysis: Run on a real-time cycler (e.g., Applied Biosystems 7500FAST) using standard cycling conditions. Quantification is performed relative to a serial dilution standard curve of known copy number [12].
ddPCR Protocol:
- Partitioning: Using a system like the Bio-Rad QX200, the 20 µL PCR reaction is partitioned into ~20,000 nanodroplets with an Automated Droplet Generator [12].
- Amplification: PCR is run to end-point. EvaGreen or probe-based supermixes can be used.
- Reading and Quantification: The droplet reader counts positive and negative droplets. Software (e.g., QuantaSoft) applies Poisson statistics to calculate the absolute concentration in copies/µL of the original reaction, which is then converted to copies/g of feces [10] [12].
The Scientist's Toolkit: Essential Research Reagents
Table 3: Key Reagents and Kits for Molecular Analysis of Fecal Samples
| Item | Function / Application | Example Products / Targets |
|---|---|---|
| DNA/RNA Preservation Buffer | Stabilizes nucleic acids at room temperature post-collection. | 0.5 M EDTA (pH 8.0) [9], RNAlater [14] |
| Mechanical Homogenizer | Disrupts tough bacterial and fungal cell walls in stool. | Precellys Homogenizer with bead tubes [12] |
| Nucleic Acid Extraction Kit | Isolates DNA/RNA while removing PCR inhibitors. | QIAamp Fast Stool Kit [14], MagMax Total Nucleic Acid Kit [12] |
| PCR Master Mix | Enzymes and buffers optimized for robust amplification. | TaqMan Environmental Master Mix 2.0 [10] |
| Inhibition-Resistant Polymerase | Reduces false negatives in complex samples. | Included in specialized master mixes [10] [13] |
| Strain-Specific Primers/Probes | Enables detection and quantification of specific targets. | LINE-1, mtDNA for host cells [9]; stx1, stx2, eae for STEC [10]; B. theta, BacHum for MST [13] |
The choice between qPCR and ddPCR depends on the specific research question and experimental constraints. The following decision pathway synthesizes the experimental data to guide method selection.
In summary, fecal samples remain a challenging matrix for molecular diagnostics due to inhibitor content, sample heterogeneity, and often low target abundance. The experimental data consistently shows that ddPCR offers superior sensitivity, superior resistance to PCR inhibition, and provides absolute quantification without a standard curve. These advantages make it particularly suited for detecting low-abundance targets, such as specific probiotic strains [12], host DNA [9], or pathogens in asymptomatic carriers [16].
However, qPCR retains important advantages in dynamic range, speed, and cost [1]. The choice of master mix is critical for qPCR performance, with inhibitor-resistant formulations like TaqMan Environmental Master Mix being essential for reliable results [10]. For high-throughput applications where targets are sufficiently abundant and sample quality can be well-controlled, qPCR remains a powerful and efficient technology.
The Critical Need for Strain-Level Quantification in Microbiome Research and Drug Development
The human gut microbiome, a complex community of trillions of microorganisms, has emerged as a crucial factor influencing human health and disease. Traditional microbiome analysis has primarily operated at the genus or species level, but this resolution is insufficient for understanding nuanced microbial functions. Strain-level quantification has become a critical need because bacterial strains within the same species can exhibit dramatically different biological properties, including virulence, metabolic capabilities, and therapeutic potential [17]. For example, certain strains of Escherichia coli are harmless commensals that aid digestion, while others such as E. coli O157:H7 are pathogenic and can cause serious illness [17]. The ability to distinguish between these strains is essential for accurate clinical diagnostics, drug development, and personalized therapeutic interventions.
The transition from relative to absolute quantification represents another fundamental advancement in microbiome research. Standard high-throughput sequencing methods generate data that are compositional (relative abundance), where an increase in one taxon's abundance necessarily causes an equivalent decrease across others [18]. This limitation can lead to misleading interpretations, as relative abundance data cannot determine whether an individual taxon has truly increased or decreased in absolute terms [18] [19]. Absolute quantification methods provide the actual number of target microorganisms, enabling researchers to make accurate assessments of microbial dynamics in response to pharmaceutical interventions, dietary changes, or disease progression [19].
Why Strain-Level Resolution Matters: From Scientific Curiosity to Clinical Application
The Functional Significance of Microbial Strains
Different strains under the same species can possess highly diverse genetic content and functional capabilities due to genomic variations [20]. These variations can translate into significant phenotypic differences that directly impact host health and disease states. Unique genes or single nucleotide polymorphisms (SNPs) to a strain may lead to new enzymatic functions, antibiotic resistance, virulence factors, and different responses to pharmaceutical compounds [20]. For instance, E. coli CFT073 (pathogenic) and E. coli Nissle 1917 (probiotic) share 99.98% genome sequence similarity yet have dramatically different effects on human health [20]. This remarkable genetic similarity underscores why strain-level resolution is essential for accurate functional assignment.
The ability to resolve strain-level differences is revolutionizing our understanding of microbiome ecology and dynamics. Research has revealed that multiple highly similar strains frequently coexist within individual microbiomes [20]. One study analyzing 2,144 human fecal metagenomes found that numerous samples contained highly similar strains of Bacteroides dorei coexisting simultaneously [20]. Another investigation discovered that two or three Staphylococcus epidermidis strains can coexist in human fecal samples with extremely high genetic similarity (Mash distance of approximately 0.005) [20]. These findings highlight the complex strain landscape within individual microbiomes that remains invisible to species-level analysis.
Therapeutic Applications Enabled by Strain-Level Analysis
Targeted Live Biotherapeutics
The development of live biotherapeutic products (LBPs) represents one of the most promising applications of strain-level microbiome science. In 2023, the FDA approved SER-109, the first oral microbiome-based therapy for recurrent C. difficile infection, which works by restoring beneficial bacteria to prevent reinfection [17]. The development and prescription of such therapies depend on knowing exactly which strains are present in a patient's microbiome to ensure interventions are both safe and effective [17]. Strain-level quantification enables quality control during manufacturing and allows clinicians to verify strain colonization and persistence following administration.
Uncovering Cancer-Linked Microbial Pathways
Microorganisms are increasingly recognized as contributing factors in cancer development. Scientists have identified 11 microbes that directly cause cancer in humans, including Helicobacter pylori, several viruses, and parasitic worms, collectively responsible for 2.2 million cancer cases annually [17]. Strain-level sequencing is helping identify additional cancer-linked bacteria, with researchers discovering microbial signatures associated with colorectal and pancreatic cancers [17]. This suggests that therapeutic breakthroughs may come from understanding and eliminating cancer-triggering bacteria rather than targeting human genetic mutations directly.
Antibiotic Resistance and Gut-Brain Axis Mapping
Strain-level analysis is critical for combating antimicrobial resistance (AMR), as it enables researchers to understand how specific microbial populations respond to different antibiotics and track the emergence of resistance genes [17]. In the emerging field of the gut-brain axis, strain-level studies are beginning to link specific bacteria to mental health conditions [17]. For example, researchers have tracked patients experiencing overgrowth of Alistipes, a bacterial strain associated with anxiety disorders, and used targeted dietary interventions to restore microbial balance and reduce anxiety symptoms [17].
Absolute Quantification Technologies: qPCR versus ddPCR
Fundamental Technological Principles
Quantitative PCR (qPCR) is a well-established molecular technique that measures the amplification of DNA in real-time using fluorescent reporters. It relies on standard curves constructed from samples of known concentration to infer the target quantity in experimental samples [10] [19]. The cycle threshold (Ct) values obtained during the exponential phase of amplification are used to calculate starting quantities based on the standard curve [10]. While qPCR has been widely used for microbial quantification, it has limitations including susceptibility to PCR inhibitors in complex samples and dependence on the accuracy of standard curve construction [10] [2].
Droplet digital PCR (ddPCR) represents a technological advancement that enables absolute quantification without standard curves [10] [2]. This technique partitions a PCR reaction into thousands of nanoliter-sized droplets, effectively creating individual reaction chambers. After end-point amplification, each droplet is analyzed for fluorescence to determine if it contains the target sequence (positive) or not (negative) [10] [12]. The absolute number of target DNA molecules in the original sample is then calculated directly from the ratio of positive to total droplets using binomial Poisson statistics [10]. This partitioning approach provides ddPCR with potentially greater resistance to PCR inhibitors and improved precision for quantifying low-abundance targets [10] [12].
Comparative Performance in Microbial Quantification
Table 1: Comparison of qPCR and ddPCR Performance Characteristics for Bacterial Quantification
| Parameter | qPCR | ddPCR | Experimental Context |
|---|---|---|---|
| Limit of Detection (LOD) | ~103-104 cells/g feces [2] | ~103-104 cells/g feces [2] | Limosilactobacillus reuteri in human fecal samples |
| Dynamic Range | Wider dynamic range [2] | Saturation at high concentrations (~2×10⁵ copies/μL) [10] | Bacterial genomic DNA dilution series |
| PCR Inhibition Resistance | Varies by mastermix; Environmental Master Mix 2.0 showed good resistance [10] | Highly resistant to inhibitors; comparable to best qPCR mastermixes [10] | Bile salts spiking experiment |
| Reproducibility | High (similar to ddPCR) [2] | Slightly better reproducibility [2] | Replicate measurements of spiked fecal samples |
| Quantification Basis | Relative (requires standard curve) [10] | Absolute (no standard curve needed) [10] | Fundamental measurement principle |
| Cost and Speed | Lower cost and faster processing [2] | Higher cost and slower throughput [2] | Practical implementation considerations |
Table 2: Method Comparison for Strain-Level Detection in Multi-Strain Probiotic Clinical Trial
| Assessment Metric | qPCR Performance | ddPCR Performance | Notes |
|---|---|---|---|
| Sensitivity (True Positive Rate) | High for optimized assays [12] | 10-100 fold lower LOD [12] | Detection of Bifidobacterium animalis subsp. lactis Bl-04 in human feces |
| Specificity (True Negative Rate) | High for properly validated assays [12] | Comparable to optimized qPCR [12] | Ability to distinguish target strains from commensal bacteria |
| Discrimination Accuracy | Congruent with ddPCR [12] | Highly congruent with qPCR [12] | Overall agreement between methods for strain detection |
| Multi-Strain Detection | Effective with layered discrimination approach [12] | Effective with layered discrimination approach [12] | Detection of 3 out of 5 probiotic strains |
Experimental Protocols for Strain-Level Quantification
DNA Extraction Methodologies
The accuracy of both qPCR and ddPCR is heavily dependent on the quality and purity of extracted DNA. Three well-established protocols for isolating total DNA from human fecal samples have been systematically compared [2]:
Phenol-Chloroform-Based Method (PC): This traditional method involves cell lysis with SDS and proteinase K, followed by phenol-chloroform-isoamyl alcohol extraction and ethanol precipitation. While effective, it is more labor-intensive and involves hazardous chemicals [2].
QIAamp Fast DNA Stool Mini Kit-Based Method (QK): This kit-based approach incorporates a sample wash step with ice-cold PBS to remove PCR inhibitors, followed by lysis buffer incubation and DNA binding to silica membranes. It offers a good balance of efficiency and safety [2].
Protocol Q (Optimized Kit-Based Method): This method has been specifically optimized for quantitative microbiome analysis, incorporating mechanical lysis through bead beating to ensure efficient cell disruption of both Gram-positive and Gram-negative bacteria [2].
Studies have demonstrated that kit-based DNA extraction methods generally provide the best combination of DNA yield, purity, and quantitative accuracy for both qPCR and ddPCR applications [2].
Strain-Specific Primer Design and Validation
The development of strain-specific quantification assays requires a systematic approach to primer design [2]:
Identification of Strain-Specific Marker Genes: Begin with comparative genomic analysis of target strains against closely related strains to identify unique genetic regions.
Primer and Probe Design: Design primers and TaqMan probes targeting strain-specific sequences, following standard parameters (amplicon size 70-150 bp, Tm around 60°C, GC content 40-60%).
Specificity Validation: Test primer specificity against a panel of related bacterial strains to ensure no cross-reactivity.
Efficiency Optimization: Optimize primer concentrations and annealing temperatures using a matrix approach to achieve PCR efficiency of 90-110%.
Limit of Detection Determination: Establish the assay's detection limit using serial dilutions of target bacterial DNA spiked into fecal DNA extracts.
This protocol has been successfully applied to design highly accurate strain-specific qPCR assays for Limosilactobacillus reuteri strains, achieving a detection limit in spiked fecal samples of around 103 cells/g feces [2].
Experimental Data: Direct Method Comparisons in Microbiome Research
Sensitivity and Inhibition Resistance Studies
A comprehensive comparison of qPCR and ddPCR for detecting Shiga toxin-producing Escherichia coli (STEC) in cattle feces revealed important performance differences [10]. Both methods exhibited excellent linearity (R2: 0.9959 to 0.9999) when quantifying diluted series of bacterial genomic DNA. The limit of quantification for both qPCR (using Environmental Master Mix 2.0) and ddPCR was 2.75 log copies g-1 feces for most toxin genes tested [10].
Inhibition experiments using bile salts demonstrated that ddPCR and qPCR with Environmental Master Mix 2.0 showed similar resistance to PCR inhibitors, maintaining accurate quantification at concentrations up to 0.5 μg/μL in the PCR mixture [10]. In contrast, qPCR using Universal PCR Master Mix was substantially inhibited by increasing concentrations of bile salts [10]. This highlights the importance of both the quantification platform and reaction chemistry in obtaining reliable results from complex sample matrices like feces.
Probiotic Detection in Human Clinical Trials
A recent study directly compared qPCR and ddPCR for detecting multi-strain probiotics in human fecal samples following a randomized controlled trial [12]. The research focused on detecting three probiotic strains (Lactobacillus acidophilus NCFM, Lacticaseibacillus paracasei Lpc-37, and Bifidobacterium animalis subsp. lactis Bl-04) from a five-strain probiotic product.
Both methods were found to be highly congruent, with ddPCR demonstrating a 10-100 fold lower limit of detection [12]. Interestingly, the study revealed that most of the sensitivity and specificity for detecting probiotic consumption came from a single assay targeting Bifidobacterium animalis subsp. lactis Bl-04, despite all three assays performing well during optimization and validation [12]. This finding underscores the importance of rigorous assay validation in complex biological matrices and suggests that a multi-assay approach provides valuable redundancy for clinical trial compliance assessment.
Integration with Sequencing Technologies and Future Directions
Complementary Approaches: Bridging Quantitative and Comprehensive Analysis
While qPCR and ddPCR excel at sensitive, specific quantification of targeted microorganisms, they are inherently limited to pre-defined targets. Next-generation sequencing (NGS) approaches provide untargeted, comprehensive community profiling but are semi-quantitative and suffer from higher detection limits [2] [18]. The integration of these complementary methodologies represents the future of advanced microbiome analysis.
A quantitative sequencing framework that combines the precision of dPCR with the high-throughput nature of 16S rRNA gene amplicon sequencing has been developed to overcome the limitations of relative abundance measurements [18]. This approach uses dPCR to quantify total 16S rRNA gene copies in a sample, then applies this absolute count to transform relative abundances from sequencing into absolute abundances [18]. This powerful integration enables researchers to determine whether changes in relative abundance represent actual increases/decreases in absolute abundance or are merely compositional artifacts.
Advanced Bioinformatics for Strain-Level Resolution
Novel computational tools are pushing the boundaries of strain-level resolution from metagenomic sequencing data. StrainScan, a recently developed tool, employs a novel tree-based k-mer indexing structure to achieve higher accuracy and resolution in strain-level composition analysis [20]. This method improves the F1 score by 20% in identifying multiple strains at the strain level compared to previous state-of-the-art tools [20].
Another innovative approach, CAMMiQ, utilizes a combinatorial optimization framework that employs substrings of variable length present in at most two genomes (doubly-unique substrings), rather than the commonly used fixed-length unique substrings [21]. This methodological innovation allows CAMMiQ to accurately decouple mixtures of highly similar genomes, resulting in higher accuracy without requiring additional computational resources [21].
Applications in Drug Development and Personalized Medicine
The pharmaceutical industry is increasingly recognizing the importance of strain-level microbiome quantification in drug development. A data-driven approach integrating information about the chemical properties of drugs and the genomic content of microbes has been developed to systematically predict drug-microbiome interactions [22]. This machine learning model successfully predicts outcomes of in vitro pairwise drug-microbe experiments and drug-induced microbiome dysbiosis in both animal models and clinical trials [22].
Applying this methodology to systematically map interactions between pharmaceuticals and human gut bacteria has revealed that medications' anti-microbial properties are tightly linked to their adverse effects [22]. This computational framework has the potential to unlock the development of personalized medicine and microbiome-based therapeutic approaches, improving outcomes and minimizing side effects through more informed pharmaceutical treatment decisions.
Essential Research Reagent Solutions for Strain-Level Quantification
Table 3: Key Research Reagents and Materials for Strain-Level Quantification Studies
| Reagent/Material | Function | Application Notes |
|---|---|---|
| TaqMan Environmental Master Mix 2.0 | PCR reaction mix optimized for environmental samples | Provides superior inhibition resistance for fecal samples compared to standard master mixes [10] |
| QIAamp Fast DNA Stool Mini Kit | DNA extraction from complex fecal samples | Incorporates inhibitor removal technology; compatible with both qPCR and ddPCR [2] |
| MagMax Total Nucleic Acid Isolation Kit | Automated nucleic acid extraction | Enables high-throughput processing for clinical trials; includes bead-beating for mechanical lysis [12] |
| Bio-Rad QX200 ddPCR System | Droplet digital PCR platform | Provides absolute quantification without standard curves; partitions samples into ~20,000 droplets [12] |
| Strain-Specific Primers/Probes | Target detection and quantification | Designed from comparative genomic analysis of strain-specific marker genes [2] |
| Bacterial Reference Strains | Standard curve preparation and validation | Essential for assay validation and as positive controls in quantitative experiments [12] |
The critical need for strain-level quantification in microbiome research and drug development is increasingly evident as we recognize the profound functional differences between bacterial strains within the same species. Both qPCR and ddPCR technologies offer powerful approaches for absolute quantification of targeted strains in complex samples like fecal material, with complementary strengths and limitations.
qPCR remains a valuable tool with advantages in dynamic range, cost-effectiveness, and processing speed, particularly when optimized with appropriate master mixes and validated assays [10] [2]. Meanwhile, ddPCR provides enhanced sensitivity, absolute quantification without standard curves, and superior resistance to PCR inhibitors, making it ideal for detecting low-abundance targets or working with highly inhibitory sample matrices [10] [12].
The future of strain-level microbiome analysis lies in the strategic integration of targeted quantification methods (qPCR/ddPCR) with comprehensive sequencing approaches, leveraging the respective strengths of each technology. As drug development increasingly incorporates microbiome considerations, and personalized medicine advances toward clinical practice, precise strain-level quantification will become indispensable for understanding therapeutic mechanisms, predicting treatment responses, and developing novel microbiome-based therapeutics.
Experimental Workflow for Strain-Level Quantification
Strain-Level Resolution in Therapeutic Development
This guide provides an objective comparison of quantitative PCR (qPCR) and droplet digital PCR (ddPCR) workflows for the absolute quantification of bacterial strains in fecal samples, a critical task in gut microbiome research and therapeutic development [1] [2].
The following diagram illustrates the core workflows for qPCR and ddPCR, highlighting their shared initial steps and distinct analytical processes.
Comparative Performance Data
The table below summarizes key performance metrics for qPCR and ddPCR in fecal sample analysis, based on recent experimental studies.
| Performance Metric | qPCR | ddPCR | Supporting Experimental Context |
|---|---|---|---|
| Limit of Detection (LOD) | ~103 to 104 cells/g feces [1] [2] | ~103 to 104 cells/g feces [1] [2] | Quantification of Limosilactobacillus reuteri strains in spiked human fecal samples [2]. |
| Dynamic Range | Wider dynamic range [2] | Can experience reaction saturation at high target concentrations [4] [2] | Comparison of standard curves and spiked fecal samples; saturation in ddPCR occurs around 2×10⁵ target copies/µL [4]. |
| Accuracy & Precision | High accuracy with well-designed assays; precision can be affected by inhibitors [7] | High precision and reproducibility; less affected by sample inhibitors [4] [7] | In samples with low target levels and variable contaminants, ddPCR provided more precise and reproducible data [7]. |
| Susceptibility to PCR Inhibition | More susceptible to chemical and protein contaminants that affect reaction efficiency [7] [2] | More tolerant of inhibitors due to sample partitioning [4] [7] | In a STEC quantification study, ddPCR and qPCR with an environmental master mix showed similar resistance to bile salts [4]. |
| Absolute Quantification | Requires a standard curve for relative quantification [2] [23] | Provides absolute quantification without a standard curve [24] [25] | ddPCR uses Poisson statistics on positive/negative droplets for direct counting of target molecules [24] [25]. |
Detailed Experimental Protocols
Sample Collection and DNA Isolation
Sample Collection: Fecal samples are collected from human subjects and stored at -80°C until processing. The absence of the target bacterium (e.g., L. reuteri DSM 17938) should be confirmed via pre-screening with a specific PCR assay [2].
DNA Isolation: Multiple DNA extraction methods can be employed, including:
- Phenol-Chloroform-Based Method (PC): Involves cell lysis with SDS and proteinase K, followed by organic extraction [2].
- Kit-Based Methods (QK): Use commercial kits such as the QIAamp Fast DNA Stool Mini Kit, often including a bead-beating step for mechanical lysis and buffers to remove PCR inhibitors [2].
The purity and concentration of the isolated DNA should be determined spectrophotometrically. Kit-based methods are often preferred for their better performance in removing inhibitors commonly found in feces [2].
PCR Assay Design and Validation
Strain-Specific Primer Design: The protocol involves identifying unique genomic marker genes for the target bacterial strain (e.g., L. reuteri) by comparing its genome to a database of related strains. Specific primer pairs are designed to amplify a unique region of this marker gene [1] [2].
Assay Validation: The designed primers must be validated for:
- Specificity: Ensuring no cross-reactivity with non-target DNA.
- Efficiency: For qPCR, the amplification efficiency (ideally 90-110%) is determined using a standard curve [7] [2].
- Sensitivity: Determining the Limit of Detection (LOD) and Limit of Quantification (LOQ) using fecal samples spiked with known concentrations of the target bacterium [2].
Quantification Workflows
qPCR Workflow
- Reaction Setup: The PCR master mix is prepared, containing the DNA template, strain-specific primers, fluorescent probes (e.g., TaqMan), and a master mix (e.g., TaqMan Environmental Master Mix 2.0, which is less prone to inhibition) [4] [2].
- Amplification and Data Acquisition: The reaction is run in a real-time PCR instrument. The fluorescence is monitored cycle-by-cycle, and the Quantification Cycle (Cq) is determined for each sample [23].
- Data Analysis: The Cq values are plotted against a standard curve created from samples with known DNA copy numbers. The target concentration in the unknown samples is extrapolated from this curve, providing a relative quantification [2] [23].
ddPCR Workflow
- Reaction Setup: A similar master mix is prepared as for qPCR [7].
- Sample Partitioning: The reaction mix is partitioned into approximately 20,000 nanoliter-sized water-in-oil droplets. Each droplet acts as an individual PCR reactor [24] [25].
- Endpoint Amplification: The droplets undergo a standard PCR amplification to the endpoint.
- Droplet Reading: Each droplet is analyzed in a droplet reader. Droplets are counted as positive if their fluorescence exceeds a predefined threshold [24].
- Data Analysis: The proportion of positive droplets is used in a Poisson statistical model to calculate the absolute concentration of the target DNA in the original sample, without the need for a standard curve [24] [25].
The Scientist's Toolkit: Key Research Reagent Solutions
| Reagent / Material | Function in the Workflow | Example Products / Context |
|---|---|---|
| Kit-Based DNA Isolation Kits | Isolates high-purity DNA from complex fecal samples while removing PCR inhibitors. | QIAamp Fast DNA Stool Mini Kit [2]. |
| Strain-Specific Primers & Probes | Enables specific detection and quantification of a single bacterial strain amidst a complex microbial community. | Primers designed from unique genomic marker genes of L. reuteri [1] [2]. |
| PCR Master Mixes | Provides optimized buffers, nucleotides, and polymerase for efficient amplification. | TaqMan Environmental Master Mix 2.0 (shows better inhibitor tolerance) [4]. |
| Digital PCR Supermixes | Formulated for efficient amplification in partitioned reactions and stable droplet formation. | ddPCR-specific supermixes [24] [26]. |
| Reference Materials & Controls | Essential for validating qPCR standard curves and ensuring assay accuracy and reproducibility. | Genomic DNA from the target strain for standard curves; negative fecal samples for contamination checks [2]. |
From Theory to Practice: Optimized Protocols for Fecal DNA Extraction and Strain-Specific Assay Design
Step-by-Step Guide to Designing Strain-Specific qPCR/ddPCR Assays
The accurate absolute quantification of specific bacterial strains in complex matrices like fecal samples is a critical challenge in microbial research, drug development, and therapeutic monitoring. Next-generation sequencing (NGS) approaches provide strain-level resolution but are limited by being only semi-quantitative, having high detection limits, and generating compositional data [27]. Quantitative PCR (qPCR) and droplet digital PCR (ddPCR) have emerged as powerful techniques for absolute quantification of bacterial strains, each with distinct advantages and limitations. This guide provides a comprehensive, objective comparison of these technologies within the context of fecal sample research, supported by experimental data and detailed protocols.
For researchers tracking probiotic interventions, pathogenic outbreaks, or microbial translocation events, the ability to sensitively detect and accurately quantify specific bacterial strains at low abundance is essential [27]. Strain-specific functional capacities vary significantly due to genomic variations, making precise quantification crucial for establishing connections between microorganisms and host physiological status [27].
Technology Comparison: qPCR versus ddPCR
Principle of Operation and Quantification Approach
qPCR operates by monitoring PCR amplification in real-time using fluorescence detection. The quantification cycle (Cq) at which fluorescence crosses a threshold is proportional to the starting quantity of target DNA. Quantification requires construction of a standard curve from known concentrations of reference material [23]. The dynamic range typically spans 5-6 orders of magnitude, and results can be affected by PCR inhibitors present in complex samples like feces [4].
ddPCR utilizes sample partitioning into thousands of nanoliter-sized droplets, with PCR amplification occurring in each individual droplet. The technique employs end-point detection and binary counting of positive versus negative droplets, enabling absolute quantification without standard curves through binomial Poisson statistics [27] [4]. This partitioning also reduces the effect of inhibitors by effectively diluting them across reactions [4].
Comparative Performance Characteristics
Table 1: Direct comparison of qPCR and ddPCR technical characteristics
| Parameter | qPCR | ddPCR |
|---|---|---|
| Quantification Method | Relative (requires standard curve) | Absolute (no standard curve) |
| Dynamic Range | Wider dynamic range [27] | Saturation at high concentrations (~10⁵ copies/μL) [4] |
| Detection Limit | ~10³ cells/g feces [27] | Comparable to qPCR [4] |
| Inhibition Resistance | More susceptible to PCR inhibitors [4] | Less prone to inhibition due to partitioning [4] |
| Reproducibility | Good reproducibility [27] | Slightly better reproducibility [27] |
| Cost and Speed | Cheaper and faster [27] | More expensive, slower throughput [23] |
| Multiplexing Capability | Well-established | Challenging |
Experimental Evidence in Fecal Samples
Comparative studies using spiked fecal samples provide critical performance data for technology selection. Research on Limosilactobacillus reuteri strain quantification demonstrated that qPCR achieved a limit of detection (LOD) of approximately 10³ cells/g feces with kit-based DNA isolation methods, showing excellent linearity (R² > 0.98) [27]. Both technologies showed comparable sensitivity in detecting Shiga toxin-producing Escherichia coli (STEC) in bovine feces, with quantification limits of 2.75-3.06 log copies/g feces [4].
Inhibition studies reveal important practical differences. When challenged with bile salts as an inhibitor, ddPCR and qPCR using Environmental Master Mix maintained performance up to 0.5 μg/μL, while qPCR with Universal Master Mix showed substantial inhibition at lower concentrations [4]. This highlights that reagent selection significantly impacts qPCR performance in inhibitory matrices like feces.
Step-by-Step Assay Design Workflow
Stage 1: Identifying Strain-Specific Sequences
The foundation of a specific assay lies in selecting unique genomic regions that distinguish the target strain from closely related strains and the background microbiota.
For genomes from short-read sequencing:
- Map high-quality reads to a reference genome using tools like Bowtie2 [28]
- Extract unmapped reads representing strain-specific regions
- Perform de novo assembly of these reads using SPAdes
- Filter contigs by coverage (typically >10×) and length (≥200 nt) [28]
- Extract Open Reading Frames (ORFs) using EMBOSS getorf
- Perform BLAST homology searches against all bacterial sequences in GenBank
- Select ORFs with no significant hits to non-target organisms [28]
For genomes from long-read sequencing:
- Compare assembled target genome with reference genomes using unique genome analysis in GView Server [28]
- Extract unique sequence stretches using coordinates from the output GFF file
- Verify specificity through BLAST analysis against comprehensive databases
Stage 2: Primer and Probe Design
Proper primer and probe design is critical for assay performance, specificity, and efficiency.
Table 2: Primer and probe design specifications
| Parameter | Primers | Probes |
|---|---|---|
| Length | 18-30 bases [29] | 20-30 bases (single-quenched); longer with double-quenching [29] |
| Melting Temperature (Tm) | 60-64°C (ideal: 62°C) [29] | 5-10°C higher than primers [29] |
| Annealing Temperature (Ta) | ≤5°C below Tm [29] | Set ≤5°C below lower primer Tm [29] |
| GC Content | 35-65% (ideal: 50%) [29] | 35-65% [29] |
| 3' End Stability | Avoid 3' end complementarity and hairpins [30] | - |
| Specific Considerations | Avoid runs of ≥4 identical nucleotides [29] | Avoid G at 5' end [29] |
Additional Design Considerations:
- Screen for self-dimers, heterodimers, and hairpins using tools like OligoAnalyzer (ΔG > -9.0 kcal/mol) [29]
- Perform BLAST analysis to ensure primer uniqueness to target sequence [29]
- Target amplicon length of 70-150 bp for optimal amplification [29]
- For RNA targets, design across exon-exon junctions to avoid genomic DNA amplification [30] [29]
- Avoid regions with secondary structure using mfold or UNAFold tools [29]
Stage 3: In Silico Validation
Before laboratory testing, comprehensive computational validation ensures assay specificity:
- Verify primer specificity against updated databases
- Confirm amplicon uniqueness to target strain
- Check for potential cross-reactivity with closely related strains
- Validate thermodynamic properties under expected reaction conditions
Stage 4: Empirical Verification and Optimization
Laboratory validation confirms assay performance with actual samples:
Specificity Testing:
- Test against DNA from closely related strains
- Validate with non-target strains commonly found in sample matrix
- Verify with complex background microbiota (e.g., fecal samples from untreated subjects)
Sensitivity and Linearity Assessment:
- Determine limit of detection (LOD) and limit of quantification (LOQ) using spiked samples
- Assess linearity across expected concentration range (R² > 0.98 desirable) [27]
- For qPCR: construct standard curves with serial dilutions of target DNA
- For ddPCR: verify linearity across dilution series without standard curve
Inhibition Resistance Evaluation:
- Test with spiked fecal samples of varying consistency
- Compare performance with different DNA extraction methods
- Include internal amplification controls to detect inhibition [4]
Experimental Protocol for Fecal Sample Analysis
Sample Preparation and DNA Extraction
Proper sample processing is crucial for accurate quantification in complex fecal matrices:
Sample Collection and Storage:
- Collect fecal samples using standardized protocols
- Aliquot and store at -80°C until processing
- Confirm absence of target strain in pre-treatment samples [27]
DNA Extraction Methods Comparison:
- Phenol-chloroform method: Traditional approach with potential inhibitor carryover
- Kit-based methods (e.g., QIAamp Fast DNA Stool Mini Kit): Provide good balance of yield, purity, and inhibition removal [27]
- Optimized kit-based protocols: Demonstrate best performance for strain quantification in feces [27]
Research indicates that kit-based DNA extraction approaches combined with qPCR provide the optimal balance of sensitivity, accuracy, and practical implementation for absolute quantification of bacterial strains in fecal samples [27].
PCR Setup and Thermal Cycling
Table 3: Recommended reaction components and conditions
| Component/Condition | qPCR | ddPCR |
|---|---|---|
| DNA Template | 2-100 ng (volume ≤10% reaction) | 2-100 ng (volume ≤10% reaction) |
| Master Mix | Environmental Master Mix recommended for fecal samples [4] | ddPCR Supermix |
| Primer Concentration | 200-400 nM each | 200-400 nM each |
| Probe Concentration | 100-200 nM | 100-200 nM |
| Thermal Profile | Initial denaturation: 95°C, 10 min; 40-45 cycles: 95°C 15 sec, 60°C 60 sec | Initial denaturation: 95°C, 10 min; 40 cycles: 94°C 30 sec, 60°C 60 sec; Enzyme deactivation: 98°C, 10 min |
| Data Collection | End of each annealing/extension step | End-point after completion of all cycles |
Data Analysis and Interpretation
qPCR Analysis:
- Generate standard curve using serial dilutions of known target concentration
- Calculate PCR efficiency: E = [10^(-1/slope)] - 1 (ideal: 90-105%)
- Determine unknown concentrations from Cq values using standard curve equation
- Apply correction factors based on DNA extraction efficiency if absolute cell counts required
ddPCR Analysis:
- Use proprietary software to identify positive and negative droplets
- Apply Poisson correction to account for multiple targets per droplet
- Calculate concentration directly as copies/μL without standard curve
- Manually review droplet amplitude plots to verify proper cluster separation
Essential Research Reagent Solutions
Table 4: Key reagents and materials for strain-specific PCR assays
| Reagent/Material | Function | Selection Considerations |
|---|---|---|
| Strain-Specific Primers | Target amplification | Designed against unique genomic regions; HPLC-purified |
| Hydrolysis Probes | Detection and quantification | Double-quenched recommended for lower background [29] |
| DNA Polymerase | DNA amplification | Environmental master mixes show better inhibition resistance [4] |
| DNA Extraction Kit | Nucleic acid purification | Kit-based methods optimized for fecal samples recommended [27] |
| Inhibition Resistance Additives | Counteract PCR inhibitors | BSA, skim milk, or commercial inhibitor removal solutions |
| Digital PCR Plates/Cartridges | Sample partitioning | Platform-specific consumables for ddPCR |
| Quantification Standards | Standard curve generation | For qPCR: synthetic gBlocks or calibrated genomic DNA |
Application to Fecal Sample Research
Implementation in Human Studies
The validated protocol has been successfully applied to track Limosilactobacillus reuteri strains PB-W1 and DSM 20016T in human trials [27]. Subjects received live bacterial supplements, and fecal samples were collected over time. Strain-specific qPCR assays demonstrated highly accurate quantification and sensitive detection, with superior performance compared to NGS approaches (16S rRNA gene sequencing and whole metagenome sequencing) in terms of LOD and dynamic range [27].
Comparison with Alternative Methods
The choice between qPCR and ddPCR depends on specific research requirements, sample characteristics, and resource constraints. qPCR provides a wider dynamic range, lower cost, and faster processing, making it suitable for high-throughput applications where absolute quantification without reference standards is not essential [27]. ddPCR offers absolute quantification without standard curves and potentially better tolerance to inhibitors, making it valuable for applications requiring high precision or dealing with highly inhibitory samples [4] [23].
For most strain-specific quantification applications in fecal samples, particularly those involving routine monitoring or large sample volumes, qPCR with kit-based DNA extraction provides the optimal balance of performance, practicality, and cost-effectiveness [27]. The provided step-by-step protocol enables researchers to design highly sensitive strain-specific PCR systems for accurate quantification of bacterial strains across diverse applications and sample types.
The choice of DNA extraction method is a critical determinant of success in molecular analyses of fecal samples. This guide objectively compares traditional phenol-chloroform extraction with modern kit-based methods, framing this technical comparison within the broader context of selecting an appropriate platform for absolute quantification—qPCR versus ddPCR. Evidence from controlled studies demonstrates that while phenol-chloroform can yield higher total DNA, kit-based methods, particularly those incorporating mechanical lysis, provide superior DNA quality, significantly higher PCR detection rates, and more reliable quantification results for both qPCR and ddPCR applications [31] [32] [33].
Performance Comparison at a Glance
The following table summarizes key performance metrics from comparative studies.
Table 1: Direct Comparison of DNA Extraction Method Performance
| Performance Metric | Phenol-Chloroform (P) | Phenol-Chloroform with Bead-Beating (PB) | QIAamp Fast DNA Stool Mini Kit (Q) | QIAamp PowerFecal Pro DNA Kit (QB) |
|---|---|---|---|---|
| Relative DNA Yield | Highest (~4x kits) [31] | High (~4x kits) [31] | Lower [31] | Lower [31] |
| PCR Detection Rate | 8.2% (Lowest) [31] | Not Specified | Intermediate [31] | 61.2% (Highest) [31] |
| Effectiveness against PCR Inhibitors | Poor (60/85 samples negative post-spike) [31] | Intermediate [31] | Good [31] | Excellent (Only 5/85 samples negative post-spike) [31] |
| Bias in Microbial Community Recovery | Not Assessed | Not Assessed | High (Under-represents Gram-positive bacteria) [32] | Low (More accurate profile with bead-beating) [32] |
| Suitability for qPCR/ddPCR | Poor due to inhibitors [31] [34] | Moderate | Good, but potential community bias [32] [34] | Best for consistency and accuracy [31] [1] |
Detailed Experimental Findings
DNA Yield vs. PCR Usability
A 2022 study directly comparing methods on 85 parasite-positive stool samples found that traditional phenol-chloroform (P) and its bead-beating variant (PB) yielded approximately four times more DNA than the kit-based methods (Q and QB) [31]. However, this apparent advantage is misleading. The phenol-chloroform method had the lowest PCR detection rate (8.2%), detecting only Strongyloides stercoralis, whereas the QIAamp PowerFecal Pro DNA Kit (QB) achieved a 61.2% detection rate across all tested parasites, including tough-shelled helminths and fragile protozoa like Blastocystis sp. [31]. This stark contrast highlights that DNA quantity does not equate to PCR usability, with inhibitor removal being a more critical factor.
Impact on Microbiome Community Analysis
The choice of DNA extraction method significantly influences the apparent microbial composition in shotgun metagenomic studies. A 2024 study in Scientific Reports compared the AllPrep DNA/RNA Mini Kit (APK), which includes bead-beating, with the QIAamp Fast DNA Stool Mini Kit (FSK), which does not [32].
The study found that the FSK protocol, lacking a mechanical lysis step, caused a significant underrepresentation of Gram-positive bacteria [32]. In contrast, the APK method provided higher microbial diversity and greater accuracy when compared to a standardized mock community [32]. This bias subsequently skewed microbiome-phenotype association analyses, demonstrating that the extraction method can directly impact biological conclusions [32].
Performance in Absolute Quantification Workflows (qPCR vs. ddPCR)
The extraction method directly impacts the performance of downstream quantification platforms. Research on quantifying Lactobacillus reuteri in human feces found that DNA extracted using the "Protocol Q" (a standardized bead-beating method) recovered the most substantial proportion of bacterial cells and, when combined with qPCR, offered a favorable balance of detection limit, linearity, and cost [34].
Furthermore, while ddPCR is generally less susceptible to PCR inhibition than qPCR due to its endpoint measurement and partitioning of inhibitors [4] [7], the presence of inhibitors can still prevent droplet generation in extreme cases [4]. Therefore, using an efficient kit-based DNA extraction method like the QIAamp PowerFecal Pro DNA Kit, which effectively removes inhibitors, is beneficial for both qPCR and ddPCR, ensuring optimal data quality and reproducibility [31] [1].
Detailed Experimental Protocols
To ensure reproducibility, below are the detailed protocols for key methods cited in this guide.
- Sample Pretreatment: Add 200 mg of stool sample to a tube containing 250 mg of sterile 0.5 mm glass beads and 400 μL of lysis solution (20 mM Tris-HCl pH 7.6, 2.5 mM MgCl2, 50 mM KCl, 150 μg/mL proteinase K, 0.5% Tween-20).
- Homogenization: Horizontally vortex the mixture at maximum speed for 10 minutes until homogeneous.
- Incubation: Incubate the lysate at 65°C for 3 hours, followed by 90°C for 10 minutes to inactivate proteinase K.
- Nucleic Acid Extraction: Add 200 μL of phenol:chloroform:IAA (25:24:1), mix, and centrifuge at 13,000 rpm at 4°C for 10 minutes.
- Aqueous Phase Recovery: Transfer the upper aqueous phase to a new microcentrifuge tube.
- Purification: Add 2 volumes of chloroform, mix thoroughly, and centrifuge again. Transfer the supernatant to a new tube.
- DNA Precipitation: Add 2.5 volumes of ice-cold absolute ethanol and 0.1 volume of 3M sodium acetate (pH 5.2). Incubate at -20°C overnight.
- DNA Pellet Washing: Centrifuge at 13,000 rpm at 4°C for 10 minutes to pellet DNA. Wash the pellet with 1000 μL of 70% ethanol and air-dry.
- DNA Resuspension: Resuspend the final DNA pellet in 100 μL of TE buffer.
This commercial kit method is performed according to the manufacturer's instructions. The key differentiator is its robust mechanical lysis step, which is integrated into the protocol to efficiently break down tough microbial cell walls and parasite eggshells, coupled with specialized spin columns designed to remove PCR inhibitors prevalent in stool samples [31].
Workflow Visualization
The following diagram illustrates the key procedural differences between the two main classes of DNA extraction methods and their impact on downstream molecular analysis.
The Scientist's Toolkit: Essential Research Reagents
Table 2: Key Materials and Reagents for Fecal DNA Extraction and Quantification
| Item / Solution | Function / Application |
|---|---|
| QIAamp PowerFecal Pro DNA Kit (QIAGEN) | Integrated bead-beating and inhibitor removal for optimal recovery of diverse gut microbes and parasites. [31] |
| Protocol Q (IHMS Recommended) | Non-commercial standardized method using repeated bead beating and column purification for reproducible bacterial microbiome results. [33] |
| Phenol:Chloroform:IAA (25:24:1) | Organic solvent mixture used in traditional extraction to separate DNA from proteins and other cellular components. [31] |
| Inhibitor Removal Buffers (e.g., InhibitEX) | Proprietary solutions in kit-based methods to adsorb and remove PCR inhibitors like humic acids and bile salts. [31] [35] |
| Bead-Beating Tubes (0.5mm ceramic/silica beads) | Essential for mechanical disruption of tough cell walls (e.g., Gram-positive bacteria, parasite eggs). [31] [32] [36] |
| Proteinase K | Enzyme that digests proteins and degrades nucleases, used in both traditional and many kit-based protocols. [31] |
| Strain-Specific qPCR/ddPCR Assays | Designed for absolute quantification of specific bacterial strains in complex fecal samples. [1] [34] |
The collective evidence strongly supports the use of modern, kit-based DNA extraction methods over traditional phenol-chloroform for fecal samples. Kits like the QIAamp PowerFecal Pro DNA Kit that incorporate a mechanical lysis step (bead-beating) consistently provide DNA that is not only amplifiable but also delivers a more accurate representation of the sample's true microbial community, which is crucial for both relative and absolute quantification studies [31] [32]. While phenol-chloroform may offer high nucleic acid yields, its failure to adequately remove PCR inhibitors and ensure consistent detection makes it a suboptimal choice for sensitive PCR-based applications, including the critical comparison of qPCR and ddPCR for absolute quantification [31] [34]. For researchers seeking reliable and reproducible results, investing in a optimized kit-based protocol is the most scientifically sound strategy.
Probe-Based Chemistry (TaqMan) for Enhanced Specificity in Complex Samples
In molecular biology research, particularly in fields like gut microbiome analysis and clinical diagnostics, the accurate absolute quantification of nucleic acids in complex biological samples remains a significant challenge. Fecal samples represent a prime example of a complex matrix, characterized by the presence of numerous PCR inhibitors and a diverse background of non-target genetic material. Within this context, quantitative PCR (qPCR) utilizing probe-based chemistry, such as TaqMan, has long been the established standard for sensitive and specific detection. However, the emergence of droplet digital PCR (ddPCR) as a third-generation technology promises absolute quantification without the need for standard curves. This guide objectively compares the performance of TaqMan probe-based qPCR against ddPCR for absolute quantification in fecal samples, providing researchers and drug development professionals with experimental data and protocols to inform their methodological choices.
Technical Comparison: qPCR vs. ddPCR
Fundamental Principles and Workflow
Quantitative PCR (qPCR) with TaqMan Probes relies on the 5' to 3' exonuclease activity of Taq polymerase. A TaqMan probe is a sequence-specific oligonucleotide dual-labeled with a reporter fluorophore at the 5' end and a quencher at the 3' end. When intact, the quencher suppresses the reporter's fluorescence via Fluorescence Resonance Energy Transfer (FRET). During PCR amplification, the probe hybridizes to its target sequence and is cleaved by the Taq polymerase, separating the reporter from the quencher and resulting in a fluorescent signal proportional to the amount of amplified product [37] [38]. The cycle at which the fluorescence crosses a defined threshold (Ct) is used for quantification relative to a standard curve [39].
Droplet Digital PCR (ddPCR) partitions a single PCR reaction into thousands to millions of nanoliter-sized water-in-oil droplets. Each droplet acts as an individual PCR reactor, containing zero, one, or a few target DNA molecules. After endpoint amplification, each droplet is analyzed for fluorescence. Using Poisson statistics, the ratio of positive to negative droplets allows for absolute quantification of the target DNA without the need for a standard curve [39] [4].
The workflows for both methods in fecal sample analysis are outlined below.
Performance Data in Fecal and Complex Matrices
Recent comparative studies provide quantitative data on the performance of qPCR and ddPCR in complex samples like feces. The following table summarizes key findings from the literature.
Table 1: Comparative Performance of qPCR and ddPCR in Complex Sample Analysis
| Study Context (Year) | Metric | qPCR (TaqMan) | ddPCR | Key Finding |
|---|---|---|---|---|
| Bacterial Quantification in Feces (2024) [1] [2] | Limit of Detection (LOD) | ~103 - 104 cells/g feces | ~103 - 104 cells/g feces | Comparable sensitivity with kit-based DNA extraction. |
| Reproducibility | High | Slightly Better | ddPCR showed marginally better reproducibility. | |
| Dynamic Range | Wider | Saturated at high conc. | qPCR could quantify higher concentrations without saturation. | |
| Cost & Speed | Faster, Cheaper | Slower, More Expensive | qPCR offers practical advantages for routine use. | |
| Tuberculosis Diagnosis (2023) [39] | Sensitivity | 0.66 (95% CI: 0.60-0.71) | 0.56 (95% CI: 0.53-0.58) | qPCR showed higher overall sensitivity. |
| Specificity | 0.98 (95% CI: 0.97-0.99) | 0.97 (95% CI: 0.96-0.98) | Comparable, high specificity for both. | |
| AUC (Extrapulmonary TB) | 0.94 | 0.97 | ddPCR had significantly better discriminant capacity for paucibacillary disease. | |
| Phytoplasma in Grapevine (2025) [40] | Sensitivity in Roots | 41.6% detected | 75% detected | ddPCR significantly more sensitive in inhibitor-rich complex tissues. |
| Inhibition Resistance | Affected by plant inhibitors | Not affected | ddPCR demonstrated superior resilience to PCR inhibitors. |
A 2024 study specifically targeting the absolute quantification of Limosilactobacillus reuteri in human fecal samples concluded that with optimized, kit-based DNA extraction methods, qPCR and ddPCR showed comparable sensitivity (Limit of Detection around 10^4 cells/g feces) and linearity (R² > 0.98) [2]. The study noted that qPCR had a wider dynamic range and was faster and more cost-effective, making it a advantageous choice for this application [1] [2].
Conversely, a 2023 meta-analysis on tuberculosis diagnosis found that while qPCR had a higher overall sensitivity, ddPCR showed a superior Area Under the Curve (AUC) for discriminating between patients with and without extrapulmonary tuberculosis, a paucibacillary condition often characterized by low pathogen loads [39]. This suggests ddPCR's potential advantage in low-target scenarios. Furthermore, a 2025 study on phytoplasma detection in grapevine roots found ddPCR to be about 10 times more sensitive than qPCR and less affected by PCR inhibitors present in the plant matrix, leading to a much higher detection rate in roots (75% vs. 41.6%) [40].
Experimental Protocols for Fecal Sample Analysis
Strain-Specific qPCR Assay for Absolute Quantification
Based on the optimized protocol described by [2], the following steps are recommended for accurate absolute quantification of bacterial strains in fecal samples using TaqMan qPCR.
Step 1: DNA Extraction from Fecal Samples
- Recommended Method: Use a kit-based DNA isolation method (e.g., QIAamp Fast DNA Stool Mini Kit or similar) [2]. Kit-based methods have been shown to perform comparably to phenol-chloroform protocols while being more consistent and easier to use, effectively reducing inhibitor carryover.
- Procedure: Homogenize 200 mg of fecal sample in lysis buffer. Perform mechanical lysis via bead-beating to ensure complete cell disruption. Follow the manufacturer's protocol for binding, washing, and eluting DNA. Assess DNA purity spectrophotometrically (260/280 ratio ~1.8).
Step 2: Primer and Probe Design
- Bioinformatic Identification: Identify strain-specific marker genes by comparing the target strain's genome against a database of related strains to find unique sequences.
- Design Parameters: Design primers with a length of 18-22 bases, melting temperature (Tm) of 58-60°C, and an amplicon size of 50-150 bp. The TaqMan probe should be designed to bind within the amplicon and should be dual-labeled (e.g., 5'-FAM, 3'-NFQ/MGB) to increase specificity and stability [41] [38].
Step 3: qPCR Reaction and Data Analysis
- Reaction Setup: Use a master mix containing Hot Start Taq DNA Polymerase, dNTPs, MgCl₂, and optimized buffers. A typical 20 µL reaction contains 1x Master Mix, 900 nM primers, 250 nM TaqMan probe, and 2-5 µL of template DNA.
- Cycling Conditions: Initial denaturation: 95°C for 10 min; 40 cycles of: 95°C for 15 sec (denaturation) and 60°C for 1 min (annealing/extension).
- Absolute Quantification: Generate a standard curve using a serially diluted gBlock gene fragment or genomic DNA of known concentration from the target strain. The standard curve, plotting Ct values against the log of the known concentrations, is used to interpolate the absolute quantity of the target in unknown samples [2].
ddPCR Adaptation and Workflow
The same primer-probe sets designed for qPCR can typically be transferred to a ddPCR protocol with minimal optimization [42].
- Reaction Setup: Prepare a reaction mix similar to qPCR but using a ddPCR Supermix. The total reaction volume is typically 20-22 µL.
- Droplet Generation: Load the reaction mix into a droplet generator, which partitions the sample into thousands of nanoliter-sized droplets.
- PCR Amplification: Transfer the droplets to a PCR plate and run endpoint amplification on a thermal cycler using a standard TaqMan cycling protocol.
- Droplet Reading and Analysis: Place the plate in a droplet reader, which counts the fluorescent positive and negative droplets. The instrument's software uses Poisson statistics to calculate the absolute concentration of the target DNA in copies/µL of the original reaction mix [4] [7].
The Scientist's Toolkit: Essential Research Reagent Solutions
The following table details key reagents and materials required for setting up probe-based quantification assays for complex samples like feces.
Table 2: Essential Research Reagents for Probe-Based Quantification Assays
| Item | Function / Description | Example / Note |
|---|---|---|
| TaqMan Probes | Sequence-specific detection. Dual-labeled oligonucleotides (fluorophore/quencher). | Available with various dyes (FAM, VIC) and quenchers (NFQ, TAMRA). MGB probes offer enhanced specificity for discriminating similar sequences [41]. |
| qPCR/ddPCR Master Mix | Provides core PCR components: Taq polymerase, dNTPs, MgCl₂, and optimized buffers. | "Environmental Master Mix" is formulated for complex samples and may be more resistant to inhibitors [4]. |
| Strain-Specific Primers | Amplify the target DNA region. | Must be designed bioinformatically for high specificity; HPLC-purified [2]. |
| DNA Extraction Kit | Isolate high-purity, inhibitor-free DNA from complex samples. | Kit-based methods (e.g., QIAamp Fast DNA Stool Mini Kit) are recommended for consistency and reduced inhibitor carryover [2]. |
| Digital PCR Droplet Generator/Reader | Hardware for partitioning samples and reading droplets (for ddPCR only). | Essential for ddPCR workflow. Not required for standard qPCR. |
| Absolute Quantification Standards | Calibrate qPCR assays for absolute quantification. | Serial dilutions of gBlock gene fragments or genomic DNA with known concentration [2]. |
The choice between TaqMan qPCR and ddPCR for absolute quantification in complex samples is context-dependent, guided by the specific requirements of the experiment.
TaqMan qPCR is a robust and well-established method that delivers excellent performance when optimized with high-quality DNA extraction and well-designed assays. It is particularly suitable for high-throughput workflows where cost, speed, and a wide dynamic range are primary considerations. The 2024 microbiome study demonstrates that for quantifying bacterial strains like L. reuteri in fecal samples, qPCR remains a top-choice technology due to its comparable accuracy and superior practicality [2].
ddPCR excels in specific challenging scenarios. Its principal advantages are its resilience to PCR inhibitors—a common issue in feces, plant, and soil samples—and its superior sensitivity for detecting very low abundant targets without a standard curve [7] [40]. This makes it the preferred tool for applications like diagnosing paucibacillary infections (e.g., extrapulmonary TB) [39], detecting pathogens in inhibitor-rich tissues [40], or verifying low-level probiotic colonization in clinical trials [42].
In summary, for most routine absolute quantification tasks in fecal samples, a properly optimized TaqMan qPCR assay provides a highly accurate, cost-effective, and efficient solution. However, for projects involving exceptionally low target concentrations, significant levels of PCR inhibitors, or where absolute quantification without a standard curve is paramount, ddPCR represents a more powerful, albeit more expensive, alternative. Researchers should weigh these technical and practical considerations against their experimental goals and resource constraints.
The accurate quantification of specific bacterial strains—be they beneficial probiotics, harmful pathogens, or engineered live biotherapeutics—in complex environments like the human gut is a fundamental challenge in microbiology and pharmaceutical development. While next-generation sequencing (NGS) technologies have revolutionized our understanding of microbial communities, they generate only semi-quantitative, compositional data and suffer from high detection limits and limited dynamic range [2]. This creates a pressing need for absolute quantification methods that can deliver precise, sensitive measurements of target microorganisms in complex matrices like fecal samples. Among available technologies, quantitative PCR (qPCR) and droplet digital PCR (ddPCR) have emerged as the leading solutions for strain-specific detection and quantification, each with distinct advantages and limitations that researchers must carefully consider for their specific applications.
Technology Comparison: qPCR vs. ddPCR for Bacterial Quantification
Fundamental Principles and Operational Differences
Quantitative PCR (qPCR) operates by monitoring the amplification of target DNA in real-time during polymerase chain reaction cycles. The quantification relies on comparing the amplification profile of unknown samples to a standard curve of known concentrations, enabling relative or absolute quantification when appropriate standards are available. This bulk reaction approach measures fluorescence at each cycle during the exponential phase of amplification, making it susceptible to variations in PCR efficiency and the presence of inhibitors in complex samples [6].
Droplet Digital PCR (ddPCR) takes a fundamentally different approach by partitioning a single PCR reaction into thousands of nanoliter-sized droplets, effectively creating individual reaction chambers. After end-point amplification, each droplet is analyzed as positive or negative for the target sequence, allowing for absolute quantification without the need for standard curves through direct application of Poisson statistics. This partitioning confers greater tolerance to PCR inhibitors and reduced dependence on amplification efficiency [6].
Performance Characteristics in Bacterial Detection
Table 1: Comparative Performance of qPCR and ddPCR for Bacterial Strain Quantification
| Performance Metric | qPCR | ddPCR | Supporting Evidence |
|---|---|---|---|
| Quantification Approach | Relative/Absolute (requires standard curve) | Absolute (no standard curve needed) | [6] |
| Limit of Detection (LOD) | ~103-104 cells/g feces | 10-100 fold lower than qPCR | [2] [42] |
| Dynamic Range | Wider dynamic range | Limited at high concentrations (>106 CFU/mL) | [2] [43] |
| Effect of PCR Inhibitors | Susceptible | Higher tolerance/robustness | [6] [42] |
| Reproducibility | Good reproducibility | Slightly better reproducibility | [2] |
| Cost & Speed | Cheaper and faster | More expensive and time-consuming | [2] |
| Detection Precision | Moderate precision | Higher precision for fractional abundance | [6] |
Experimental Protocols for Strain-Specific Quantification
Strain-Specific Primer Design and Validation
A robust protocol for developing strain-specific qPCR assays begins with comparative genomic analysis to identify unique genetic regions. For Limosilactobacillus reuteri strains, this approach enabled the design of highly specific primers targeting strain-specific marker genes. The validation workflow includes:
- In silico specificity testing against comprehensive genomic databases
- Empirical testing with both target and non-target strains to confirm specificity
- Determination of linearity and efficiency using serial dilutions of target DNA (R² > 0.98 indicates good linearity)
- Limit of detection (LOD) assessment in spiked fecal samples, with reported LOD of approximately 10³ cells/g feces for optimized L. reuteri assays [2]
DNA Extraction Method Optimization
The selection of DNA extraction methodology significantly impacts quantification accuracy. Comparative studies have demonstrated that kit-based DNA isolation methods (e.g., QIAamp Fast DNA Stool Mini Kit) outperform phenol-chloroform-based approaches for fecal samples. The optimized protocol includes:
- Sample washing with ice-cold PBS to remove soluble PCR inhibitors
- Mechanical lysis using bead beating for robust cell disruption
- Inhibitor removal steps incorporated into commercial kit protocols [2]
Proper sample storage at -80°C immediately after collection is critical for preserving DNA integrity and ensuring accurate quantification results in downstream applications [42].
Quantitative Analysis of Bacterial Dynamics Using Droplet Microfluidics
Emerging microfluidic technologies enable precise quantification of bacterial population dynamics in controlled environments. The experimental workflow involves:
- Droplet Production: Generating water-in-oil droplets using fluorocarbon oil (Novec 7500) with 1% surfactant (Pico-Surf 1)
- Droplet Injection: Utilizing electrode-free injection technology to modulate chemical environments within droplets
- Long-term Monitoring: Implementing trapping devices with immersion in water-filled Petri dishes to prevent evaporation, enabling monitoring for up to 240 hours [44]
This platform facilitates quantitative analysis of both natural and engineered bacterial strains, with applications in characterizing population dynamics and gene expression in response to environmental cues [44].
Figure 1: Workflow for absolute quantification of bacterial strains in complex samples, highlighting key decision points between qPCR and ddPCR technologies.
Research Reagent Solutions for Bacterial Quantification
Table 2: Essential Research Reagents and Materials for Bacterial Strain Quantification
| Reagent/Material | Function/Purpose | Example Products/Protocols |
|---|---|---|
| DNA Extraction Kits | Isolation of high-quality DNA from complex samples | QIAamp Fast DNA Stool Mini Kit, MagMax Total Nucleic Acid Isolation Kit [2] [42] |
| Strain-Specific Primers/Probes | Target-specific detection and quantification | Custom-designed primers from comparative genomic analysis [2] [43] |
| PCR Master Mixes | Enzymes and buffers for amplification | SYBR Fast, Taqman Fast Advanced mastermixes [42] |
| Digital PCR Reagents | Partitioning and amplification for ddPCR | Droplet generation oil, surfactants, reaction mixes [43] |
| Reference Strain Collections | Specificity testing and control materials | KCTC, KCCM, KACC, NBRC, NCCP collections [43] |
| Microfluidic Supplies | Droplet generation and manipulation | Fluorocarbon oil (Novec 7500), surfactant (Pico-Surf 1) [44] |
Application-Specific Performance and Data Interpretation
Detection of Probiotic Strains in Clinical Trials
In human clinical trials investigating multi-strain probiotics, both qPCR and ddPCR have demonstrated effectiveness for monitoring probiotic consumption and verifying treatment groups. A study examining a five-strain probiotic blend found that ddPCR exhibited a 10-100 fold lower limit of detection compared to qPCR, though both methods showed considerable congruence in results [42]. For multi-strain products, employing a layered discrimination approach using multiple assays provides robustness against potential underperformance of any single assay.
Quantification of Lactic Acid Bacteria in Food Matrices
Studies quantifying Lactiplantibacillus plantarum subsp. plantarum in fermented foods demonstrated that while both qPCR and ddPCR exhibited excellent linearity (R² ≥ 0.996), ddPCR showed a 10-fold lower limit of detection. However, ddPCR demonstrated limitations in the absolute quantitation of high bacterial concentrations (>10⁶ CFU/mL), suggesting that qPCR may be preferable for samples with high bacterial loads [43].
Monitoring Engineered Bacterial Strains
For synthetic biology applications involving engineered bacterial strains, quantification methods must address both population dynamics and functional gene expression. Microfluidic droplet systems enable long-term monitoring of population dynamics (up to 240 hours) while allowing manipulation of the chemical environment, providing insights into both natural and engineered bacterial responses to environmental cues [44].
Figure 2: Decision framework for selecting between qPCR and ddPCR technologies based on specific research requirements and sample characteristics.
The choice between qPCR and ddPCR technologies for quantifying probiotics, pathogens, and engineered bacterial strains depends heavily on specific research requirements, sample characteristics, and resource constraints. For most applications requiring absolute quantification of bacterial strains in fecal samples, qPCR with kit-based DNA extraction approaches provides the optimal balance of sensitivity, cost-effectiveness, and practical implementation [2]. However, in scenarios demanding exceptional sensitivity, detection of rare targets, or working with inhibitor-rich samples, ddPCR's partitioning technology offers distinct advantages despite higher costs and more complex workflows.
Future developments in bacterial quantification will likely focus on integrating microfluidic technologies for single-cell analysis, enhancing multiplexing capabilities for complex microbial communities, and developing standardized reference materials for cross-laboratory validation. As synthetic biology advances and engineered live biotherapeutics become more prevalent, quantification methods must evolve to address not just bacterial abundance but also functional gene expression and metabolic activity in complex environments.
Solving Common Challenges: Inhibition, False Positives, and Assay Optimization
Digital PCR (dPCR), particularly droplet digital PCR (ddPCR), demonstrates markedly superior tolerance to PCR inhibitors compared to quantitative PCR (qPCR) through its fundamental partitioning mechanism. This advantage is critically important for analyzing complex samples like feces, where co-extracted substances frequently inhibit traditional PCR reactions. By partitioning reactions into thousands of nanoliter-scale droplets, ddPCR mitigates inhibitor effects through dilution and statistical analysis, enabling more accurate absolute quantification of targets in inhibitor-rich environments. This guide examines the experimental evidence supporting ddPCR's robustness and provides practical methodologies for leveraging this technology in fecal microbiome research and drug development applications.
PCR inhibition represents a significant challenge in molecular biology, particularly when analyzing complex sample matrices like fecal material, soil, blood, and sputum. Inhibitory substances interfere with the amplification process through various mechanisms, including interaction with DNA polymerase, binding to nucleic acids, or quenching fluorescence signals [45]. In fecal samples, inhibitors such as bilirubin, bile salts, complex polysaccharides, and humic substances can co-purify with nucleic acids during extraction, substantially reducing amplification efficiency and detection sensitivity [46] [45]. These compounds exert their effects through distinct molecular mechanisms: humic acids directly inhibit DNA polymerase activity, heparin acts on the polymerase, while EDTA functions as a calcium chelator [47] [45].
The impact of these inhibitors differs significantly between qPCR and ddPCR technologies. In bulk reaction-based qPCR, inhibitors affect the entire reaction volume, causing delayed quantification cycle (Cq) values and inaccurate quantification [47] [48]. Even minor inhibition can substantially skew results, especially for low-abundance targets where Cq values approach the assay's detection limit [48]. Digital PCR's partitioned approach fundamentally changes this dynamic, offering researchers a powerful alternative for challenging sample types where inhibitor-related inaccuracies would otherwise compromise data quality.
Fundamental Mechanisms: How Partitioning Confers Advantage
The Partitioning Principle
Digital PCR's enhanced inhibitor tolerance stems from its core methodology of reaction partitioning. Unlike qPCR's bulk reaction approach, ddPCR divides each sample into thousands of nanoscale reactions—typically 10,000-20,000 droplets per sample [47] [48]. This partitioning effectively dilutes inhibitors across multiple reaction chambers, with many droplets containing no inhibitory molecules at all [47] [45]. The mechanism operates through two complementary processes: physical dilution of inhibitors across partitions and statistical randomization of inhibitor molecules following Poisson distribution [47].
Each droplet functions as an independent micro-reactor, with amplification success depending on the specific combination of target templates and inhibitor molecules within that partition [45]. Critically, amplification in ddPCR is measured at end-point rather than during exponential phase, making quantification less dependent on reaction kinetics [6] [45]. This approach allows partially inhibited reactions—which would yield unreliable Cq values in qPCR—to still contribute positively to quantification if they generate sufficient fluorescence to cross the positivity threshold [47]. The following diagram illustrates this protective partitioning mechanism:
Molecular Mechanisms of Inhibition Tolerance
The partitioned architecture of ddPCR provides protection against multiple inhibition mechanisms. For polymerase inhibitors like humic substances and heparin, the nanoliter reaction volumes reduce the probability of inhibitor-enzyme interactions, allowing amplification to proceed in partitions with sub-inhibitory concentrations [47] [45]. When inhibition does occur, it typically manifests as amplitude shifts in fluorescence rather than complete amplification failure, enabling accurate quantification through threshold adjustment during analysis [47].
For fluorescence-quenching inhibitors, ddPCR's endpoint measurement provides advantage over qPCR's continuous monitoring. While quenchers reduce fluorescence intensity uniformly in qPCR, affecting Cq determination, in ddPCR they primarily impact only the absolute fluorescence values without preventing binary (positive/negative) classification of partitions [45]. The statistical power of Poisson distribution analysis further enhances robustness by accounting for partially inhibited reactions in the final concentration calculation [6] [47].
Experimental Evidence: Comparative Performance Data
Controlled Inhibitor Spiking Studies
Direct comparisons demonstrate ddPCR's superior tolerance to specific inhibitors. In studies examining cytomegalovirus (CMV) detection, ddPCR exhibited significantly higher tolerance to SDS and heparin compared to qPCR, with greater than half-log increase in IC50 values (the concentration causing 50% inhibition) [47]. For SDS, the absolute log difference in IC50 was 0.554-0.628, and for heparin, it reached 0.655-0.855, indicating substantially better performance in inhibited conditions [47]. The probability of difference between ddPCR and qPCR performance exceeded 99.99% for both inhibitors [47].
Table 1: Half-Maximal Inhibitory Concentration (IC50) Comparisons
| Inhibitor | Target | qPCR IC50 (log) | ddPCR IC50 (log) | Absolute Difference (log) |
|---|---|---|---|---|
| SDS | IE gene | Baseline | Baseline + 0.554 | 0.554 |
| SDS | gB gene | Baseline | Baseline + 0.628 | 0.628 |
| Heparin | IE gene | Baseline | Baseline + 0.655 | 0.655 |
| Heparin | gB gene | Baseline | Baseline + 0.855 | 0.855 |
| EDTA | IE gene | Baseline | Baseline + 0.116 | 0.116 |
| EDTA | gB gene | Baseline | Baseline + 0.020 | 0.020 |
Notably, ddPCR did not show the same advantage with EDTA, a calcium chelator with different inhibition mechanisms, highlighting how inhibitor chemistry influences method performance [47]. This specificity underscores the importance of understanding sample-specific inhibition profiles when selecting appropriate quantification methods.
Performance in Complex Matrices
In fecal samples—particularly challenging due to diverse inhibitor profiles—ddPCR demonstrates remarkable robustness. When analyzing host inflammatory transcripts from human fecal samples, ddPCR successfully quantified GAPDH transcripts in >99% of samples (799 Malawian children samples), despite human mRNA representing less than 1% of total fecal RNA [46]. The method established a detection threshold of 0.02 copies target/GAPDH, with correlation coefficients between duplicate measurements exceeding 0.95 [46].
For bacterial quantification in fecal samples, one systematic comparison found that while ddPCR showed slightly better reproducibility, qPCR exhibited comparable sensitivity (limit of detection ≈10⁴ cells/g feces) and linearity (R² > 0.98) with kit-based DNA isolation methods [2]. However, ddPCR's advantage emerges with more challenging samples or suboptimal DNA extraction methods, where inhibitors remain prevalent despite purification attempts [46] [2].
Table 2: Method Performance in Fecal Samples
| Parameter | qPCR Performance | ddPCR Performance | Experimental Context |
|---|---|---|---|
| Sensitivity (LOD) | ~10⁴ cells/g feces | ~10⁴ cells/g feces | L. reuteri detection [2] |
| Linearity (R²) | >0.98 | >0.98 | L. reuteri detection [2] |
| Detection rate | Variable with inhibition | >99% samples | Host mRNA in feces [46] |
| Effect of RT contamination | 280% quantification bias | 5.9% difference | Gene expression [48] |
| Interface droplets | N/A | Increases with inhibitors | Visual quantification quality [48] |
Experimental Protocols for Fecal Sample Analysis
Fecal Nucleic Acid Extraction
Proper sample preparation is crucial for reliable PCR-based quantification. For fecal samples, the following protocol adapted from established methodologies ensures high-quality nucleic acid extraction [46] [2]:
Sample Collection and Preservation: Collect fresh fecal samples and immediately transfer to cryovials without buffers or preservatives. Flash-freeze in liquid nitrogen and store at -80°C until processing [46].
Homogenization: Weigh 200-300 mg of frozen stool and add to 1 ml of lysis buffer with 8-10 zirconium/silica disruption beads. Homogenize using MP FastPrep-24 tissue homogenizer (60 seconds, 6.5 m/s, repeated twice). Incubate at room temperature for 15 minutes [46].
Clarification: Centrifuge at 14,800×g for 10 minutes to pellet debris. Transfer clarified supernatant to extraction cartridges, avoiding particulates.
Nucleic Acid Extraction:
- Option A (Kit-based): Use NucliSENS easyMAG system or QIAamp Fast DNA Stool Mini Kit with offboard lysis protocol. Add 50 μl magnetic silica to clarified lysate and follow manufacturer's instructions [46] [2].
- Option B (Phenol-chloroform): Resuspend PBS-washed pellet in 750-μl lysis buffer. Incubate at 37°C for 20 min. Add 85 μl of 10% SDS and 30-μl proteinase K (20 mg/ml), then incubate at 60°C for 30 min. Extract with phenol-chloroform-isoamyl alcohol (25:24:1) [2].
DNA Purification and Storage: Purify DNA following manufacturer's protocols or standard ethanol precipitation. Determine purity spectrophotometrically (A260/A280 ratio >1.8). Store at -20°C until analysis [46] [2].
Droplet Digital PCR Setup and Analysis
The ddPCR workflow for fecal samples involves these critical steps:
Reaction Mixture Preparation:
- 7.76 μl total nucleic acids
- 10 μl ddPCR Supermix for Probes
- 0.08 μl SuperScript III Reverse Transcriptase (200 U/μl)
- 0.16 μl RNase OUT (40 U/μl)
- 1 μl of each 20× TaqMan Gene Expression Assay
- Adjust total volume to 20 μl with nuclease-free water [46]
Droplet Generation: Transfer reaction mixture to DG8 Cartridge. Add droplet generation oil to appropriate wells. Place in QX200 Droplet Generator per manufacturer's instructions [46] [48].
PCR Amplification: Transfer emulsified samples to 96-well PCR plate. Seal and run with following conditions:
- 50°C for 30 minutes (if including reverse transcription)
- 95°C for 10 minutes
- 40 cycles of: 94°C for 30 seconds, 60°C for 1 minute
- 98°C for 10 minutes
- Hold at 4°C [46]
Droplet Reading and Analysis: Place plate in QX200 Droplet Reader. Analyze using QuantaSoft software with manual threshold setting to distinguish positive and negative droplets. Apply Poisson correction for absolute quantification [47] [46].
The following workflow diagram illustrates this process:
Research Reagent Solutions
Table 3: Essential Research Reagents for ddPCR Inhibition Studies
| Reagent/Category | Specific Examples | Function in Inhibition Research |
|---|---|---|
| Inhibition Standards | SDS, Heparin, EDTA, Humic Acid | Controlled inhibition spiking studies to quantify method tolerance [47] [45] |
| Digital PCR Master Mix | ddPCR Supermix for Probes | Optimized chemistry for partitioned amplification [46] |
| Nucleic Acid Extraction Kits | QIAamp Fast DNA Stool Mini Kit, NucliSENS easyMAG | Inhibitor removal during nucleic acid purification [46] [2] |
| Partitioning Oil | DG8 Cartridges, Droplet Generation Oil | Creating nanoliter reactor compartments [46] [48] |
| Detection Chemistry | TaqMan Gene Expression Assays, Hydrolysis Probes | Target-specific fluorescence detection [47] [46] |
| Reference Materials | Synthetic DNA Standards, Control Cell Lines | Quantification accuracy validation [48] [2] |
Application in Fecal Microbiome Research
ddPCR's tolerance to inhibitors makes it particularly valuable for gut microbiome studies. Research quantifying Salmonella and Shigella in stool samples demonstrated that ddPCR yielded more positive detections than qPCR when analyzing 362 stool samples from children with and without diarrhea [16]. The technology established a limit of detection of 550 CFU/mL for Shigella and 1.0×10⁴ CFU/mL for Salmonella in spiked stool samples, confirming its utility for pathogen detection in complex matrices [16].
Furthermore, ddPCR enabled load differentiation between clinical states, with Salmonella load significantly higher in diarrheal samples than non-diarrheal samples [16]. Through receiver-operating characteristic analysis, researchers established an optimal cut-off value of 1.25×10⁴ copies/mL to distinguish between symptomatic and asymptomatic infections—demonstrating how ddPCR's precise quantification can inform clinical decision-making [16].
For probiotic studies, ddPCR provides sensitive strain-specific quantification essential for tracking bacterial engraftment and persistence. While one systematic comparison found qPCR sufficient for well-characterized systems with optimized extraction, ddPCR offers advantages for low-abundance targets or partially inhibited samples frequently encountered in human fecal samples [2].
ddPCR's partitioning mechanism provides fundamental advantages for PCR-based quantification in inhibitor-rich environments like fecal samples. Through reaction subdivision, ddPCR dilutes inhibitory compounds across thousands of partitions, enables end-point detection unaffected by amplification kinetics, and permits statistical correction for partially inhibited reactions. Experimental evidence demonstrates significantly improved tolerance to specific inhibitors like SDS and heparin, with half-log increases in IC50 values compared to qPCR [47].
For researchers investigating gut microbiome dynamics, pathogen detection, or probiotic efficacy, ddPCR offers particularly valuable capabilities for low-abundance targets and partially inhibited samples [48] [2]. While proper nucleic acid extraction remains essential, ddPCR's robustness to residual inhibitors provides an additional layer of protection against quantification artifacts. As molecular diagnostics continue to advance, ddPCR's unique properties position it as a powerful tool for absolute quantification in complex sample matrices where traditional qPCR approaches falter due to inhibition.
Strategies to Minimize False Positives and Establish Logical Cut-off Values
The accurate detection and absolute quantification of microbial targets in complex matrices like fecal samples are cornerstone activities in research and drug development. Fecal DNA presents particular challenges, including the presence of PCR inhibitors and a diverse background microbiome, which can complicate interpretation of results. For years, quantitative PCR (qPCR) has been the gold standard for such applications, but its reliance on cycle threshold (Ct) values and standard curves introduces potential vulnerabilities, including false positives and difficulties in establishing universal cut-off values [2].
Droplet Digital PCR (ddPCR) has emerged as a powerful alternative, offering absolute quantification without standard curves by partitioning a sample into thousands of individual reactions [4]. This guide objectively compares the performance of qPCR and ddPCR, focusing on their respective propensities for generating false positive results and the strategies each technology enables for establishing logical, defensible cut-off values. Framed within the context of fecal sample research, we provide supporting experimental data and detailed protocols to inform the selection of the most appropriate quantification method.
Performance Comparison: qPCR vs. ddPCR
The fundamental differences in how qPCR and ddPCR quantify nucleic acids lead to distinct performance characteristics, particularly regarding accuracy, sensitivity, and resistance to inhibitors. The table below summarizes a direct comparison based on recent studies.
Table 1: Comparative Performance of qPCR and ddPCR in Microbial Quantification
| Performance Characteristic | qPCR | ddPCR |
|---|---|---|
| Quantification Method | Relative (based on standard curve) | Absolute (direct count of molecules) [4] [49] |
| Sensitivity (Limit of Detection) | ~103 - 104 cells/g feces [2] | Can detect down to 0.5 copies/μL [49] |
| Precision | Good for mid/high abundance targets [49] | Higher precision; tighter error bars, especially for low-abundance targets [49] |
| Dynamic Range | Broad [49] | Can be limited at very high concentrations due to reaction saturation [4] |
| Impact of PCR Inhibitors | Susceptible; may require optimized master mixes [4] | More resilient due to end-point analysis [4] [49] |
| False Positive Management | Relies on accurate Ct cut-off determination; prone to unclear results near the limit of detection [50] | Enables logical cut-off determination based on positive droplet count; identifies false positives from non-specific amplification [50] |
| Multiplexing | Requires validation for matched amplification efficiency [49] | Simplified multiplexing with minimal optimization [49] |
A 2024 study systematically comparing qPCR and ddPCR for quantifying Limosilactobacillus reuteri in human fecal samples found that qPCR demonstrated a limit of detection (LOD) of around 104 cells/g feces and was almost as reproducible as ddPCR. The study also highlighted that qPCR has a wider dynamic range and is cheaper and faster, concluding it has certain advantages for absolute quantification of bacterial strains in feces [2]. Conversely, ddPCR showed superior accuracy for high viral loads in respiratory virus diagnostics and greater consistency for intermediate levels [51].
A critical advantage of ddPCR is its utility in optimizing qPCR assays. A 2025 study on diagnosing Entamoeba histolytica used ddPCR to evaluate the amplification efficacy of 20 different qPCR primer-probe sets. By measuring absolute positive droplet counts and correlating them with Ct values, the researchers could logically determine a specific cut-off Ct value of 36 cycles, effectively differentiating true infections from false positives in clinical stool specimens [50].
Experimental Protocols for Minimizing False Positives
Protocol: Using ddPCR to Establish a qPCR Cut-off Value
This protocol, adapted from an Entamoeba histolytica study, provides a robust method for defining a logical cut-off Ct value for a TaqMan-based qPCR assay [50].
- Primer-Probe Set Design: Design multiple primer-probe sets targeting your gene of interest.
- Amplification Efficacy Screening with ddPCR:
- Prepare serial dilutions of a target DNA standard with known concentration.
- Run all candidate primer-probe sets using ddPCR at different annealing temperatures and PCR cycle numbers (e.g., 30 and 50 cycles).
- Measure two key parameters for each reaction: Absolute Positive Droplet (APD) count and Mean Fluorescence Intensity.
- Select Optimal Primer-Probe Set: Identify sets that maintain high amplification efficiency, particularly at higher annealing temperatures (e.g., 62°C) to enhance specificity.
- Generate Standard Curve and Determine Cut-off:
- For the selected primer-probe set, run the DNA standard dilutions in qPCR to obtain Ct values.
- Plot the qPCR Ct values against the square of the APD counts ([APD]2) obtained from ddPCR for the same standards.
- This inverse proportional relationship (Ct ∝ 1/[APD]2) allows for the definition of a specific cut-off Ct value. The point where the correlation plateaus or where a significant drop in APD occurs can be defined as the logical cut-off.
- Clinical Validation: Validate the selected primer-probe set and its determined cut-off value using clinical specimens to confirm its effectiveness in differentiating true positives from false positives.
Protocol: Strain-Specific qPCR for Fecal Samples
This step-by-step protocol, derived from a 2024 microbiome study, focuses on designing a highly accurate qPCR assay for the absolute quantification of bacterial strains in fecal samples [2].
- Strain-Specific Marker Gene Identification:
- Obtain the whole genome sequence of the target bacterial strain.
- Use comparative genomics tools (e.g., BLAST) to identify unique gene sequences not present in closely related strains or the typical background microbiota.
- Primer Design and In Silico Validation:
- Design primers targeting the unique marker gene.
- Check primer specificity in silico against public databases to ensure they only bind to the target strain.
- DNA Extraction Optimization:
- Use a kit-based DNA isolation method (e.g., QIAamp Fast DNA Stool Mini Kit) that includes mechanical lysis and inhibitor removal steps. Studies show kit-based methods outperform phenol-chloroform-based methods in terms of purity and compatibility with PCR [2].
- qPCR Assay Validation:
- Specificity Test: Test the primers against DNA from a panel of non-target strains, including close relatives.
- Standard Curve Generation: Use a standard of known concentration (e.g., gBlock gene fragment or quantified genomic DNA from the target strain) to generate a calibration curve.
- Efficiency and Linearity: Ensure the assay has a PCR efficiency between 90-110% and a coefficient of determination (R2) of >0.98.
- Limit of Detection (LOD) and Quantification (LOQ): Determine the LOD and LOQ using fecal samples spiked with serially diluted target bacteria.
Visualizing Workflows and Logical Relationships
The following diagram illustrates the key decision points and strategies in the two experimental protocols for minimizing false positives.
The Scientist's Toolkit: Essential Research Reagents
Successful implementation of the protocols above requires careful selection of reagents and kits. The following table details key solutions and their functions.
Table 2: Essential Research Reagents for qPCR/ddPCR in Fecal Samples
| Research Reagent Solution | Function | Example Use Case / Note |
|---|---|---|
| Inhibitor-Resistant Master Mix | Mitigates PCR suppression from fecal compounds (e.g., bile salts, complex polysaccharides). | TaqMan Environmental Master Mix 2.0 showed superior resistance to inhibition compared to universal mixes in STEC quantification [4]. |
| Kit-Based DNA Extraction Kit | Standardizes cell lysis and purifies nucleic acids while removing PCR inhibitors. | QIAamp Fast DNA Stool Mini Kit and similar kits provide pure DNA, enhancing qPCR reproducibility vs. phenol-chloroform methods [2]. |
| Strain-Specific Primers/Probes | Enables precise targeting of the microbe of interest, minimizing cross-reactivity. | Designed from unique genomic markers identified via comparative genomics; critical for specificity in complex fecal microbiota [2]. |
| Digital PCR System | Provides absolute quantification and aids in qPCR assay optimization. | Platforms like QIAcuity or QX600 ddPCR System are used for determining optimal Ct cut-offs and assessing amplification efficiency [50] [51]. |
| Nucleic Acid Standard | Serves as a positive control and for generating standard curves (qPCR). | gBlock gene fragments or quantified genomic DNA from the target strain are used for qPCR calibration [2]. |
Both qPCR and ddPCR are powerful tools for the absolute quantification of microbial targets in challenging samples like feces. qPCR, especially when optimized with a logically determined cut-off value and inhibitor-resistant chemistry, remains a fast, cost-effective, and highly reproducible method [2]. However, ddPCR offers distinct advantages for specific applications, including superior precision for low-abundance targets, inherent resilience to inhibitors, and a unique capability to validate qPCR assays and establish definitive cut-off values [50] [49].
The choice between the two technologies should be guided by the specific experimental needs. For high-throughput quantification of abundant targets, a well-optimized qPCR assay is sufficient. For detecting subtle changes in low-abundance targets, diagnosing complex samples where inhibitor presence is a major concern, or for establishing the highest level of assay rigor to minimize false positives, ddPCR is the preferred choice. By applying the strategies and protocols outlined in this guide, researchers can make an informed decision and implement a robust quantitative framework for their fecal sample research.
The Impact of Restriction Enzymes on Accessing Tandemly Repeated Genes
Tandem repeats—sequences of DNA where a motif of nucleotides is repeated in a head-to-tail fashion—constitute more than 3% of the human genome and are significant hotspots of genetic variation and disease [52]. These regions are broadly categorized into Short Tandem Repeats (STRs), with motifs of 1-6 base pairs, and Variable Number Tandem Repeats (VNTRs), with motifs ≥7 base pairs [52] [53]. For researchers quantifying bacterial strains or host genetic markers in complex matrices like fecal samples, these repetitive regions pose a substantial analytical challenge. Their repetitive nature complicates PCR amplification and precise quantification, which is crucial in fields such as gut microbiome research and molecular diagnostics [1] [54].
The choice of quantification technology—quantitative PCR (qPCR) or droplet digital PCR (ddPCR)—is central to overcoming these challenges. While qPCR has been a longstanding workhorse for relative quantification, ddPCR provides absolute quantification without the need for a standard curve, partitioning each sample into thousands of nano-reactions for direct counting of target DNA molecules [1] [4] [5]. A critical, yet often overlooked, factor that influences the performance of both these techniques, especially when targeting tandemly repeated genes, is the use of restriction enzymes. These enzymes digest long DNA strands, enhancing the accessibility of target sites buried within repetitive structures, and their selection can profoundly impact the accuracy, precision, and sensitivity of the final quantification [55] [56].
This guide objectively compares the role of restriction enzymes in qPCR and ddPCR applications, with a specific focus on accessing tandem repeats. It synthesizes current experimental data to provide a clear protocol and resource for scientists making informed methodological choices.
Understanding Tandem Repeats and Analysis Technologies
The Biological and Technical Significance of Tandem Repeats
Tandem repeats are not just neutral genomic features; they have substantial functional consequences. They are responsible for a large fraction of structural variation longer than 50 base pairs and have been linked to over 50 nervous system diseases, including ALS, Fragile X syndrome, ataxias, and schizophrenia [52] [54]. Furthermore, variations in VNTRs have been correlated with rapid morphological evolution, as famously demonstrated in the diverse skull shapes of domestic dog breeds [57].
From a technical perspective, the repetitive structure of these regions causes significant issues for molecular analysis. During PCR amplification, the presence of nearly identical adjacent sequences promotes slipped-strand mispairing, a high-rate mutation phenomenon that can lead to artifacts and inaccurate quantification [57]. More importantly, the physical conformation of DNA containing long tandem repeats can make the target sites for PCR primers and probes inaccessible. The DNA may be tightly folded or bound by proteins, preventing the reagents from binding efficiently. This is where restriction enzyme digestion becomes a critical preparatory step.
qPCR vs. ddPCR: Core Principles and Relevance to Repetitive Regions
Quantitative PCR (qPCR) is a relative quantification method. It monitors the amplification of a target DNA sequence in real-time, with the cycle threshold (Ct) indicating the starting quantity relative to a standard curve. Its performance can be adversely affected by inhibitors commonly found in fecal samples and by the inefficiency of amplifying difficult templates like tandem repeats [1] [4].
Droplet Digital PCR (ddPCR), a third-generation PCR technology, offers a different paradigm based on absolute quantification [1] [5]. The reaction mixture is partitioned into thousands of nanodroplets, and an end-point PCR is run in each droplet. After amplification, droplets are counted as positive or negative, and the absolute concentration of the target DNA in the original sample is calculated using Poisson statistics [4] [5]. This partitioning confers two key advantages for analyzing complex samples: it dilutes out PCR inhibitors present in the sample, making the reaction less prone to their effects, and it can improve the sensitivity and precision for targets that are difficult to amplify, such as those within repetitive DNA [4] [56].
The following workflow illustrates the critical role of restriction enzyme digestion in the ddPCR process for analyzing tandem repeats:
The Role of Restriction Enzymes in PCR-Based Quantification
Restriction enzymes are endonucleases that recognize specific short DNA sequences and cleave the DNA at or near those sites. In the context of PCR-based quantification of tandem repeats, their function is not to create restriction fragment length polymorphisms (RFLPs) for analysis, but rather to serve as a preparatory tool to fragment the genomic DNA.
Mechanism of Action: How Digestion Improves Access
The primary benefit of restriction enzyme digestion is that it disrupts the complex higher-order structure of genomic DNA. By cutting the DNA into smaller, more manageable fragments, the enzymes physically expose target sequences that were previously hidden within the folded architecture of the chromosome or within long, repetitive arrays [55]. This increased accessibility allows PCR primers and probes to bind to their target sites more efficiently and reliably, leading to more robust and consistent amplification. This is particularly critical for tandemly repeated genes, which are often prone to forming secondary structures that hinder polymerase progression and reagent binding.
Experimental Evidence: The Data Supporting Enzyme Selection
A 2025 study directly tested the impact of restriction enzyme choice on the precision of gene copy number quantification in the ciliate Paramecium tetraurelia, an organism with high gene copy numbers and tandemly repeated genes [56]. The study compared the precision (measured by the Coefficient of Variation, %CV) of two digital PCR platforms when using two different restriction enzymes, EcoRI and HaeIII.
The results, summarized in the table below, demonstrate that the choice of enzyme has a profound and platform-specific effect on data quality.
Table 1: Impact of Restriction Enzyme Choice on Quantification Precision (%CV) in Digital PCR [56]
| Number of Cells | ddPCR with EcoRI (%CV) | ddPCR with HaeIII (%CV) | ndPCR with EcoRI (%CV) | ndPCR with HaeIII (%CV) |
|---|---|---|---|---|
| 10 | 15.1% | 3.5% | 6.2% | 14.6% |
| 50 | 62.1% | 2.9% | 27.7% | 4.7% |
| 100 | 11.5% | 2.5% | 6.1% | 3.9% |
| 500 | 15.9% | 4.9% | 2.0% | 1.6% |
| 1000 | 2.5% | 2.5% | 0.6% | 2.7% |
The data reveals a clear trend: for the droplet-based ddPCR system (QX200 from Bio-Rad), the use of HaeIII dramatically improved precision across almost all cell numbers, reducing the %CV from a highly variable and sometimes extreme value (e.g., 62.1%) to a consistently low one (below 5%) [56]. This suggests that HaeIII is more effective than EcoRI at digesting the DNA from this organism in a way that uniformly exposes the tandemly repeated target, leading to a more consistent amplification profile across thousands of droplets. In contrast, the effect on the nanoplate-based system (QIAcuity One from QIAGEN) was less pronounced, though still notable for specific cell counts [56]. This underscores that enzyme performance is not universal but can depend on the specific digital PCR platform and the sample type.
Comparative Experimental Data: qPCR vs. ddPCR with Restriction Enzymes
To provide a holistic view of how these technologies perform in real-world scenarios, the following table synthesizes key findings from multiple studies that have compared qPCR and ddPCR, with implications for restriction enzyme use.
Table 2: Comparative Performance of qPCR and ddPCR in Complex Sample Matrices
| Aspect of Comparison | qPCR Performance | ddPCR Performance | Context & Implication for Restriction Enzymes |
|---|---|---|---|
| Quantification Principle | Relative (requires standard curve) [4] [5] | Absolute (no standard curve) [4] [5] | Restriction enzymes ensure accurate fragmentation for both, but ddPCR's absolute count is less dependent on calibration quality. |
| Susceptibility to PCR Inhibition | Varies by mastermix; can be substantial [4] | More robust; inhibitors are diluted by partitioning [4] [5] | Digestion helps both, but ddPCR's inherent resistance is a key advantage in dirty samples like feces. |
| Limit of Detection (LOD) in Feces | ~10³ to 10⁴ cells/g [1] | Can be equivalent or superior to qPCR [1] [4] | Pre-digestion with enzymes like HaeIII can lower the effective LOD by improving target accessibility [56]. |
| Precision with Tandem Repeats | N/A (Specific data not in results) | High precision, but heavily dependent on restriction enzyme choice (see Table 1) [56] | Enzyme selection is a critical success factor for precise ddPCR of repetitive genes. |
| Linear Dynamic Range | Wider dynamic range [1] | Can saturate at high concentrations (>10⁵ copies/µL) [4] | Restriction digestion creates more uniform fragments, potentially improving linearity in both techniques. |
The data consistently shows that while qPCR can be a robust and cost-effective choice, ddPCR offers distinct advantages in absolute quantification, resistance to inhibition, and potential for high precision [1] [4] [5]. However, the 2025 study adds a crucial caveat: the superior precision of ddPCR is not automatic and is conditional on the use of an appropriate restriction enzyme [56].
Detailed Methodologies: Protocols for Restriction Enzyme Digestion in PCR Workflows
Protocol for Direct Digestion in ddPCR
New England Biolabs (NEB) provides a streamlined protocol for integrating restriction enzyme digestion directly into the ddPCR reaction setup, which saves time and reduces sample handling [55].
- Reaction Assembly at Room Temperature: Assemble the ddPCR reaction mix at room temperature. This includes the DNA template, primers/probes, supermix, and 0.5–1 μL of each restriction enzyme (providing 5–20 units of activity).
- In-Tube Digestion: The restriction enzymes will begin digesting the genomic DNA during the reaction setup period.
- Droplet Generation: After setup, proceed with droplet generation as normal. No separate incubation or heat inactivation is required.
- PCR Amplification: The restriction enzymes will be permanently inactivated during the first high-temperature denaturation step of the PCR cycle [55].
Protocol for Standard Digestion Prior to PCR
For both qPCR and ddPCR, a separate, dedicated digestion step can be performed. This is the method used in the comparative study that found a strong effect of enzyme choice [56].
- Digest Setup: Set up the restriction digest in the manufacturer's recommended buffer. Use 10 units of enzyme per microgram of DNA.
- Incubation: Incubate the reaction for 5–60 minutes at the enzyme's optimal temperature (e.g., 37°C for many common enzymes).
- Inactivation (Optional): Heat-inactivate the enzyme if desired, though this is not strictly required.
- PCR Reaction: No cleanup is necessary. The digestion mixture can be directly added to the subsequent qPCR or ddPCR reaction. It is recommended to avoid carrying over more than 1/10 of the total PCR volume from the digest mixture [55].
The Scientist's Toolkit: Essential Reagents for Analysis
Table 3: Key Research Reagents for Accessing Tandem Repeats via PCR
| Reagent | Function & Rationale |
|---|---|
| Restriction Enzymes (e.g., HaeIII, EcoRI) | Fragment genomic DNA to enhance accessibility to tandemly repeated target sequences. Selection is critical for precision [55] [56]. |
| TaqMan Environmental Master Mix 2.0 (EMM) | A qPCR mastermix designed for complex environmental samples. Shows superior resistance to PCR inhibitors compared to universal mixes [4]. |
| Strain-Specific Primers/Probes | Designed from unique genome sequences to target specific bacterial strains (e.g., Limosilactobacillus reuteri) within a complex community like the gut microbiome [1]. |
| Digital PCR Supermix | A specialized PCR mix optimized for droplet formation and stability in ddPCR assays, often containing a high concentration of polymerase to accommodate partitioning [55]. |
| Kit-Based DNA Isolation Kits | Standardized methods for extracting DNA from challenging samples like feces, providing a balance of yield, purity, and reproducibility for reliable downstream PCR [1]. |
The objective comparison of qPCR and ddPCR for the absolute quantification of targets in fecal samples must explicitly account for the role of restriction enzymes, particularly when the target lies within or near tandemly repeated genes. While ddPCR demonstrates clear advantages in absolute quantification, inhibitor resistance, and potential for high precision, its performance is contingent on optimized sample preparation.
The key empirical finding is that restriction enzyme selection is a decisive factor for data quality. The dramatic improvement in precision observed when using HaeIII over EcoRI in a ddPCR assay for a protist with high gene copy numbers serves as a powerful example [56]. This implies that researchers cannot assume all enzymes will perform equally. A brief, preliminary optimization testing different enzymes is a worthwhile investment.
For research requiring the highest precision in quantifying bacterial strains, host genetic VNTRs, or other repetitive elements in complex samples like feces, the recommended path is a ddPCR workflow that incorporates a restriction enzyme digestion step validated for the specific target-sample system. As long-read sequencing technologies continue to improve our understanding of the complex architecture of tandem repeats [52] [54], the synergy between sophisticated DNA preparation techniques like restriction digestion and advanced quantification platforms like ddPCR will become increasingly vital for accurate molecular diagnostics and microbiome research.
Optimizing Annealing Temperature and Cycle Numbers for Maximum Sensitivity and Specificity
In the field of molecular microbiology, the accurate absolute quantification of bacterial strains from complex samples like feces is a cornerstone for advancing research in gut health, probiotic development, and therapeutic monitoring. The debate between using quantitative PCR (qPCR) and droplet digital PCR (ddPCR) for this purpose is central to designing sensitive and specific assays. The optimization of annealing temperature and cycle numbers is a critical step that directly influences the performance, reliability, and reproducibility of these PCR-based techniques. Framed within the broader thesis of qPCR versus ddPCR for absolute quantification in fecal samples, this guide provides an objective comparison of how to optimize these key parameters, supported by experimental data and detailed protocols. While next-generation sequencing provides valuable community profiles, its semi-quantitative nature and higher detection limits often necessitate complementary, more quantitative methods like qPCR and ddPCR for strain-level absolute quantification [2] [1] [58].
Principles of qPCR and ddPCR
While both qPCR and ddPCR are used for nucleic acid quantification, their underlying principles and optimization needs differ significantly, influencing how parameters like annealing temperature are fine-tuned.
Quantitative PCR (qPCR) is a relative quantification method that relies on the monitoring of amplification in real-time. The fluorescence signal increases proportionally to the amount of amplified target DNA and is measured at each cycle. The cycle at which the fluorescence crosses a predetermined threshold (Ct value) is used to quantify the initial amount of target, using a standard curve for reference. This method is highly dependent on PCR efficiency, which can be affected by reaction components and inhibitors present in the sample. Consequently, optimization of the annealing temperature is crucial to ensure high efficiency, specific binding of primers, and minimal primer-dimer formation [39] [6].
Droplet Digital PCR (ddPCR), a third-generation PCR, is an absolute quantification method that does not require a standard curve. The reaction mixture is partitioned into thousands of nanoliter-sized droplets, and PCR amplification is carried out to endpoint within each individual droplet. Following amplification, each droplet is analyzed for fluorescence, and the fraction of positive droplets is counted. Using Poisson statistics, the absolute concentration of the target molecule in the original sample is calculated. This partitioning also reduces the impact of PCR inhibitors and makes ddPCR less dependent on PCR efficiency, as it is an end-point measurement [39] [6] [4].
The table below summarizes the core differences between the two technologies:
Table 1: Fundamental comparison of qPCR and ddPCR principles.
| Feature | Quantitative PCR (qPCR) | Droplet Digital PCR (ddPCR) |
|---|---|---|
| Quantification Type | Relative (requires standard curve) | Absolute (no standard curve) |
| Principle | Real-time fluorescence monitoring during exponential amplification | End-point fluorescence detection in thousands of partitioned droplets |
| Data Output | Cycle threshold (Ct) | Copies per microliter (via Poisson statistics) |
| Impact of PCR Efficiency | High impact; affects Ct value and quantification accuracy | Lower impact due to end-point detection |
| Tolerance to Inhibitors | Moderate to low | High, due to sample partitioning [6] [4] |
| Optimal Use Cases | High-throughput screening, gene expression with wide dynamic range | Detection of rare variants, absolute copy number variation, low-abundance targets [39] [6] |
Systematic Comparison of qPCR and ddPCR Performance
Recent studies have directly compared the performance of qPCR and ddPCR for the quantification of microorganisms in complex sample matrices, including feces. The results indicate that the choice of the best method can be application-dependent.
A 2024 study focusing on the absolute quantification of Limosilactobacillus reuteri strains in human fecal samples found that while ddPCR showed slightly better reproducibility, qPCR demonstrated comparable sensitivity and linearity when kit-based DNA isolation methods were used. The limit of detection (LOD) for both methods was around 10^4 cells/g feces. The study concluded that qPCR had a wider dynamic range and was both cheaper and faster than ddPCR, giving it practical advantages for this specific application [2] [1] [58].
Conversely, a meta-analysis on tuberculosis diagnosis in 2023 reported that while qPCR had higher pooled sensitivity and specificity, ddPCR showed a larger area under the ROC curve (AUC), indicating better overall diagnostic performance. This was particularly true for extrapulmonary tuberculosis, where ddPCR's superior discriminant capacity was attributed to its higher sensitivity in detecting low bacterial loads in challenging clinical samples [39].
Another study on SARS-CoV-2 in wastewater found that the theoretical sensitivity gains of ddPCR did not always materialize in practice. The limits of detection (LOD) and quantification (LOQ) for RT-qPCR and RT-ddPCR were within the same order of magnitude, with no significant differences in the number of positive samples during low-incidence periods [59].
The following table consolidates key performance metrics from these comparative studies:
Table 2: Experimental performance comparison of qPCR and ddPCR across different sample types.
| Application / Study | Metric | qPCR Performance | ddPCR Performance |
|---|---|---|---|
| L. reuteri in Feces [2] | Limit of Detection (LOD) | ~10^4 cells/g | ~10^4 cells/g |
| Reproducibility | High | Slightly Better | |
| Dynamic Range | Wider | Narrower | |
| Tuberculosis Diagnosis [39] | Pooled Sensitivity | 0.66 | 0.56 |
| Pooled Specificity | 0.98 | 0.97 | |
| Area Under ROC Curve (AUC) | 0.94 | 0.97 | |
| STEC in Bovine Feces [4] | Tolerance to Inhibitors (Bile Salts) | Moderate (depends on mastermix) | High |
| SARS-CoV-2 in Wastewater [59] | Sensitivity in Low-Incidence Samples | Comparable to ddPCR | Comparable to qPCR |
Optimizing Annealing Temperature
Annealing temperature is a paramount factor for both sensitivity and specificity. An temperature that is too low can lead to non-specific binding and primer-dimer artifacts, while a temperature that is too high can reduce yield by preventing efficient primer binding.
Optimization Strategies for qPCR
In qPCR, the annealing temperature is typically optimized using a temperature gradient PCR. A range of temperatures (e.g., 55°C to 65°C) is tested with a control template. The optimal temperature is identified as the one that produces the lowest Ct value (indicating high efficiency) with a single, specific peak in the melt curve analysis. Most qPCR assays use a universal two-step cycling protocol (e.g., 95°C denaturation, 60°C combined annealing/extension); however, fine-tuning this combined step can yield significant improvements in assay robustness [2].
Optimization Strategies for ddPCR
Due to its end-point nature and the challenge of "rain" (droplets with intermediate fluorescence), annealing temperature optimization in ddPCR is even more critical. A suboptimal temperature can exacerbate rain, complicating the threshold setting and compromising quantification accuracy. The goal is to maximize the separation value between the positive and negative droplet populations [60].
An experience matrix approach has been developed to objectively rate assay performance. This involves testing different annealing/extension temperatures and oligonucleotide concentrations and calculating a droplet separation value based on the absolute fluorescence signal distance and variation within the positive and negative droplet populations. The parameters that yield the highest separation value are chosen for the final assay, ensuring clear, unambiguous droplet clusters and minimizing rain [60].
Diagram: The workflow for optimizing annealing temperature in qPCR and ddPCR.
Optimizing Cycle Numbers
The number of PCR cycles directly impacts the assay's sensitivity and its potential to generate false-positive signals from background noise.
Cycle Number in qPCR
In qPCR, the reaction is typically run for 40-45 cycles. The target should ideally be detected and quantified well before the later cycles (e.g., before cycle 35-38). A Ct value that appears in the very late cycles (e.g., >38) is often considered of low reliability and may be close to the background noise. Therefore, optimizing reaction components and conditions to lower the Ct value is preferred over simply increasing the cycle number, which can increase non-specific background [59].
Cycle Numbers in ddPCR
As an end-point method, ddPCR requires a sufficient number of cycles to ensure that all droplets containing the target have reached a fluorescent plateau. However, excessive cycling can increase background fluorescence in negative droplets, potentially leading to rain. Most ddPCR protocols recommend 40-45 cycles, which is generally sufficient to distinguish positive and negative populations clearly. The optimal cycle number is one that maximizes the fluorescence amplitude of the positive cluster while keeping the negative cluster tight and distinct. The partitioning itself provides the sensitivity for low-abundance targets, not an excessively high cycle number [60] [59].
The Scientist's Toolkit: Research Reagent Solutions
The following table details key reagents and materials essential for setting up and optimizing qPCR and ddPCR assays for fecal sample analysis, based on the methodologies cited in the reviewed literature.
Table 3: Essential research reagents and their functions in PCR-based quantification.
| Reagent / Material | Function | Example from Literature |
|---|---|---|
| Kit-based DNA Isolation Kit | Isolation of high-purity, inhibitor-free genomic DNA from complex fecal samples. Critical for consistent PCR results. | QIAamp Fast DNA Stool Mini Kit (Qiagen) [2] |
| Strain-Specific Primers & Probes | Oligonucleotides designed for unique genomic regions of the target bacterial strain to enable specific detection. | Primers for L. reuteri 17938, PB-W1, DSM 20016 T [2] [58] |
| Hydrolysis Probes (e.g., TaqMan) | Fluorescently-labeled probes that increase specificity by requiring hybridization to the target for signal generation. | FAM-labeled probes, often with non-fluorescent quenchers [60] [59] |
| qPCR Master Mix | Optimized buffer, enzymes, dNTPs for efficient real-time PCR amplification. | TaqMan Environmental Master Mix 2.0 (EMM) [4] |
| ddPCR Supermix | Specialized master mix formulation for stable droplet generation and robust endpoint amplification. | ddPCR Supermix for Probes (Bio-Rad) [2] [59] |
| Droplet Generator Cartridges | Microfluidic devices used to partition the PCR reaction mix into thousands of nanoliter droplets. | DG8 Cartridges (Bio-Rad) [60] |
| Certified Reference Materials | Standards with known target concentrations for validating and calibrating quantitative assays. | Certified reference materials for GMO analysis [60] |
The choice between qPCR and ddPCR for absolute quantification in fecal samples is not a simple matter of one being universally superior. For applications requiring high-throughput, cost-effectiveness, and a wide dynamic range, such as routine quantification of a bacterial strain in a clinical trial, qPCR is a robust and often sufficient choice, especially when paired with a kit-based DNA extraction protocol [2] [58]. However, for challenges involving very low abundance targets, significant levels of PCR inhibitors, or a need for absolute quantification without a standard curve, ddPCR holds a distinct advantage, as evidenced in diagnostics for extrapulmonary tuberculosis and environmental monitoring [39] [4].
The pathway to maximum sensitivity and specificity for either technology hinges on rigorous optimization. Researchers must systematically refine annealing temperature—using a gradient PCR coupled with melt-curve analysis for qPCR or a separation-value approach for ddPCR—and select appropriate cycle numbers to maximize signal detection while minimizing background noise. By following the detailed protocols and considering the comparative data presented, scientists can make an informed decision and develop highly accurate molecular assays for their specific research needs in gut microbiome and drug development.
Head-to-Head Comparison: Analytical Performance, Cost, and Application Fit
The accurate detection and quantification of microbial targets in complex matrices like fecal samples are foundational to advancements in gut health, probiotic efficacy, and pathogen detection research. For years, quantitative real-time PCR (qPCR) has been the standard tool for such investigations. However, the emergence of droplet digital PCR (ddPCR) represents a significant shift in molecular quantification, offering a method for absolute quantification without the need for a standard curve. This guide provides an objective, data-driven comparison of these two technologies, focusing on the critical performance parameters of Limit of Detection (LOD) and Limit of Quantification (LOQ). Understanding these limits is essential for researchers to choose the optimal method for their specific application, whether it involves tracking low-abundance pathogens, validating probiotic strains in clinical trials, or quantifying subtle shifts in microbial community structures. The core of this comparison lies in evaluating which technology can most reliably detect and quantify the smallest amount of target DNA in the challenging and inhibitor-rich environment of fecal samples.
Technology at a Glance: qPCR vs. ddPCR
Fundamental Principles
Quantitative Real-Time PCR (qPCR): This method relies on the relative quantification of a target nucleic acid sequence. It monitors the amplification of DNA in real-time using fluorescence. The cycle at which the fluorescence crosses a predefined threshold (Ct value) is proportional to the starting quantity of the target. This Ct value is compared to a standard curve of known concentrations to estimate the quantity in unknown samples [61] [62].
Droplet Digital PCR (ddPCR): This technique provides absolute quantification by partitioning a single PCR reaction into thousands of nanoliter-sized droplets. Each droplet acts as an individual PCR reaction. After amplification, the droplets are analyzed to count how many contained the target sequence (positive) and how many did not (negative). The absolute concentration of the target, in copies per microliter, is then calculated directly using Poisson statistics, without the need for a standard curve [10] [61] [12].
Visual Workflow Comparison
The fundamental difference in their approaches is illustrated in the following experimental workflows:
Performance Comparison: LOD and LOQ
Direct comparisons of LOD and LOQ across multiple studies provide a clear picture of the sensitivity advantages offered by digital PCR technologies.
Table 1: Comparative LOD and LOQ of PCR Methods
| Method | Target | Limit of Detection (LOD) | Limit of Quantification (LOQ) | Context / Sample Matrix | Source |
|---|---|---|---|---|---|
| ddPCR | Mitochondrial DNA | Lower than qPCR | Lower than qPCR | Synthetic DNA & Bird Blood/Sperm | [61] |
| QIAcuity ndPCR | Gene Copy Number | 0.39 copies/µL input | 54 copies/reaction | Synthetic Oligonucleotides | [56] |
| QX200 ddPCR | Gene Copy Number | 0.17 copies/µL input | 85.2 copies/reaction | Synthetic Oligonucleotides | [56] |
| qPCR | Mitochondrial DNA | Higher than dPCR/ddPCR | Higher than dPCR/ddPCR | Synthetic DNA & Bird Blood/Sperm | [61] |
| qRT-PCR vs ddPCR | Probiotic Strains | ~10-100x higher | Not Specified | Human Fecal Samples | [12] |
Key Performance Insights
- * Superior Sensitivity for Low-Abundance Targets:* A study quantifying mitochondrial DNA in bird blood and sperm cells, which have low mitochondrial content, found that both dPCR and ddPCR had lower LODs and LOQs than qPCR. This makes digital PCR the preferred method for targets present in low abundance [61].
- Direct Comparison in Probiotic Detection: In a human clinical trial analyzing fecal samples, ddPCR demonstrated a 10 to 100-fold lower limit of detection compared to qRT-PCR for detecting specific probiotic strains, highlighting its enhanced sensitivity in complex sample matrices [12].
- Platform-Specific Variation: The LOD and LOQ can also vary between different digital PCR platforms. One study reported an LOD of 0.17 copies/µL for the droplet-based QX200 system and 0.39 copies/µL for the nanoplate-based QIAcuity system, though both showed high precision [56].
Resistance to PCR Inhibition in Fecal Samples
Fecal samples are notoriously complex and contain substances like bilirubin and bile salts that can inhibit the PCR reaction, leading to underestimation of target concentrations. This is a critical parameter for any method applied to fecal research.
Table 2: Inhibition Resistance in Complex Samples
| Method | Master Mix / Platform | Resistance to PCR Inhibition | Experimental Evidence |
|---|---|---|---|
| ddPCR | Not Specified | High | Accurate quantification of STEC in artificial and natural cattle feces with no observed inhibition [10]. |
| qPCR | TaqMan Environmental Master Mix 2.0 (EMM) | High | Good agreement with ddPCR; no inhibition recorded in cattle fecal samples [10]. |
| qPCR | TaqMan Universal PCR Master Mix (UMM) | Low | Results were substantially inhibited by bile salts and generally lower than ddPCR/EMM [10]. |
The choice of master mix in qPCR is a critical factor for overcoming inhibition. However, ddPCR's endpoint measurement and partitioning technology make it inherently less susceptible to the effects of PCR inhibitors that typically impact amplification efficiency, providing more robust and reliable results in complex matrices like feces [10].
Essential Protocols for Fecal Sample Analysis
DNA Extraction from Fecal Material
A robust DNA extraction protocol is the first critical step for any downstream PCR analysis. The following method, adapted from a clinical trial on probiotics, has been validated for use with fecal samples [12].
- Weighing: Weigh out 200 mg of fecal sample. Immediate storage at -80°C after collection is crucial to preserve nucleic acid integrity.
- Lysis: Add lysis/binding buffer from a nucleic acid isolation kit and subject the sample to mechanical bead-beating.
- Homogenization: Use a homogenizer (e.g., Precellys) for 2 cycles of 3 pulses for 30 seconds at 6800 RPM. This step is vital for breaking down tough cell walls of Gram-positive bacteria.
- Nucleic Acid Isolation: Process the lysate using a magnetic particle processor and a dedicated total nucleic acid isolation kit (e.g., MagMAX).
- Quantification: Quantify the purified DNA using a fluorometer (e.g., Qubit with HS kit) to ensure accurate and consistent loading in subsequent PCR reactions.
Key Experimental Parameters for ddPCR Assay
When transferring an assay to ddPCR, several parameters require optimization to ensure accurate partitioning and detection [12].
- Threshold Setting: Fluorescence intensity thresholds must be properly set to distinguish positive and negative droplets clearly, with minimal "rain" (droplets with intermediate fluorescence).
- Partition Count: A minimum of 10,000 generated droplets per sample is considered a benchmark for reliable quantification.
- Template Volume: Standard reactions typically use between 1-10 ng of isolated fecal DNA, but this may require optimization based on target abundance.
- Master Mix Selection: Choose between EvaGreen (for dye-based assays) or probe-based supermixes (e.g., ddPCR Supermix for Probes) depending on the assay design.
The Scientist's Toolkit: Essential Research Reagents
Successful detection in fecal samples relies on a suite of specialized reagents and instruments.
Table 3: Key Reagent Solutions for Fecal PCR Analysis
| Item | Function / Application | Example Products / Notes |
|---|---|---|
| Nucleic Acid Isolation Kit | Purifies DNA from complex, inhibitor-rich fecal samples. | MagMAX Total Nucleic Acid Isolation Kit; should include a bead-beating step for mechanical lysis. |
| Digital PCR System | Partitions and amplifies reactions for absolute quantification. | Bio-Rad QX200 Droplet Reader/Automated Droplet Generator; QIAGEN QIAcuity One. |
| qPCR Thermal Cycler | Amplifies DNA with real-time fluorescence monitoring. | Applied Biosystems 7500FAST Real-Time PCR Systems. |
| PCR Master Mix | Contains enzymes, dNTPs, and buffer for amplification. | TaqMan Environmental Master Mix 2.0 for inhibitor-resistant qPCR; ddPCR Supermix for Probes. |
| Fluorometer | Precisely quantifies DNA concentration prior to PCR. | Qubit Fluorometer with HS kit; provides more accurate quantification for DNA than spectrophotometers. |
| Primers & Probes | Species- or strain-specific detection of target DNA. | Designed for target (e.g., probiotic strain, pathogen gene); synthesized by companies like Integrated DNA Technologies (IDT). |
The data compellingly demonstrates that ddPCR holds a significant advantage in sensitivity, offering lower Limits of Detection and Quantification compared to qPCR. This makes it particularly suited for applications in fecal research where target abundance is low, such as detecting specific probiotic strains post-intervention [12] or quantifying mitochondrial DNA in samples with low cellular mitochondrial content [61]. Furthermore, the inherent resistance of ddPCR to PCR inhibitors commonly found in fecal samples ensures more accurate and reliable quantification [10].
However, qPCR remains a powerful and widely adopted technology. When used with an inhibitor-resistant master mix, it performs robustly and shows good agreement with ddPCR for many targets [10]. Its strengths lie in its established protocols, high throughput, and lower per-reaction cost for many standard applications where extreme sensitivity is not the primary requirement.
The choice between qPCR and ddPCR ultimately depends on the specific research question. For absolute quantification of low-abundance targets in difficult matrices like feces, ddPCR is the superior tool. For routine quantification where relative values are sufficient and targets are reasonably abundant, qPCR continues to be an excellent and cost-effective choice. As the field moves forward, this "sensitivity showdown" equips researchers with the evidence needed to make an informed decision, optimizing their experimental outcomes in the complex world of fecal sample analysis.
The absolute quantification of microbial targets in complex matrices like fecal samples is a cornerstone of gut microbiome research, probiotic studies, and clinical diagnostics. For years, quantitative polymerase chain reaction (qPCR) has been the established method for this application. However, the emergence of droplet digital PCR (ddPCR) has introduced a powerful alternative that promises enhanced sensitivity and precision without the need for standard curves. This guide provides an objective comparison of these two technologies, evaluating their performance in quantifying bacterial targets in both spiked and clinical fecal samples. The analysis is framed within the critical parameters of accuracy, precision, and data reproducibility—essential considerations for researchers, scientists, and drug development professionals designing experiments in this field.
Technical Comparison: qPCR vs. ddPCR
Fundamental Principles and Workflows
Quantitative PCR (qPCR) operates by monitoring the amplification of DNA in real-time using fluorescent probes or dyes. The cycle threshold (Cq) at which the fluorescence crosses a predetermined threshold is used for quantification relative to a standard curve [23]. This requirement for a standard curve introduces a potential source of variability and error.
Droplet Digital PCR (ddPCR) takes a different approach by partitioning a PCR reaction into thousands of nanoliter-sized droplets. After end-point amplification, the droplets are analyzed for fluorescence, and the fraction of positive droplets is used to calculate the absolute target concentration through Poisson statistics, eliminating the need for a standard curve [12] [63].
Performance Comparison in Fecal Samples
The table below summarizes key performance characteristics of both technologies based on direct comparative studies using fecal samples:
Table 1: Performance comparison of qPCR and ddPCR for bacterial quantification in fecal samples
| Parameter | qPCR | ddPCR | Experimental Evidence |
|---|---|---|---|
| Limit of Detection (LOD) | ~103-104 cells/g feces [27] | 10-100 fold lower than qPCR [12] [42] | Spiked fecal samples with Limosilactobacillus reuteri [27] |
| Quantification Basis | Relative (requires standard curve) | Absolute (no standard curve) [63] [4] | Clinical trial fecal samples for probiotic detection [12] |
| Precision & Reproducibility | Good for moderate-to-high abundance targets [49] | Higher precision; tighter error bars [49] | Gene expression analysis; STEC quantification in bovine feces [49] [4] |
| Dynamic Range | Broad dynamic range [49] | Saturation at high concentrations (~2×10⁵ copies/μL) [4] | Standard curves with serial dilutions [4] |
| Susceptibility to PCR Inhibition | Potentially affected by inhibitors [27] [23] | Reduced susceptibility due to end-point analysis [12] [4] | Fecal samples spiked with bile salts [4] |
| Multiplexing Capability | Limited to 4-6 targets; requires validation [49] [64] | Simplified multiplexing without efficiency optimization [49] | Sepsis-related bacterial detection panels [64] |
Experimental Data from Key Studies
Probiotic Detection in Human Clinical Trial Samples
A direct comparison study investigated the detection of multi-strain probiotics (Lactobacillus acidophilus NCFM, Lacticaseibacillus paracasei Lpc-37, and Bifidobacterium animalis subsp. lactis Bl-04) in fecal samples from a human clinical trial. The researchers found both methods to be "quite congruent," but ddPCR demonstrated a 10-100 fold lower limit of detection. Interestingly, most of the sensitivity and specificity in discriminating treated from untreated groups came from a single assay (Bl-04), highlighting the importance of rigorous assay validation regardless of the platform chosen [12] [42].
Table 2: Summary of probiotic strain detection in human clinical trial fecal samples [12] [42]
| Probiotic Strain | qPCR Performance | ddPCR Performance | Contribution to Group Discrimination |
|---|---|---|---|
| Bifidobacterium animalis subsp. lactis Bl-04 | High sensitivity and specificity | High sensitivity and specificity | Primary contributor to sensitivity and specificity |
| Lactobacillus acidophilus NCFM | Good performance in optimization | Good performance in optimization | Limited contribution despite good assay performance |
| Lacticaseibacillus paracasei Lpc-37 | Good performance in optimization | Good performance in optimization | Limited contribution despite good assay performance |
Absolute Quantification ofLimosilactobacillus reuteriin Spiked Fecal Samples
A systematic comparison using spiked fecal samples evaluated both technologies for absolute quantification of Limosilactobacillus reuteri strains. The study found that ddPCR showed "slightly better reproducibility," but qPCR was "almost as reproducible" and showed comparable sensitivity (LOD around 104 cells/g feces) and linearity (R² > 0.98) when kit-based DNA isolation methods were used. The authors concluded that qPCR has advantages for this application due to its wider dynamic range, lower cost, and faster turnaround time [27].
STEC Quantification in Bovine Feces
A study comparing both methods for quantifying Shiga toxin-producing Escherichia coli (STEC) in bovine feces found a "very good agreement" between qPCR using a specific master mix (Environmental Master Mix 2.0) and ddPCR. Both methods exhibited similar sensitivities and no significant PCR inhibition when analyzing natural contaminated cattle fecal samples. The research highlighted that ddPCR shows potential for accurate absolute quantification of STEC without relying on standardized reference material [4].
Detailed Experimental Protocols
DNA Extraction from Fecal Samples
Protocol from Probiotic Clinical Trial [12] [42]:
- Sample Preparation: Weigh 200 mg of fecal sample (stored at -80°C).
- Lysis: Add lysis/binding buffer and homogenize using bead beating (Precellys VK01 bead tubes, 2 cycles of 3 pulses for 30 s at 6800 RPM).
- Nucleic Acid Isolation: Use AM1840 MagMax Total Nucleic Acid Isolation kit on MagMax Express 96 Magnetic Particle Processor.
- DNA Quantification: Measure DNA concentration using Qubit HS kit on Qubit 3.0 Fluorimeter.
Alternative Kit-Based Protocol [27]:
- The QIAamp Fast DNA Stool Mini Kit-based method has been successfully used for optimal qPCR and ddPCR performance with fecal samples.
PCR Assay Setup and Conditions
qPCR Protocol for Probiotic Detection [12] [42]:
- Platform: 7500FAST Real-Time PCR Systems
- Master Mix: SYBR Fast or Taqman Fast Advanced mastermixes
- DNA Input: 10 ng of isolated fecal DNA per reaction
- Assay Format: Individual assays (not multiplexed)
- Data Analysis: Standard curve method for quantification
ddPCR Protocol for Probiotic Detection [12] [42]:
- Platform: Bio-Rad QX200 instruments
- Master Mix: ddPCR Supermixes (EvaGreen or for Probes)
- DNA Input: 10 ng of isolated fecal DNA per reaction
- Partitioning: Automated Droplet Generator
- Reading: QX200 Droplet Reader (minimum of 105 droplets per sample)
- Data Analysis: Absolute quantification via Poisson statistics
The Scientist's Toolkit: Essential Research Reagents
Table 3: Key research reagent solutions for qPCR and ddPCR in fecal sample analysis
| Reagent/Kit | Function | Application Notes |
|---|---|---|
| MagMax Total Nucleic Acid Isolation Kit [12] | DNA extraction from complex matrices | Optimal for both qPCR and ddPCR when combined with bead beating |
| QIAamp Fast DNA Stool Mini Kit [27] | Fecal DNA isolation | Kit-based method showing good performance in comparative studies |
| TaqMan Environmental Master Mix 2.0 [4] | qPCR master mix | Superior for fecal samples; reduces inhibition compared to universal mixes |
| TaqMan Universal PCR Master Mix [4] | qPCR master mix | More prone to PCR inhibition from fecal components |
| ddPCR Supermix for Probes [12] | ddPCR reaction mixture | Optimized for probe-based assays in partition systems |
| QX200 Droplet Generator Oil [12] | Creates emulsion for ddPCR | Essential for consistent droplet formation in ddPCR workflows |
Quantitative Microbiome Profiling: Conceptual Framework
The choice between qPCR and ddPCR takes on additional significance in the context of Quantitative Microbiome Profiling (QMP), which aims to overcome the limitations of compositional data generated by next-generation sequencing. Both technologies can be used to determine total bacterial load for normalization, but they may yield different results due to their fundamental principles.
A comparative study found that although qPCR and flow cytometry showed strong correlation when quantifying a mock bacterial community, they produced "highly divergent quantitative microbial profiles" when analyzing human fecal samples. This highlights that the choice of quantification method can introduce substantial technical variability in QMP approaches [65].
The comparative analysis of qPCR and ddPCR for fecal sample analysis reveals that both technologies have distinct advantages and optimal applications:
Choose ddPCR when: Maximum sensitivity is required for low-abundance targets, absolute quantification without standard curves is essential, or samples may contain PCR inhibitors. The technique is particularly valuable for detecting subtle changes in bacterial abundance or when working with limited sample material [12] [49].
Choose qPCR when: Working with moderate to high-abundance targets, prioritizing throughput and cost-effectiveness, or requiring a broad dynamic range. When properly optimized with appropriate master mixes and validated assays, qPCR can deliver highly reliable and reproducible results comparable to ddPCR for many applications [27] [23].
Both technologies benefit from rigorous assay validation and appropriate DNA extraction methods. For novel assays or those with unknown performance in fecal matrices, employing a strategy that combines multiple assays in a layered approach can help mitigate potential underperformance of any single assay, regardless of the platform chosen [12].
When selecting a PCR method for absolute quantification in complex samples like feces, understanding the dynamic range and linearity of quantitative PCR (qPCR) and droplet digital PCR (ddPCR) is crucial for generating accurate, reproducible data. This guide provides an objective comparison based on recent experimental studies to help you choose the optimal method for your research.
Key Performance Metrics at a Glance
The table below summarizes how qPCR and ddPCR perform across critical parameters for quantification in fecal and other complex samples.
| Performance Parameter | qPCR | Droplet Digital PCR (ddPCR) |
|---|---|---|
| Quantification Method | Relative (relies on a standard curve) [23] [49] | Absolute (based on Poisson statistics; no standard curve) [4] [66] [23] |
| Dynamic Range | Broad dynamic range; effective for moderate-to-high abundance targets [27] [49] | Broad, but can saturate at high concentrations (>10⁶ copies/µL), leading to underestimation [4] [43] |
| Linearity | Excellent linearity (R² > 0.98-0.99) consistently reported [27] [4] [43] | Excellent linearity (R² > 0.99) [4] [67] [43] |
| Limit of Detection (LOD) | Higher LOD, typically >10³ cells/gram feces [27] | Superior sensitivity; 10- to 100-fold lower LOD than qPCR [67] [12] [43] |
| Precision / Reproducibility | Good reproducibility [27] | Higher precision; significantly lower intra-assay variability [56] [67] |
| Susceptibility to PCR Inhibitors | Susceptible to inhibitors in complex samples, which can affect amplification efficiency [27] [23] | More resilient to inhibitors due to end-point detection and partitioning [4] [66] [67] |
Experimental Evidence: A Tale of Two Ranges
Performance across concentration ranges is not uniform. Experimental data reveals a key trade-off: ddPCR excels at low concentrations, while qPCR is robust at very high ones.
- At Low Concentrations: ddPCR's partitioning technology provides a clear advantage. A 2025 study on periodontal pathobionts found ddPCR had "superior sensitivity, detecting lower bacterial loads," which resulted in qPCR producing false negatives at low concentrations (< 3 log₁₀ Geq/mL) [67]. Similarly, a 2022 study on Lactiplantibacillus plantarum showed ddPCR had a 10-fold lower limit of detection than qPCR in spiked food samples [43].
- At High Concentrations: qPCR can maintain an advantage. The same 2022 study noted that "ddPCR has limitations in the absolute quantitation of high bacterial concentrations (>10⁶ CFU/mL)" [43]. Another study observed that ddPCR reaction saturation was reached at 2 × 10⁵ target copies/µL, making quantification impossible at that high level [4].
Essential Workflows for Absolute Quantification in Fecal Samples
The following diagrams illustrate the core workflows for both technologies, highlighting the fundamental difference that drives their performance characteristics.
Detailed Experimental Protocol: A Representative Study
The following protocol is adapted from a 2024 study that systematically compared qPCR and ddPCR for the absolute quantification of Limosilactobacillus reuteri strains in human fecal samples [27].
1. Sample Preparation and Spiking:
- Bacterial Culture: Grow target strain (e.g., L. reuteri) in broth medium. Harvest bacterial cells during the late exponential or early stationary phase and determine cell numbers by quantitative plating on agar plates [27].
- Fecal Spiking: Serially dilute the harvested culture in ice-cold PBS. Spike known quantities of the bacteria into confirmed L. reuteri-negative human fecal aliquots to create a calibration series (e.g., from 10³ to 10⁷ cells/gram feces) [27].
2. DNA Extraction (Kit-Based Recommended):
- The 2024 study found kit-based methods provided the best balance of performance for subsequent PCR analysis [27].
- Procedure: Use a commercial kit like the QIAamp Fast DNA Stool Mini Kit. Weigh 200 mg of spiked fecal sample, followed by mechanical lysis via bead beating. Purify DNA according to the manufacturer's instructions. Quantify and assess the purity of the extracted DNA using a spectrophotometer [27] [12].
3. PCR Setup and Execution:
- qPCR Protocol: The 20 µL reaction mixture should contain 1x TaqMan Environmental Master Mix, 0.4 µM of each strain-specific forward and reverse primer, 0.2 µM of strain-specific hydrolysis probe, and 10 ng of template DNA [27] [67].
- Thermocycling: Initial denaturation at 95°C for 10 min, followed by 45 cycles of 15 sec at 95°C and 1 min at 60°C. Each run must include a standard curve made from genomic DNA with a known concentration [27].
- ddPCR Protocol: The 20 µL reaction mixture is like qPCR but uses a ddPCR supermix. The mixture is loaded into a droplet generator that partitions it into ~20,000 nanoliter-sized droplets [12] [43].
- Thermocycling: Use the same cycle protocol as qPCR but run to end-point amplification. Subsequently, droplets are read in a droplet reader to count the positive and negative partitions for absolute quantification without a standard curve [67] [43].
4. Data Analysis:
- qPCR Analysis: Plot the log of the known starting quantities against the Cq values for the standard curve. Ensure the assay demonstrates high linearity (R² > 0.98) and efficiency (90-110%). Interpolate the concentration of unknown samples from this curve [27] [23].
- ddPCR Analysis: Use the instrument's software to apply a fluorescence amplitude threshold and distinguish positive from negative droplets. The software automatically calculates the absolute concentration (copies/µL) in the original sample using Poisson distribution models [67] [43].
The Scientist's Toolkit: Key Reagent Solutions
| Research Reagent | Function in the Protocol |
|---|---|
| Strain-Specific Primers & Probes | Enables specific detection and quantification of the target bacterial strain amidst a complex background flora [27] [12]. |
| Kit-Based DNA Extraction Kit (e.g., QIAamp Fast DNA Stool Mini Kit) | Provides a standardized, reliable method for isolating high-quality, inhibitor-free DNA from tough matrices like feces [27] [67]. |
| TaqMan Environmental Master Mix 2.0 | A qPCR master mix formulated to be more resilient to PCR inhibitors commonly found in environmental and fecal samples [4]. |
| ddPCR Supermix | A specialized reaction mix optimized for droplet stability and efficient amplification within the partitioned droplets during ddPCR [12] [43]. |
| Restriction Enzymes (e.g., HaeIII, EcoRI) | Used to digest longer genomic DNA fragments, improving the accessibility of target genes and the accuracy of copy number quantification, especially in ddPCR [56]. |
For core laboratories supporting research on complex microbial communities, such as the gut microbiome, the choice of a nucleic acid quantification technique is a critical strategic decision. Quantitative PCR (qPCR) has long been the workhorse for gene expression analysis and pathogen detection, valued for its speed, well-established protocols, and broad dynamic range [6] [49]. However, the emergence of Droplet Digital PCR (ddPCR) offers an alternative paradigm, providing absolute quantification without standard curves and demonstrating superior precision for detecting subtle changes [6] [49]. This guide objectively compares the performance of qPCR and ddPCR, with a specific focus on their application in the absolute quantification of bacterial strains in fecal samples—a context defined by complex matrices and potential PCR inhibitors. The evaluation is framed around the core lab's paramount considerations: throughput, operational cost, and ease of use.
Technical Comparison: qPCR vs. ddPCR
At their core, qPCR and ddPCR differ fundamentally in how they perform and quantify the polymerase chain reaction.
qPCR is a relative quantification method. It measures the amplification of DNA in real-time as the reaction progresses through its exponential phases. The cycle at which the fluorescence crosses a certain threshold (Cq) is used to determine the initial template quantity, but this requires comparison to a standard curve of known concentrations [6] [49]. This process is efficient and flexible but can be influenced by the amplification efficiency of the reaction and the accuracy of the standard curve.
ddPCR, in contrast, is an absolute quantification method. It works by partitioning a single PCR reaction into thousands to millions of nanoliter-sized droplets. After end-point PCR amplification, each droplet is analyzed individually to be scored as positive or negative for the target. The absolute concentration of the target molecule, in copies per microliter, is then calculated directly using Poisson statistics, without the need for a standard curve [6] [49] [62]. This partitioning also makes the technology more tolerant to PCR inhibitors present in samples like feces [6] [4].
Table 1: Fundamental Characteristics of qPCR and ddPCR
| Characteristic | Quantitative PCR (qPCR) | Droplet Digital PCR (ddPCR) |
|---|---|---|
| Quantification Method | Relative (requires standard curve) | Absolute (no standard curve) [49] |
| Principle | Real-time measurement during exponential phase | End-point measurement of partitioned reactions [6] |
| Data Output | Cq value, relative quantity | Copies/μL, absolute quantity [49] |
| Tolerance to Inhibitors | Moderate to low; impacted by PCR efficiency | High; less affected by changes in efficiency [6] [4] |
| Impact of PCR Efficiency | High impact on quantification accuracy | Low impact on quantification accuracy [6] |
The following workflow diagram illustrates the key procedural differences between the two techniques, from sample setup to data analysis.
Performance Data in Fecal Sample Analysis
The theoretical advantages of ddPCR are put to the test in the challenging environment of fecal samples, which contain complex organic matter and PCR inhibitors. A systematic 2024 study comparing qPCR and ddPCR for the absolute quantification of Limosilactobacillus reuteri strains in human fecal samples provides critical, data-driven insights [2] [1].
Table 2: Experimental Performance Comparison in Fecal Samples
| Performance Metric | qPCR Findings | ddPCR Findings | Experimental Context |
|---|---|---|---|
| Reproducibility | Almost as reproducible as ddPCR [2] [1] | Slightly better reproducibility [2] [1] | Strain-specific quantification of L. reuteri [2] |
| Sensitivity (LOD) | ~10⁴ cells/g feces [2] [1] | ~10⁴ cells/g feces [2] [1] | Kit-based DNA isolation methods [2] |
| Linearity (R²) | > 0.98 [2] [1] | > 0.98 [2] [1] | Spiked fecal samples [2] |
| Dynamic Range | Wider dynamic range [2] [1] | Saturated at high concentrations [4] | Quantification across serial dilutions [2] [4] |
| Inhibitor Tolerance | Susceptible to inhibition; may require optimized master mixes [4] | High tolerance; robust performance in complex matrices [6] [4] | Testing with bile salts and fecal contaminants [4] |
| Accuracy | Dependent on standard curve accuracy [2] | Absolute quantification; consistently lower template counts in some studies [4] [68] | Comparison against known spike-ins [2] [4] |
This data reveals a nuanced picture. While ddPCR demonstrated marginally better reproducibility and inherent robustness, qPCR showed comparable sensitivity and linearity when using kit-based DNA isolation methods. Furthermore, qPCR offered a wider dynamic range, which can be advantageous for samples with highly variable target concentrations [2]. A separate study on Shiga toxin-producing E. coli in bovine feces confirmed that a well-optimized qPCR assay could perform on par with ddPCR, showing excellent agreement and similar limits of quantification [4].
Throughput, Cost, and Operational Considerations for the Core Lab
Beyond pure performance metrics, the practicalities of throughput, cost, and workflow integration are decisive for a core laboratory.
Throughput and Speed: qPCR generally holds a significant advantage in raw throughput and speed. Instruments are commonly available in 96- or 384-well formats, enabling the rapid processing of many samples. Thermocycling protocols are fast, making qPCR ideal for experiments requiring timely results [49]. While ddPCR technology is evolving—with newer nanoplate-based systems like the QIAcuity offering a "qPCR-like" plate setup and a fully automated workflow from sample to result in under two hours—the fundamental process of droplet generation and reading can still be a bottleneck compared to qPCR for very high-volume runs [6].
Cost Analysis: Cost is a major differentiator. A 2014 cost analysis, which remains relevant in principle, found that the overall cost (consumables and labor) for ddPCR was two times higher than for qPCR [68]. This is driven by the specialized consumables required for droplet generation or microfluidic chips. While reagent bundles are becoming more cost-effective, the per-test expense for ddPCR typically remains 2-3 times higher than for high-throughput qPCR [69]. For a core lab, this translates into a significant budgetary consideration.
Ease of Use and Expertise: qPCR benefits from decades of establishment. Protocols are standardized, analysis pipelines are mature, and most researchers are already familiar with the technology [49]. Transitioning to ddPCR requires training on new instrumentation and data analysis software. Although the advent of automated systems has simplified the ddPCR workflow, the initial learning curve and the need for specialized interpretation expertise remain factors to consider [69].
Table 3: Practical Considerations for the Core Lab
| Consideration | qPCR | ddPCR |
|---|---|---|
| Absolute Throughput | High (96-/384-well formats) | Lower (platform dependent) [69] |
| Assay Speed | Faster run times [49] | Slower (includes partitioning/reading) [6] |
| Cost per Sample | Lower [2] [68] | Higher (2-3x the cost of qPCR) [69] [68] |
| Expertise & Training | Well-established; familiar to most users [49] | Newer technology; requires specific training [69] |
| Workflow Integration | Straightforward, standard protocols | Evolving towards automation (e.g., nanoplate systems) [6] |
| Multiplexing Ease | Requires validation for matched efficiency | Simplified; less dependent on optimization [49] |
The Scientist's Toolkit: Essential Reagents and Materials
The successful implementation of either technology, particularly for challenging samples like feces, relies on a set of key research reagents and materials.
Table 4: Key Research Reagent Solutions for PCR-based Quantification
| Reagent / Material | Function | Considerations for Fecal Samples |
|---|---|---|
| Kit-Based DNA Isolation Kits (e.g., QIAamp Fast DNA Stool Mini Kit) | Extracts high-purity, PCR-ready DNA from complex fecal matrix. | Critical for achieving high sensitivity and linearity (R² > 0.98); reduces inhibitor carryover [2]. |
| Strain-Specific Primers/Probes | Enables precise targeting of the bacterial strain of interest. | Must be designed from unique genomic markers for accurate strain-level quantification [2] [62]. |
| Inhibitor-Resistant Master Mixes (e.g., TaqMan Environmental Master Mix) | Enhances PCR robustness against inhibitors common in feces. | Greatly improves qPCR reliability and correlation with ddPCR data [4]. |
| Digital PCR Supermixes | Formulated for stable droplet formation and efficient endpoint amplification. | Essential for consistent partitioning and low-variability results in ddPCR [49]. |
| Nuclease-Free Water | Serves as a diluent for samples and standards. | Ensures reaction integrity by preventing nucleic acid degradation. |
| Quantified Standard Curves (for qPCR) | Enables relative quantification by providing a known concentration reference. | Accuracy is paramount; ddPCR can be used to precisely quantify standard dilutions [68]. |
Choosing between qPCR and ddPCR is not about finding a universal winner, but about selecting the right tool for the specific research question and operational context.
Choose qPCR when: Your priority is high-throughput, cost-effective screening of moderate- to high-abundance targets. It is the preferred tool for routine gene expression analysis, pathogen detection where targets are expected to be present at good levels, and in labs where budget and speed are primary drivers [2] [49]. Its wider dynamic range is also beneficial for samples with vast concentration differences.
Choose ddPCR when: Your research demands absolute quantification and high precision for low-abundance targets or subtle changes. It is ideally suited for detecting rare mutations, quantifying minimal residual disease, precisely measuring viral loads, and analyzing samples where PCR inhibitors are a major concern and cannot be fully eliminated [6] [49] [69]. Its ability to detect mutation rates as low as 0.1% makes it indispensable for certain applications [6].
For the core laboratory, a synergistic approach may be the most powerful strategy. A 2024 study concluded that qPCR has advantages for the absolute quantification of bacterial strains in fecal samples when considering the balance of speed, cost, and performance [2]. One can leverage ddPCR's precision to quantify and validate the standard curves used for large-scale, cost-effective qPCR analyses, thereby combining the strengths of both technologies [68].
In conclusion, the practical balance for the core lab hinges on a clear-eyed assessment of application needs against operational constraints. qPCR remains the versatile, high-throughput, and economical workhorse for a wide array of applications. ddPCR serves as a premium instrument for high-stakes, low-abundance quantification where its precision, accuracy, and robustness justify the additional cost and time. By understanding their distinct profiles, core labs can strategically deploy these technologies to best serve the evolving needs of their research communities.
Conclusion
The choice between qPCR and ddPCR for absolute quantification in fecal samples is not a matter of one being universally superior, but rather dependent on the specific research or diagnostic question. Recent evidence confirms that well-optimized qPCR assays offer a wider dynamic range, lower cost, and faster turnaround, making them the best fit for high-throughput applications where the target is not extremely rare. Conversely, ddPCR excels in scenarios requiring the utmost sensitivity and precision for low-abundance targets, demonstrates greater resilience to PCR inhibitors common in feces, and provides a calibration-free workflow ideal for absolute quantification. The future of fecal microbiome analysis will likely see a complementary use of both technologies, with ddPCR serving as a powerful tool for validating and optimizing qPCR assays, especially for establishing critical cut-off values. For researchers and drug developers, this synthesis empowers informed, application-driven method selection to advance the accuracy and impact of their work in gut microbiology.
References
- 1. Highly accurate and sensitive absolute quantification of ... [https://pubmed.ncbi.nlm.nih.gov/39244633/]
- 2. Highly accurate and sensitive absolute quantification of ... [https://microbiomejournal.biomedcentral.com/articles/10.1186/s40168-024-01881-2]
- 3. Accurate prediction of absolute prokaryotic abundance ... [https://pmc.ncbi.nlm.nih.gov/articles/PMC12146642/]
- 4. Comparison of Droplet Digital PCR and qPCR for the ... [https://www.mdpi.com/2072-6651/8/5/157]
- 5. Comparison of next-generation droplet digital PCR ... [https://www.sciencedirect.com/science/article/abs/pii/S0020751914002264]
- 6. dPCR vs qPCR [https://www.qiagen.com/us/applications/digital-pcr/beginners/dpcr-vs-qpcr]
- 7. Droplet Digital PCR versus qPCR for gene expression ... [https://www.nature.com/articles/s41598-017-02217-x]
- 8. Comparison of standard, quantitative and digital PCR in ... [https://www.nature.com/articles/srep34554]
- 9. A Pipeline for Faecal Host DNA Analysis by Absolute ... [https://www.nature.com/articles/s41598-019-41753-6]
- 10. Comparison of Droplet Digital PCR and qPCR for the ... [https://pmc.ncbi.nlm.nih.gov/articles/PMC4885071/]
- 11. Lessons Learned from Early Implementation and Scale-up ... [https://wwwnc.cdc.gov/eid/article/31/3/24-1580_article]
- 12. Comparison of qRT-PCR and ddPCR for multi-strain ... [https://www.frontiersin.org/journals/microbiology/articles/10.3389/fmicb.2025.1579797/full]
- 13. Variably improved microbial source tracking with digital ... [https://www.sciencedirect.com/science/article/abs/pii/S0043135419303732]
- 14. Molecular diagnostics of Salmonella and Campylobacter in ... [https://pmc.ncbi.nlm.nih.gov/articles/PMC8712530/]
- 15. Development and application of a highly sensitive ... [https://www.frontiersin.org/journals/microbiology/articles/10.3389/fmicb.2025.1612740/full]
- 16. A duplex droplet digital PCR assay for Salmonella and ... [https://www.sciencedirect.com/science/article/pii/S1201971222002429]
- 17. Four therapeutic frontiers opened up by strain-level ... [https://www.ddw-online.com/four-therapeutic-frontiers-opened-up-by-strain-level-microbiome-sequencing-37596-202510/]
- 18. A quantitative sequencing framework for absolute ... [https://www.nature.com/articles/s41467-020-16224-6]
- 19. Current Applications of Absolute Bacterial Quantification in ... [https://pmc.ncbi.nlm.nih.gov/articles/PMC8467167/]
- 20. High-resolution strain-level microbiome composition analysis ... [https://microbiomejournal.biomedcentral.com/articles/10.1186/s40168-023-01615-w]
- 21. Strain level microbial detection and quantification with ... [https://www.nature.com/articles/s41467-022-33869-7]
- 22. A data-driven approach for predicting the impact of drugs ... [https://www.nature.com/articles/s41467-023-39264-0]
- 23. Quantitative or digital PCR? A comparative analysis for ... [https://www.sciencedirect.com/science/article/abs/pii/S0165993624001584]
- 24. ddpcr: an R package and web application for analysis ... [https://pmc.ncbi.nlm.nih.gov/articles/PMC5031129/]
- 25. dPCR for Beginners [https://www.qiagen.com/us/applications/digital-pcr/beginners]
- 26. Development and validation of a droplet digital PCR ... [https://pmc.ncbi.nlm.nih.gov/articles/PMC11532291/]
- 27. Highly accurate and sensitive absolute quantification of bacterial strains in human fecal samples - PMC [https://pmc.ncbi.nlm.nih.gov/articles/PMC11380787/]
- 28. Design of Bacterial Strain-Specific qPCR Assays Using NGS Data and Publicly Available Resources and Its Application to Track Biocontrol Strains - PMC [https://www.ncbi.nlm.nih.gov/pmc/articles/PMC7077341/]
- 29. Rules and Tips for PCR & qPCR Primer Design | IDT [https://www.idtdna.com/page/support-and-education/decoded-plus/how-to-design-primers-and-probes-for-pcr-and-qpcr/]
- 30. PCR/qPCR/dPCR Assay Design [https://www.sigmaaldrich.com/US/en/technical-documents/protocol/genomics/pcr/pcr-qpcr-dpcr-assay-design]
- 31. Comparative Study of DNA Extraction Methods for the PCR ... [https://pmc.ncbi.nlm.nih.gov/articles/PMC9689707/]
- 32. Choice of DNA extraction method affects stool microbiome ... [https://www.nature.com/articles/s41598-024-54353-w]
- 33. The Impact of DNA Extraction Methods on Stool Bacterial ... [https://www.frontiersin.org/journals/microbiology/articles/10.3389/fmicb.2019.00821/full]
- 34. Comparison of Quantitative Real-time PCR... - ERA [https://era.library.ualberta.ca/items/753f3276-afee-45ae-b4d9-1e0c190dfa6f]
- 35. E.Z.N.A.® Stool DNA Kit [https://omegabiotek.com/product/e-z-n-a-stool-dna-kit/]
- 36. Fecal DNA Kit | Genomic | DNA Extraction [https://www.ibisci.com/products/ibi-fecal-dna-kit]
- 37. All About Probe-Based Real-Time qPCR Assays [https://www.goldbio.com/blogs/articles/all-about-probe-based-qpcr?srsltid=AfmBOoqwDbr5i81RUWCDMen-xQBmFHqkW6pZkQHnJ26bS25oKGkanYDB]
- 38. TaqMan - an overview [https://www.sciencedirect.com/topics/biochemistry-genetics-and-molecular-biology/taqman]
- 39. Droplet digital PCR vs. quantitative real time ... [https://pmc.ncbi.nlm.nih.gov/articles/PMC10440704/]
- 40. Droplet Digital PCR Assay for Detection and Quantification ... [https://pmc.ncbi.nlm.nih.gov/articles/PMC12467802/]
- 41. TaqMan Probes and qPCR Primers [https://www.thermofisher.com/us/en/home/life-science/oligonucleotides-primers-probes-genes/applied-biosystems-custom-primers-probes.html]
- 42. Comparison of qRT-PCR and ddPCR for multi-strain ... [https://pmc.ncbi.nlm.nih.gov/articles/PMC12066471/]
- 43. Comparison of Real-Time PCR and Droplet Digital PCR for ... [https://pmc.ncbi.nlm.nih.gov/articles/PMC9105557/]
- 44. Dynamic control and quantification of bacterial population ... [https://pmc.ncbi.nlm.nih.gov/articles/PMC4527312/]
- 45. PCR inhibition in qPCR, dPCR and MPS—mechanisms and ... [https://pmc.ncbi.nlm.nih.gov/articles/PMC7072044/]
- 46. Droplet digital PCR quantifies host inflammatory transcripts in ... [https://pmc.ncbi.nlm.nih.gov/articles/PMC4863679/]
- 47. Tolerance of droplet-digital PCR versus real-time ... [https://pmc.ncbi.nlm.nih.gov/articles/PMC4247175/]
- 48. Droplet Digital PCR gene expression analysis with... versus qPCR for [https://www.nature.com/articles/s41598-017-02217-x?error=cookies_not_supported&code=36b63812-8bad-4e2a-9759-8c79c981b0c0]
- 49. qPCR vs. ddPCR: Which Is Best for You? [https://www.bioradiations.com/qpcr-vs-ddpcr-assays-select-the-best-gene-expression-analysis-method-for-your-application1125/]
- 50. Optimization of TaqMan-based quantitative PCR diagnosis ... [https://pubmed.ncbi.nlm.nih.gov/40472050/]
- 51. Comparative Performance of Digital PCR and Real-Time RT ... [https://pmc.ncbi.nlm.nih.gov/articles/PMC12474457/]
- 52. Sequencing 101: Tandem repeats [https://www.pacb.com/blog/sequencing-101-tandem-repeats/]
- 53. Variable number tandem repeat [https://en.wikipedia.org/wiki/Variable_number_tandem_repeat]
- 54. Advances in the discovery and analyses of human tandem ... [https://pmc.ncbi.nlm.nih.gov/articles/PMC10806765/]
- 55. Restriction Enzymes for Droplet Digital PCR (ddPCR) [https://www.neb.com/en-us/tools-and-resources/usage-guidelines/restriction-enzymes-for-droplet-digital-pcr?srsltid=AfmBOoqLJEcuWHPJPAyJBXddkxd_eU_IQoPDxHGN7Omz7BwNYEtMpyHa]
- 56. Comparing the precision of two digital PCR applications for ... [https://www.nature.com/articles/s41598-025-13143-8]
- 57. Tandem Repeats and Morphological Variation [https://www.nature.com/scitable/topicpage/tandem-repeats-and-morphological-variation-40690/]
- 58. Highly accurate and sensitive absolute quantification of ... [https://naes.unr.edu/publication.aspx?PubID=6778]
- 59. Evaluating the sensitivity of droplet digital PCR for the ... [https://pmc.ncbi.nlm.nih.gov/articles/PMC10903512/]
- 60. Optimization of digital droplet polymerase chain reaction for ... [https://pmc.ncbi.nlm.nih.gov/articles/PMC4827695/]
- 61. Assessing reliability and accuracy of qPCR, dPCR ... [https://pmc.ncbi.nlm.nih.gov/articles/PMC11995889/]
- 62. Droplet digital PCR method for the absolute quantitative ... [https://www.sciencedirect.com/science/article/pii/S0740002023000527]
- 63. Digital PCR: from early developments to its future application ... [https://pmc.ncbi.nlm.nih.gov/articles/PMC12278255/]
- 64. Advancing quantitative PCR with color cycle multiplex ... [https://pmc.ncbi.nlm.nih.gov/articles/PMC11417387/]
- 65. How to Count Our Microbes? The Effect of Different ... [https://www.frontiersin.org/journals/cellular-and-infection-microbiology/articles/10.3389/fcimb.2020.00403/full]
- 66. Droplet digital PCR for simultaneous quantification of ... [https://www.sciencedirect.com/science/article/abs/pii/S0043135414008409]
- 67. Digital PCR outperforms quantitative real-time PCR for the ... [https://pmc.ncbi.nlm.nih.gov/articles/PMC12288185/]
- 68. Comparison of next-generation droplet digital PCR ... [https://pubmed.ncbi.nlm.nih.gov/25229177/]
- 69. Digital PCR Market Size, Forecast Report [https://www.mordorintelligence.com/industry-reports/digital-pcr-market]