qPCR vs. ddPCR for Absolute Bacterial Quantification: A Strategic Guide for Biomedical Researchers
This article provides a comprehensive comparison of quantitative PCR (qPCR) and droplet digital PCR (ddPCR) for the absolute quantification of bacteria in complex samples.
qPCR vs. ddPCR for Absolute Bacterial Quantification: A Strategic Guide for Biomedical Researchers
Abstract
This article provides a comprehensive comparison of quantitative PCR (qPCR) and droplet digital PCR (ddPCR) for the absolute quantification of bacteria in complex samples. Tailored for researchers and drug development professionals, it covers foundational principles, methodological workflows, and optimization strategies. Drawing on recent comparative studies, including applications in microbiome research and clinical trial analysis, the content delivers evidence-based guidance for selecting the optimal technology based on sensitivity, precision, cost, and throughput requirements for accurate bacterial load assessment.
Understanding qPCR and ddPCR: Core Principles for Bacterial Quantification
The advent of quantitative PCR (qPCR) marked a revolutionary shift in molecular biology, transforming polymerase chain reaction from a qualitative tool to a powerful quantitative technique. This evolution has fundamentally accelerated discovery in biomedical research, clinical diagnostics, and microbiology. More recently, the emergence of digital PCR (dPCR) represents another paradigm shift, offering absolute quantification of nucleic acids without requiring standard curves. Within bacterial quantification research—particularly for absolute quantification of specific species or strains in complex matrices like the gut microbiome, environmental samples, or clinical specimens—the choice between qPCR and droplet digital PCR (ddPCR) has significant implications for data accuracy, sensitivity, and translational impact. This guide objectively compares the performance of these technologies, supported by experimental data, to inform researchers in their experimental design.
Technological Fundamentals: From Quantitative to Digital PCR
Quantitative PCR (qPCR)
qPCR, also known as real-time PCR, enables the monitoring of DNA amplification as it occurs through the detection of fluorescent signals. The core principle relies on the Quantification Cycle (Cq), the point at which fluorescence crosses a threshold above background. The Cq value is inversely proportional to the starting quantity of the target nucleic acid. Quantification requires constructing a standard curve from samples with known concentrations, allowing the interpolation of unknown samples [1] [2]. While this approach is robust, it is relative by nature, and its accuracy depends entirely on the quality and accuracy of the standard curve.
Digital PCR (dPCR)
dPCR takes a fundamentally different approach to quantification. The reaction mixture is partitioned into thousands to millions of individual nanoliter-scale reactions. According to Poisson statistics, some partitions will contain zero target molecules, while others will contain one or more. Following end-point PCR amplification, partitions are analyzed as positive or negative for fluorescence [3] [1]. The absolute concentration of the target in the original sample is then calculated directly from the ratio of positive to total partitions, without the need for a standard curve [4] [5]. This core difference underpins the key advantages of dPCR for absolute quantification.
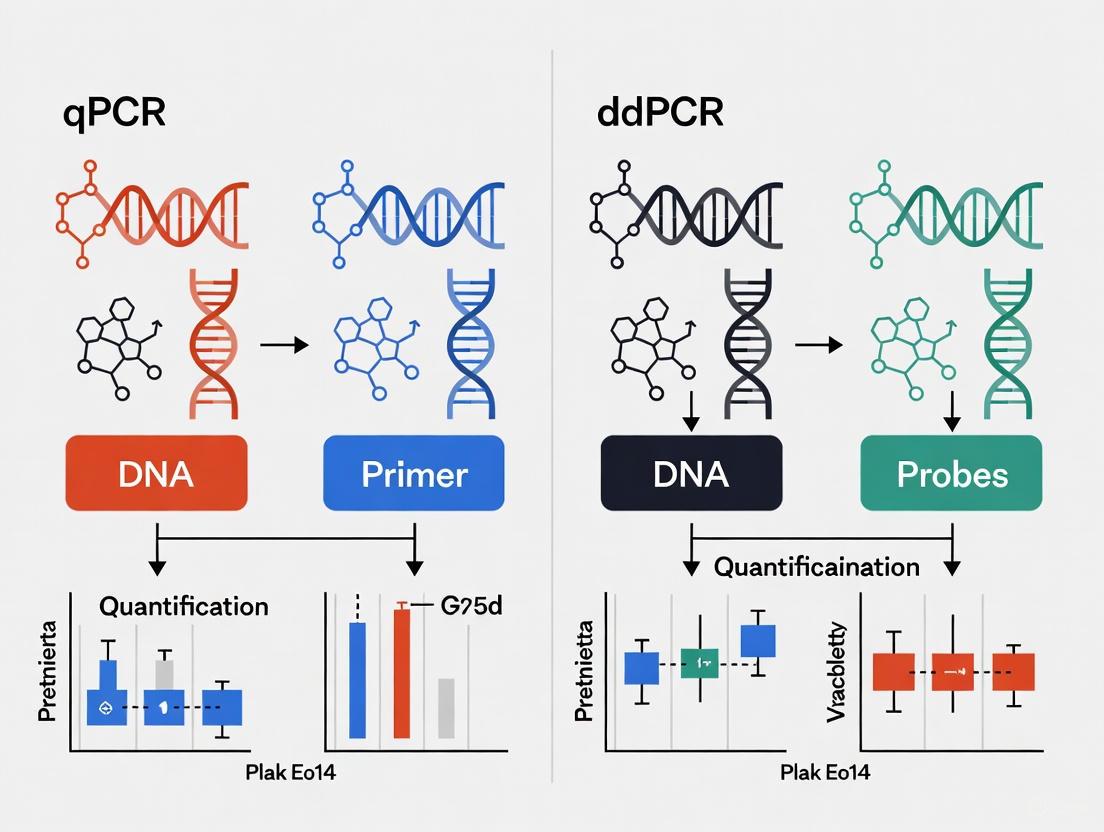
Visualizing the Core Workflows
The diagram below illustrates the fundamental procedural differences between qPCR and ddPCR workflows.
Performance Comparison for Bacterial Quantification
Extensive studies have directly compared qPCR and ddPCR for quantifying bacterial targets across various sample types, from clinical isolates to complex microbiome samples. The data reveal a nuanced picture where each technology excels in different scenarios.
Table 1: Technical and Operational Comparison of qPCR and ddPCR
| Feature | qPCR | ddPCR | Research Context |
|---|---|---|---|
| Quantification Principle | Relative (via Cq & standard curve) | Absolute (via Poisson statistics of partitions) | [6] [1] [5] |
| Precision | Good (++), requires replicates for high precision | Excellent (+++), higher resolution & lower CV | [1] [5] |
| Sensitivity (LOD) | ~103 - 104 cells/g feces | Often 10-100x higher than qPCR; ~103 cells/g feces | [7] [5] [8] |
| Dynamic Range | Wider (≥ 5 logs) | Limited by number of partitions | [1] [5] |
| Tolerance to PCR Inhibitors | Moderate | High; partitioning dilutes inhibitors | [3] [5] |
| Throughput & Speed | High throughput, faster run time | Lower throughput, involves partitioning step | [7] [1] |
| Multiplexing Capability | + | +++ | [1] |
| Cost Consideration | Lower instrument cost, requires standards | Higher instrument cost, no standard curves | [7] [1] |
Table 2: Experimental Performance in Bacterial Detection Studies
| Pathogen / Sample Type | qPCR Performance | ddPCR Performance | Key Finding | Source |
|---|---|---|---|---|
| Limosilactobacillus reuteri(Spiked fecal samples) | LOD: ~10⁴ cells/gGood reproducibility | Slightly better reproducibilityComparable LOD & linearity | qPCR is advantageous due to wider dynamic range, lower cost, and speed. | [7] |
| Xanthomonas citri subsp. citri(Plant pathogen) | Broader dynamic range | Significantly higher sensitivityLower CV, especially at low concentrations | ddPCR more robust for diagnosis; higher resilience to inhibitors. | [5] |
| Listeria monocytogenes,Francisella tularensis, M. avium subsp. paratuberculosis(Water suspensions) | Over-/under-estimated bacterial load vs. dPCR (<0.5 Log10) | Accurate quantification vs. cultural methods | dPCR quantified the same amount of bacteria as cultural methods for L. monocytogenes. | [6] |
| Staphylococcus aureus(Skin-derived DNA, low biomass) | Lower detection efficiency in low-DNA yield samples | High sensitivity and precise quantification in unstable samples | ddPCR is promising for specific microbe detection in challenging samples. | [8] |
| Prokaryotes in Stool(16S rRNA gene quantification) | Reliable quantification | Reliable quantification | Both qPCR and ddPCR are valid for absolute 16S rRNA quantification in stool. | [9] |
Experimental Protocols for Bacterial Quantification
The following methodologies are adapted from key studies that successfully implemented qPCR and ddPCR for absolute bacterial quantification.
This protocol provides a step-by-step guide for designing strain-specific assays and quantifying bacteria in complex fecal samples.
1. Strain-Specific Primer Design:
- Starting Point: Obtain complete genome sequences for the target bacterial strain and closely related strains.
- Identification of Unique Markers: Use comparative genomics software to identify genes unique to the target strain.
- Primer Design: Design primers with a melting temperature (Tm) of ~60°C, length of 18-22 bp, and GC content of 40-60%. Verify specificity in silico using BLAST against genomic databases.
2. Bacterial Culture and Sample Spiking:
- Grow the target strain (e.g., L. reuteri) in appropriate broth to the late exponential phase.
- Harvest cells and resuspend in PBS. Determine cell density by quantitative plating on agar plates.
- Spike known quantities of bacteria (e.g., serial dilutions from 10⁷ to 10³ cells/g) into L. reuteri-negative human fecal samples for standard curve generation.
3. DNA Extraction:
- Use a kit-based DNA isolation method (e.g., QIAamp Fast DNA Stool Mini Kit) for optimal yield and purity from ~0.1 g of spiked fecal sample. Include a washing step with ice-cold PBS to reduce PCR inhibitors.
4. qPCR Setup and Execution:
- Reaction Mix: 2x TaqMan Universal PCR Master Mix, forward and reverse primers (300 nM each), TaqMan probe (150 nM), and template DNA.
- Cycling Conditions: 50°C for 2 min; 95°C for 10 min; 45 cycles of 95°C for 15 sec and 60°C for 1 min.
- Quantification: Include a standard curve of genomic DNA with known concentration (log dilutions) in each run. Convert Cq values to absolute cell counts using the standard curve and genome size.
This protocol outlines the transfer of an established qPCR assay to a ddPCR format for absolute quantification.
1. Assay Transfer:
- Use the same primers and probe from a validated qPCR assay. This ensures specificity and facilitates direct comparison between the two technologies.
2. ddPCR Reaction Assembly:
- Reaction Mix: Combine 10 μL of 2x ddPCR Supermix for Probes (no dUTP), primers and probe at the same concentrations as in qPCR, and 5 μL of template DNA. Adjust with nuclease-free water to a final volume of 20 μL.
3. Droplet Generation:
- Load the 20 μL reaction mix and 70 μL of droplet generation oil into a DG8 cartridge.
- Place the cartridge in the droplet generator. This instrument partitions the sample into ~20,000 nanoliter-sized water-in-oil droplets.
4. PCR Amplification:
- Carefully transfer the emulsion of droplets to a 96-well PCR plate.
- Seal the plate and run on a thermal cycler with the following profile: 95°C for 10 min; 40 cycles of 94°C for 30 sec and 60°C for 1 min (use a slow ramp rate of 2°C/sec); and a final 98°C hold for 10 min for enzyme deactivation.
5. Droplet Reading and Analysis:
- Place the PCR plate in the droplet reader, which aspirates droplets from each well.
- The reader counts the total number of droplets and identifies positive (fluorescent) and negative (non-fluorescent) droplets using a binary threshold.
- The concentration (copies/μL) is calculated automatically by the instrument's software based on Poisson statistics: ( \lambda = -\ln(1 - p) ), where ( p ) is the fraction of positive droplets.
The Scientist's Toolkit: Essential Reagents and Materials
Table 3: Key Research Reagent Solutions for PCR-Based Bacterial Quantification
| Item | Function / Description | Example Application |
|---|---|---|
| Kit-based DNA Isolation Kits | Efficiently extract high-purity DNA while removing PCR inhibitors from complex samples like feces, soil, or tissue. | QIAamp Fast DNA Stool Mini Kit for human fecal samples [7]. |
| TaqMan Universal PCR Master Mix | A ready-to-use mix containing Taq DNA polymerase, dNTPs, and optimized buffer. Essential for robust and reproducible qPCR/ddPCR. | Used in both qPCR and ddPCR protocols for detecting L. reuteri and X. citri [7] [5]. |
| ddPCR Supermix for Probes | A specialized master mix formulated for the generation of stable droplets and efficient amplification in droplet-based dPCR. | Bio-Rad's ddPCR Supermix for Probes (no dUTP) is used in standard ddPCR workflows [5]. |
| Strain-Specific Primers & Probes | Oligonucleotides designed to bind to unique genomic regions of a target bacterial strain, enabling specific detection and quantification. | Primers for L. reuteri 17938 or S. aureus greA gene for specific identification in a mixed microbial background [7] [8]. |
| Nuclease-Free Water | A critical reagent for preparing reaction mixes, ensuring no enzymatic degradation of primers, probes, or template DNA. | Used in all PCR reaction setups to achieve precise volume and avoid contamination. |
| Droplet Generation Oil | An oil formulation used to create the water-in-oil emulsion necessary for partitioning the sample in ddPCR. | Bio-Rad's Droplet Generation Oil for QX200/QX100 systems [3]. |
Application Contexts: Choosing the Right Tool
The choice between qPCR and ddPCR is not one of superiority but of appropriateness for the specific research question and context.
Choose qPCR when:
- Your project involves screening a large number of samples where high throughput and speed are critical [7] [1].
- The target bacterial concentration is expected to be high and within a wide dynamic range.
- The budget is a primary constraint, and instrument cost is a significant factor [1].
- Well-characterized and reliable standard curves are available.
Choose ddPCR when:
- Absolute quantification without standard curves is required for cross-laboratory reproducibility [6] [5].
- Detecting and quantifying low-abundance targets (e.g., rare pathogens or specific strains in a dense microbiome) is the goal [1] [8].
- The sample contains PCR inhibitors that often plague complex matrices like soil, feces, or clinical specimens [3] [5].
- The application requires high precision for detecting small fold-changes, such as in copy number variation or rare mutation detection [1].
The evolution from qPCR to dPCR technology has provided the scientific community with a more diverse and powerful toolkit for absolute bacterial quantification. While qPCR remains the workhorse for high-throughput, relative quantification, ddPCR has carved out a critical niche where absolute precision, sensitivity, and resilience to inhibitors are paramount. The experimental data clearly show that for applications like quantifying specific bacterial strains in complex environments (e.g., the gut microbiome), tracking low-abundance pathogens in clinical samples, or requiring high inter-laboratory reproducibility, ddPCR offers significant advantages. However, for broader dynamic range and higher throughput at a lower cost, qPCR remains highly effective. The decision, therefore, rests on a careful consideration of the specific research objectives, sample type, and operational constraints. As both technologies continue to advance, their complementary strengths will undoubtedly continue to drive innovation in microbial research and diagnostic development.
Quantitative Polymerase Chain Reaction (qPCR) is a cornerstone technique in molecular biology, enabling researchers to quantify specific DNA sequences in real-time during amplification. For many applications in bacterial quantification, researchers employ relative quantification, a method that determines the amount of a target gene relative to a reference sample or control gene. This approach is particularly valuable when studying gene expression changes or microbial population shifts under different experimental conditions. Unlike absolute quantification, which calculates the exact copy number of a target sequence, relative quantification expresses results as fold-changes, making it ideal for comparative studies where the question is "how much more or less of this target exists in my treated sample compared to my control?" The foundation of this method lies in properly constructing and utilizing a standard curve, which serves as the benchmark for determining relative quantities across samples.
The Principle of Relative Quantification
Relative quantification in qPCR measures changes in gene expression or DNA target quantity relative to an appropriate reference point. This reference can be either a calibrator sample (such as an untreated control) or a stable endogenous control gene (often called a housekeeping gene) that maintains constant expression across different experimental conditions. The core principle involves comparing the quantification cycle (Cq) values of your target gene to those of the reference gene to normalize for variations in sample concentration and loading errors.
There are two primary calculation methods for relative quantification. The standard curve method involves creating dilution series of a reference sample to generate a curve that relates Cq values to relative quantities. For all experimental samples, you determine the target quantity from this standard curve and then divide by the target quantity of the calibrator, expressing all quantities as an n-fold difference relative to this calibrator. The comparative Cq method (2^(-ΔΔCq)) uses a mathematical approach to calculate fold-changes without a standard curve, but requires the amplification efficiencies of the target and reference genes to be approximately equal and close to 100%.
A significant advantage of relative quantification is that because the sample quantity is divided by the calibrator quantity, the measurement units cancel out, meaning any stock DNA or RNA containing the appropriate target can be used to prepare standards, provided their relative dilutions are known [10].
The Role of the Standard Curve
The standard curve is fundamental to relative quantification in qPCR, serving as the reference point for determining quantities in unknown samples. This curve is created by performing qPCR on a series of dilutions from a known reference sample, typically spanning several orders of magnitude (e.g., 10-fold serial dilutions). The Cq values obtained from these dilutions are plotted against the logarithm of their relative concentrations to generate a linear standard curve.
Creating and Validating a Standard Curve
To create a standard curve for relative quantification, researchers typically use a five-point serial dilution of a sample of known concentration, such as purified genomic DNA or input DNA from your experimental system. Each dilution is amplified in at least three replicates to ensure statistical reliability. The resulting Cq values are plotted against the logarithmic values of the known relative concentrations (e.g., dilution factors of 1, 0.5, 0.25, 0.125) to generate the standard curve [11].
The efficiency (E) of the qPCR reaction is critically important and is calculated from the standard curve using the formula: Efficiency (E) = 10^(-1/slope) % Efficiency = (E-1) × 100 For a properly optimized reaction, the efficiency should fall between 95% and 105% [11]. Efficiency outside this range may indicate issues with primer design, reaction inhibitors, or suboptimal reaction conditions that require troubleshooting.
The following diagram illustrates the complete workflow for relative quantification using the standard curve method:
Key Experimental Protocols
Standard Curve Establishment Protocol
Reference Sample Preparation: Select an appropriate reference sample containing your target sequence. This could be a pooled sample from your experiment, purified DNA, or a synthetic oligonucleotide. For gene expression studies using RNA, first reverse transcribe to cDNA using a high-efficiency reverse transcription kit [11].
Serial Dilution Series: Create a minimum of five serial dilutions (typically 1:5 or 1:10 dilutions) of your reference sample in the same buffer as your unknown samples. Use low-binding tubes and precise pipetting techniques to ensure accuracy, as dilution errors significantly impact standard curve reliability [10].
qPCR Setup: Run all standard dilutions and unknown samples on the same qPCR plate to eliminate inter-plate variability. Include at least three technical replicates for each standard point and unknown sample. Use a reaction volume appropriate for your system (typically 10-25 µL) containing your master mix, primers, and optionally, probes for specific detection [11].
Data Collection and Analysis: Run the qPCR program with appropriate cycling conditions for your assay. After completion, review amplification curves to ensure they exhibit characteristic exponential amplification phases. The qPCR instrumentation software will typically automatically calculate Cq values and generate the standard curve [11].
Efficiency Calculation and Troubleshooting
To calculate efficiency from your standard curve:
- Obtain the slope value from the linear regression of your standard curve plot.
- Apply the formula: Efficiency = 10^(-1/slope)
- Convert to percentage: % Efficiency = (Efficiency - 1) × 100
If your efficiency falls outside the ideal 95-105% range, consider these troubleshooting steps:
- Verify primer design: Ensure amplicon size is between 65-150 bases and primers are specific without forming dimers.
- Check template quality: Assess for contamination from phenol, salts, or ethanol in template DNA.
- Optimize reagent concentrations: Adjust primer concentrations and ensure fresh reagents are used.
- Validate instrument settings: Confirm appropriate baseline and threshold settings in your qPCR instrument software [11].
qPCR vs. ddPCR: A Comparative Analysis for Bacterial Quantification
While qPCR with relative quantification serves many research needs effectively, Droplet Digital PCR (ddPCR) has emerged as a complementary technology with distinct advantages for certain applications, particularly in absolute quantification of bacterial targets. The table below summarizes key performance characteristics based on comparative studies:
Table 1: Comparison of qPCR and ddPCR Performance Characteristics for Bacterial Quantification
| Parameter | qPCR with Relative Quantification | ddPCR | Research Implications |
|---|---|---|---|
| Quantification Approach | Relative to standard curve or reference gene | Absolute counting without standard curves | ddPCR eliminates need for reference standards [10] |
| Dynamic Range | Broad dynamic range [5] | Limited at high target concentrations (>10⁶ CFU/mL) [12] | qPCR better for high-abundance bacterial targets |
| Sensitivity | Good sensitivity (LOD ~10⁴ cells/g feces) [7] | Excellent sensitivity (10-fold lower LOD than qPCR) [12] | ddPCR superior for rare targets and low-biomass samples |
| Precision & Reproducibility | Good reproducibility with proper optimization [7] | Superior precision, especially for low targets [13] [5] | ddPCR provides smaller coefficients of variation [5] |
| Tolerance to Inhibitors | Susceptible to PCR inhibitors in samples [14] [7] | High tolerance to inhibitors [13] [14] | ddPCR better for complex samples (stool, soil, food) [14] |
| Throughput & Cost | Faster, cheaper, established protocols [7] | Higher cost, complicated processes [13] | qPCR more accessible for high-throughput screens |
| Reference Gene Requirement | Requires stable reference genes for normalization | No reference genes needed [15] | ddPCR avoids reference gene stability issues |
Tolerance to PCR Inhibitors
A significant advantage of ddPCR for environmental and complex samples is its superior tolerance to PCR inhibitors. Studies demonstrate that ddPCR exhibits greater resistance to common inhibitors like SDS and heparin, with more than a half-log increase in half maximal inhibitory concentration (IC₅₀) values compared to qPCR. This enhanced tolerance occurs because reaction partitioning in ddPCR mitigates the impact of inhibitors—while inhibitors may delay amplification in affected droplets, they don't prevent target detection as in qPCR, where inhibitors affect the entire reaction [14].
Data Reproducibility and Precision
For low-abundance targets (typically with Cq ≥ 29), ddPCR typically produces more precise and reproducible data. In microbial quantification studies, ddPCR has demonstrated significantly smaller coefficients of variation compared to qPCR, especially at low target concentrations. This precision advantage makes ddPCR particularly valuable when quantifying rare targets or detecting small fold-changes (≤2-fold) in bacterial populations [16].
Essential Research Reagent Solutions
Successful relative quantification in qPCR requires specific reagents and materials optimized for reproducible results:
Table 2: Essential Research Reagents for qPCR Relative Quantification
| Reagent/Material | Function | Key Considerations |
|---|---|---|
| SYBR Green or TaqMan Probes | Detection of amplified DNA | SYBR Green is more economical; TaqMan offers greater specificity [11] |
| High-Efficiency Master Mix | Provides enzymes, dNTPs, buffer | Use commercial master mixes for consistent results [11] |
| Low-Binding Tubes and Tips | Sample preparation and dilution | Minimizes nucleic acid loss during serial dilutions [10] |
| Stable Reference Genes | Normalization of qPCR data | Must be validated for consistent expression under experimental conditions [15] |
| Quality Controlled Primers | Target-specific amplification | Validate efficiency (95-105%), specificity, and absence of primer-dimers [11] |
| Standard Curve Reference Material | Quantification benchmark | Use purified genomic DNA, synthetic oligonucleotides, or pooled sample [11] |
Relative quantification using standard curves remains a powerful, accessible method for qPCR-based bacterial quantification, particularly when comparing gene expression or microbial abundance across experimental conditions. Its established protocols, broad dynamic range, and lower cost make it ideal for many research scenarios, especially those involving high-throughput analysis or well-characterized sample types with minimal inhibitors.
However, as the comparative data shows, ddPCR offers compelling advantages for specific applications in bacterial research, particularly when absolute quantification is required, when working with inhibitor-prone samples, or when detecting rare targets near the limit of detection. The choice between these technologies should be guided by specific research needs, considering factors like required precision, sample type, target abundance, and available resources.
For researchers committed to qPCR with relative quantification, rigorous attention to experimental details—including standard curve validation, efficiency verification, and reference gene selection—remains essential for generating reliable, reproducible data that advances our understanding of microbial systems.
Droplet Digital PCR (ddPCR) represents a transformative approach in molecular biology, enabling absolute quantification of nucleic acids without reliance on standard curves. This guide explores the fundamental partitioning mechanism of ddPCR technology and objectively compares its performance to traditional quantitative PCR (qPCR) for bacterial quantification in research applications. Through examination of experimental data across multiple studies, we demonstrate how ddPCR's unique architecture provides enhanced sensitivity, precision, and tolerance to inhibitors—critical advantages for researchers and drug development professionals working with complex biological samples. The analysis is framed within the broader methodological consideration of qPCR versus ddPCR, with particular emphasis on applications in microbial detection and quantification.
Droplet Digital PCR (ddPCR) revolutionizes nucleic acid quantification through a fundamental departure from traditional real-time PCR methodologies. Rather than measuring amplification kinetics, ddPCR employs sample partitioning to achieve absolute quantification without standard curves. The core innovation lies in dividing each PCR reaction into thousands of nanoliter-sized water-in-oil emulsion droplets, effectively creating individual microreactors where amplification occurs independently [17]. This partitioning converts continuous concentration measurements into discrete, countable events, enabling direct quantification through Poisson statistics.
The absolute quantification capability of ddPCR addresses a critical limitation of qPCR, which provides only relative measurements against reference standards. In qPCR, quantification depends on comparing the quantification cycle (Cq) of unknown samples to a standard curve, introducing potential variability from calibration errors and amplification efficiency differences [18]. In contrast, ddPCR's digital nature allows direct counting of target molecules, providing results in copies per microliter without external calibrators [17] [15]. This fundamental difference in approach makes ddPCR particularly valuable for applications requiring high precision across multiple laboratories or longitudinal studies where consistent quantification is essential.
The partitioning process underlying ddPCR technology follows a structured workflow that transforms a bulk PCR reaction into digitally analyzable data, providing the foundation for its superior quantification capabilities in complex research scenarios.
Fundamental ddPCR Partitioning Mechanism
Core Process Description
The ddPCR workflow begins with sample partitioning, where the reaction mixture containing template DNA, primers, probes, and PCR reagents is divided into approximately 20,000 nanoliter-sized droplets [17]. This partitioning occurs through microfluidic technology that generates uniform water-in-oil emulsion droplets, with each droplet functioning as an independent PCR reactor [17]. The random distribution of target DNA molecules follows Poisson distribution, ensuring that most droplets contain either zero or one target molecule, with progressively fewer droplets containing multiple copies [17].
Following partitioning, endpoint PCR amplification is performed on all droplets simultaneously. Unlike qPCR, which monitors fluorescence in real-time during the exponential phase, ddPCR continues amplification to completion, resulting in a binary fluorescence outcome for each droplet [17]. Droplets containing at least one target molecule generate strong positive fluorescence, while those without target remain negative [18]. This binary readout is inherently more resistant to amplification efficiency variations that often complicate qPCR quantification.
The final analytical phase involves droplet reading and statistical analysis. Each droplet is processed through a flow cytometer-like detector that categorizes it as positive or negative based on fluorescence thresholds [17]. The concentration of target nucleic acid is then calculated using Poisson statistics to account for the probability of multiple targets occupying single droplets, yielding absolute quantification in copies per microliter without reference to standards [17] [18]. This fundamental architecture provides the foundation for ddPCR's enhanced performance characteristics in bacterial quantification applications.
Performance Comparison: ddPCR vs. qPCR
Quantitative Comparison Table
Table 1: Direct performance comparison between ddPCR and qPCR for bacterial quantification
| Performance Metric | ddPCR Advantages | qPCR Advantages | Experimental Context |
|---|---|---|---|
| Quantification Method | Absolute quantification without standard curves [17] | Relative quantification requiring standard curves [18] | Fundamental methodological difference |
| Detection Sensitivity | Limit of detection (LOD) of ~10³ cells/g feces for L. reuteri [19] | LOD of ~10⁴ cells/g feces for L. reuteri [19] | Spiked human fecal samples with strain-specific primers [19] |
| Dynamic Range | 1-100,000 copies per 20µl reaction [15] | Wider dynamic range than ddPCR [19] | Manufacturer specifications and experimental validation |
| Inhibition Resistance | High tolerance due to sample partitioning [17] [18] | Susceptible to PCR inhibitors in complex matrices [7] | Testing with spiked fecal samples and plant tissues [7] [18] |
| Precision | Lower coefficient of variation (CV), especially at low concentrations [18] | Higher CV compared to ddPCR [18] | Xanthomonas citri subsp. citri quantification in plant samples [18] |
| Cost and Throughput | ~3× more expensive and 6.5h processing time [20] | Lower cost and faster (2.5h processing time) [20] | Direct comparison for Lactobacillus reuteri quantification [20] |
| Reproducibility | Better reproducibility with some DNA extraction methods [20] | Comparable reproducibility with optimized DNA extraction [19] | Multi-operator, multi-instrument validation |
Comparative Performance Analysis
The experimental data reveal a complex performance landscape where each technology excels in different applications. For low-abundance targets, ddPCR demonstrates clear advantages, with studies reporting significantly lower limits of detection compared to qPCR. In one comprehensive analysis of Limosilactobacillus reuteri quantification in human fecal samples, ddPCR achieved a detection limit of approximately 10³ cells/g feces, while qPCR reached only 10⁴ cells/g feces using the same samples and DNA extraction methods [19]. This enhanced sensitivity makes ddPCR particularly valuable for detecting rare targets or quantifying minimal residual disease in clinical applications [17].
In terms of precision and reproducibility, ddPCR exhibits superior performance, especially at low target concentrations. A study quantifying Xanthomonas citri subsp. citri, the causative agent of citrus bacterial canker, found that ddPCR had a significantly lower coefficient of variation compared to qPCR, particularly at target concentrations near the detection limit [18]. This precision advantage stems from ddPCR's digital nature and resistance to amplification efficiency variations that affect qPCR quantification [18]. However, this precision comes with trade-offs in dynamic range, as qPCR typically offers a broader measurable concentration range without sample dilution [19].
For complex sample matrices, ddPCR's partitioning architecture provides notable advantages in inhibitor resistance. When quantifying bacterial pathogens in spiked fecal samples, ddPCR demonstrated greater resilience to PCR inhibitors present in complex biological samples [17] [7]. The partitioning process effectively dilutes inhibitors across thousands of droplets, minimizing their impact in individual reactions [17]. This tolerance to inhibitors can reduce the need for extensive sample purification, potentially simplifying workflows for challenging sample types commonly encountered in environmental and gut microbiome research [7].
Experimental Protocols for Bacterial Quantification
Strain-Specific Primer Design and Validation
The development of strain-specific PCR assays for bacterial quantification requires systematic primer design and validation. Based on optimized protocols from recent studies, the workflow begins with whole-genome comparisons between target and non-target strains to identify unique genomic regions [19] [7]. These specific sequences are then used to design primers and probes with stringent specificity requirements. For Limosilactobacillus reuteri strain quantification, researchers developed a step-by-step protocol that includes in silico specificity verification against database sequences, followed by empirical testing against closely related strains to confirm absence of cross-reactivity [19].
Following primer design, experimental validation proceeds through several critical phases. First, primer specificity is confirmed using pure cultures of target and non-target strains to ensure amplification only occurs with the intended target [19]. Next, standard curves are generated for qPCR applications using serial dilutions of target DNA with known concentration [7]. For ddPCR, optimal template concentrations are determined to maintain the recommended 1-100,000 copies per 20µl reaction range [15]. Finally, the complete system is validated using spiked samples, where known quantities of target bacteria are added to negative sample matrices (e.g., sterile stool or buffer) to determine recovery efficiency, limit of detection, and limit of quantification [19] [7].
DNA Extraction Method Comparison
The selection of DNA extraction methodology significantly impacts quantification accuracy for both ddPCR and qPCR. Comparative studies have evaluated multiple extraction approaches, including phenol-chloroform (PC) methods, QIAamp Fast DNA Stool Mini Kit (QK), and protocol Q (PQ) for bacterial quantification from fecal samples [7] [20]. These investigations revealed that kit-based methods (QK and PQ) generally produce DNA with higher purity and better quantification results compared to PC extraction, despite PC yielding higher DNA concentrations [20]. The PQ method specifically demonstrated superior recovery of Lactobacillus reuteri cells from feces, resulting in improved detection limits and linearity for both qPCR and ddPCR [20].
The interaction between DNA extraction method and PCR technology further influences overall performance. While ddPCR generally showed better reproducibility with QK and PC extraction methods, its performance with PQ extraction was comparable to qPCR [20]. This finding highlights the importance of considering the entire workflow—from sample preparation through final quantification—when designing bacterial quantification experiments. For complex matrices like fecal samples, the combination of PQ DNA extraction with qPCR quantification was identified as the optimal balance of performance, cost, and throughput for L. reuteri detection [20]. However, for applications requiring maximum sensitivity and inhibitor tolerance, PQ extraction with ddPCR may be preferable despite higher costs.
Research Reagent Solutions
Table 2: Essential research reagents and materials for ddPCR-based bacterial quantification
| Reagent/Material | Function | Application Example |
|---|---|---|
| Strain-Specific Primers/Probes | Target-specific amplification | L. reuteri strain discrimination in fecal samples [19] |
| DNA Extraction Kits (PQ method) | High-purity DNA isolation from complex samples | Optimal recovery from fecal samples [7] |
| Droplet Generation Oil | Creation of water-in-oil emulsion for partitioning | Essential for ddPCR workflow [17] |
| Supermix for Probes | PCR reaction mixture with optimized chemistry | Compatible with droplet formation and endpoint detection [18] |
| Quantitative Standards | Reference materials for qPCR standard curves | Xanthomonas citri subsp. citri quantification [18] |
| Inhibition Resistance Additives | Enhance PCR efficiency in complex matrices | Improved detection in inhibitory samples [17] |
The partioning technology underlying Droplet Digital PCR represents a significant advancement in absolute quantification for bacterial detection and quantification. By dividing samples into thousands of individual reactions, ddPCR achieves unparalleled precision and sensitivity, particularly for low-abundance targets in complex matrices. The experimental data demonstrate clear performance advantages for ddPCR in applications requiring detection of rare targets, working with inhibitory samples, or achieving high precision without reference standards.
However, the choice between ddPCR and qPCR remains context-dependent. While ddPCR offers superior technical performance in several metrics, qPCR maintains advantages in throughput, cost, and dynamic range. Researchers must balance these factors against their specific application requirements, sample type, and resource constraints. For bacterial quantification in research and drug development, ddPCR provides a powerful tool when maximum sensitivity and absolute quantification are paramount, while qPCR remains a robust, cost-effective solution for higher-abundance targets. Understanding the fundamental partitioning mechanism and practical performance characteristics of both technologies enables researchers to make informed methodological selections for their specific bacterial quantification needs.
In the field of molecular biology, accurate quantification of nucleic acids is fundamental to many research and diagnostic applications. Two principal methodologies have emerged for this purpose: the quantification cycle (Cq) value approach used in quantitative PCR (qPCR) and the direct counting approach utilized in droplet digital PCR (ddPCR). While both techniques rely on the polymerase chain reaction to amplify target DNA sequences, their fundamental principles for quantification differ significantly. The Cq method provides a relative measure based on the kinetics of amplification, whereas direct counting offers absolute quantification through physical partitioning and binary detection. Understanding the distinctions between these approaches is critical for researchers, particularly in applications requiring precise nucleic acid quantification, such as microbial load assessment in microbiome studies, viral load determination, and validation of genome editing efficiencies. This guide objectively compares the performance characteristics, experimental requirements, and practical applications of these two dominant quantification paradigms.
Fundamental Principles and Definitions
Cq Value Approach in qPCR
The quantification cycle (Cq) value, also known as cycle threshold (Ct), is defined as the PCR cycle number at which a sample's amplification curve intersects a fluorescence threshold set above background levels but within the exponential amplification phase [21] [22]. This value is inversely correlated with the starting quantity of the target nucleic acid—lower Cq values indicate higher initial target concentrations, while higher Cq values suggest lower target amounts [21]. The relationship between Cq and target concentration is described by the equation:
Cq = log(Nq) - log(N₀) / log(E)
Where Nq represents the quantity of amplicons at the threshold, N₀ is the initial target copy number, and E is the PCR efficiency [22]. This calculation demonstrates that Cq values are not direct measurements of quantity but rather relative positions on an amplification curve that must be interpreted through mathematical models and comparison to standards.
Direct Counting Approach in ddPCR
Direct counting in ddPCR represents a fundamentally different approach to nucleic acid quantification. This method partitions a PCR reaction into thousands to millions of nanoliter-sized water-in-oil droplets, effectively creating numerous individual reaction chambers [5]. After endpoint PCR amplification, each droplet is analyzed separately to determine whether it contains at least one copy of the target sequence (positive) or no target (negative) [23] [5]. The absolute concentration of the target nucleic acid in the original sample is then calculated using Poisson statistics based on the ratio of positive to negative droplets, without requiring calibration curves [5]. The fundamental calculation follows:
λ = -ln(1 - p)
Where λ represents the average number of target molecules per droplet and p is the fraction of positive droplets [5]. This direct counting approach provides absolute quantification by literally counting individual molecules through binary endpoint detection.
Performance Comparison and Experimental Data
Key Metric Comparisons
Table 1: Comparative Performance of Cq-Based Quantification (qPCR) vs. Direct Counting (ddPCR)
| Performance Metric | Cq Value Approach (qPCR) | Direct Counting (ddPCR) |
|---|---|---|
| Quantification Type | Relative (requires standard curve) | Absolute (no standard curve needed) |
| Dynamic Range | Broader [5] | More limited [5] |
| Sensitivity | Lower detection limit ~10²-10³ copies/reaction | Higher sensitivity, can detect single copies [5] |
| Precision | Good for medium-high targets, higher CV at low concentrations [5] | Excellent precision, especially at low target concentrations [5] |
| Tolerance to PCR Inhibitors | Moderate, Cq values can be significantly affected [5] | High, due to endpoint detection and partitioning [5] |
| Reproducibility | Good between replicates, but inter-lab variation common [22] | Excellent reproducibility between labs and instruments |
| Cost and Throughput | Lower cost per sample, higher throughput [7] | Higher cost per sample, medium throughput [7] |
Table 2: Applications-Based Method Selection Guide
| Application Scenario | Recommended Method | Rationale |
|---|---|---|
| High-throughput screening | qPCR | Faster and more cost-effective for large sample numbers [7] |
| Low-abundance target detection | ddPCR | Superior sensitivity and precision at low concentrations [5] |
| Absolute quantification needs | ddPCR | No standard curve required, direct absolute measurement [24] |
| Gene expression analysis | qPCR | Established workflows, good for fold-change calculations |
| Complex sample matrices | ddPCR | Better resistance to PCR inhibitors [5] |
| Viral load detection | Both (context-dependent) | qPCR for routine monitoring, ddPCR for low viral loads |
Experimental Evidence from Comparative Studies
Recent comparative studies provide robust experimental data supporting these performance characteristics. In microbiome research, a 2024 systematic comparison found that while ddPCR showed slightly better reproducibility, qPCR demonstrated comparable sensitivity and linearity (R² > 0.98) with kit-based DNA isolation methods [7]. The limit of detection for both methods was approximately 10⁴ cells/gram of feces for quantifying Limosilactobacillus reuteri strains, though optimized qPCR protocols could achieve detection limits of around 10³ cells/gram [7].
A definitive comparison study focusing on plant pathogen detection (Xanthomonas citri subsp. citri) demonstrated that while qPCR had a broader dynamic range, ddPCR exhibited significantly higher sensitivity [5]. The ddPCR assay showed lower coefficients of variation, especially at low target concentrations, and demonstrated superior tolerance to PCR inhibitors commonly found in complex sample matrices [5]. The direct counting approach of ddPCR also eliminated issues related to calibration curve variations between laboratories, a known limitation of Cq-based quantification [5].
For bacterial quantification in human gut microbiome samples, both methods can effectively quantify 16S rRNA genes to determine prokaryotic concentration in stool samples, with the final output expressed as 16S rRNA copies per wet or dry gram of stool [24]. The selection between methods depends on the specific application requirements, with qPCR being cheaper and faster, while ddPCR provides superior absolute quantification without standard curves [24].
Detailed Experimental Protocols
qPCR Protocol for Bacterial Quantification
Protocol 1: Cq-Based Absolute Quantification of Prokaryotes in Stool Samples [24]
Sample Preparation:
- Measure stool sample moisture content by weighing before and after lyophilization.
- Homogenize stool samples in phosphate-buffered saline (PBS) to create a uniform suspension.
DNA Extraction:
- Use kit-based DNA isolation methods (e.g., QIAamp Fast DNA Stool Mini Kit) for consistent results.
- Include appropriate controls to monitor extraction efficiency and potential contamination.
- Quantify DNA purity spectrophotometrically.
qPCR Reaction Setup:
- Prepare reaction mix containing: 2.5 μL PCR buffer (10×), 1.5 μL MgCl₂ (25 mM), 0.25 μL dNTPs (10 mM), 0.5 μL each forward and reverse primer (10 μM), 0.5 μL SYBR Green I, 0.25 μL Taq DNA polymerase, and template DNA.
- Use the following universal 16S rRNA gene primers:
- Forward: 5'-TCCTACGGGAGGCAGCAGT-3'
- Reverse: 5'-GGACTACCAGGGTATCTAATCCTGTT-3'
qPCR Amplification:
- Run on real-time PCR instrument with the following conditions:
- Initial denaturation: 95°C for 10 minutes
- 40 cycles of: 95°C for 15 seconds, 60°C for 60 seconds
- Include standard curve with known copy numbers of target sequence.
- Run on real-time PCR instrument with the following conditions:
Data Analysis:
- Determine Cq values for each sample using instrument software.
- Calculate absolute target concentration by comparing sample Cq values to the standard curve.
- Normalize results to stool weight (copies/gram) accounting for moisture content.
ddPCR Protocol for Direct Counting
Protocol 2: Direct Counting Absolute Quantification of Bacterial Strains [7] [5]
Sample Preparation and DNA Extraction:
- Follow identical sample preparation and DNA extraction as in Protocol 1 to ensure comparable results.
Droplet Generation:
- Prepare PCR reaction mix containing: 1× ddPCR supermix, 900 nM primers, 250 nM probe, and template DNA.
- Load sample into droplet generator cartridge along with droplet generation oil.
- Generate approximately 20,000 nanoliter-sized droplets per sample.
PCR Amplification:
- Transfer droplets to 96-well PCR plate and seal.
- Perform amplification on thermal cycler with the following conditions:
- Initial denaturation: 95°C for 10 minutes
- 40 cycles of: 94°C for 30 seconds, 60°C for 60 seconds
- Enzyme deactivation: 98°C for 10 minutes
- Include no-template controls to confirm absence of contamination.
Droplet Reading and Analysis:
- Place plate in droplet reader which measures fluorescence in each droplet individually.
- Set appropriate threshold to distinguish positive and negative droplets.
- Use Poisson statistics to calculate absolute concentration of target DNA in the original sample:
- Concentration (copies/μL) = -ln(1 - p) / V
- Where p = fraction of positive droplets, V = volume of each droplet
The Scientist's Toolkit: Essential Research Reagents and Materials
Table 3: Essential Research Reagents and Materials for Nucleic Acid Quantification
| Item | Function | Application Notes |
|---|---|---|
| SYBR Green dye | Binds double-stranded DNA, enables fluorescence detection | Cost-effective for qPCR; compatible with most real-time instruments [25] |
| Sequence-specific probes (e.g., TaqMan) | Provide target-specific fluorescence through FRET | Increase qPCR specificity; require separate design and validation [25] |
| Droplet generation oil | Creates water-in-oil emulsion for partitioning | Essential for ddPCR; formulation affects droplet stability [5] |
| Digital PCR supermix | Optimized reaction mixture for partitioning | Contains DNA polymerase, dNTPs, buffers optimized for ddPCR [5] |
| Standard curve templates | Enables relative quantification in qPCR | Must be accurately quantified; plasmid DNA or synthetic oligos [22] |
| DNA extraction kits | Isolate nucleic acids from complex samples | Critical for both methods; choice affects yield and purity [7] |
| Passive reference dyes (e.g., ROX) | Normalize for well-to-well variations | Important for qPCR with non-uniform thermal conditions [21] |
| Microdroplet readers | Analyze individual droplets in ddPCR | Specialized equipment for endpoint fluorescence detection [5] |
Critical Considerations for Method Selection
Impact of PCR Efficiency on Quantification Accuracy
PCR amplification efficiency significantly impacts the reliability of Cq-based quantification but has minimal effect on direct counting approaches. The Cq value depends on PCR efficiency as shown in the fundamental equation Cq = log(Nq) - log(N₀) / log(E) [22]. Even small variations in efficiency (e.g., 90% vs 100%) can lead to substantial errors in calculated concentrations when using Cq values [22]. In contrast, direct counting with ddPCR is largely unaffected by PCR efficiency variations because it uses endpoint detection rather than amplification kinetics [5]. This makes direct counting particularly advantageous when amplifying difficult targets or working with samples containing PCR inhibitors.
Dynamic Range and Detection Limits
While direct counting methods generally offer superior sensitivity for low-abundance targets, Cq-based quantification typically provides a broader dynamic range [5]. The practical detection limit for qPCR is approximately 10-100 copies per reaction, while ddPCR can reliably detect single copies [5]. However, at high target concentrations, ddPCR suffers from saturation effects when too many droplets contain multiple targets, limiting its upper quantification range [23]. In such cases, sample dilution is required for accurate ddPCR quantification, while qPCR can handle higher concentrations without modification.
Practical Implementation Factors
For routine laboratory applications, Cq-based qPCR maintains advantages in throughput, cost-effectiveness, and established workflows [7]. The direct counting approach requires specialized instrumentation and more expensive reagents, making it less accessible for some laboratories [7]. However, for applications demanding absolute quantification across multiple laboratories or longitudinal studies, direct counting provides superior reproducibility without the need for harmonized standard curves [5]. The resistance of ddPCR to PCR inhibitors also makes it preferable for analyzing complex sample matrices like soil, feces, or clinical specimens [5].
Both Cq value quantification and direct counting represent powerful approaches for nucleic acid quantification with complementary strengths and limitations. The Cq-based approach using qPCR offers broader dynamic range, higher throughput, and lower per-sample costs, making it ideal for routine quantification where relative comparisons are sufficient and sample quality is consistent. Conversely, direct counting via ddPCR provides absolute quantification without standard curves, superior sensitivity and precision at low target concentrations, and greater resilience to PCR inhibitors—advantages that are particularly valuable for clinical diagnostics, rare target detection, and analyzing complex samples. The selection between these methodologies should be guided by specific application requirements, sample characteristics, and available resources rather than presuming universal superiority of either approach. As molecular quantification needs continue to evolve in research and diagnostic contexts, understanding these fundamental differences in quantification approach ensures appropriate method selection for generating reliable, reproducible results.
The Critical Role of DNA Extraction and Sample Preparation
Within the rapidly advancing field of microbiome research, the debate between quantitative PCR (qPCR) and droplet digital PCR (ddPCR) for the absolute quantification of bacteria often focuses on the performance of the amplification chemistry itself. However, a factor of equal, if not greater, importance lies in the initial stages of sample processing: DNA extraction and sample preparation. The choice of how microbial DNA is isolated from complex matrices like fecal or environmental samples critically influences the accuracy, sensitivity, and reproducibility of any downstream molecular quantification [7] [20]. This guide objectively compares qPCR and ddPCR performance within the context of a broader thesis on absolute bacterial quantification, highlighting how DNA extraction protocols directly determine the success of the analytical method. We summarize experimental data and provide detailed methodologies to guide researchers in selecting and optimizing their sample preparation workflows.
qPCR vs. ddPCR: A Performance Comparison Shaped by Sample Preparation
The fundamental difference between the two techniques lies in their approach to quantification. qPCR is a sample-interdependent method that estimates the initial concentration of a target DNA by comparing the quantification cycle (Cq) of a sample to an external standard curve [18]. In contrast, ddPCR is a sample-independent method that partitions a reaction into thousands of nanoliter-sized droplets, counts the positive and negative droplets after end-point amplification, and uses Poisson statistics to provide an absolute count of target DNA molecules without the need for a standard curve [18].
This core difference dictates how each technology responds to challenges originating from sample preparation, particularly the presence of PCR inhibitors. The following table summarizes key performance differences, with data drawn from direct comparative studies.
Table 1: Performance comparison of qPCR and ddPCR for bacterial quantification, influenced by DNA extraction and sample quality.
| Performance Metric | qPCR | ddPCR | Context from Experimental Data |
|---|---|---|---|
| Quantification Basis | Relative to a standard curve [18] | Absolute count via Poisson statistics [18] | The need for a reliable standard curve in qPCR introduces an additional variable affected by sample purity. |
| Dynamic Range | Broader [7] [18] | More restricted [7] | One study noted qPCR's wider dynamic range as an advantage [7]. |
| Sensitivity (LOD/LOQ) | Slightly higher limit of detection [20] | Lower limit of quantification [20] | For L. reuteri in feces, ddPCR showed a lower LOQ [20]. In plant pathogen detection, ddPCR also showed significantly higher sensitivity [18]. |
| Tolerance to PCR Inhibitors | Susceptible; relies on amplification efficiency [26] [18] | Highly tolerant; less affected by inhibitors [13] [18] | ddPCR's partitioning dilutes inhibitors, making it more robust for complex samples like soil or feces [13]. Consistent contamination (e.g., from reverse transcriptase) can severely skew qPCR Cq values but has minimal impact on ddPCR quantification [26]. |
| Reproducibility | Good with high-quality DNA [7] | Excellent, especially for low-abundance targets [7] [13] | A study on L. reuteri found ddPCR had slightly better reproducibility with some DNA extraction methods [7]. Another study reported ddPCR had smaller coefficients of variation [13]. |
| Cost & Speed | Lower cost per reaction; faster (e.g., 2.5 hrs) [20] | Higher cost per reaction; more time-consuming (e.g., 6.5 hrs) [20] | The combination of being cheaper and faster was noted as a key advantage for qPCR [7] [20]. |
Impact of DNA Extraction Methods on Quantification Accuracy
The methodology used to isolate DNA from a sample is a critical pre-analytical variable. Different extraction techniques vary in their efficiency at lysing bacterial cells, their ability to remove co-extracted PCR inhibitors (such as humic acids in soil or bilirubin in feces), and the final purity and yield of the DNA [7].
A systematic comparison using human fecal samples spiked with a known quantity of Limosilactobacillus reuteri demonstrated that the choice of DNA extraction method directly impacts the apparent abundance measured by both qPCR and ddPCR [7] [20]. The study compared a phenol-chloroform-based method (PC), a commercial kit-based method (QK), and an optimized kit-based method (PQ) [7].
Table 2: Impact of DNA extraction method on the quantification of L. reuteri in human fecal samples [7] [20].
| Extraction Method | DNA Yield & Purity | Bacterial Cell Recovery | Linearity (R²) with qPCR/ddPCR | Limit of Detection (LOD) |
|---|---|---|---|---|
| Phenol-Chloroform (PC) | Highest concentration, but lower purity [20] | Lower recovery of bacterial cells [7] | Lower linearity compared to kit methods [20] | ~4.86 Log10 CFU/g (qPCR) [20] |
| Kit-Based Method (QK) | Acceptable quantity and high quality [20] | Good recovery [7] | High linearity (R² > 0.98) [7] | ~3.95 Log10 CFU/g (qPCR) [20] |
| Optimized Kit-Based (PQ) | Good quantity and high quality [20] | The most substantial proportion of cells recovered [20] | High linearity (R² > 0.98) [7] | ~4.11 Log10 CFU/g (qPCR) [20] |
The data shows that while the PC method yielded a high concentration of DNA, the lower purity likely resulted in poorer cell recovery and a higher (worse) limit of detection. The kit-based methods, particularly the optimized PQ protocol, provided a superior balance of high-quality DNA and efficient cell recovery, leading to more sensitive and accurate quantification [7] [20]. This underscores that a high DNA concentration does not necessarily equate to a representationally accurate sample for microbial quantification.
Detailed Experimental Protocols for DNA Extraction and PCR
To ensure reproducible and high-quality results, adherence to validated protocols is essential. Below are detailed methodologies for DNA extraction and PCR setup as cited in the comparative literature.
DNA Extraction from Fecal Samples Using an Optimized Kit-Based Method (PQ)
This protocol is adapted from an optimized kit-based method (protocol Q) described for the absolute quantification of bacterial strains in human fecal samples [7].
Sample Pre-treatment:
- Weigh and Homogenize: Weigh 1 gram of stool sample and dilute it tenfold in ice-cold phosphate-buffered saline (PBS).
- Wash Cells: Vortex the mixture vigorously. Take 1 mL of the homogenate (equivalent to 0.1 g of raw sample) and centrifuge at 8000 × g for 5 minutes at 4°C.
- Repeat Washing: Discard the supernatant and wash the cell pellet three times with ice-cold PBS buffer to remove soluble PCR inhibitors.
Lysis and DNA Isolation: The subsequent steps follow the protocol Q as previously described [7] [9], which is designed to maximize cell lysis and DNA recovery while maintaining purity. The precise steps involve:
- Resuspend Pellet: Resuspend the final washed cell pellet in a specialized lysis buffer.
- Enzymatic Lysis: Incubate the suspension with lysozyme and proteinase K to degrade the bacterial cell wall and associated proteins.
- Bind DNA: Use a commercial silica-membrane column to bind the DNA from the lysate.
- Wash Contaminants: Wash the bound DNA with provided buffers to remove salts, proteins, and other impurities thoroughly.
- Elute DNA: Elute the pure DNA in a low-EDTA Tris buffer or nuclease-free water.
Quality Control:
- Assess the purity of the isolated DNA spectrophotometrically by measuring the A260/A280 and A260/A230 ratios. High-quality DNA should have an A260/A280 ratio of ~1.8 and an A260/A230 ratio greater than 2.0 [7].
Strain-Specific qPCR Assay Setup
This protocol outlines the steps for setting up a strain-specific qPCR assay based on a study that designed assays for L. reuteri strains [7].
Reaction Setup:
- Prepare Master Mix: For a 20 µL reaction, combine the following components:
- 10 µL of a 2x qPCR master mix (containing DNA polymerase, dNTPs, and MgCl₂).
- Forward and reverse strain-specific primers (final concentration typically 200-500 nM each).
- Fluorescently labeled probe (e.g., TaqMan) or DNA intercalating dye (e.g., SYBR Green).
- Nuclease-free water.
- Add Template DNA: Add 2-5 µL of extracted DNA template.
- Include Controls: Run each plate with a standard curve of known target concentration (e.g., serial dilutions of gBlock or plasmid containing the target sequence), no-template controls (NTC), and positive controls.
Amplification Conditions:
- Thermocycling: Perform amplification in a real-time PCR thermocycler using the following typical conditions:
- Initial Denaturation: 95°C for 5 minutes.
- 40 cycles of:
- Denaturation: 95°C for 30 seconds.
- Annealing/Extension: 60°C for 30-60 seconds (acquire fluorescence signal at this step).
- Data Analysis: Calculate the absolute quantity of the target in the sample by interpolating the Cq values against the standard curve.
Strain-Specific ddPCR Assay Setup
The ddPCR reaction mixture is similar to qPCR but is partitioned into droplets, and data is acquired at the end-point [18].
Reaction Setup and Partitioning:
- Prepare Master Mix: Prepare a PCR reaction mix similar to the qPCR assay, though the choice of fluorescent chemistry (probe-based is common) and optimal primer/probe concentrations may require re-optimization for the ddPCR platform.
- Generate Droplets: Load the reaction mixture into a droplet generator, which partitions each sample into 20,000 nanoliter-sized oil-emulsion droplets.
Amplification and Reading:
- PCR Amplification: Transfer the droplets to a 96-well plate and perform PCR amplification on a conventional thermal cycler to end-point. A standard two-step thermocycling protocol is used (e.g., 40 cycles of 94°C for 30 sec and 60°C for 60 sec).
- Read Droplets: After amplification, transfer the plate to a droplet reader. The reader flows the droplets single file past a fluorescent detector, which classifies each droplet as positive or negative based on its fluorescence amplitude.
Data Analysis:
- Absolute Quantification: The concentration of the target DNA (in copies/µL) is calculated directly from the fraction of positive droplets using Poisson statistics, without the need for a standard curve [18].
The Scientist's Toolkit: Essential Research Reagents and Materials
The following table details key reagents and materials critical for successful DNA extraction and PCR-based bacterial quantification.
Table 3: Essential research reagents and materials for DNA extraction and PCR quantification.
| Item | Function | Example Use-Case |
|---|---|---|
| Lysis Buffer (with Lysozyme & Proteinase K) | Breaks down bacterial cell walls and degrades proteins to release DNA [7]. | Essential for efficient Gram-positive bacterial lysis in fecal samples [7]. |
| Silica-Membrane DNA Binding Columns | Selectively binds DNA in the presence of chaotropic salts, allowing impurities to be washed away [7]. | Used in kit-based DNA extraction methods (QK, PQ) for high-purity DNA isolation [7]. |
| Phenol-Chloroform-Isoamyl Alcohol | Organic solvent used to separate DNA from proteins and lipids in the sample [7]. | Used in traditional phenol-chloroform (PC) extraction protocols [7]. |
| Strain-Specific Primers & Probes | Oligonucleotides designed to uniquely amplify a target sequence from a specific bacterial strain [7] [18]. | Critical for the specific detection and quantification of a probiotic strain (e.g., L. reuteri DSM 17938) against a background of a complex microbiota [7]. |
| Digital PCR Supermix | A specialized PCR mix optimized for droplet formation and stability during ddPCR [18]. | Required for robust droplet generation and clear fluorescence separation in ddPCR assays [18]. |
| Quantitative PCR Master Mix | A pre-mixed solution containing Taq polymerase, dNTPs, MgCl₂, and optimized buffers for efficient amplification in qPCR. | The core reagent for any qPCR assay, with choice of chemistry (e.g., SYBR Green or TaqMan) [27]. |
Workflow Visualization: From Sample to Quantification Result
The following diagram illustrates the critical decision points in the sample preparation and analysis pipeline, highlighting how the quality of DNA extraction dictates the optimal path to reliable quantification.
The choice between qPCR and ddPCR for absolute bacterial quantification is not made in isolation; it is profoundly influenced by the upstream processes of DNA extraction and sample preparation. While ddPCR offers clear advantages in tolerance to PCR inhibitors and precision for low-abundance targets, its higher cost and longer turnaround time are non-trivial considerations [7] [20]. Conversely, qPCR is a robust, cost-effective, and rapid technology, but its accuracy is highly dependent on the purity of the starting DNA template [7] [26].
The experimental data demonstrates that the use of optimized, kit-based DNA extraction methods can produce DNA of sufficient quality to make qPCR performance nearly comparable to ddPCR for many applications [7]. Therefore, the critical role of DNA extraction is to serve as the foundation upon which a reliable quantification assay is built. Researchers must view their workflow as an integrated system: investing in a validated, high-quality DNA extraction protocol can mitigate the limitations of qPCR or, alternatively, ensure that the superior technical performance of ddPCR is fully realized. A rigorous, methodical approach to sample preparation is the true differentiator in generating publication-quality data in the field of absolute bacterial quantification.
Implementing qPCR and ddPCR Protocols for Bacterial Detection and Quantification
Designing Strain-Specific Primers and Probes for Target Bacteria
In the evolving landscape of microbial research, the ability to accurately detect and quantify specific bacterial strains has become paramount across diverse fields including clinical diagnostics, environmental monitoring, and food safety. While species-level identification provides valuable information, many critical biological functions—such as virulence, antibiotic resistance, and biocontrol properties—are strain-specific attributes [28] [7]. The design of precise genetic markers for strain differentiation thus represents a fundamental challenge in molecular microbiology, with implications for diagnosing pathogens, tracking probiotic interventions, and monitoring microbial biocontrol agents in agricultural and environmental settings.
The emergence of digital PCR technologies has revolutionized absolute quantification approaches, creating a new paradigm for microbial detection and quantification. This guide provides a comprehensive comparison between quantitative PCR (qPCR) and droplet digital PCR (ddPCR) methodologies within the context of strain-specific bacterial detection, empowering researchers to select the optimal approach based on their specific application requirements, sample type, and precision needs.
Fundamental Principles: qPCR vs. ddPCR
Quantitative PCR (qPCR) Technology
Quantitative PCR, also known as real-time PCR, is a well-established molecular technique that enables both detection and quantification of specific nucleic acid sequences. This method relies on monitoring amplification in real-time through fluorescent signals that increase proportionally to the amount of amplified product. The quantification cycle (Cq), at which the fluorescence crosses a threshold, is used to estimate the initial template concentration by comparison with standard curves generated from known concentrations [18]. While qPCR provides excellent dynamic range and relatively quick results, its quantification is considered relative rather than absolute because it depends on external calibrators and assumes consistent amplification efficiency across samples [29].
Droplet Digital PCR (ddPCR) Technology
Droplet digital PCR represents a fundamental shift in quantification approach by providing absolute nucleic acid quantification without the need for standard curves. The core innovation involves partitioning a single PCR reaction into thousands of nanoliter-sized water-in-oil droplets, effectively creating individual microreactions. Following end-point PCR amplification, each droplet is analyzed as either positive (containing at least one target molecule) or negative (containing no target). The absolute concentration of target DNA in the original sample is then calculated using Poisson statistics based on the ratio of positive to negative droplets [30] [29]. This partitioning approach also enhances resistance to PCR inhibitors, as inhibitors are similarly distributed across droplets rather than affecting the entire reaction [18].
Figure 1: ddPCR Workflow for Absolute Quantification
Performance Comparison: Experimental Data Analysis
Sensitivity and Detection Limits
Multiple studies have systematically compared the sensitivity and detection limits of qPCR and ddPCR across various sample types and bacterial targets. The results consistently demonstrate ddPCR's superior sensitivity for low-abundance targets, while qPCR maintains advantages in dynamic range.
Table 1: Sensitivity Comparison Between qPCR and ddPCR
| Sample Type | Target Bacteria | qPCR LOD | ddPCR LOD | Reference |
|---|---|---|---|---|
| Environmental samples | Mixed bacteria & fungi | Higher | Significantly lower | [13] |
| Human fecal samples | Limosilactobacillus reuteri | ~104 cells/g | Comparable sensitivity | [7] |
| Citrus samples | Xanthomonas citri subsp. citri | Higher | 6-fold more sensitive | [18] |
| Artificial mouse feces | Shigella spp. | 10 CFU/reaction | 1 CFU/reaction | [31] |
| Spiked fecal samples | L. reuteri PB-W1 & DSM 20016 T | ~103 cells/g | Similar detection limit | [7] |
In a direct comparison for detecting Xanthomonas citri subsp. citri, the causative agent of citrus bacterial canker, ddPCR demonstrated approximately 6-fold higher sensitivity compared to qPCR [18]. Similarly, when detecting Shigella species in artificial mouse feces, ddPCR showed 10-fold higher sensitivity than qPCR, with detection limits of 1 CFU/reaction versus 10 CFU/reaction, respectively [31].
Precision, Accuracy, and Resistance to Inhibitors
The partitioning technology underlying ddPCR provides inherent advantages in precision, particularly at low target concentrations, and greater resistance to PCR inhibitors common in complex sample matrices.
Table 2: Precision and Accuracy Comparison
| Parameter | qPCR Performance | ddPCR Performance | Experimental Context |
|---|---|---|---|
| Accuracy | Good, but relies on standard curves | Excellent, absolute quantification without standards | Mock communities with known concentrations [13] |
| Precision at low concentrations | Higher CV (coefficient of variation) | Significantly lower CV | Detection of Xanthomonas citri subsp. citri [18] |
| Inhibitor resistance | Susceptible to PCR inhibitors | High resistance; inhibitors affect only subset of droplets | Environmental samples with complex matrices [13] [18] |
| Reproducibility | Good with optimized assays | Excellent, with smaller coefficients of variation | Human fecal samples [7] |
In environmental samples containing both bacteria and fungi, ddPCR quantification results were "significantly closer to expected values (p < .05), and had smaller coefficients of variations (p < .05) than qPCR," indicating superior accuracy and repeatability [13]. The study also noted that ddPCR "had better precision, repeatability, sensitivity, and stability in bacterial and fungal quantitation than qPCR" across multiple habitat types [13].
Workflow Comparison: From Primer Design to Quantification
Strain-Specific Marker Identification and Primer Design
The initial phase of developing strain-specific detection assays involves identifying unique genetic regions and designing appropriate primers and probes. Next-generation sequencing (NGS) data has dramatically improved this process by enabling comprehensive genomic comparisons.
Figure 2: Workflow for Strain-Specific Primer Design
A robust workflow for strain-specific primer design begins with whole genome sequencing of the target strain and relevant reference strains [28]. Specific strain sequences are identified through bioinformatic comparisons, followed by careful primer and probe design targeting these unique regions. In silico verification through BLAST analysis against public databases ensures specificity before empirical testing [28]. This approach has been successfully applied to diverse bacterial genera, yielding "thousands of candidate markers" for strain-specific detection [28].
For Pseudomonas aeruginosa detection, researchers compared 816 publicly available genome sequences to identify a conserved and specific gene encoding a hypothetical protein (WP_003109295.1), then designed primers demonstrating "high level of sensitivity and specificity for P. aeruginosa among various Pseudomonas species" [32].
Sample Processing and Nucleic Acid Extraction
Proper sample processing and DNA extraction are critical steps that significantly impact quantification accuracy, particularly for complex sample matrices like feces, soil, or food products.
Table 3: Sample Processing Methods for Different Matrices
| Sample Type | Recommended Processing Method | Key Considerations | Application Reference |
|---|---|---|---|
| Human fecal samples | Kit-based methods (QIAamp Fast DNA Stool Mini Kit) | Better reproducibility compared to phenol-chloroform | [7] |
| Plant tissue | Soaking in PBS + centrifugation | Efficient recovery of pathogen cells from surface | [18] |
| Wastewater | Concentration + DNA extraction | Enables detection of antibiotic resistance genes | [33] |
| Seawater | Tangential flow filtration + DNase treatment | Concentrates viral particles for pelagiphage detection | [30] |
For human gut microbiome studies, systematic comparison of DNA extraction methods revealed that "kit-based DNA isolation methods" provided the best balance of sensitivity and reproducibility for absolute quantification of bacterial strains in fecal samples [7]. In plant disease diagnosis, a simple soaking and washing protocol effectively isolated Xanthomonas citri subsp. citri cells from citrus tissue according to the Chinese National Standard for diagnosis [18].
Quantification Workflows: qPCR vs. ddPCR
The operational workflows for qPCR and ddPCR share similarities but have distinct differences that influence their application in research settings.
Figure 3: Comparative Workflows of qPCR and ddPCR
The ddPCR workflow incorporates droplet generation as a crucial additional step that enables absolute quantification through binary counting of positive and negative reactions rather than continuous fluorescence monitoring [29]. This fundamental difference eliminates the need for standard curves and provides different advantages depending on the application context.
The Scientist's Toolkit: Essential Reagents and Materials
Table 4: Essential Research Reagents for Strain-Specific Bacterial Detection
| Reagent/Material | Function | Application Examples |
|---|---|---|
| Strain-specific primers & probes | Target recognition and amplification | Hydrolysis probes for Xanthomonas citri [18]; ipaH9.8 gene primers for Shigella [31] |
| DNA extraction kits | Nucleic acid purification from complex matrices | QIAamp Fast DNA Stool Mini Kit for fecal samples [7]; QIAamp Ultrasense Virus Kit for viral concentrates [30] |
| ddPCR supermix | Reaction mixture for droplet generation | EvaGreen or probe-based ddPCR assays [29] |
| Droplet generator & reader | Instrumentation for droplet creation and analysis | Bio-Rad ddPCR systems [29] |
| Standard reference materials | Quantification standards for qPCR | Linearized plasmid DNA [18]; cloned target sequences [32] |
Application-Oriented Selection Guidelines
Recommended Applications for ddPCR
Digital PCR technology excels in specific scenarios where its unique advantages provide significant experimental benefits:
Low-abundance targets: When detecting rare strains or targets near the detection limit, ddPCR's enhanced sensitivity provides superior performance [18] [31].
Inhibitor-rich samples: For complex sample matrices like soil, feces, or food that contain PCR inhibitors, ddPCR's partitioning provides inherent resistance [13] [18].
Absolute quantification requirements: When exact copy number determination is essential without reference standards [7] [9].
Precision at low concentrations: Applications requiring high precision for targets with low concentrations benefit from ddPCR's reduced variation [18].
Recommended Applications for qPCR
Quantitative PCR remains the preferred choice for many applications where its established advantages align with experimental needs:
High-throughput screening: When processing large sample numbers, qPCR's faster turnaround time and higher throughput are advantageous [7].
Broad dynamic range: For samples with widely varying target concentrations that might exceed ddPCR's linear range [18] [7].
Budget-constrained studies: When cost-effectiveness is a primary consideration, as qPCR has lower per-reaction costs [7].
Established standardized assays: For routine testing where validated qPCR protocols already exist [32].
The selection between qPCR and ddPCR for strain-specific bacterial detection depends primarily on experimental priorities, sample characteristics, and resource constraints. ddPCR offers compelling advantages for absolute quantification of low-abundance targets in inhibitor-rich environments, while qPCR provides robust, cost-effective solutions for higher-throughput applications with established targets.
As microbial research continues to emphasize strain-level functional differences, both technologies will play complementary roles in advancing our understanding of microbial communities in human health, agriculture, and environmental science. By applying the systematic comparison and experimental data presented in this guide, researchers can make informed decisions to optimize their strain detection strategies for specific application requirements.
Step-by-Step qPCR Workflow for Bacterial Load Assessment
In the field of microbiological research, accurately determining the absolute abundance of bacterial cells is fundamental for understanding microbial dynamics in various environments, from the human gut to contaminated food products. While next-generation sequencing (NGS) has revolutionized microbiome research by providing comprehensive community profiles, this approach generates only semi-quantitative, compositional data that reflects relative abundances rather than actual cell counts [34] [7]. The critical limitation of relative abundance data becomes apparent when studying interventions that alter the total microbial load: a decrease in one bacterium's relative abundance might simply reflect the expansion of other community members rather than an actual reduction in its absolute numbers [34]. This fundamental distinction underscores the necessity of absolute quantification methods for precise microbial enumeration in research and diagnostic applications.
Two primary molecular techniques dominate the landscape of absolute bacterial quantification: quantitative PCR (qPCR) and droplet digital PCR (ddPCR). Both methods offer significant advantages over traditional culture-based approaches, which are often time-consuming and unable to detect viable but non-culturable (VBNC) cells [35] [28]. The choice between qPCR and ddPCR involves careful consideration of multiple factors, including required precision, sample type, inhibitory substances in samples, and available laboratory resources. This guide provides a comprehensive, evidence-based comparison of these technologies and presents a detailed step-by-step qPCR workflow for bacterial load assessment, enabling researchers to make informed methodological decisions for their specific applications.
qPCR vs. ddPCR: Technology Comparison
Fundamental Principles and Performance Characteristics
Quantitative PCR (qPCR) operates by monitoring DNA amplification in real-time as the reaction progresses through each cycle. The technique relies on comparing cycle quantification (Cq) values of unknown samples to standard curves generated from reference materials with known nucleic acid concentrations [36] [37]. In contrast, digital PCR (including ddPCR) employs a sample partitioning approach where the reaction mixture is divided into thousands to millions of individual partitions, followed by end-point detection of amplification in each partition [38] [37]. The absolute quantification in dPCR is derived from the ratio of positive to negative partitions based on Poisson distribution statistics, eliminating the need for standard curves [36] [38].
Table 1: Core Technological Differences Between qPCR and ddPCR
| Feature | Quantitative PCR (qPCR) | Droplet Digital PCR (ddPCR) |
|---|---|---|
| Quantification Type | Relative or absolute (requires standard curve) | Absolute (no standard curve needed) |
| Principle | Real-time monitoring of amplification | End-point detection after sample partitioning |
| Data Collection | During exponential phase cycles | After PCR completion |
| Impact of PCR Inhibitors | More susceptible | Higher tolerance [37] |
| Impact of PCR Efficiency | Highly sensitive to efficiency variations | Less affected by efficiency variations [37] |
| Dynamic Range | Broad | Limited by number of partitions |
| Mutation Detection Sensitivity | >1% [37] | ≥0.1% [37] |
Comparative Performance in Bacterial Detection
Recent systematic comparisons between qPCR and ddPCR reveal context-dependent performance advantages. In analyzing bacterial 16S load in lung tissue samples from control and COPD patients, ddPCR demonstrated significantly lower background noise in negative controls (0.55 ± 0.28 16S/μL) compared to qPCR (1.00 ± 0.70 16S copies) [39]. The coefficient of variation was also markedly lower for ddPCR (0.18 ± 0.14) versus qPCR (0.62 ± 0.29), indicating superior reproducibility [39].
For crystal digital PCR (a variant of dPCR), measurement variability was more than 2-fold lower (%CV = 2.3) compared to qPCR (%CV = 5.0) when quantifying human genomic DNA [36]. This precision advantage extended nearly 3-fold when cdPCR replicates were pooled (%CV = 1.5 versus qPCR's %CV = 4.4) [36].
However, in specific applications like quantifying Limosilactobacillus reuteri strains in human fecal samples, qPCR performed comparably to ddPCR with similar reproducibility and sensitivity (limit of detection approximately 10⁴ cells/g feces) while offering a wider dynamic range, lower cost, and faster processing [7]. This demonstrates that technology selection must be application-specific.
Step-by-Step qPCR Protocol for Bacterial Quantification
Stage 1: Sample Preparation and DNA Extraction
Proper sample preparation is critical for accurate quantification, as gDNA loss during extraction is particularly significant in samples with lower bacterial concentrations [35]. For fecal samples, kit-based methods like the QIAamp Fast DNA Stool Mini Kit have demonstrated excellent performance in comparative studies [7]. The inclusion of an exogenous bacterial control containing a fixed concentration of Escherichia coli prior to gDNA extraction can help normalize inherent losses associated with processing, particularly improving sensitivity at lower bacterial concentrations [35].
Protocol for Fecal Sample DNA Extraction (Kit-Based Method):
- Weigh 0.1-0.5 g of fecal sample and dilute in ice-cold PBS buffer
- Vortex vigorously and centrifuge (8000 × g for 5 min at 4°C)
- Wash cell pellets three times with ice-cold PBS buffer
- Resuspend pellets in 100 μl of lysis buffer and incubate at 37°C for 30 min
- Add 1 ml of Buffer InhibitEX to remove PCR inhibitors
- Complete DNA isolation following manufacturer's instructions
- Assess DNA purity spectrophotometrically (A260/A280 ratio of 1.7-1.9 indicates acceptable purity) [7]
For low biomass samples like lung tissue, additional precautions are necessary as bacterial 16S assays operate near their limit of detection [39]. In these cases, concentration steps and minimal carrier DNA use are recommended.
Stage 2: Primer and Probe Design for Strain-Specific Detection
For species or strain-level quantification, careful primer and probe design is essential. Strain-specific marker genes can be identified through comparative genomics using whole genome sequencing data and publicly available resources [28]. The workflow involves identifying strain-specific sequences through bioinformatic analysis, followed by empirical validation of primer specificity.
Bioinformatic Workflow for Strain-Specific Marker Identification:
- Obtain whole genome sequences of target and non-target strains
- Perform comparative genomic analysis to identify unique target sequences
- Design primers and probes targeting unique regions
- Verify specificity in silico using BLAST against database sequences
- Select candidate markers with no significant similarity to non-target organisms [28]
Table 2: Research Reagent Solutions for Bacterial qPCR
| Reagent/Category | Specific Examples | Function & Importance |
|---|---|---|
| DNA Extraction Kits | QIAamp Fast DNA Stool Mini Kit, TIANamp Bacteria DNA Kit | Standardized isolation of high-quality genomic DNA while minimizing inhibitor carryover [40] [7] |
| qPCR Master Mixes | 2× qPCR Mix (Toyobo) | Provides optimized buffer, enzymes, and dNTPs for efficient and specific amplification [40] |
| Fluorescent Probes | FAM, HEX-labeled TaqMan probes | Sequence-specific detection with reduced background noise compared to intercalating dyes [40] |
| Reference Standards | Genomic DNA from known bacterial counts | Essential for establishing standard curves for absolute quantification in qPCR [7] |
| Exogenous Controls | Fixed concentration of E. coli cells | Normalizes for gDNA loss during extraction, improving accuracy [35] |
Stage 3: qPCR Reaction Setup and Optimization
A standard 25 μL qPCR reaction should contain:
- 12.5 μL of 2× qPCR Mix
- 0.75 μL of 10 μmol/L forward and reverse primers each
- 0.5 μL of 10 μmol/L probe
- 2-5 μL of template DNA
- DNase/RNase-free deionized water to 25 μL total volume [40]
Thermal cycling conditions typically include:
- Initial denaturation: 15 min at 95°C
- 40 cycles of:
- Denaturation: 15 s at 95°C
- Annealing/Extension: 60 s at 60°C (temperature may require optimization based on primer characteristics) [40]
Each run should include a standard curve with known concentrations of target DNA, no-template controls (NTC) to detect contamination, and potentially internal positive controls to identify inhibition.
Stage 4: Data Analysis and Quantification
For absolute quantification, generate a standard curve using serial dilutions of reference DNA with known concentrations. Plot Cq values against the logarithm of the initial template concentration. The efficiency (E) of the PCR reaction can be calculated from the slope of the standard curve using the formula: E = 10^(-1/slope) - 1 [37]. Optimal reactions have efficiencies between 90-110% (slope of -3.6 to -3.1) [37].
Convert Cq values of unknown samples to absolute quantities by interpolation from the standard curve. Report results as copies/μL or convert to cells/gram based on known copy number of the target gene per bacterial cell (typically 1-10 for single-copy genes).
Application-Specific Method Selection
Food Safety Pathogen Detection
In food safety applications, ddPCR has demonstrated superior sensitivity for simultaneous detection of multiple pathogens. A recently developed quadruplex ddPCR method simultaneously detected and quantified Salmonella enterica, Staphylococcus aureus, Listeria monocytogenes, and Bacillus cereus in food samples with detection limits of 7-9 copies/20μL reaction [40]. The method showed a strong linear correlation (r²>0.999) across wide concentration ranges and provided results statistically equivalent to plate counting but with shorter turnaround time and more robust reproducibility [40].
Low Biomass and Complex Samples
For low biomass samples like lung tissue, ddPCR offers advantages in reducing background noise in negative controls [39] [41]. The partitioned nature of the reaction makes ddPCR more resilient to inhibitors present in complex sample matrices [37]. However, for fecal samples with moderate to high bacterial loads, qPCR remains a robust and cost-effective option, especially when combined with appropriate extraction methods and exogenous controls [35] [7].
Both qPCR and ddPCR offer powerful approaches for absolute bacterial quantification, with the optimal choice depending on specific application requirements. qPCR provides a robust, cost-effective solution for most routine applications, particularly when processing large sample batches or when ample target DNA is present. Its established protocols, broad dynamic range, and lower per-sample cost make it ideal for many research and diagnostic settings [37] [7].
ddPCR excels in scenarios requiring maximum precision, sensitivity, and resistance to PCR inhibitors. Applications such as low biomass sample analysis, rare variant detection, and absolute quantification without standard curves benefit most from the digital approach [39] [40] [36]. The significantly lower coefficient of variation and reduced background noise make ddPCR particularly valuable when subtle quantitative differences have biological significance.
As the field advances, incorporating absolute quantification methods like qPCR and ddPCR alongside relative abundance techniques from NGS will provide a more comprehensive understanding of microbial ecosystems across diverse research areas from clinical diagnostics to food safety and environmental monitoring.
Digital Droplet PCR (ddPCR) represents a significant advancement in nucleic acid quantification, providing absolute quantification without the need for a standard curve. This technology partitions a single PCR reaction into thousands of nanoliter-sized droplets, effectively creating individual microreactors where amplification occurs. The emergence of ddPCR has been particularly impactful in the field of microbiology, where it enables precise quantification of bacterial loads in complex samples like stool, soil, and clinical specimens. As researchers increasingly recognize the limitations of relative abundance data from next-generation sequencing, ddPCR and qPCR have become critical tools for absolute bacterial quantification, offering different strengths and limitations that must be carefully considered for specific research applications [9] [42].
Fundamental Principles of ddPCR
The core principle of ddPCR involves partitioning a sample into numerous discrete droplets, performing end-point PCR amplification on each droplet, and then analyzing the proportion of positive droplets using Poisson statistics to determine the absolute concentration of the target nucleic acid [43] [44]. This approach differs fundamentally from quantitative real-time PCR (qPCR), which relies on comparing amplification cycle thresholds (CT values) to a standard curve of known concentrations [43].
A key advantage of ddPCR lies in its partitioning strategy, which enhances sensitivity and tolerance to inhibitors. By distributing the sample across thousands of droplets, the effective concentration of the target molecule increases within positive partitions while potential PCR inhibitors are diluted, making the technique particularly suitable for complex sample matrices like fecal samples [43] [44]. The statistical foundation of ddPCR allows for precise quantification without external calibration, with accuracy directly correlating with the number of partitions analyzed [43].
Detailed ddPCR Workflow: A Step-by-Step Guide
Step 1: Reaction Mixture Preparation
The ddPCR workflow begins with preparing a reaction mixture similar to traditional PCR but optimized for droplet generation. A typical 20μL reaction contains DNA template, forward and reverse primers, fluorescent probes (typically FAM and HEX), ddPCR supermix, and nuclease-free water [45]. The ddPCR supermix contains DNA polymerase, dNTPs, and optimized buffers specifically formulated to stabilize droplets during amplification. Proper primer and probe design is critical, following similar rules as qPCR assays, with amplicon sizes typically kept under 200bp for optimal amplification efficiency [44].
Step 2: Droplet Generation
The reaction mixture is loaded into a droplet generator along with droplet generation oil. Using microfluidics technology, the instrument creates 20,000 nanoliter-sized water-in-oil droplets [46], effectively partitioning the sample into individual microreactors. This partitioning step follows a random distribution pattern, with some droplets containing target molecules, others containing no targets, and some potentially containing multiple targets. The quality of droplet generation is critical, as consistent droplet size ensures uniform amplification conditions across all partitions [43].
Step 3: PCR Amplification
After droplet generation, the emulsion is transferred to a PCR plate for thermal cycling. Standard PCR amplification is performed with 40-45 cycles to ensure all targets in positive droplets reach amplification plateau [45]. The extended cycling ensures that even droplets containing single molecules generate sufficient fluorescent signal for detection. During this phase, droplets containing the target sequence will accumulate fluorescent dye due to probe cleavage, while negative droplets remain dark. This end-point measurement approach differs fundamentally from qPCR's real-time monitoring [43].
Step 4: Droplet Reading and Analysis
The amplified droplets are transferred to a droplet reader that flows them single file past a dual-color optical detection system. The reader measures fluorescence intensity in two channels (typically FAM and HEX) for each droplet, classifying them as positive, negative, or ambiguous [46]. This binary classification forms the digital aspect of the technology. Software then applies Poisson statistics to account for droplets that may contain more than one target molecule, calculating the absolute concentration of the target in copies/μL of the original sample [43] [44].
qPCR vs. ddPCR: Performance Comparison for Bacterial Quantification
Quantitative Performance Metrics
Table 1: Comparative Performance of qPCR and ddPCR for Bacterial Quantification
| Performance Metric | qPCR | ddPCR | Experimental Context |
|---|---|---|---|
| Quantification Method | Relative to standard curve | Absolute via Poisson statistics | [43] |
| Limit of Detection (LOD) | ~103-104 cells/g feces | ~103-104 cells/g feces | L. reuteri in fecal samples [19] [20] |
| Reproducibility | Moderate, CV ~5-15% | Higher, CV ~1-5% | L. reuteri quantification [20] |
| Dynamic Range | 6-7 log10 | 4-5 log10 | Technical comparison [44] |
| Tolerance to Inhibitors | Moderate | High | Complex samples [43] [44] |
| Sample Throughput | High (2.5 hours) | Moderate (6.5 hours) | [20] |
| Cost per Reaction | $ | $$$ (~3× qPCR) | [20] |
| Standard Curve Requirement | Yes | No | [43] [44] |
Application-Specific Performance
Table 2: Method Performance in Specific Research Applications
| Application | qPCR Performance | ddPCR Performance | Reference |
|---|---|---|---|
| Cytomegalovirus (CMV) Load Testing | Higher sensitivity (LOD: 3 log10 vs 4 log10 copies/mL) | Better precision at high concentrations | [45] |
| 16S rRNA Gene Quantification in Stool | Good linearity (R2 > 0.98) with kit-based DNA extraction | Slightly better reproducibility with some extraction methods | [19] [20] |
| Absolute Quantification of Bacterial Strains | Wider dynamic range, faster, cheaper | Lower limit of quantification with some extraction methods | [19] |
| Microbiome Quantitative Profiling | Effective when combined with NGS to overcome compositionality | Limited published comparisons available | [42] |
Experimental Protocols for Bacterial Quantification
DNA Extraction Method Comparison
The choice of DNA extraction method significantly impacts quantification accuracy in both qPCR and ddPCR. A comparison of three common methods for fecal samples revealed that the phenol-chloroform (PC) method yielded the highest DNA concentration but lower purity, while kit-based methods (QIAamp Fast Stool DNA Kit [QK]) and protocol Q (PQ) provided better quality DNA with higher purity [20]. Protocol Q recovered the highest proportion of Lactobacillus reuteri cells from feces, making it particularly suitable for bacterial quantification studies [20].
Strain-Specific Primer Design
For precise quantification of specific bacterial strains, carefully designed strain-specific primers are essential. The protocol involves:
- Genome Sequence Analysis: Identify unique genomic regions specific to the target strain through comparative genomics [19]
- Primer Design: Create primers targeting strain-specific sequences with standard design parameters (amplicon size: 80-200 bp)
- Validation: Test primer specificity against related strains and optimize amplification conditions [19]
- Calibration: Establish the quantitative relationship between signal and bacterial cell number using spiked samples [19]
This approach has demonstrated detection limits of approximately 103 cells/g feces for L. reuteri strains in spiked fecal samples [19].
Essential Research Reagent Solutions
Table 3: Key Reagents and Materials for ddPCR Workflows
| Reagent/Material | Function | Application Notes |
|---|---|---|
| ddPCR Supermix | Provides enzymes, dNTPs, and optimized buffers for droplet stabilization | Critical for maintaining droplet integrity during thermal cycling |
| Droplet Generation Oil | Creates stable water-in-oil emulsion for partitioning | Formulation specific to instrument platform |
| Fluorescent Probes (FAM/HEX) | Target sequence detection in individual droplets | Enable multiplex detection in different channels |
| Primer/Probe Sets | Sequence-specific amplification | Designed per target with similar constraints as qPCR |
| DNA Extraction Kits | Nucleic acid purification from complex samples | Kit-based methods generally provide better results for fecal samples [20] |
| Quantitative Standards | Validation of assay performance | Required for qPCR, optional for ddPCR verification |
Analysis and Data Interpretation
Data analysis in ddPCR involves several critical steps. The QuantaSoft software (Bio-Rad) or equivalent platform analyzes the fluorescence intensity of each droplet, creating a 2D scatterplot with FAM intensity on one axis and HEX intensity on the other [46]. Droplets are clustered into populations (double-negative, FAM-positive, HEX-positive, and double-positive) based on their fluorescence signatures [46].
For absolute quantification, the software applies the Poisson distribution to calculate the initial template concentration using the formula: λ = -ln(1 - p) where λ represents the average number of target molecules per partition and p is the fraction of positive partitions [43]. This calculation accounts for the statistical probability that some partitions may contain more than one target molecule, providing the absolute concentration in copies/μL without reference to standard curves [43] [44].
The ddPCR workflow offers a robust method for absolute quantification of bacterial targets in complex research samples, with particular advantages in precision, tolerance to inhibitors, and elimination of standard curves. While qPCR maintains advantages in throughput, cost, and dynamic range for many applications, ddPCR provides superior performance for specific use cases requiring high precision or dealing with challenging sample matrices. The choice between these technologies should be guided by specific research needs, considering factors such as required sensitivity, sample type, throughput requirements, and available resources. As microbial quantification continues to play a critical role in understanding microbiome dynamics and bacterial pathogenesis, both ddPCR and qPCR will remain essential tools in the researcher's toolkit.
Accurately quantifying probiotic strains from complex human samples, such as feces, is a critical yet challenging requirement in clinical trials. This process is essential for verifying participant compliance, correlating bacterial levels with health outcomes, and validating the intervention's integrity. The choice of quantification method can significantly impact data reliability and conclusions. While next-generation sequencing (NGS) offers broad community profiling, its data is semi-quantitative and suffers from high detection limits [7]. For absolute quantification at the strain level, quantitative PCR (qPCR) and droplet digital PCR (ddPCR) have emerged as powerful, specific, and sensitive alternatives to traditional culture-based methods [47] [48]. This guide objectively compares the performance of qPCR and ddPCR within the context of probiotic clinical trials, providing researchers with the experimental data and protocols needed to inform their methodological choices.
Methodological Comparison: qPCR vs. ddPCR
Core Principles and Workflows
While both qPCR and ddPCR are based on the polymerase chain reaction, their core technologies and data acquisition methods differ fundamentally.
- qPCR (Quantitative PCR): This method quantifies the target DNA by measuring the fluorescence signal accumulated during each PCR cycle. The cycle at which the fluorescence crosses a predetermined threshold (Ct value) is used, in conjunction with a standard curve of known DNA concentrations, to calculate the starting quantity of the target gene in the sample [7] [49].
- ddPCR (Droplet Digital PCR): This method partitions a single PCR reaction into thousands of nanoliter-sized droplets. PCR amplification occurs within each droplet independently. After amplification, the instrument counts each droplet as positive or negative for the target, applying Poisson statistics to provide an absolute count of target DNA copies without the need for a standard curve [50] [51].
The typical workflow for quantifying probiotics in fecal samples, from collection to data analysis, is outlined below.
Performance Metrics and Experimental Data
Direct comparisons from recent studies reveal a nuanced performance profile for qPCR and ddPCR. The optimal choice often depends on the specific requirements of the study, such as the need for maximum sensitivity versus cost-effectiveness.
Table 1: Comparative Performance of qPCR and ddPCR for Probiotic Quantification
| Performance Metric | qPCR | ddPCR | Supporting Experimental Evidence |
|---|---|---|---|
| Limit of Detection (LOD) | ~103 to 104 cells/g feces [7] | 10-100 fold lower than qPCR [50] | Detection of Lactobacillus reuteri spiked in human feces [7]. |
| Quantification of Viable Cells | Requires viability dye (e.g., PMA) [51] | Requires viability dye (e.g., PMA); better precision for low counts [51] | PMA-ddPCR quantified viable L. rhamnosus & L. paracasei in piglet feces with 1.76 log10 better LOQ [51]. |
| Reproducibility | Good to high (comparable to ddPCR with optimized DNA extraction) [7] [20] | Slightly better reproducibility, especially with inhibitor-prone DNA [7] [20] | Comparison of three DNA extraction methods for quantifying L. reuteri [20]. |
| Dynamic Range | Wider dynamic range [7] | Sufficient for most probiotic applications | Systematic evaluation for L. reuteri strain quantification [7]. |
| Susceptibility to PCR Inhibitors | More susceptible to inhibition, affecting PCR efficiency [50] | More tolerant of inhibitors due to endpoint detection [50] | Analysis in complex fecal matrices [50]. |
| Cost per Reaction | Lower [20] | ~3x higher than qPCR [20] | Cost analysis for L. reuteri detection [20]. |
| Time to Results | Faster (~2.5 hours) [20] | More time-consuming (~6.5 hours) [20] | Hands-on and instrument time comparison [20]. |
| Need for Standard Curve | Required, introduces potential variability [7] | Not required, absolute counting [50] | Fundamental principle of ddPCR technology [50]. |
Experimental Protocols for Clinical Trial Samples
Protocol 1: Strain-Specific qPCR Assay
This protocol, adapted from a 2024 Microbiome study, details the steps for designing and implementing a strain-specific qPCR assay for absolute quantification [7].
Strain-Specific Primer Design:
- Input: Obtain complete genome sequences of the target probiotic strain and closely related strains.
- Analysis: Use comparative genomics software (e.g., BLAST, Roary) to identify unique genomic regions or genes specific to the target strain.
- Output: Design primers that amplify a 80-200 bp unique fragment. Verify in silico specificity against public databases.
DNA Extraction from Fecal Samples:
- Sample Preparation: Homogenize ~200 mg of fecal sample in a suitable buffer (e.g., PBS).
- Cell Lysis: Use a combination of mechanical lysis (bead beating) and enzymatic lysis (lysozyme, proteinase K) to ensure robust breakage of Gram-positive bacterial cells.
- DNA Purification: Use a commercial kit-based DNA isolation method (e.g., QIAamp Fast DNA Stool Mini Kit or MagMax Total Nucleic Acid Isolation kit) for consistent yield and purity, effectively removing PCR inhibitors [7] [50]. Validate the method for your specific sample matrix.
qPCR Setup and Execution:
- Reaction Mix: Prepare a 20 μL reaction containing 1x master mix (e.g., SYBR Green or TaqMan), forward and reverse primers (optimized concentrations, typically 200-600 nM), and template DNA (2-5 μL).
- Standard Curve: Include a standard curve in every run using a serial dilution of known target DNA (e.g., gBlock gene fragment or quantified genomic DNA from the pure target strain).
- Cycling Conditions: Use a two-step cycling protocol: initial denaturation (95°C for 2 min), followed by 40 cycles of denaturation (95°C for 15 sec) and annealing/extension (60-62°C for 1 min). Perform on a real-time PCR instrument.
Data Analysis:
- Calculate the quantity of the target strain in each sample by interpolating the Ct values against the standard curve.
- Normalize the results to the mass of the original fecal sample (e.g., cells or gene copies per gram of feces).
Protocol 2: Viable Cell Quantification with PMA-ddPCR
This protocol combines the viability dye propidium monoazide (PMA) with ddPCR to selectively quantify only live probiotic cells with intact membranes, a crucial metric for probiotic efficacy [51].
PMA Treatment of Fecal Samples:
- PMA Stock: Prepare a 1-2 mM stock solution of PMA in water, protected from light.
- Treatment: Add PMA to the homogenized fecal sample (or the cell pellet post-washing) to a final concentration of 50-100 μM. Incubate in the dark for 10-15 minutes with occasional mixing.
- Photoactivation: Place the sample on ice and expose it to bright light (e.g., a 500-W halogen lamp) for 15-20 minutes. This cross-links the PMA, which has penetrated dead cells with compromised membranes, rendering their DNA unamplifiable.
DNA Extraction:
- Proceed with DNA extraction as described in the qPCR protocol (Section 3.1, Step 2).
ddPCR Setup and Execution:
- Reaction Partitioning: Prepare a 20-40 μL PCR reaction mix similar to qPCR. Load it into a droplet generator cartridge along with droplet generation oil. The instrument will create thousands of droplets.
- PCR Amplification: Transfer the emulsified sample to a 96-well plate and run endpoint PCR on a thermal cycler.
- Droplet Reading: Place the plate in a droplet reader, which streams the droplets one-by-one past a fluorescence detector to classify them as positive or negative.
Data Analysis:
- The instrument's software uses the ratio of positive to negative droplets and applies Poisson statistics to calculate the absolute concentration of the target DNA in copies/μL of the original reaction.
- Convert this value to viable cells per gram of feces.
Table 2: Key Research Reagent Solutions for Probiotic Quantification
| Reagent/Material | Function | Example Products & Notes |
|---|---|---|
| DNA Extraction Kit | Isolates high-purity, inhibitor-free genomic DNA from complex fecal matrices. | QIAamp Fast DNA Stool Mini Kit [7], MagMax Total Nucleic Acid Isolation Kit [50]. Kit-based methods are preferred for consistency. |
| Strain-Specific Primers/Probes | Enables specific detection and quantification of the target probiotic strain amidst a background of thousands of other microbes. | Designed in-house from unique genomic regions [7]; TaqMan probes offer higher specificity [50] [49]. |
| qPCR/ddPCR Master Mix | Provides the enzymes, buffers, and nucleotides necessary for the PCR reaction. Fluorescent chemistry is required for detection. | SYBR Green (for DNA binding) or TaqMan probe-based master mixes [50]. The choice depends on required specificity and budget. |
| Propidium Monoazide (PMA) | Viability dye that penetrates only dead cells with damaged membranes, inhibiting their DNA amplification. Essential for distinguishing live vs. dead probiotics. | PMAdye (Biotium). Requires optimization for each strain and sample matrix [51]. |
| Droplet Generation Oil & Cartridges | Consumables specific to ddPCR systems that enable the partitioning of the PCR reaction into nanoliter droplets. | ddPCR Droplet Generation Oil for Probes (Bio-Rad). System-specific consumables are a key cost factor. |
The choice between qPCR and ddPCR is not one of absolute superiority but of aligning the technology with the study's primary goals and constraints. The following decision pathway can help researchers select the most appropriate method.
Conclusion: For routine, high-throughput quantification of probiotics at moderate to high abundance where cost and speed are primary concerns, qPCR remains a robust and accessible choice. Its performance is highly reliable when paired with optimized DNA extraction and strain-specific primers [7] [49]. Conversely, for studies demanding the highest possible sensitivity, such as detecting low-level colonization, working with inhibitors, or requiring absolute quantification without a standard curve, ddPCR offers a distinct advantage, albeit at a higher cost and with longer processing times [50] [51]. Ultimately, both methods provide vast improvements over traditional techniques, enabling precise, strain-specific insights into probiotic dynamics in clinical trials.
The accurate detection and quantification of bacterial pathobionts in complex clinical matrices represents a significant challenge in diagnostic microbiology and therapeutic drug development. Pathobionts, microorganisms that can exist as both commensals and pathogens, require precise monitoring as their abundance fluctuations often correlate with disease states and treatment efficacy. In the study of chronic periodontitis, for instance, specific bacterial consortia rather than single pathogens drive disease pathology, necessitating quantitative approaches that can distinguish subtle microbial shifts at site-specific levels [52]. The transition from relative to absolute quantification marks a paradigm shift in microbial analysis, correcting inherent misinterpretations that arise from compositional data alone. Studies demonstrate that absolute quantification can reveal significant microbial changes in response to antibiotic treatment that remain undetected by standard relative abundance analysis [53].
Within this landscape, quantitative PCR (qPCR) and droplet digital PCR (ddPCR) have emerged as leading technologies for absolute bacterial quantification, each offering distinct advantages and limitations for pathobiont detection in clinically relevant samples. This guide provides an objective comparison of their performance characteristics, supported by experimental data from clinical applications, to inform researchers and drug development professionals in selecting the appropriate methodology for their specific diagnostic challenges.
Technology Comparison: qPCR versus ddPCR for Pathobiont Detection
Performance Characteristics in Clinical Matrices
Table 1: Comparative Performance of qPCR and ddPCR for Bacterial Quantification in Clinical Samples
| Performance Parameter | qPCR | ddPCR | Clinical/Experimental Context |
|---|---|---|---|
| Limit of Detection (LOD) | ~103-104 cells/g feces [19] | 5 copies/μL (equivalent to 1 parasite/mL blood) [54] | Detection of Trypanosoma cruzi in blood samples [54]; Limosilactobacillus reuteri in fecal samples [19] |
| Precision/Reproducibility | Good reproducibility with kit-based DNA isolation [19] | Slightly better reproducibility than qPCR [19] [20] | Quantification of Lactobacillus reuteri in human feces [20] |
| Tolerance to PCR Inhibitors | Susceptible to inhibitors common in clinical samples; requires dilution [16] [55] | Higher tolerance due to sample partitioning [16] [55] | Analysis of low-abundance targets in complex samples with chemical/protein contaminants [16] |
| Dynamic Range | Wider dynamic range [19] | Limited dynamic range [19] | Bacterial strain quantification in fecal samples [19] |
| Quantification Method | Relative to standard curve [55] | Absolute counting without standard curve [55] | Environmental and engineered systems; applicable to clinical samples [55] |
| Throughput Time | ~2.5 hours for complete run [20] | ~6.5 hours for complete run [20] | Processing of fecal samples for bacterial quantification [20] |
| Cost Per Reaction | Lower cost [20] | Approximately 3 times higher than qPCR [20] | Cost comparison for Lactobacillus reuteri detection [20] |
| Multiplexing Capability | Well-established for multiple targets [52] | Emerging with advanced strategies (e.g., ratio-based probe-mixing) [56] | Simultaneous detection of four sulfonamide resistance genes [56] |
Analytical Sensitivity in Disease-Specific Contexts
In chronic periodontitis research, qPCR has demonstrated strong clinical utility for detecting pathobiont consortia. Multivariate predictive models incorporating qPCR data for seven periodontal pathobionts achieved areas under the curve (AUC) ≥0.760 with sensitivity and specificity ≥75.0% in distinguishing periodontal sites from control sites within the same patients. Notably, bacterial clusters including Prevotella intermedia, Tannerella forsythia, and Fusobacterium nucleatum showed significant predictive value for disease severity [52]. The analytical performance of qPCR in this context confirms its reliability for structured microbial community analysis in well-characterized clinical specimens with moderate inhibitor content.
For low-abundance targets or samples with significant PCR inhibitors, ddPCR exhibits superior performance characteristics. A direct comparison study demonstrated that for sample/target combinations with low nucleic acid levels (Cq ≥ 29) and/or variable amounts of chemical and protein contaminants, ddPCR technology produced more precise, reproducible, and statistically significant results [16]. This enhanced performance is attributed to the partitioning of PCR reactions into thousands of nanoliter-sized droplets, which effectively concentrates the target and dilutes inhibitors in positive droplets [55]. When detecting Trypanosoma cruzi in blood samples, a ddPCR assay achieved a limit of detection of 5 copies/μL (equivalent to 1 parasite/mL) with 100% clinical sensitivity and specificity, performing comparably to well-optimized qPCR assays [54].
Experimental Protocols for Pathobiont Detection
Sample Preparation and DNA Extraction
Clinical Sample Collection and Storage:
- For subgingival plaque sampling in periodontitis studies, samples are collected from both control sites (probing pocket depth and clinical attachment loss <4 mm) and periodontal sites (>4 mm) using standardized curettes [52].
- Stool samples for gut pathobiont analysis should be homogenized, and aliquots stored either at room temperature in DNA stabilization solution or frozen at -20°C to -80°C without additives [53].
- For blood samples, DNA extraction should be performed using kits optimized for pathogen detection in blood, with careful consideration to inhibit human DNA amplification [54].
DNA Extraction Method Selection:
- Kit-based methods (e.g., QIAamp Fast Stool DNA Kit) generally provide the optimal balance of DNA quantity and quality for both qPCR and ddPCR [20].
- Phenol-chloroform extraction may yield higher DNA concentrations but with lower purity, potentially affecting downstream applications [20].
- Protocol Q (a custom laboratory method) has demonstrated superior recovery of specific bacterial cells from feces, though with variable performance across sample types [20].
- DNA concentration should be measured using fluorometric methods (e.g., Qubit with dsDNA HS assay) rather than spectrophotometry for more accurate quantification of amplifiable DNA [57].
Primer and Probe Design Considerations
For Strain-Specific Detection:
- Design primers from genome sequences using bioinformatic tools to identify unique target regions [19].
- Validate specificity using in silico analysis against databases and empirical testing with closely related strains [19].
- For Limosilactobacillus reuteri strain DSM 17938, well-validated primers can achieve a limit of detection of approximately 104 cells/g feces with both qPCR and ddPCR [19].
For Multiplex Detection:
- When designing multiplex assays for ddPCR, carefully optimize primer and probe concentrations to maximize separation between fluorescence amplitudes [56].
- For quadruple detection using a two-channel system, employ a ratio-based probe-mixing strategy with significant disparities in probe concentrations for targets sharing the same fluorophore [56].
- Systematically optimize critical parameters including annealing temperature through gradient PCR followed by experimental validation [56] [55].
qPCR Protocol for Periodontal Pathobionts
Table 2: Experimental Protocol for qPCR-Based Detection of Periodontal Pathobionts
| Protocol Step | Specifications | Notes/Considerations |
|---|---|---|
| Target Selection | Aggregatibacter actinomycetemcomitans, Porphyromonas gingivalis, Tannerella forsythia, Treponema denticola, Prevotella intermedia, Fusobacterium nucleatum, Parvimonas micra [52] | Select targets based on clinical relevance and evidence for consortium-based pathogenesis |
| Reaction Setup | 10 μL PowerUp SYBR Green Master Mix, 0.8 μL of each primer solution (10 μm), 7.4 μL nuclease-free water, 1 μL template DNA [57] | TaqMan probes may provide enhanced specificity for complex clinical samples |
| Thermal Cycling | Initial denaturation: 95°C for 180 s; 40 cycles of: 95°C for 10 s, 60°C for 30 s, 72°C for 30 s [57] | Annealing temperature may require optimization for specific primer sets |
| Standard Curve | Essential for absolute quantification; prepare using serial dilutions of target DNA with known concentration [55] | Use linearized plasmid DNA or genomic DNA from cultured reference strains |
| Data Analysis | Quantification cycle (Cq) values compared to standard curve; conversion to absolute copies/sample [52] | Normalize to sample mass or volume; multivariate models can enhance clinical predictive value |
ddPCR Protocol for Low-Abundance Targets
Table 3: Experimental Protocol for ddPCR-Based Detection of Low-Abundance Targets
| Protocol Step | Specifications | Notes/Considerations |
|---|---|---|
| Reaction Setup | EvaGreen: 11 μL QX200 ddPCR EvaGreen Supermix, 0.25 μM primers, 2 μL DNA, nuclease-free water to 22 μL [55] | TaqMan chemistry may provide better specificity for complex clinical samples |
| Droplet Generation | 20 μL reaction mix + 70 μL droplet generation oil; use 8-channel droplet generation cartridge [55] | Ensure proper droplet formation by visual inspection; avoid bubble formation |
| Thermal Cycling | Optimized annealing temperature determined experimentally; typically 55-60°C range [55] | Standard ramp rate (2°C/s) is generally acceptable |
| Droplet Reading | Use QX200 Droplet Reader; set threshold between positive and negative populations [56] | Manual threshold adjustment may be necessary for samples with intermediate amplification |
| Data Analysis | Absolute concentration (copies/μL) calculated by Poisson statistics [55] | Results are independent of amplification efficiency; no standard curve required |
Research Reagent Solutions for Pathobiont Detection
Table 4: Essential Research Reagents for qPCR/ddPCR-Based Pathobiont Detection
| Reagent Category | Specific Examples | Function/Application |
|---|---|---|
| DNA Extraction Kits | QIAamp Fast Stool DNA Kit [20], QIAamp Mini stool DNA extraction kit [57], DNeasy PowerSoil Pro Kit [55] | Efficient lysis and purification of microbial DNA from complex clinical matrices |
| PCR Master Mixes | PowerUp SYBR Green Master Mix [57], QX200 ddPCR EvaGreen Supermix [55], ddPCR Supermix for Probes [55] | Provides optimized reaction components including polymerase, dNTPs, and buffer |
| Quantification Standards | Linearized plasmid DNA with target sequence [19], genomic DNA from reference strains [52], synthetic DNA fragments [16] | Enables absolute quantification and standard curve generation for qPCR |
| Inhibition Resistance Additives | Bovine serum albumin (BSA) [16], skim milk [16] | Enhances amplification efficiency in samples with PCR inhibitors |
| Positive Controls | Cultured reference strains of target pathobionts [52], synthetic oligonucleotides with target sequences [56] | Validates assay performance and provides quality control |
| Droplet Generation Oil | QX200 Droplet Generation Oil [55] | Specific oil formulation required for stable water-in-oil emulsion in ddPCR |
Workflow Visualization
Pathobiont Detection Workflow: qPCR vs. ddPCR
Decision Pathway: Technology Selection Guide
The selection between qPCR and ddPCR for pathobiont detection in complex clinical matrices depends primarily on target abundance, sample complexity, and research objectives. qPCR remains the workhorse technology for routine quantification of moderate- to high-abundance pathobionts, offering established multiplexing capabilities, faster processing times, and lower operational costs. Its reliance on standard curves and susceptibility to PCR inhibitors represent significant limitations in challenging clinical applications.
ddPCR demonstrates particular advantage for low-abundance targets, inhibitor-rich samples, and applications requiring absolute quantification without reference standards. While more costly and time-consuming, its precision at low target concentrations and resistance to amplification inefficiencies make it invaluable for detecting rare pathogens or subtle treatment effects. The emerging capability for highly multiplexed detection further expands its utility in comprehensive pathobiont profiling.
For researchers and drug development professionals, the optimal approach may involve complementary use of both technologies—employing qPCR for initial screening and ddPCR for confirmation of critical low-abundance targets. As both technologies continue to evolve, their implementation in clinical microbiology will increasingly enable precise, absolute quantification of pathobionts, advancing both diagnostic accuracy and therapeutic development.
The widespread occurrence of clinically relevant antibiotic resistance genes (ARGs) in environmental samples poses a significant threat to global public health. Monitoring these genes is essential for understanding their dissemination dynamics and developing mitigation strategies. Within this context, quantitative polymerase chain reaction (qPCR) and droplet digital PCR (ddPCR) have emerged as two principal technologies for the absolute quantification of ARGs in environmental matrices. These methods provide critical advantages over next-generation sequencing (NGS) approaches, which, while offering broader coverage of ARG targets, are primarily semi-quantitative and suffer from higher detection limits [7] [58]. The selection between qPCR and ddPCR represents a critical methodological decision that influences the sensitivity, accuracy, and scope of environmental ARG monitoring programs. This guide provides an objective comparison of these technologies, supported by experimental data, to inform researchers and scientists in designing their environmental surveillance studies.
Technical Comparison: qPCR versus ddPCR
Fundamental Technological Differences
qPCR and ddPCR share the fundamental principle of amplifying specific nucleic acid sequences, but they diverge significantly in their methodology for quantification:
qPCR measures fluorescence accumulation during the exponential phase of amplification and relies on standard curves to determine the initial template concentration [59] [60]. The output is expressed as cycle threshold (Ct) values, which are converted to concentration values through comparison with known standards [59].
ddPCR employs a sample partitioning approach, where each reaction is divided into thousands of nanoliter-sized droplets. Amplification occurs within each droplet, and the technique uses Poisson statistics to count positive and negative droplets, enabling absolute quantification without standard curves [56] [59].
Table 1: Core Technological Characteristics
| Characteristic | qPCR | ddPCR |
|---|---|---|
| Quantification Method | Relative (requires standard curve) | Absolute (no standard curve) |
| Sample Processing | Bulk reaction | Partitioned into thousands of droplets |
| Signal Detection | Real-time during exponential phase | End-point detection |
| Data Output | Cycle threshold (Ct) | Copies per microliter |
| Impact of PCR Efficiency | Highly sensitive to efficiency variations | Tolerant to efficiency variations |
Performance Metrics for Environmental ARG Detection
Environmental samples present unique challenges for ARG detection, including low target concentrations and the presence of PCR inhibitors. The performance of qPCR and ddPCR under these conditions has been systematically evaluated across multiple studies:
Sensitivity and Limit of Detection: ddPCR demonstrates superior sensitivity for low-abundance targets. A study quantifying sulfonamide resistance genes (sul1 and qnrB) in soils and organic residues reported that ddPCR could accurately quantify as low as 1.6 copy numbers, whereas qPCR's lower quantification limit was 15 copies [61]. This enhanced sensitivity makes ddPCR particularly valuable for monitoring rare ARGs in environmental samples where low concentrations are common.
Tolerance to PCR Inhibitors: Environmental samples often contain substances that inhibit PCR amplification. ddPCR shows markedly greater tolerance to these inhibitors due to sample partitioning, which effectively reduces the inhibitor concentration in individual reaction chambers [61] [37]. Research has demonstrated that ddPCR maintains accurate quantification even with high amounts of environmental DNA templates (70 ng per reaction) without requiring additional PCR facilitators [61].
Precision and Reproducibility: ddPCR typically exhibits lower coefficients of variation compared to qPCR, indicating superior reproducibility. A comparison of bacterial 16S rRNA quantification in lung tissue samples (relevant to low-biomass environmental samples) found significantly lower coefficients of variation for ddPCR (0.18 ± 0.14) versus qPCR (0.62 ± 0.29) [62]. This precision is particularly valuable for detecting subtle temporal or spatial changes in ARG abundance in environmental monitoring programs.
Table 2: Performance Comparison for Environmental ARG Detection
| Performance Metric | qPCR | ddPCR | Experimental Context |
|---|---|---|---|
| Limit of Detection | 15 copies (qnrB) [61] | 1.6 copies (sul1) [61] | Soil and organic residues |
| Detection Range | Broad dynamic range [7] [60] | Requires dilution for high concentrations [63] | General application |
| Inhibitor Tolerance | Susceptible to environmental inhibitors [7] [59] | High tolerance due to partitioning [61] [37] | Complex matrices (soil, wastewater) |
| Precision (Coefficient of Variation) | 0.62 ± 0.29 [62] | 0.18 ± 0.14 [62] | Bacterial 16S quantification |
| Multiplexing Capability | Established multiplex protocols [59] | Emerging multiplex approaches [56] | Multiple ARG targets |
Experimental Applications in Environmental Monitoring
Case Study 1: Quadruple ddPCR for Sulfonamide Resistance Genes
A recent study developed a highly sensitive quadruple ddPCR method for simultaneous quantification of four sulfonamide resistance genes (sul1, sul2, sul3, and sul4) across diverse environmental matrices [56]. This approach exemplifies the advancing capabilities of ddPCR for comprehensive ARG monitoring.
Experimental Protocol:
- Primer and Probe Design: Meticulous design of specific primers and probes for all four sul genes, with rigorous validation of specificity.
- ddPCR Optimization: Systematic optimization of critical parameters including annealing temperature, primer concentration, and probe concentration.
- Sample Processing: Application to 115 diverse environmental samples including human feces, animal-derived foods, sewage, and surface water.
- Detection and Quantification: Using a two-channel ddPCR system (Bio-Rad, QX200) with a ratio-based probe-mixing strategy to distinguish multiple targets.
Key Findings:
- The method demonstrated excellent sensitivity with limits of detection (LOD) ranging from 3.98 to 6.16 copies/reaction across the four sul genes.
- High reproducibility was achieved with coefficients of variation <25%.
- Application to environmental samples revealed high positive rates: 100% for sul1, 99.13% for sul2, 93.91% for sul3, and 68.70% for sul4, with concentrations ranging from non-detection to 2.14 × 10⁹ copies/g [56].
This case study highlights ddPCR's capability for sensitive, multiplex detection of ARGs across diverse environmental compartments, providing comprehensive resistance profiling in a single assay.
Case Study 2: Comparative Performance in Complex Matrices
A direct comparison of qPCR and ddPCR for quantifying antibiotic resistance genes in soils and organic residues provides valuable insights into their relative performance in complex environmental samples [61].
Experimental Protocol:
- Sample Types: Bacterial genomic DNA and metagenomic DNA extracted from soil and organic residue samples.
- Target Genes: sul1 and qnrB genes encoding for resistance to sulfonamides and quinolones.
- Quantification Methods: Parallel analysis using both qPCR and ddPCR with identical primer sets.
- Inhibition Assessment: Evaluation of performance in the presence of background DNA and PCR inhibitors.
Key Findings:
- In the presence of background DNA or inhibitors, qPCR showed high loss of sensitivity and overestimation of target sequences, while ddPCR maintained accurate quantification.
- Sensitivity to detect copy number variation was tenfold higher in ddPCR than in qPCR.
- When using high amounts of environmental DNA templates (70 ng per reaction), ddPCR allowed accurate quantification without adding PCR facilitator, whereas qPCR required optimization to overcome inhibition [61].
This comparative study demonstrates ddPCR's superior performance in complex environmental matrices where inhibitor presence is expected, reducing false negatives and improving quantification accuracy.
Method Selection Guide
Decision Framework for Environmental Applications
Choosing between qPCR and ddPCR for environmental ARG monitoring depends on multiple factors related to study objectives, sample characteristics, and resource constraints:
Select ddPCR when:
- Targeting low-abundance ARGs in environmental matrices (near detection limits) [61]
- Working with inhibitor-rich samples (wastewater, sediment, soil) [61] [60]
- Absolute quantification without standards is required [56] [59]
- High precision is critical for detecting subtle changes [62]
- Studying copy number variations in complex communities [61]
Select qPCR when:
Implementation Considerations
Throughput and Scalability: qPCR maintains advantages in throughput with 384-well formats compared to ddPCR's maximum 96-well capacity [60]. This makes qPCR more suitable for large-scale screening studies where sample numbers are high but target abundance is sufficient for reliable detection.
Cost Analysis: While qPCR typically has lower per-reaction costs and reagent requirements, ddPCR can be more cost-effective for low-abundance targets by reducing the need for replicate reactions and standard curve preparations [7] [60]. The initial instrument investment is generally higher for ddPCR systems.
Multiplexing Capabilities: Both technologies support multiplexing, though qPCR has more established protocols [59]. Recent advances in ddPCR, such as the quadruple detection method for sul genes, demonstrate expanding multiplexing potential through ratio-based probe strategies [56].
Essential Research Reagent Solutions
Successful implementation of ARG monitoring programs requires careful selection of reagents and materials optimized for environmental samples.
Table 3: Key Research Reagent Solutions for Environmental ARG Detection
| Reagent/Material | Function | Application Notes |
|---|---|---|
| DNA Extraction Kits (Qiagen DNeasy, QIAamp Fast DNA Stool Mini Kit) | Isolation of high-quality DNA from complex matrices | Kit-based methods show better performance with fecal and environmental samples compared to phenol-chloroform protocols [7] |
| PCR Master Mixes | Provides enzymes, dNTPs, buffers for amplification | inhibitor-resistant formulations recommended for environmental samples |
| Sequence-Specific Primers/Probes | Target-specific amplification | Require meticulous validation for environmental applications; dual-labeled probes preferred for ddPCR [56] |
| Droplet Generation Oil (Bio-Rad QX200) | Creates stable water-in-oil emulsions | Critical for ddPCR partition integrity; lot-to-lot consistency important |
| Digital PCR Plates/Cartridges | Housing for partitioned reactions | Platform-specific consumables with significant cost implications |
| Quantification Standards | Standard curve generation for qPCR | Should be matrix-matched when possible to account for inhibition effects |
Both qPCR and ddPCR offer powerful capabilities for environmental monitoring of antibiotic resistance genes, with complementary strengths that make them suitable for different application scenarios. ddPCR demonstrates superior performance for low-abundance targets in inhibitor-rich environmental matrices, while qPCR remains a robust, cost-effective solution for higher abundance targets and high-throughput screening. The selection between these technologies should be guided by specific study objectives, target abundance, sample type, and resource constraints. As ARG monitoring programs expand to address the growing challenge of antibiotic resistance, both technologies will play crucial roles in providing the quantitative data necessary for risk assessment and intervention strategies.
Optimizing Assay Performance and Overcoming Technical Challenges
Addressing PCR Inhibition in Complex Samples like Feces and Plaque
The accurate quantification of bacterial populations in complex biological samples like feces and dental plaque is foundational to advancing research in gut microbiology, disease diagnostics, and therapeutic development. However, these samples are notoriously challenging for molecular analysis due to the presence of various substances that inhibit the polymerase chain reaction (PCR), leading to substantial quantification inaccuracies. Inhibition arises from molecules that interfere with the DNA polymerase or the fluorescence detection systems essential for quantitative PCR (qPCR) and droplet digital PCR (ddPCR) [64]. Common inhibitors found in feces and similar matrices include complex polysaccharides from dietary plant material, bile salts, hemoglobin and its breakdown products, and humic substances [64] [65] [66]. The core challenge for researchers is to select and optimize methodologies that can overcome this inhibition to generate reliable, reproducible data for absolute bacterial quantification. This guide objectively compares the performance of qPCR and ddPCR in this context, supported by experimental data, to inform strategic decisions in research and development.
Mechanisms of PCR Inhibition
PCR inhibition occurs through several distinct molecular mechanisms, which can be broadly categorized by their point of interference in the analytical process. A deeper understanding of these mechanisms is crucial for selecting the right countermeasures.
- Inhibition of DNA Polymerase Activity: Many inhibitors directly affect the DNA polymerase enzyme. Humic acids, for instance, can bind to the enzyme's active site, reducing its activity and processivity. Similarly, hemoglobin and immunoglobulin G (IgG) have been identified as potent inhibitors of polymerase function [64].
- Interaction with Nucleic Acids: Some inhibitors, such as complex polysaccharides and heparin, interact directly with the nucleic acids themselves. They can coat the DNA, preventing primer annealing or the polymerase from accessing the template, thereby halting the amplification process [64] [65].
- Fluorescence Quenching: An often-overlooked mechanism is the quenching of the fluorescent signals used for detection in qPCR and ddPCR. Certain inhibitory substances can interfere with the fluorophores attached to probes or intercalating dyes through collisional quenching or by forming non-fluorescent complexes, leading to an underestimation of the target concentration [64].
The following diagram illustrates how these different inhibitors interfere with the key steps of the PCR process.
qPCR vs. ddPCR: A Technical Comparison for Inhibited Samples
The fundamental difference between qPCR and ddPCR lies in their approach to quantification. qPCR relies on monitoring amplification in real-time and comparing the results to a standard curve, making it sensitive to factors that affect amplification efficiency. In contrast, ddPCR partitions a sample into thousands of nanodroplets, performs end-point PCR, and uses Poisson statistics to provide an absolute count of target molecules without the need for a standard curve [37] [67]. This core difference underpins their relative performance in the presence of inhibitors.
Tolerance to PCR Inhibitors
A key advantage of ddPCR is its superior tolerance to PCR inhibitors commonly found in complex samples. The partitioning step in ddPCR effectively dilutes inhibitor molecules across thousands of individual reactions. This means that any single droplet is less likely to contain a concentration of inhibitor sufficient to halt amplification. Even if amplification efficiency is reduced in some droplets, the end-point, binary (positive/negative) reading allows for accurate quantification, as delayed amplification still results in a positive signal [67] [64] [5]. Studies have consistently shown that ddPCR can tolerate inhibitor concentrations that are one to two orders of magnitude higher than those tolerated by qPCR [67]. For example, in the quantification of Xanthomonas citri, the ddPCR assay demonstrated robust performance despite the presence of inhibitors, whereas qPCR was significantly affected [5].
Quantitative Data from Comparative Studies
The table below summarizes key performance metrics for qPCR and ddPCR from peer-reviewed studies involving complex sample matrices.
Table 1: Performance Comparison of qPCR and ddPCR in Complex Samples
| Performance Metric | qPCR Performance | ddPCR Performance | Experimental Context (Sample Type) |
|---|---|---|---|
| Accuracy & Precision | Prone to over/under-estimation due to efficiency shifts [64]. Lower precision, especially at low target concentrations [5]. | Closer to expected values; higher precision and repeatability [13] [5]. Smaller coefficients of variation [13]. | Mock microbial communities & environmental samples [13]. |
| Sensitivity (LOD) | Suitable for higher abundance targets (e.g., ~104 cells/g feces) [7]. | Potential for lower LOD; can detect rare targets (<1% mutation rate) [37] [60]. | Bacterial quantification in spiked fecal samples [7]. |
| Dynamic Range | Broad dynamic range, suitable for varying target concentrations [37] [60]. | Upper quantification limit is lower than qPCR, may require sample dilution [67]. | Pathogen detection in wastewater and environmental waters [67]. |
| Inhibitor Tolerance | Highly susceptible; requires extensive DNA purification or dilution [64] [7]. | High tolerance; partitioning reduces inhibitor effects [37] [67] [64]. | Detection of Xanthomonas citri in plant samples [5]. |
Strategies to Overcome PCR Inhibition
Sample Preparation and DNA Extraction
The choice of DNA extraction method is a critical first step in managing PCR inhibition. Kit-based methods, such as those using the QIAamp Fast DNA Stool Mini Kit, have been successfully used and optimized for fecal samples, offering a balance between DNA yield and purity [7]. Phenol-chloroform-based extraction is another established, though more labor-intensive, method [7]. The primary goal of these protocols is to maximize the removal of inhibitory substances while minimizing the loss of target DNA, which is a common trade-off [64].
PCR Facilitation with Additives
The use of chemical additives in the PCR master mix is a straightforward strategy to enhance amplification from inhibited samples. Spermidine, a polyamine, has been demonstrated to act as a powerful PCR facilitator in stool samples. Research shows that the addition of 1 mM spermidine to the PCR mixture can increase the amplification efficiency (AE) by a factor of up to 1680% for the albumin gene in stool DNA, and boost the detection signal of methylation biomarkers by 1.5 to 23-fold in individual samples [66]. It is hypothesized that spermidine neutralizes the effects of PCR inhibitors, though the exact mechanism is not fully understood. Other solutions include the use of highly inhibitor-tolerant DNA polymerase blends, which are specifically engineered for robust performance in complex samples [64].
Experimental Workflow for Inhibited Samples
A robust workflow for analyzing complex samples like feces or plaque integrates the strategic choices of sample preparation, technology selection, and facilitation methods. The following diagram outlines a recommended experimental pathway to achieve reliable quantification.
The Scientist's Toolkit: Research Reagent Solutions
The table below lists key reagents and materials cited in experimental protocols for managing PCR inhibition in complex samples.
Table 2: Essential Reagents for PCR in Complex Samples
| Reagent/Material | Function/Application | Example Usage in Protocol |
|---|---|---|
| Spermidine | PCR facilitator; neutralizes inhibitors in stool DNA to dramatically improve amplification efficiency [66]. | Add to PCR master mix at an optimal concentration of 1 mM [66]. |
| Inhibitor-Tolerant DNA Polymerase | Enzyme blends engineered for robust performance in the presence of common inhibitors like humic acids and hematin [64]. | Used in direct PCR protocols to minimize sample purification and associated DNA loss [64]. |
| Guanidinium Isothiocyanate (GIT) | Powerful protein denaturant and nucleic acid protector; used to purify RNA/DNA free of inhibitors prior to RT-PCR [68]. | Single-step GIT extraction of viral RNA from sewage and fecal wastes for RT-PCR detection [68]. |
| QIAamp Fast DNA Stool Mini Kit | Optimized kit for isolating PCR-quality DNA from difficult stool samples [7]. | Used with a pre-washing step to remove soluble inhibitors from fecal samples prior to cell lysis [7]. |
| Chelex Resin | Cheaper and rapid DNA extraction method; chelating agent that helps remove impurities [64]. | Simple and quick DNA extraction, though may be less effective for highly inhibited samples compared to kit-based methods [64]. |
In the pursuit of absolute bacterial quantification in complex samples like feces and plaque, PCR inhibition presents a significant but manageable hurdle. The choice between qPCR and ddPCR is application-dependent. qPCR remains a powerful tool for high-throughput applications where sample inhibition is low or can be effectively removed, and where a broad dynamic range is required [7] [60]. Conversely, ddPCR excels in scenarios with high inhibitor load, when detecting rare targets, or when absolute quantification without a standard curve is paramount [13] [67] [5]. For the most challenging samples, a combined strategy—employing optimized DNA extraction, leveraging inhibitor-tolerant polymerases or facilitators like spermidine, and selecting the appropriate PCR technology—provides the most robust path to accurate and reliable data.
Optimizing DNA Extraction Methods for Different Sample Matrices
The choice of DNA extraction method is a critical determinant of success in molecular biology research, particularly for absolute bacterial quantification using quantitative PCR (qPCR) or droplet digital PCR (ddPCR). These downstream analytical techniques are highly dependent on the quality, quantity, and purity of the extracted DNA. Within the broader context of comparing qPCR and ddPCR for absolute bacterial quantification, selecting the appropriate DNA isolation strategy becomes paramount, as it directly impacts sensitivity, accuracy, and reproducibility. Different sample matrices—from human feces to environmental samples—present unique challenges, including varying levels of PCR inhibitors and diverse microbial community structures. This guide objectively compares the performance of common DNA extraction methods across different sample types, supported by experimental data, to help researchers optimize their protocols for precise bacterial quantification.
Performance Comparison of DNA Extraction Methods
The efficiency of DNA extraction methods varies significantly across different sample matrices, directly impacting the performance of subsequent qPCR and ddPCR analyses. The following tables summarize key experimental findings from comparative studies.
Table 1: Performance of DNA Extraction Methods for Bacterial Quantification in Fecal Samples
| Extraction Method | Sample Type | Extraction Efficiency | DNA Purity (A260/A280) | Suitability for qPCR/ddPCR | Key Findings |
|---|---|---|---|---|---|
| Protocol Q (PQ) [20] | Human feces (with L. reuteri) | High recovery | High | Good for both | Recovered the most substantial proportion of L. reuteri cells; showed good linearity and reproducibility with both qPCR and ddPCR. |
| QIAamp Fast Stool DNA Kit (QK) [20] | Human feces (with L. reuteri) | Acceptable | High | Good for both | Produced DNA with acceptable quantity and high quality; showed good linearity with both PCR methods. |
| Phenol Chloroform (PC) [20] | Human feces (with L. reuteri) | Highest concentration | Lower purity | Lower suitability | Produced the highest DNA concentration but lower purity; showed poorer linearity in PCR quantification. |
| Kit-based Methods [19] | Human fecal samples (with L. reuteri) | High | High | Good for both | Reproducible with comparable sensitivity and linearity (R² > 0.98) for both qPCR and ddPCR. |
Table 2: Comparison of qPCR and ddPCR Performance with Optimized DNA Extraction
| Performance Metric | qPCR | ddPCR | Implications for DNA Extraction |
|---|---|---|---|
| Quantification Type [60] | Relative (requires standard curve) | Absolute (no standard curve) | ddPCR simplifies workflow post-extraction, but both require high-quality DNA. |
| Sensitivity / LOD | ~10³ - 10⁴ cells/g feces [19] | Can be lower than qPCR [20] | Extraction must efficiently recover low-abundance targets. |
| Tolerance to Inhibitors | Sensitive [69] | Higher tolerance [18] [13] [60] | ddPCR is more robust for complex matrices where inhibitor carryover is likely. |
| Precision & Reproducibility | Good | Better reproducibility, lower CV [70] [18] [13] | Consistent extraction is critical for both; ddPCR's superior precision can mitigate minor extraction variations. |
| Dynamic Range [60] | Broad | Restricted | Efficient extraction across diverse microbial populations is key for qPCR's broad dynamic range. |
Experimental Protocols for DNA Extraction and Quantification
The following section outlines detailed methodologies for DNA extraction and subsequent quantification as cited in key comparative studies.
Protocol for Absolute Quantification of Prokaryotes in Stool Samples
This comprehensive protocol is designed for rigorous and reproducible quantification of prokaryotic concentration in human gut microbiome samples, yielding output as 16S rRNA copies per gram of stool [9].
Sample Preparation and Moisture Content:
- Weighing: Begin by weighing the frozen stool sample accurately.
- Drying: A portion of the sample is dried completely to determine the moisture content.
- Calculation: The moisture content is used to correct the final quantification results, which can be reported per wet or dry gram of stool.
DNA Extraction:
- The protocol emphasizes the importance of selecting a DNA extraction method that efficiently lyses bacterial cells while minimizing the co-purification of PCR inhibitors.
- Specific methods for stool sample lysis and DNA purification are recommended, with strategies to overcome common pitfalls such as 16S rRNA gene contamination from reagents or the environment.
Absolute Quantification by qPCR/ddPCR:
- qPCR Method: A standard curve is constructed using a known standard (e.g., a plasmid containing the 16S rRNA gene target) to relate the quantification cycle (Cq) to the starting copy number. Reactions are run in duplicate or triplicate.
- ddPCR Method: The PCR reaction mixture is partitioned into ~20,000 nanoliter-sized droplets. After endpoint amplification, droplets are read as positive or negative, and the absolute concentration of the 16S rRNA gene in copies/μL is calculated directly using Poisson statistics, without a standard curve.
- Data Analysis: The resulting 16S rRNA gene concentration from either method is combined with the sample weight and moisture data to calculate the final absolute abundance.
DNA Extraction and qPCR/ddPCR Quantification forL. reuteriin Feces
This protocol provides a step-by-step approach for the strain-specific absolute quantification of bacteria in fecal samples [19] [20].
DNA Extraction Comparison:
- Three DNA extraction methods were directly compared: the QIAamp Fast Stool DNA Kit (QK), a Phenol-Chloroform (PC) method, and Protocol Q (PQ), a specific laboratory protocol.
- DNA concentration and purity (e.g., A260/A280 ratio) are assessed using a spectrophotometer. The study found that while PC yielded high concentrations, kit-based methods (QK and PQ) generally provided DNA with higher purity, which is crucial for reliable PCR [20].
Strain-Specific qPCR/ddPCR Assay:
- Primer Design: Strain-specific PCR primers are designed based on unique genomic sequences of the target bacterial strain (e.g., L. reuteri 17938, PB-W1, or DSM 20016).
- qPCR Protocol: Reactions are run using a standard thermal cycling protocol (e.g., initial denaturation at 95°C for 15 mins, followed by 40 cycles of 95°C for 15 sec and 60°C for 1 min). A standard curve is created from a known concentration of target DNA.
- ddPCR Protocol: The reaction mix is partitioned into droplets using a droplet generator. The emulsion PCR is run to endpoint, followed by droplet reading. The fraction of positive droplets is used for absolute quantification.
- Limit of Detection (LOD): The LOD for the strain-specific assays in spiked fecal samples can reach as low as ~10³ cells/g feces [19].
Visualizing the Workflow and Decision Process
The following diagrams illustrate the core experimental workflow and the logic for selecting between qPCR and ddPCR based on extraction outcomes and research goals.
DNA Extraction and Absolute Quantification Workflow
Selecting Between qPCR and ddPCR Post-Extraction
The Scientist's Toolkit: Key Research Reagent Solutions
The following table details essential materials and reagents used in the featured experiments for DNA extraction and absolute bacterial quantification.
Table 3: Essential Reagents and Kits for DNA Extraction and Quantification
| Item | Function / Application | Specific Examples / Notes |
|---|---|---|
| Commercial DNA Extraction Kits | Standardized purification of genomic DNA from complex samples. | QIAamp Fast Stool DNA Kit (Qiagen) [20] [69]; DNeasy Extraction Kit (Qiagen) [69]. |
| Phenol-Chloroform Reagents | Organic extraction method for DNA purification. | Can yield high DNA concentration but may result in lower purity compared to kits [20]. |
| Strain-Specific Primers & Probes | Enable precise targeting of a specific bacterial strain for quantification. | Designed from unique genomic sequences; used with hydrolysis probes (e.g., FAM/BHQ-1) in qPCR/ddPCR [18] [19]. |
| qPCR Master Mix | Contains enzymes, dNTPs, and buffer for real-time PCR. | Often includes SYBR Green or is compatible with TaqMan probes [70] [69]. |
| ddPCR Supermix | Optimized reaction mix for droplet generation and digital PCR. | Formulated for water-in-oil droplet formation and endpoint PCR; often probe-based [18] [69]. |
| Standard/Plasmid DNA | Used to create a standard curve for absolute quantification in qPCR. | Cloned plasmid with target sequence (e.g., 16S rRNA gene) of known concentration [18]. |
| Droplet Generation Oil | Essential for creating the water-in-oil emulsion in ddPCR. | Used in systems like the Bio-Rad QX200 to partition samples into nanoliter droplets [69]. |
Optimizing DNA extraction is a foundational step that profoundly influences the success and accuracy of absolute bacterial quantification using either qPCR or ddPCR. The evidence indicates that for complex matrices like fecal samples, kit-based extraction methods (e.g., QIAamp Fast Stool DNA Kit or Protocol Q) generally provide the best balance of DNA yield, purity, and compatibility with downstream PCR applications. The choice between qPCR and ddPCR can then be guided by the specific research needs: ddPCR offers superior tolerance to inhibitors and absolute quantification without standards, making it ideal for challenging samples and low-abundance targets, while qPCR provides a cost-effective, high-throughput solution for broader dynamic range applications. By carefully pairing the DNA extraction method with the appropriate quantification technology, researchers can achieve highly accurate and reliable results across diverse sample matrices.
In the field of molecular biology, the choice between quantitative PCR (qPCR) and droplet digital PCR (ddPCR) for absolute quantification has been extensively discussed. While ddPCR provides absolute quantification without standard curves and demonstrates enhanced tolerance to PCR inhibitors, achieving its promised precision requires careful optimization of experimental conditions [37] [71]. One critical, yet often overlooked, factor is the selection of appropriate restriction enzymes during sample preparation. Restriction enzymes play a vital role in digesting complex DNA to improve the accessibility of target sequences for amplification. This guide objectively compares the performance of different restriction enzymes across digital PCR platforms, providing experimental data to illustrate their significant impact on quantification precision, specifically within the context of absolute bacterial quantification research.
dPCR vs. qPCR: Core Technologies and Applications
Technology Comparison
Digital PCR (dPCR) and quantitative PCR (qPCR) represent two pivotal techniques for nucleic acid quantification, each with distinct strengths. While qPCR measures amplification during the exponential phase of PCR and requires a standard curve for relative quantification, dPCR partitions a sample into thousands of individual reactions for end-point detection, enabling absolute quantification without external standards [37]. This partitioning confers two key advantages on dPCR: superior precision for detecting small fold-changes and higher tolerance to PCR inhibitors commonly found in complex biological samples [37] [72]. For absolute bacterial quantification, where precise gene copy number determination is crucial, these advantages make dPCR particularly valuable.
Platform-Specific Considerations
Different dPCR platforms, such as droplet-based (ddPCR) and nanoplate-based (ndPCR) systems, utilize distinct mechanisms to achieve sample partitioning. The QX200 droplet digital PCR (ddPCR) from Bio-Rad generates droplets to partition PCR reactions, while the QIAcuity One nanoplate digital PCR (ndPCR) from QIAGEN separates reactions into thousands of nanoscale chambers [72]. Despite their different approaches, both platforms aim to enhance measurement sensitivity and achieve highly accurate and precise copy number estimations [72]. Understanding these platform differences is essential when evaluating the impact of other variables, such as restriction enzyme selection, on final quantification results.
Table 1: Key Differences Between qPCR and dPCR
| Parameter | Quantitative PCR (qPCR) | Digital PCR (dPCR) |
|---|---|---|
| Quantification | Relative (requires standard curve) | Absolute (no standard curve) |
| Data Collection | During exponential PCR phase | End-point detection |
| Sample Handling | Bulk reaction | Partitioned into thousands of reactions |
| Tolerance to Inhibitors | Lower | Higher |
| Precision | Suitable for broad dynamic range | Higher precision for fractional abundance and small fold-changes |
| Mutation Detection | >1% mutation rate | ≥0.1% mutation rate |
The Critical Role of Restriction Enzymes in Precision Analysis
Restriction enzymes are endonucleases that recognize specific DNA sequences and cleave the DNA at or near these sites [73]. In the context of digital PCR and absolute quantification, their primary function is to digest complex DNA, such as that from bacterial genomes, to enhance the accessibility of the target sequence for primer binding and amplification. This is particularly important for organisms with high gene copy numbers or sequences prone to forming secondary structures. Incomplete digestion can lead to inaccurate copy number quantification due to uneven amplification efficiency across the template. The choice of restriction enzyme can influence precision by affecting the efficiency of DNA cleavage, which is governed by factors such as the enzyme's recognition site frequency in the target DNA, the reaction buffer composition, and the incubation conditions [74] [75].
Comparative Data: Restriction Enzyme Performance Across Platforms
Experimental Evidence from a Cross-Platform Study
A recent systematic comparison of the QX200 ddPCR (Bio-Rad) and QIAcuity One ndPCR (QIAGEN) platforms evaluated the impact of restriction enzyme selection on precision using DNA from the ciliate Paramecium tetraurelia [72]. The study specifically tested the enzymes EcoRI and HaeIII, measuring precision via the coefficient of variation (CV) across varying cell numbers.
Table 2: Impact of Restriction Enzyme on Quantification Precision (%CV)
| Number of Cells | ddPCR with EcoRI | ddPCR with HaeIII | ndPCR with EcoRI | ndPCR with HaeIII |
|---|---|---|---|---|
| 50 | 62.1% | <5% | 27.7% | 14.6% |
| 100 | 2.5% | <5% | 8.5% | 1.6% |
| 200 | 19.9% | <5% | 0.6% | 2.5% |
Interpretation of Comparative Results
The data reveals a critical finding: the precision of copy number quantification is highly dependent on the restriction enzyme used, and this effect is more pronounced in droplet-based systems (ddPCR) [72]. The QX200 ddPCR system showed dramatically improved precision across all cell numbers when HaeIII was substituted for EcoRI, with CV values dropping from as high as 62.1% to below 5% [72]. In contrast, the QIAcuity ndPCR system demonstrated more consistent precision with both enzymes, though a general trend of higher precision was still observed with HaeIII [72]. This suggests that nanoplate-based systems may be more robust to variations in restriction enzyme efficiency, a significant consideration for platform selection.
Detailed Experimental Protocol for Restriction Enzyme Evaluation
Sample Preparation and Digestion
The following protocol is adapted from the cross-platform study, which used DNA extracted from Paramecium tetraurelia [72]. This provides a template for designing your own experiments to test restriction enzymes for a specific application.
- DNA Extraction: Extract genomic DNA from your target bacterial species using a standard purification kit. Determine the DNA concentration using a fluorometer.
- Restriction Digestion: Set up separate digestion reactions for each restriction enzyme to be tested.
- Reaction Mix:
- DNA (e.g., 1 µg)
- 1 µL of restriction enzyme (e.g., EcoRI or HaeIII)
- 3 µL of the appropriate 10x reaction buffer (as specified by the enzyme manufacturer)
- Nuclease-free water to a total volume of 30 µL.
- Incubation: Incubate the reaction mix at 37°C for a minimum of 1 hour. For digests involving >1 µg of DNA for precise quantification, extend the incubation to at least 4 hours or overnight for complete digestion [73].
- Reaction Mix:
- Enzyme Inactivation: Following digestion, incubate the reaction at 70°C for 15 minutes to inactivate the restriction enzyme, unless the protocol for the subsequent dPCR reaction specifies otherwise.
Digital PCR Setup and Analysis
- dPCR Reaction Preparation: Prepare the dPCR master mix according to the platform-specific guidelines (e.g., QX200 ddPCR or QIAcuity ndPCR manuals). This typically includes the dPCR supermix, fluorescently labeled probes or dyes, and primers targeting your gene of interest.
- Loading: Combine the master mix with the restriction-digested DNA sample. For ddPCR, this mixture is used to generate droplets. For ndPCR, it is loaded into the designated nanoplates.
- Thermocycling and Reading: Place the samples in the thermocycler and run the appropriate PCR cycling program. After cycling, transfer the plate or droplet cartridge to the reader for fluorescence detection and analysis.
- Data Analysis: Use the manufacturer's software to analyze the data. The software will apply Poisson statistics to calculate the absolute concentration of the target sequence in copies per microliter. Compare the precision (CV) and measured copy numbers obtained with different restriction enzymes.
Diagram 1: Experimental workflow for evaluating restriction enzyme impact on dPCR precision.
The Scientist's Toolkit: Essential Research Reagents
Selecting the right reagents is fundamental to achieving precise and reproducible results in dPCR-based quantification.
Table 3: Key Research Reagent Solutions for dPCR with Restriction Digestion
| Reagent Category | Specific Examples | Function & Importance |
|---|---|---|
| Restriction Enzymes | HaeIII, EcoRI [72] | Cleave DNA at specific sites to open complex structures and improve template accessibility for primers, directly impacting precision. |
| dPCR Master Mixes | GoTaq Green Master Mix, PCR Master Mix [75] | Provide optimized buffers, nucleotides, and polymerases for amplification. Some master mixes support direct addition of restriction enzymes post-PCR. |
| Digital PCR Platforms | QIAcuity One (ndPCR), QX200 (ddPCR) [72] | Instrumentation that partitions samples for absolute quantification. Platform choice (nanoplate vs. droplet) can interact with enzyme efficiency. |
| Probe-Based Assays | TaqMan probes (FAM/TAMRA) [71] | Fluorescently labeled probes provide sequence-specific detection with high specificity in dPCR assays. |
| DNA Cleanup Kits | Monarch PCR & DNA Cleanup Kit [76] | Remove enzymes, salts, or inhibitors after restriction digestion to prevent interference with the subsequent dPCR reaction. |
The selection of an appropriate restriction enzyme is not merely a procedural step but a critical determinant for achieving the high precision promised by digital PCR in absolute bacterial quantification. Experimental data demonstrates that enzyme choice can cause precision (CV) to vary from over 60% to under 5%, an effect that is particularly pronounced in droplet-based dPCR systems [72]. While nanoplate-based dPCR appears to offer greater robustness against suboptimal enzyme selection, no platform is immune to this variable. Therefore, researchers must empirically validate restriction enzymes for their specific application and target organism. This practice ensures that the full analytical power of dPCR is realized, leading to more reliable and reproducible quantification data in drug development and basic research.
Determining Limits of Detection (LOD) and Limits of Quantification (LOQ)
In the development and validation of any analytical method, determining the Limit of Detection (LOD) and Limit of Quantification (LOQ) is paramount. These analytical figures of merit (AFOM) characterize the fundamental capability of a methodology, defining the lowest concentration of an analyte that can be reliably detected (LOD) and quantified (LOQ) with a specified degree of certainty [77]. These parameters are not merely statistical exercises but have profound practical implications for determining whether a method is "fit for purpose" in specific applications, from clinical diagnostics to environmental monitoring [77].
The LOD represents the smallest quantity of an analyte that can be distinguished from the absence of that analyte (a blank value) with a stated confidence level, typically 95% [77]. In practical terms, it answers the question: "Can we confirm the analyte is present?" In contrast, the LOQ is the lowest concentration at which the analyte can not only be detected but also quantified with acceptable precision and accuracy, typically defined by a relative standard deviation of ≤25% in microbiology contexts [78]. It answers the subsequent question: "How much of the analyte is present?"
Multiple approaches exist for calculating LOD and LOQ, including statistical methods based on blank measurements and empirical methods using progressively diluted analyte concentrations [78]. The statistical approach often defines LOD as the mean blank signal plus 1.645 times its standard deviation (for 95% confidence), while LOQ is typically set at a higher multiple (often 10 times the standard deviation) to ensure reliable quantification [77]. However, empirical approaches based on dilution series often provide more realistic values, as demonstrated in forensic GC-MS assays where empirical LODs were 0.5-0.03 times the magnitude of corresponding statistical LODs [78].
Comparative Analysis of qPCR and ddPCR Technologies
Quantitative PCR (qPCR) is a well-established molecular technique that estimates the initial concentration of target nucleic acids by comparing the quantification cycle (Cq) values of test samples to an external calibration curve of known standards [18]. This method has revolutionized molecular diagnostics over the past two decades, providing sensitive, specific, and closed-tube detection capabilities across diverse fields from clinical microbiology to food safety testing [6] [18].
Droplet Digital PCR (ddPCR) represents a more recent technological advancement that enables absolute quantification of nucleic acids without requiring external calibrators [18]. The technique partitions a PCR reaction into thousands of nanoliter-sized water-in-oil droplets, effectively creating numerous individual PCR reactions. After endpoint amplification, droplets are analyzed as positive or negative based on fluorescence, and the absolute target concentration is calculated using Poisson statistics [18]. This fundamental difference in quantification approach underpins many of the performance variations between the two technologies.
Performance Comparison for Bacterial Quantification
Direct comparisons of qPCR and ddPCR for quantifying bacterial targets reveal distinct advantages and limitations for each method, particularly concerning LOD and LOQ.
Table 1: Comparison of qPCR and ddPCR Performance for Bacterial Quantification
| Parameter | qPCR | ddPCR | Experimental Context |
|---|---|---|---|
| LOD (L. reuteri) | ~10⁴ cells/g feces [7] | Comparable sensitivity [7] | Human fecal samples spiked with Limosilactobacillus reuteri |
| LOD (JAK2 V617F) | 0.12% [79] | 0.01% [79] | Detection of mutation in myeloproliferative neoplasms |
| LOQ (L. reuteri) | 4.50 Log₁₀ CFU/g feces [20] | 4.30 Log₁₀ CFU/g feces [20] | Quantification in human fecal samples with protocol Q DNA extraction |
| Dynamic Range | Broader [18] | Narrower [18] | Detection of Xanthomonas citri subsp. citri |
| Precision at Low Concentrations | Lower [18] | Higher (lower CV) [18] | Various bacterial pathogens including Listeria monocytogenes |
| Cost per Reaction | Lower [7] | ~3 times higher [20] | Multiple studies |
| Handling of PCR Inhibitors | More susceptible [7] | More tolerant [18] | Complex matrices including fecal samples and plant tissues |
| Throughput Time | 2.5 hours [20] | 6.5 hours [20] | Standard protocols for fecal sample analysis |
For absolute quantification of bacterial strains in human fecal samples, qPCR demonstrated an LOD of approximately 10⁴ cells/g feces when using kit-based DNA isolation methods, with excellent linearity (R² > 0.98) [7]. In the same study, ddPCR showed slightly better reproducibility, but qPCR offered comparable sensitivity with the advantages of being faster and more cost-effective. When specifically quantifying Lactobacillus reuteri in human feces, the LOQ for qPCR was 4.50 Log₁₀ CFU/g feces compared to 4.30 Log₁₀ CFU/g feces for ddPCR when using the protocol Q DNA extraction method [20].
The superior sensitivity of ddPCR becomes particularly evident in applications requiring detection of rare events or minimal residual disease. In quantifying JAK2 V617F mutation burden in myeloproliferative neoplasms, ddPCR demonstrated an LOD of 0.01%, significantly lower than the 0.12% LOD of qPCR [79]. This enhanced sensitivity makes ddPCR particularly valuable for monitoring treatment response where allele burdens may drop below the detection limit of qPCR methods.
Both technologies show strong correlation when quantifying bacterial pathogens like Listeria monocytogenes, Francisella tularensis, and Mycobacterium avium subsp. paratuberculosis, with maximum differences between methods of <0.5 Log₁₀ [6]. This close agreement supports the validity of both approaches for quantitative microbiological applications, though the choice between them should be guided by specific application requirements.
Experimental Protocols for LOD/LOQ Determination
Establishing LOD and LOQ for qPCR Assays
The determination of LOD and LOQ for qPCR assays follows systematic procedures incorporating both statistical calculations and empirical verification. A recommended workflow begins with preliminary estimation using signal-to-noise (S/N) ratio approaches to define the appropriate concentration range, followed by more rigorous statistical determination [77].
A comprehensive approach for qPCR validation involves calculating the Limit of Blank (LoB) first, which represents the highest apparent analyte concentration expected to be found when replicates of a blank sample containing no analyte are tested. This is determined experimentally by testing replicates of negative control samples and calculating LoB = meanₛₜₐₙdₐᵣd dₑᵥᵢₐₜᵢₒₙ + 1.645 × SDₛₜₐₙdₐᵣd dₑᵥᵢₐₜᵢₒₙ (for 95% confidence) [79]. The LOD is then established as the lowest analyte concentration likely to be reliably distinguished from the LoB, typically determined by testing diluted samples with low analyte concentrations. For the JAK2 V617F qPCR assay, this involved preparing a two-fold dilution series of genomic DNA covering 0.0098-2.5000% JAK2 V617F mutation burden, with each point analyzed in 50 replicates [79].
For bacterial quantification in complex matrices like fecal samples, the protocol involves spiking known quantities of the target bacterium into negative fecal matrices and performing DNA extraction followed by qPCR analysis [7]. The LOD is determined as the lowest spike concentration that can be consistently detected with acceptable precision. The LOQ is set at the concentration where quantification meets predefined precision criteria, often defined as the concentration where the relative standard deviation (RSD) is ≤25% [78].
Establishing LOD and LOQ for ddPCR Assays
The fundamental difference in ddPCR technology necessitates modifications to the LOD/LOQ determination approach. Since ddPCR provides absolute quantification without standard curves, the determination of these parameters focuses more on the statistical reliability of positive droplet counts and the Poisson distribution calculations.
For ddPCR assays, the LOD is influenced by the total number of partitions analyzed and the background signal in negative controls. The calculation typically involves determining the minimum number of positive droplets required to distinguish a true positive signal from background with 95% confidence [79]. This requires extensive testing of negative control samples to establish the false positive rate, which is then used to calculate a threshold for positive droplet counts.
The LOQ in ddPCR is determined by assessing the precision of measurements at low target concentrations, with the coefficient of variation (CV) serving as the primary metric. The concentration at which the CV exceeds acceptable levels (typically 25% for complex samples) defines the LOQ [6]. Studies have demonstrated that ddPCR generally provides better precision at low target concentrations compared to qPCR, resulting in a lower LOQ for many applications [18].
When transferring an established qPCR assay to ddPCR format, it is essential to re-establish LOD and LOQ values specific to the ddPCR platform, as performance characteristics differ significantly between the technologies despite using the same primers and probes [18].
Workflow Diagram for LOD/LOQ Determination
The following diagram illustrates the comprehensive workflow for determining LOD and LOQ in qPCR and ddPCR assays, integrating both statistical and empirical approaches:
Workflow for LOD/LOQ Determination in qPCR and ddPCR
This comprehensive workflow highlights both the shared procedures and technology-specific steps required for robust determination of LOD and LOQ parameters in molecular assays.
Essential Research Reagent Solutions
Successful implementation of qPCR and ddPCR assays for absolute bacterial quantification requires careful selection of reagents and materials. The following table details essential research reagent solutions and their critical functions in the experimental workflow.
Table 2: Essential Research Reagent Solutions for qPCR/ddPCR Bacterial Quantification
| Reagent/Material | Function | Application Notes |
|---|---|---|
| Strain-Specific Primers & Probes | Selective amplification of target bacterial sequences | Designed from unique genomic regions; require comprehensive in silico and empirical validation [7] |
| DNA Extraction Kits (e.g., QIAamp Fast DNA Stool Mini Kit) | Isolation of high-quality microbial DNA from complex matrices | Kit-based methods generally provide better quantitative recovery than phenol-chloroform methods [7] |
| Digital PCR Supermix (No dUTP) | Enzymatic amplification in partitioned droplets | Formulated specifically for ddPCR; lacks dUTP to prevent carryover contamination [79] [6] |
| Quantitative PCR Master Mix | Enzymatic amplification with fluorescent detection | Contains reference dyes (ROX) for normalization; often includes UNG for contamination control [79] |
| Reference Plasmid DNA | Generation of standard curves for qPCR | Linearized plasmids with target sequence enable copy number determination for calibration [80] [18] |
| Droplet Generation Oil & Cartridges | Creation of water-in-oil emulsion for partitioning | Essential for ddPCR workflow; quality affects droplet consistency and results [18] |
| Inhibition Resistance Additives | Counteract PCR inhibitors in complex samples | Particularly important for fecal, soil, and food matrices; ddPCR generally shows higher tolerance [18] |
The selection of appropriate DNA extraction methods significantly impacts quantitative results. Studies comparing phenol-chloroform-based methods, QIAamp Fast DNA Stool Mini Kit-based methods, and protocol Q-based methods found that kit-based approaches generally provided better quantitative recovery of bacterial cells from fecal samples [7]. The protocol Q method recovered the most substantial proportion of L. reuteri cells from feces, highlighting the importance of matching extraction methodology to both sample type and quantification technology.
For strain-specific quantification, the design and validation of specific primers is particularly important. This involves identifying unique genomic regions through comparative genomics, followed by extensive in silico testing against database sequences and empirical validation using related non-target strains to confirm specificity [7]. The provided step-by-step protocol for designing strain-specific qPCR assays enables highly accurate quantification with detection limits in spiked fecal samples of around 10³ cells/g feces [7].
Method Selection Guide
Decision Framework Diagram
The choice between qPCR and ddPCR for specific applications depends on multiple factors including sensitivity requirements, sample type, available resources, and intended use of the quantitative data. The following decision framework provides guidance for selecting the appropriate technology:
Decision Framework for qPCR vs. ddPCR Selection
Application-Specific Recommendations
Based on comparative performance data and practical considerations, specific recommendations emerge for different application scenarios:
For routine quantification of bacterial strains in fecal samples where targets are expected to be above 10⁴ cells/g, qPCR with kit-based DNA extraction provides the optimal balance of performance, cost, and throughput [7]. The slightly superior LOQ of ddPCR (4.30 vs. 4.50 Log₁₀ CFU/g feces) may not justify the 3-fold higher cost and longer processing time for most applications [20].
For detection of rare mutations or minimal residual disease where targets may be present at very low abundance (<0.1%), ddPCR is clearly superior due to its enhanced sensitivity and precision at low concentrations [79]. The ability of ddPCR to detect JAK2 V617F mutations at 0.01% allele burden compared to 0.12% for qPCR makes it indispensable for monitoring treatment response in therapeutic contexts [79].
In complex matrices with known PCR inhibitors, ddPCR demonstrates advantages due to its greater tolerance to inhibition [18]. The partitioning of reactions in ddPCR dilutes inhibitors across thousands of droplets, reducing their impact compared to bulk reactions in qPCR. This makes ddPCR particularly valuable for environmental samples, food matrices, and clinical specimens with inherent inhibition challenges.
For applications requiring absolute quantification without reference standards, ddPCR provides inherent advantages by eliminating the need for calibration curves [18]. This not only simplifies workflow but also improves reproducibility across laboratories by removing variability associated with standard preparation and curve generation.
The determination of LOD and LOQ parameters provides essential guidance for selecting between qPCR and ddPCR technologies for bacterial quantification. While both methods demonstrate strong correlation in quantitative results, their distinct performance characteristics make them suitable for different applications.
qPCR remains the preferred technology for most routine applications due to its broader dynamic range, lower cost, faster throughput, and established protocols [7] [18]. The methodology provides sufficient sensitivity for most bacterial quantification needs in clinical and research settings, particularly when targets are present at moderate to high abundance.
ddPCR offers compelling advantages for specialized applications requiring enhanced sensitivity, superior precision at low concentrations, improved tolerance to inhibitors, or absolute quantification without standard curves [79] [18]. Despite higher costs and longer processing times, these advantages make ddPCR increasingly valuable for challenging quantification scenarios in clinical diagnostics, therapeutic monitoring, and analysis of complex sample matrices.
The ongoing development of both technologies continues to expand their capabilities for bacterial quantification. By understanding the fundamental differences in their performance characteristics, particularly regarding LOD and LOQ parameters, researchers can make informed decisions about technology selection based on their specific application requirements, sample characteristics, and resource constraints.
In the field of microbial research and diagnostics, the ability to accurately detect and quantify multiple bacterial targets simultaneously within a single reaction has become a cornerstone of efficient experimental design. Multiplexing molecular assays addresses critical limitations in time, resource utilization, and sample volume, particularly when dealing with precious or limited clinical and environmental samples. The drive toward comprehensive microbial profiling has positioned multiplexing not as a luxury, but as a necessity for advanced research and diagnostic applications. This guide objectively compares the two principal technologies enabling this capability—quantitative PCR (qPCR) and droplet digital PCR (ddPCR)—within the broader context of absolute bacterial quantification. Both techniques can be configured for multiplex detection, yet they differ significantly in their underlying mechanisms, performance characteristics, and practical implementation [81] [82]. Understanding these differences is paramount for researchers, scientists, and drug development professionals to select the optimal strategy for their specific application, whether it involves profiling gut microbiota, identifying pathogens, or monitoring bacterial strains in complex matrices.
Core Technologies: qPCR vs. ddPCR in Multiplexing
Quantitative PCR (qPCR) for Multiplexing
Multiplex qPCR enables the amplification of multiple target sequences in a single reaction by using distinct, target-specific primer and probe sets labeled with different fluorescent dyes [82]. The Azure Cielo qPCR system, for example, facilitates experiments involving up to six different targets by leveraging multiple detection channels to minimize fluorescent crosstalk [82]. The fundamental principle involves monitoring the accumulation of fluorescent signal in real-time during each PCR cycle, with the cycle threshold (Ct) value serving as a quantitative measure of the initial target concentration relative to a standard curve.
Droplet Digital PCR (ddPCR) for Multiplexing
ddPCR takes a different approach by partitioning a single PCR reaction into tens of thousands of nanoliter-sized droplets, effectively creating a multitude of individual PCR reactions [83] [84]. Following endpoint amplification, each droplet is analyzed for fluorescence to determine whether it contains the target sequence(s). The absolute quantity of the target is then calculated using Poisson statistics, without the need for a standard curve [7] [84]. Two primary strategies are employed for multiplexing in ddPCR:
- Amplitude Multiplexing: Varying the primer and/or probe concentrations to create distinct clusters of positive droplets on a 2-D plot [83].
- Probe-Mixing Multiplexing: Using different ratios of two fluorophores (e.g., FAM and HEX) for a single probe to create additional, uniquely identifiable clusters on a 2-D plot [83] [85].
The table below summarizes the fundamental differences between these two core technologies for multiplexed bacterial detection.
Table 1: Core Principles of qPCR and ddPCR for Multiplexing
| Feature | Multiplex qPCR | Multiplex ddPCR |
|---|---|---|
| Quantification Basis | Relative to standard curve | Absolute counting via Poisson statistics |
| Reaction Structure | Bulk, single reaction | Partitioned into thousands of droplets |
| Detection Phase | Real-time, during cycling | End-point, after cycling |
| Primary Multiplexing Method | Multiple fluorescent channels | Amplitude or probe-mixing within channels |
| Key Technological Requirement | Multiple optical channels in instrument | Droplet generator and reader |
Performance Comparison: Experimental Data
Direct comparative studies provide the most reliable evidence for selecting between qPCR and ddPCR. Key performance metrics from published research on bacterial quantification are summarized below.
Table 2: Experimental Performance Comparison for Bacterial Detection
| Performance Metric | qPCR Findings | ddPCR Findings | Comparative Context |
|---|---|---|---|
| Sensitivity (LOD) | ~10³–10⁴ cells/g feces [7] | Comparable or slightly lower LOD than qPCR [7] | qPCR often has higher sensitivity [81] |
| Dynamic Range | Wider linear dynamic range [81] [7] | Narrower dynamic range [81] | qPCR is superior for wide concentration ranges |
| Precision & Accuracy | Susceptible to PCR inhibitors in samples [81] | Lower variability; handles PCR inhibition and competitive effects in duplex assays [81] | ddPCR provides more precise and accurate analysis for complex samples [81] |
| Reproducibility | Good reproducibility [7] | Slightly better reproducibility in some studies [7] [20] | ddPCR can offer a reproducibility advantage |
| Resistance to Inhibitors | Performance is affected by inhibitors in fecal/environmental samples [7] | More tolerant of inhibitors due to sample partitioning [81] | ddPCR is more robust for complex sample matrices |
A study on cyanobacteria quantification concluded that while qPCR demonstrated higher sensitivity and a wider linear dynamic range, ddPCR provided lower variability and was better at handling PCR inhibitors and competitive effects in multiplex assays [81]. Similarly, a systematic comparison for quantifying Limosilactobacillus reuteri in human fecal samples found that ddPCR had a slightly lower limit of quantification (LOQ) with one DNA extraction method, but the overall combination of a kit-based DNA extraction and qPCR was recommended as the best approach, balancing performance, cost, and speed [7] [20].
Experimental Protocols for Multiplex Assays
Developing a Strain-Specific qPCR Assay
An optimized, step-by-step protocol for absolute quantification of bacterial strains in fecal samples has been detailed, highlighting qPCR as the preferred method [7].
- DNA Extraction: Use a kit-based method (e.g., QIAamp Fast DNA Stool Mini Kit or an optimized "Protocol Q") for optimal DNA yield and purity from fecal samples [7] [20].
- Primer and Probe Design: Identify strain-specific marker genes from genome sequences and design primers and probes with stringent specificity checks against databases [7].
- Assay Validation: Validate the assay for specificity, dynamic range, and limit of detection (LOD) using spiked fecal samples. The LOD for well-designed assays can reach approximately 10³ cells/g of feces [7].
- Multiplexing Optimization: For multiplex qPCR, carefully select fluorophores with minimal spectral overlap. Optimize primer and probe concentrations to ensure balanced amplification efficiency for all targets [82]. The use of a quality qPCR system with multiple detection channels is critical [82].
Optimizing a Multiplex ddPCR Assay
A robust protocol for multiplex ddPCR assay development, with a focus on ensuring low false positives and high sensitivity, involves the following steps [84]:
- Assay Design: Incorporate locked nucleic acid (LNA) bases into probes to enhance discrimination and sensitivity, particularly for single-nucleotide variations [84].
- Reaction Setup: Each 22 µL ddPCR reaction typically contains 11 µL of 2x ddPCR SuperMix for Probes (no dUTP), template DNA, and optimized concentrations of primers and FAM/HEX-labelled probes [84].
- Droplet Generation and PCR: Generate droplets using an Automated Droplet Generator. Perform PCR on a thermal cycler with carefully defined conditions [84].
- Droplet Reading and Analysis: Read the plate on a droplet reader and analyze the data using appropriate software (e.g., QuantaSoft Analysis Pro). Include negative and positive template controls in every run [83] [84].
Figure 1: Comparative workflow for multiplex qPCR and ddPCR assays.
Multiplexing Strategies: Technical Considerations
qPCR Multiplexing
Successful multiplexing in qPCR requires careful experimental design to overcome the challenge of amplifying multiple targets in a single, bulk reaction. Key considerations include:
- Fluorophore Selection: Dyes must be spectrally distinct to minimize crosstalk, with excitation and emission spectra matched to the instrument's optical channels [82].
- Assay Balancing: Primer and probe concentrations for each target must be optimized to ensure that all targets amplify with similar efficiency, preventing the "dropout" of less efficient assays [82].
- Product Size: While real-time detection with probes eliminates the absolute need for different product sizes, designing amplicons of similar length can help maintain uniform amplification efficiency [82].
ddPCR Multiplexing
The partitioned nature of ddPCR simplifies multiplexing by physically separating the amplification of targets, thereby reducing competition for reagents. The two main strategies are:
- Amplitude Multiplexing: This involves varying the concentration of primers and/or probes for different targets within the same fluorescent channel. This creates clusters of positive droplets with different fluorescence intensities, allowing them to be distinguished on a 1D or 2D plot [83]. For example, using one FAM-labeled assay at 1x concentration and another at 0.5x concentration creates two distinct clusters [83].
- Probe-Mixing Multiplexing: This powerful strategy uses probes for the same target labeled with two different fluorophores (e.g., FAM and HEX) mixed in specific ratios (e.g., 1:0, 3:1, 1:1, 1:3, 0:1). Each target thereby occupies a unique position on a 2D fluorescence plot, enabling a higher level of multiplexing. This method is ideal for differentiating somatic mutations or closely related pathogens [83].
Figure 2: Conceptual visualization of ddPCR multiplexing strategies.
The Scientist's Toolkit: Essential Reagents and Equipment
Table 3: Key Research Reagent Solutions for Multiplex PCR
| Item | Function/Purpose | Example Use Case |
|---|---|---|
| Kit-based DNA Extraction Kit | Optimal recovery of high-purity DNA from complex samples (e.g., feces) | QIAamp Fast DNA Stool Mini Kit; "Protocol Q" for fecal samples [7] |
| ddPCR Supermix for Probes | Reaction mix optimized for partitioned PCR and droplet stability | Bio-Rad ddPCR Supermix for Probes (No dUTP) for probe-based ddPCR [84] |
| TaqMan Assays (FAM/HEX) | Sequence-specific primers and dual-labeled probes for target amplification | Custom assays for bacterial strains; copy number variation assays [83] [84] |
| Locked Nucleic Acid (LNA) Probes | Enhance probe binding affinity and specificity for SNP discrimination | Critical for low false-positive rates in mutation detection [84] |
| Droplet Generation Oil | Creates inert, uniform droplets for partitioning the PCR reaction | Bio-Rad Droplet Generation Oil for Probes with QX200 system [83] |
| Optical Plate & Foil Seal | Ensures no cross-contamination and compatible with thermal cycling | Semi-skirted 96-well plate and pierceable foil heat seal [84] |
The choice between multiplex qPCR and ddPCR is not a matter of one technology being universally superior, but rather of matching the technology's strengths to the specific requirements of the experiment.
- Choose qPCR if: Your priority is a wider dynamic range, higher sensitivity for initial screening, lower cost per reaction, and faster turnaround time [81] [7] [20]. It is an excellent choice for high-throughput applications where sample inhibition is minimal or can be effectively controlled.
- Choose ddPCR if: Your primary needs are precise absolute quantification, high reproducibility, and superior performance with complex or inhibitor-containing samples [81] [7]. It is particularly advantageous for detecting rare targets, resolving copy number variations, and when a standard curve is impractical.
For absolute bacterial quantification in challenging matrices like fecal samples, the evidence suggests that a kit-based DNA extraction method paired with a well-designed qPCR assay often presents the most balanced and effective solution [7]. However, for applications demanding the utmost precision, minimal variability, and resilience to PCR inhibitors, ddPCR, with its flexible amplitude and probe-mixing multiplexing strategies, represents a powerful alternative.
qPCR vs. ddPCR: A Data-Driven Comparison for Informed Platform Selection
Comparative Analysis of Sensitivity and Precision in Bacterial Detection
The accurate detection and quantification of bacterial pathogens are fundamental to numerous fields, including clinical diagnostics, pharmaceutical development, and environmental monitoring. For decades, quantitative real-time PCR (qPCR) has been the gold standard for molecular detection due to its speed, sensitivity, and specificity. However, the emergence of droplet digital PCR (ddPCR) has introduced a new paradigm in absolute nucleic acid quantification, promising enhanced precision and sensitivity. This guide provides an objective comparison of the performance of qPCR and ddPCR technologies, focusing on their application in bacterial detection and absolute quantification for research purposes. We summarize key performance metrics from recent studies, detail essential experimental protocols, and provide a curated list of research reagents to inform scientists and drug development professionals in selecting the optimal technology for their specific applications.
Performance Comparison: qPCR vs. ddPCR
The choice between qPCR and ddPCR is application-dependent, as each technology offers distinct advantages. The following table summarizes their core characteristics based on current research.
Table 1: Core Characteristics of qPCR and ddPCR for Bacterial Detection
| Feature | Quantitative PCR (qPCR) | Droplet Digital PCR (ddPCR) |
|---|---|---|
| Quantification Method | Relative (requires a standard curve) [5] [60] | Absolute (based on Poisson statistics; no standard curve needed) [86] [5] [60] |
| Detection Limit | Varies; can be >100 gene copies for some assays [87] | Can detect single copies; demonstrates a significantly lower limit of detection in numerous studies [86] [61] [5] |
| Precision & Reproducibility | Good reproducibility, but can be lower at the limit of detection [7] [5] | Excellent precision and repeatability; shows smaller coefficients of variation (CV), especially for low-abundance targets [13] [7] [5] |
| Tolerance to PCR Inhibitors | Susceptible to inhibition, leading to reduced sensitivity or underestimation [61] [5] | High tolerance; robust performance in complex samples (e.g., soil, manure, blood) [13] [37] [61] |
| Dynamic Range | Broad dynamic range, suitable for quantifying both low and high expression levels [7] [60] | More restricted dynamic range compared to qPCR [13] [60] |
| Throughput & Cost | High-throughput (384-well) capabilities; lower running costs [60] | Lower throughput (typically 96-well); higher start-up and per-reaction costs [13] [60] |
A direct comparison of their performance in specific experimental settings further elucidates these differences.
Table 2: Experimental Performance Data in Bacterial Detection
| Application / Sample Type | qPCR Performance | ddPCR Performance | Reference |
|---|---|---|---|
| Environmental Bacteria/Fungi | Quantification was less accurate and had higher variability in mock communities. | More accurate quantification, closer to expected values; smaller coefficients of variation; better precision, repeatability, and stability. [13] | |
| Antibiotic Resistance Genes (Soil) | Lower limit of quantification (15 copies for qnrB); high loss of sensitivity with inhibitors. | Lower limit of quantification (1.6 copies for qnrB); accurate quantification despite inhibitors; 10x higher sensitivity for copy number variation. [61] | |
| Xanthomonas citri Detection | Broader dynamic range but lower sensitivity. | Higher sensitivity; lower coefficient of variation, especially at low target concentrations; higher tolerance to inhibitors. [5] | |
| Limosilactobacillus reuteri in Feces | Comparable sensitivity and reproducibility to ddPCR when using kit-based DNA isolation (LOD ~104 cells/g). | Slightly better reproducibility; similar sensitivity (LOD ~104 cells/g) in this specific context; more expensive and slower. [7] | |
| Febrile Hematological Patients | Not the primary method in this study; conventional methods had lower detection rates. | Detection rate for bacteria and viruses was significantly higher than conventional methods; rapid turnaround (~3 hours). [88] | |
| E. coli & S. aureus in Blood | Unable to produce a reliable amplification curve when the number of nucleic acid templates was less than 100. | Successfully detected and quantified templates at less than 100 copies; high detection rates in simulated bacteremia samples. [86] |
Experimental Protocols for Bacterial Detection
Dual-Target qPCR for Carbapenem-ResistantAcinetobacter baumannii
This protocol, adapted from a recent clinical study, allows for simultaneous detection of A. baumannii and its carbapenem resistance gene in bloodstream infections [89].
- Primer and Probe Design: Target the specific variable region of the bacterial 16S rRNA gene for species identification and the OXA-23 gene for carbapenem resistance. Primers and hydrolysis probes (typically FAM-labeled) should be designed using NCBI GenBank sequences and optimized for specificity [89].
- DNA Extraction: Extract bacterial DNA from blood samples using a commercial kit, such as the QIAamp DNA Mini Kit. Quantify DNA concentration and purity using a spectrophotometer [89].
- qPCR Reaction Setup:
- Reaction Volume: 20 µL.
- Reaction Mix: 10 µL of Probe qPCR Mix (e.g., Takara), 1 µL each of forward and reverse primers for both 16S rRNA and OXA-23 (optimal concentration, e.g., 300-500 nM, requires validation), 0.5 µL of each probe, and 2 µL of target DNA template. Adjust volume to 20 µL with DNase-free water.
- Thermocycling Conditions:
- Pre-denaturation: 95°C for 30 seconds.
- 39 cycles of: Denaturation at 95°C for 5 seconds, Annealing/Extension at 60°C for 30 seconds.
- Validation: Test assay specificity against a panel of non-target pathogens. Determine the limit of detection (LOD) through serial dilutions of target DNA and assess repeatability by calculating coefficients of variation (CV) [89].
ddPCR for Qualitative and Quantitative Detection of Surgical Pathogens
This protocol outlines the use of ddPCR for detecting and quantifying E. coli and S. aureus in blood samples, demonstrating its high accuracy [86].
- Primer and Probe Design: Select highly specific genes. For E. coli, the SWG-9 UIDA gene is a suitable target. For S. aureus, the coagulase (COA) gene is an effective target. Design primers and probes accordingly [86].
- Sample Preparation and DNA Extraction: Spike blood samples with target bacteria. Extract bacterial genomic DNA using a commercial kit (e.g., QIAamp kit) and quantify it using a fluorescence-based system like Qubit 3.0 [86].
- ddPCR Reaction Setup and Workflow:
- Prepare Reaction Mixture: Combine ddPCR supermix, primers, probes, and the extracted DNA template.
- Droplet Generation: Use a droplet generator (e.g., Bio-Rad QX200) to partition the reaction mixture into thousands of nanoliter-sized water-in-oil droplets.
- PCR Amplification: Transfer the droplets to a thermal cycler and run endpoint PCR.
- Droplet Reading: Analyze the emulsified droplets using a droplet reader that detects fluorescence in each droplet (FAM for one target, VIC/HEX for another).
- Data Analysis: Use Poisson statistics to determine the absolute concentration of the target DNA in copies per microliter of the original reaction based on the ratio of positive to negative droplets [86].
Workflow Diagram: qPCR vs. ddPCR
The following diagram illustrates the key procedural differences between the two technologies.
The Scientist's Toolkit: Essential Research Reagents
Table 3: Key Reagents for qPCR and ddPCR Bacterial Detection
| Item | Function | Example Products / Components |
|---|---|---|
| Nucleic Acid Extraction Kit | Isolates high-purity genomic DNA from complex samples (blood, soil, feces), crucial for assay sensitivity. | QIAamp DNA Stool Mini Kit [7], QIAamp DNA Mini Kit [89] [88] |
| qPCR/ddPCR Mastermix | Provides optimized buffer, enzymes, and dNTPs for efficient and specific amplification. | Probe qPCR Mix (e.g., Takara) [89], ddPCR Supermix [86] |
| Primers and Hydrolysis Probes | Ensure specific amplification and detection of target bacterial genes (e.g., 16S rRNA, SWG-9, COA) or resistance genes (e.g., OXA-23). | Custom designed from NCBI sequences [89] [86] |
| Positive Control DNA | Validates the performance of the PCR assay. Can be synthetic oligonucleotides or genomic DNA from target bacteria. | Microbial DNA Positive Control [87] |
| Droplet Generation Oil | Specific to ddPCR; used to create the water-in-oil emulsion for sample partitioning. | DG32 Droplet Generation Oil [88] |
| No-Template Control (NTC) | Critical for contamination monitoring; consists of DNase-free water instead of sample DNA. | Microbial DNA-Free Water [87] |
Evaluating Accuracy and Dynamic Range for Low-Abundance Targets
In the field of molecular biology, the accurate quantification of bacterial abundance is a cornerstone for advancing research in gut microbiome, infectious diseases, and therapeutic development. While next-generation sequencing (NGS) provides comprehensive community profiles, its semi-quantitative, compositional nature often obscures true biological changes in microbial loads [7]. For the precise absolute quantification of low-abundance targets, Quantitative Polymerase Chain Reaction (qPCR) and Droplet Digital PCR (ddPCR) have emerged as the leading technologies. This guide provides an objective, data-driven comparison of qPCR and ddPCR performance, focusing on their accuracy, dynamic range, and sensitivity for detecting low-abundance bacterial targets, particularly within complex sample matrices like human fecal samples.
The fundamental difference between these technologies lies in their approach to quantification. qPCR is a relative method, estimating target concentration by comparing amplification cycle numbers to those of a known standard curve. In contrast, ddPCR is an absolute method that partitions a sample into thousands of nanoliter-sized droplets, counts the positive and negative reactions after end-point amplification, and applies Poisson statistics to calculate the exact copy number without relying on external calibrators [90] [5]. This core distinction underlies many of the performance differences explored in this guide.
Performance Comparison: qPCR vs. ddPCR
Extensive comparative studies reveal that the choice between qPCR and ddPCR involves significant trade-offs in sensitivity, precision, cost, and throughput. The following table summarizes the key performance metrics based on experimental data from recent research.
Table 1: Comprehensive Performance Comparison between qPCR and ddPCR
| Performance Metric | qPCR | ddPCR |
|---|---|---|
| Principle of Quantification | Relative (requires standard curve) [90] | Absolute (direct counting via Poisson statistics) [90] [5] |
| Dynamic Range | Wide (6-7 orders of magnitude) [90] | Narrower [90] |
| Sensitivity (LOD/LOQ) | Limit of Detection (LOD) for L. reuteri: ~103-104 cells/g feces [7] [20] | Lower Limit of Quantification (LOQ); more precise at low concentrations [5] [20] |
| Precision at Low Target Levels | Higher variability (CV) for Cq ≥ 29 [16] | Superior precision and reproducibility for low-abundance targets [16] [5] |
| Tolerance to PCR Inhibitors | Sensitive to inhibitors in samples [90] | High resistance; partitioning dilutes inhibitors [90] [5] |
| Throughput | High (96- or 384-well plates) [90] | Lower [90] |
| Cost and Time per Reaction | ~3x cheaper and faster (2.5 h vs. 6.5 h) [20] | Higher cost per reaction and more time-consuming [90] [20] |
Analysis of Key Performance Differences
- Dynamic Range and Sensitivity: qPCR's broader dynamic range makes it suitable for samples with target concentrations varying widely [90]. However, when targets are scarce, ddPCR excels. For instance, in quantifying Xanthomonas citri, ddPCR demonstrated a significantly higher degree of sensitivity [5]. Similarly, for gene expression analysis, ddPCR produced more precise and statistically significant data than qPCR when target levels were low (Cq ≥ 29) [16].
- Precision and Resistance to Inhibitors: The partitioning step in ddPCR not only enables absolute quantification but also enhances its robustness. Each droplet acts as a separate reaction vessel, effectively diluting out PCR inhibitors present in the sample. This makes ddPCR particularly advantageous for complex samples like feces, soil, or clinical specimens [90] [5]. One study noted that ddPCR showed better reproducibility than qPCR with some DNA extraction methods, though performance was comparable with optimized kit-based protocols [20].
- Practical Considerations: Cost and Workflow: The operational cost and throughput are major practical differentiators. qPCR is a more established, cost-effective, and higher-throughput technology, making it ideal for routine screening and large-scale studies [90]. A direct comparison found that ddPCR was three times more expensive and required significantly more hands-on time (6.5 hours versus 2.5 hours) than qPCR [20].
Experimental Protocols for Absolute Bacterial Quantification
To ensure reproducible and publication-quality data, following detailed and validated protocols is essential. The methods below are adapted from recent studies that successfully quantified bacterial strains in human fecal samples.
DNA Extraction from Fecal Samples
The choice of DNA extraction method critically impacts DNA yield, purity, and subsequent PCR accuracy. The following kit-based method has been validated for optimal recovery of bacterial cells from feces [7] [20].
- Sample Washing: Weigh 0.1 g of stool sample and wash it with ice-cold PBS buffer by vortexing and centrifugation (8,000 × g for 5 min at 4°C). Repeat the wash three times.
- Cell Lysis: Resuspend the final cell pellet in 100 µL of a commercial lysis buffer (e.g., from the QIAamp Fast DNA Stool Mini Kit). Incubate the suspension at 37°C for 30 minutes.
- Inhibitor Removal: Add 1 mL of Buffer InhibitEX (or equivalent) to the lysate, vortex thoroughly, and incubate at room temperature to adsorb and remove PCR inhibitors.
- DNA Purification: Complete the DNA isolation by following the manufacturer's instructions for the kit, including any final elution steps.
Absolute Quantification via qPCR
This protocol is designed for absolute quantification using a standard curve [7].
- Primer Design: Design strain-specific primers using a database approach to identify unique genomic regions. In silico and empirical testing against non-target strains is crucial for specificity [7].
- Standard Curve Preparation: Create a standard curve using a serial dilution of known target concentration (e.g., gBlock gene fragments or linearized plasmid DNA containing the target sequence). The curve should span 6-7 log dilutions.
- qPCR Reaction Setup:
- Master Mix: 2.5 µL PCR buffer (10X), 1.5 µL MgCl₂ (25 mM), 0.5 µL dNTPs (10 mM), 0.5 µL each of forward and reverse primer (10 µM), 0.25 µL Taq polymerase (5 U/µL), and nuclease-free water to a final volume of 20 µL [5].
- Template: Add 1-5 µL of extracted DNA sample or standard.
- Run Protocol: Perform amplification with an initial denaturation at 95°C for 3 min, followed by 40 cycles of 95°C for 10 s, 60°C for 30 s, and 72°C for 30 s, with fluorescence acquisition.
- Data Analysis: Plot the Cq values of the standards against the log of their known concentrations to generate a standard curve. Use the curve's equation to calculate the absolute concentration of target DNA in unknown samples.
Absolute Quantification via ddPCR
This protocol outlines the transfer of a qPCR assay to a ddPCR format [5].
- Reaction Mixture Preparation: Prepare a PCR reaction mix similar to the qPCR assay, using the same primers and probe. The final volume should be adjusted to the specifications of the ddPCR system (e.g., 20 µL for a Bio-Rad QX200 system).
- Droplet Generation: Load the reaction mixture into a DG8 cartridge along with droplet generation oil. Use a droplet generator to partition the sample into ~20,000 nanoliter-sized droplets.
- PCR Amplification: Transfer the emulsified samples to a 96-well plate and perform PCR amplification on a thermal cycler to endpoint (typically 40 cycles).
- Droplet Reading and Analysis: Place the plate in a droplet reader, which counts the fluorescent positive and negative droplets.
- Absolute Quantification: The concentration of the target DNA (in copies/µL) is calculated directly by the instrument's software using Poisson statistics, which accounts for the fraction of positive droplets.
The following workflow diagram visualizes the key procedural differences between the two technologies.
The Scientist's Toolkit: Essential Research Reagents and Materials
Successful quantification relies on a suite of reliable reagents and materials. The following table details key solutions used in the featured protocols.
Table 2: Key Research Reagent Solutions for Absolute Bacterial Quantification
| Reagent/Material | Function | Example Use Case & Notes |
|---|---|---|
| Kit-based DNA Extraction Kits (e.g., QIAamp Fast DNA Stool Mini Kit) | Isolation of high-purity, inhibitor-free genomic DNA from complex samples. | Superior for fecal samples; outperforms phenol-chloroform in inhibitor removal and DNA quality for PCR [7] [20]. |
| Strain-Specific Primers | Enables precise targeting of the bacterial strain of interest. | Designed from unique genomic markers; critical for distinguishing between closely related strains in a community [7]. |
| Linearized Plasmid DNA or gBlocks | Serves as a quantitative standard for creating a calibration curve in qPCR. | Must contain the exact target amplicon sequence. Accuracy is paramount for reliable qPCR data [5]. |
| Droplet Generation Oil & Cartridges | Creates the water-in-oil emulsion necessary for partitioning samples in ddPCR. | Specific to the ddPCR platform (e.g., Bio-Rad QX200). Essential for generating a stable population of droplets [5]. |
| Probe-based Master Mix (ddPCR) | Contains DNA polymerase, dNTPs, and buffer optimized for digital PCR applications. | Hydrolysis probes (e.g., TaqMan) are commonly used for specific detection in both qPCR and ddPCR [5]. |
The decision between qPCR and ddPCR for the absolute quantification of low-abundance bacterial targets is not a matter of one technology being universally superior, but rather of selecting the right tool for the specific research question and context.
- Choose qPCR when working with medium-to-high abundance targets, when the study demands high throughput and cost-effectiveness, and when a well-characterized standard is available. It remains the workhorse for many routine quantification tasks in molecular biology [90].
- Choose ddPCR when the highest level of precision and sensitivity is required for low-abundance or rare targets, when detecting small fold-changes (e.g., <2-fold) is critical, or when working with samples prone to PCR inhibition that could compromise qPCR accuracy [90] [16] [5].
For comprehensive microbiome studies, a hybrid approach is often most powerful: using qPCR for initial, broad screening of large sample sets and deploying ddPCR for follow-up, in-depth quantification of key, low-abundance targets of interest. By understanding their respective strengths and limitations as outlined in this guide, researchers can strategically employ these technologies to generate robust, publication-quality data in the field of absolute bacterial quantification.
The accurate quantification of specific bacterial strains in clinical trial samples is a cornerstone of probiotic research, enabling scientists to validate colonization, monitor survival, and establish dose-response relationships. While next-generation sequencing (NGS) has revolutionized microbial community analysis, its data is compositional and semi-quantitative, limiting its utility for absolute quantification [7]. Quantitative PCR (qPCR) and droplet digital PCR (ddPCR) have emerged as powerful techniques for the precise, strain-specific tracking of probiotics. This case study directly compares these two PCR technologies within the context of a clinical trial setting, evaluating their performance in quantifying Limosilactobacillus reuteri strains in human fecal samples to determine the optimal approach for probiotic research and development [7].
Experimental Findings: qPCR vs. ddPCR Performance
A systematic comparison of qPCR and ddPCR was conducted using human fecal samples spiked with known quantities of L. reuteri and samples from a human intervention trial [7]. The following table summarizes the key performance metrics derived from this and other supporting studies.
Table 1: Direct comparison of qPCR and ddPCR performance for bacterial quantification in complex samples.
| Performance Metric | qPCR | ddPCR | Context and Implications |
|---|---|---|---|
| Limit of Detection (LOD) | ~103 to 104 cells/g feces [7] | Improved LOD for low targets (e.g., 1.76 log10 improvement for lactobacilli) [51] | ddPCR offers superior sensitivity for detecting low-abundance strains, crucial for tracking persistence. |
| Dynamic Range | Wider dynamic range [7] [5] | Narrower dynamic range compared to qPCR [5] | qPCR is better suited for quantifying targets across a wide concentration span. |
| Precision & Reproducibility | Good reproducibility [7] | Better reproducibility and lower Coefficient of Variation (CV), especially for low targets [7] [5] [91] | ddPCR provides more precise measurements for low-level quantification, reducing variability. |
| Tolerance to PCR Inhibitors | Susceptible to inhibitors in fecal samples, affecting reaction efficiency [7] [16] | Higher tolerance to inhibitors found in complex matrices like stool [16] [5] | ddPCR is more robust for direct analysis of complex clinical samples without extensive dilution. |
| Quantification Method | Relies on external standard curves [7] [5] | Absolute quantification without standard curves using Poisson statistics [5] [91] | ddPCR eliminates variability from standard curve construction and is inherently absolute. |
| Cost & Throughput | Cheaper and faster [7] | Higher cost per sample, but potentially higher throughput in some setups [91] | qPCR is more accessible for high-volume screening where ultimate precision is not critical. |
Experimental Protocols
Strain-Specific qPCR Assay for Probiotic Quantification
The following step-by-step protocol was optimized for the absolute quantification of bacterial strains in fecal samples [7].
- Step 1: Primer Design. Begin with whole-genome sequences of the target probiotic strain and related strains. Identify unique genomic regions specific to the target strain. Design primers with stringent criteria for specificity, and verify in silico against public databases [7].
- Step 2: DNA Extraction. Use a kit-based DNA isolation method (e.g., QIAamp Fast DNA Stool Mini Kit) from fecal samples. Incorporate a washing step with ice-cold PBS to remove PCR inhibitors. Validate DNA purity spectrophotometrically [7].
- Step 3: qPCR Setup and Execution. Perform reactions in a final volume of 20 µL containing the recommended master mix, primers, and template DNA. Use thermal cycling conditions with combined annealing/extension at 60°C. Include a no-template control and a standard curve in each run, with the standard curve prepared from a known concentration of the target strain's genomic DNA [7] [5].
- Step 4: Data Analysis. Calculate the target concentration in unknown samples by comparing their quantification cycle (Cq) values to the standard curve. Express the final results as cells per gram of feces [7].
Viable ddPCR Quantification with PMA Treatment
This protocol leverages ddPCR for the enhanced quantification of viable probiotic cells, incorporating a viability dye [51].
- Step 1: Sample Treatment with Propidium Monoazide (PMA). Resuspend fecal samples in PBS and treat with PMA. PMA selectively penetrates membrane-compromised (dead) cells and cross-links to their DNA upon light exposure, inhibiting its amplification. Optimize PMA concentration and sample biomass for accurate live/dead discrimination [51].
- Step 2: DNA Extraction. Proceed with DNA extraction using a kit-based method, as described in the qPCR protocol [7] [51].
- Step 3: Droplet Digital PCR Setup. Partition each 20 µL PCR reaction mixture, containing DNA, primers, and probe, into approximately 20,000 nanoliter-sized droplets. Perform endpoint PCR amplification on the droplet emulsion [5] [51].
- Step 4: Droplet Reading and Quantification. After amplification, read each droplet in a droplet reader. Set a fluorescence amplitude threshold to classify droplets as positive (containing the target) or negative. The absolute concentration of the target DNA (copies/µL) is calculated directly from the fraction of positive droplets using Poisson statistics, without a standard curve [5] [51].
Workflow Visualization
The following diagram illustrates the logical relationship and key decision points in the parallel experimental workflows for qPCR and ddPCR in this case study.
The Scientist's Toolkit: Essential Research Reagents
The table below details key reagents and their critical functions in the described experiments.
Table 2: Key research reagents and their functions in probiotic quantification assays.
| Reagent / Solution | Function | Application Context |
|---|---|---|
| Strain-Specific Primers | Amplify a unique genomic region of the target probiotic strain for specific detection. | Essential for both qPCR and ddPCR to distinguish the administered strain from the native microbiota [7]. |
| Propidium Monoazide (PMA) | Viability dye; penetrates dead cells and binds DNA, preventing its amplification during PCR. | Used in viable ddPCR (and viable qPCR) to quantify only live cells, providing a more accurate measure of active probiotics [51]. |
| Kit-Based DNA Lysis Buffer | Breaks down bacterial cell walls and stabilizes nucleic acids for extraction from complex samples. | Critical first step for both protocols; kit-based methods were shown to provide better reproducibility for fecal samples [7]. |
| Hydrolysis (TaqMan) Probe | Fluorescently labeled probe that increases specificity by requiring binding to an internal sequence. | Used in the referenced ddPCR [5] and can be used in qPCR assays for enhanced specificity over intercalating dyes. |
| Digital PCR Oil & Cartridges | Creates the water-in-oil emulsion necessary for partitioning the sample into thousands of droplets. | Required consumables unique to the ddPCR platform [5]. |
| External DNA Standard | A sample of known concentration used to construct the calibration curve for relative quantification. | Fundamental for absolute quantification by qPCR; not required for ddPCR [7] [5]. |
This case study directly compares the performance of Digital PCR (dPCR) and quantitative real-time PCR (qPCR) for the absolute quantification of key periodontal pathogens in subgingival plaque samples. The analysis is framed within the broader thesis that dPCR offers superior technical capabilities for specific research and diagnostic applications requiring high sensitivity and absolute quantification without standard curves. A recent 2025 comparative study provides critical experimental data, demonstrating that a multiplex dPCR assay showed lower intra-assay variability and significantly improved detection of low-abundance pathobionts compared to qPCR, leading to a fivefold higher estimation of Aggregatibacter actinomycetemcomitans prevalence in periodontitis patients [92]. These findings have profound implications for microbiological research and the development of personalized treatment strategies in periodontal therapy.
The accurate detection and quantification of specific bacterial species in complex microbial communities like subgingival plaque are fundamental to advancing our understanding of periodontal disease etiology and progression. For years, qPCR has been the gold standard for such molecular analyses, valued for its speed, sensitivity, and specificity [37]. However, qPCR is a relative quantification method, requiring standard curves for absolute quantification, and its performance can be hampered by PCR inhibitors commonly found in clinical samples [37] [93].
dPCR, particularly droplet digital PCR (ddPCR), represents a significant methodological evolution. Its core principle is sample partitioning—dividing a single PCR reaction into thousands of nanoliter-sized droplets, each functioning as an individual reaction vessel [93]. After end-point amplification, the droplets are analyzed to count those that are positive (containing the target sequence) and negative (without the target). This allows for absolute quantification of the target nucleic acid without the need for standard curves, using Poisson statistics [93] [94]. This technical difference underpins the hypothesis that dPCR may offer enhanced robustness, precision, and sensitivity for challenging diagnostic applications.
Experimental Comparison: dPCR vs. qPCR for Periodontal Pathobionts
Study Design and Methodology
A 2025 study published in the Journal of Oral Microbiology conducted a direct head-to-head comparison of a multiplex dPCR assay and a qPCR assay for detecting major periodontal pathobionts [92].
- Objective: To evaluate the analytical and diagnostic performance of dPCR versus qPCR for the simultaneous detection and quantification of Porphyromonas gingivalis, Aggregatibacter actinomycetemcomitans, and Fusobacterium nucleatum [92].
- Sample Source: Subgingival plaque samples were collected from 20 periodontitis patients and 20 periodontically healthy controls [92].
- Analytical Parameters: The study compared dynamic range linearity, precision (intra-assay variability), accuracy, prevalence, sensitivity, specificity, and concordance between the two techniques. Statistical analyses included the Mann-Whitney U test, Wilcoxon test, McNemar's test, and Bland-Altman plots [92].
The fundamental workflow differences between the two technologies in the context of this experiment are illustrated below.
Key Performance Data and Quantitative Results
The experimental data revealed clear and significant differences in the performance of the two platforms.
Table 1: Comparative Performance Metrics of dPCR vs. qPCR from Clinical Sample Analysis [92]
| Performance Parameter | dPCR Performance | qPCR Performance | Statistical Significance & Notes |
|---|---|---|---|
| Linearity (R²) | > 0.99 | Not explicitly stated (Assumed high) | Both methods showed high linearity. |
| Intra-assay Precision (Median CV%) | 4.5% | Higher than dPCR | p = 0.020; dPCR demonstrated significantly lower variability. |
| Sensitivity (Detection of Low Bacterial Loads) | Superior | Lower | dPCR detected lower loads, particularly for P. gingivalis and A. actinomycetemcomitans. |
| Quantitative Agreement | Good at medium/high loads | Good at medium/high loads | Major discrepancies occurred at low concentrations (< 3 log10 Geq/mL). |
| Impact on Pathogen Prevalence | Higher estimated prevalence | Lower estimated prevalence | qPCR resulted in false negatives and a 5-fold underestimation of A. actinomycetemcomitans prevalence. |
| Absolute Quantification | Yes, without standard curves | Requires a standard curve | dPCR's absolute count is a fundamental technical advantage [37] [93]. |
Table 2: General Technical Comparison of dPCR and qPCR [37] [93]
| Technical Characteristic | dPCR / ddPCR | qPCR |
|---|---|---|
| Quantification Type | Absolute | Relative (requires standard curve for absolute) |
| Tolerance to PCR Inhibitors | High | Low to Moderate |
| Dependence on Amplification Efficiency | Low (End-point measurement) | High (Exponential phase measurement) |
| Detection of Rare Alleles/Mutations | ≥ 0.1% [37] | > 1% [37] |
| Precision | Higher for small fold changes [93] | Lower for small fold changes |
| Dynamic Range | Broad, but best for precise quantification | Very Broad, suitable for wide concentration ranges |
Analysis of Experimental Outcomes
The data from this case study strongly supports the superiority of dPCR for applications demanding high precision and sensitivity to low-abundance targets. The 5-fold underestimation of A. actinomycetemcomitans by qPCR is a critical finding, as this pathogen is strongly implicated in aggressive forms of periodontitis [92] [95]. This underestimation likely stems from qPCR's inability to reliably distinguish signal from noise at very low target concentrations, a limitation overcome by dPCR's partitioning and binary end-point readout [37] [93].
The significantly lower intra-assay variability (4.5% median CV) of dPCR further highlights its robustness, making it particularly suitable for longitudinal studies and applications requiring high reproducibility across laboratories [92]. The Bland-Altman analysis confirmed that while both methods agree well for medium and high bacterial loads, dPCR excels in the low-concentration range where qPCR begins to fail, producing false-negative results [92].
The Scientist's Toolkit: Essential Research Reagents and Materials
Successfully implementing dPCR or qPCR for pathogen detection requires a suite of specific reagents and instruments. The following table details key solutions used in the featured experiments and the broader field.
Table 3: Key Research Reagent Solutions for Periodontal Pathogen Detection via PCR
| Item | Function / Description | Example in Context |
|---|---|---|
| dPCR/ddPCR System | Instrument for partitioning, thermocycling, and reading partitions. | QIAcuity (nanoplate-based dPCR) [37]; Bio-Rad QX200/QX ONE (ddPCR) [96] [94]. |
| qPCR System | Real-time thermocycler with fluorescence detection. | Applied Biosystems QuantStudio 7 Flex/Pro [96]. |
| PCR Master Mix | Optimized buffer, enzymes, and dNTPs for efficient amplification. | Probe Supermix for ddPCR [94]; TaqMan Universal Mastermix for qPCR [94]. |
| Sequence-Specific Probes & Primers | Oligonucleotides designed to bind and detect target pathogen DNA. | TaqMan probes and primers for P. gingivalis, A. actinomycetemcomitans, etc. [92] [95]. |
| DNA Extraction Kits | For purifying high-quality, inhibitor-free genomic DNA from plaque. | CTAB-based extraction method [94]; various commercial kits for stool/microbiome samples [24]. |
| Sterile Paper Points | Clinical tool for collecting subgingival plaque samples. | Standardized sampling protocol using paper points inserted into periodontal pockets [95]. |
This case study provides compelling evidence that dPCR outperforms qPCR in the detection and quantification of periodontal pathogens in subgingival plaque, particularly at low concentrations. The enhanced sensitivity, precision, and ability for absolute quantification without standard curves position dPCR as a powerful tool for redefining the microbial ecology of periodontal diseases [92].
For researchers and drug development professionals, these findings are highly significant. The ability to accurately profile the subgingival microbiome, including low-abundance but clinically relevant pathobionts, can lead to:
- Improved Diagnostic Accuracy: Reducing false negatives leads to a more accurate assessment of a patient's microbial risk [92] [95].
- Personalized Treatment Strategies: Precise quantification allows for better monitoring of pathogen levels before and after treatment, enabling more tailored antibiotic or probiotic regimens [95].
- Enhanced Clinical Research: The robustness and reproducibility of dPCR support the generation of higher-quality, comparable data across multiple research centers [37] [92].
While qPCR remains a versatile and high-throughput technology for many applications, dPCR is fundamentally changing the questions scientists can answer, proving to be the more precise and reliable technology for absolute bacterial quantification in complex samples like subgingival plaque [37] [92].
This guide provides an objective comparison between quantitative PCR (qPCR) and droplet digital PCR (ddPCR) to inform decision-making for absolute bacterial quantification in research. The analysis focuses on throughput, financial expense, and day-to-day operational factors, supported by experimental data.
Quantitative PCR (qPCR) is a well-established method that monitors the amplification of DNA in real-time using fluorescent reporters. The quantification cycle (Cq), the point at which the fluorescence crosses a threshold, is used to determine the initial template concentration by comparing it to a standard curve [1]. Droplet Digital PCR (ddPCR), a more recent technology, takes a different approach by partitioning a PCR reaction into thousands of nanoliter-sized droplets. Each droplet acts as an individual PCR microreactor. After endpoint amplification, the droplets are analyzed to count the positive and negative reactions, allowing for absolute quantification of the target DNA using Poisson statistics, without the need for a standard curve [1] [37].
The fundamental workflow differences are illustrated below:
Performance and Cost Data Comparison
The choice between qPCR and ddPCR involves trade-offs between performance, cost, and operational requirements. The following table summarizes the key comparative metrics based on current literature and commercial systems.
| Feature | qPCR | ddPCR |
|---|---|---|
| Quantification Method | Relative, requires a standard curve [1] | Absolute, using Poisson statistics; no standard curve needed [1] [37] |
| Typical Run Time | ~2.5 hours (for 40 cycles) [20] | ~6.5 hours (including partitioning and reading) [20] |
| Theoretical Throughput | High (384-well plates standard) [60] | Moderate (96-well plates common) [60] |
| Effective Throughput | High, but may require many replicates for precision [1] | Moderate, but high precision can reduce replicate needs [1] |
| Instrument Cost | Lower [1] | Higher [1] |
| Cost per Reaction | Lower (less reagent volume, no partitioning consumables) [20] [60] | Higher (3x more expensive than qPCR in one study) [20] |
| Precision & Reproducibility | Good; can resolve ~2-fold differences [1] | Excellent; lower coefficient of variation (CV), higher inter-lab reproducibility [1] [70] [13] |
| Sensitivity (Limit of Detection) | ~104 cells/gram feces for L. reuteri [7] | Can be lower; <104 cells/gram feces for L. reuteri [7] [20] |
| Tolerance to Inhibitors | Lower; efficiency affected by sample contaminants [1] [16] | Higher; partitioning dilutes inhibitors, making it more robust [1] [13] [60] |
| Ease of Use | Established, familiar protocol [1] | Requires training for partitioning step; but analysis is straightforward [1] [37] |
A direct comparison for quantifying Lactobacillus reuteri in human feces highlights these trade-offs. ddPCR demonstrated slightly better reproducibility and a lower limit of quantification with certain DNA extraction methods. However, qPCR provided a wider dynamic range and was significantly cheaper and faster [7] [20].
Experimental Protocols for Bacterial Quantification
The following are generalized protocols for quantifying absolute abundance of bacteria, such as L. reuteri, in complex matrices like fecal samples.
Protocol 1: Absolute Quantification by qPCR
This protocol is adapted from methods used in recent microbiome studies [7] [24].
- DNA Extraction: Isolate total genomic DNA from fecal samples using a kit-based method (e.g., QIAamp Fast DNA Stool Mini Kit). Include a mechanical lysis step (e.g., bead beating) for robust bacterial cell disruption. Determine DNA concentration and purity using a spectrophotometer.
- Standard Curve Preparation: Create a standard curve using a known quantity of the target bacterial strain.
- Grow the pure culture of the target bacterium (e.g., L. reuteri) and determine the cell count via quantitative plating.
- Serially dilute the genomic DNA extracted from this culture (e.g., 10-fold dilutions) to create a standard curve spanning a range of expected concentrations in test samples.
- qPCR Reaction Setup:
- Reaction Mix: Combine ~50 ng of fecal DNA template, forward and reverse primers (e.g., 400 nM each), and a qPCR master mix containing DNA polymerase, dNTPs, and a fluorescent dye (e.g., SYBR Green) or probe (e.g., TaqMan).
- Run Conditions: Program the thermocycler with an initial denaturation (e.g., 95°C for 5 min), followed by 40 cycles of denaturation (e.g., 95°C for 15 sec) and annealing/extension (e.g., 60°C for 1 min). Fluorescence is acquired at the end of each cycle.
- Data Analysis: The qPCR software generates a standard curve by plotting the Cq values against the logarithm of the known template concentrations in the standards. The absolute concentration of the target in unknown samples is calculated by interpolating their Cq values against this curve.
Protocol 2: Absolute Quantification by ddPCR
This protocol outlines the key steps for ddPCR, which shares initial steps with qPCR but diverges in amplification and analysis [7] [24].
- DNA Extraction and Standard Preparation: Perform steps 1 and 2 as described in the qPCR protocol. A standard curve is not required for absolute quantification in ddPCR, but a positive control is essential.
- ddPCR Reaction Setup and Partitioning:
- Reaction Mix: Prepare a similar reaction mix to qPCR, using a master mix and supermix compatible with droplet formation.
- Droplet Generation: Load the reaction mix into a droplet generator. This instrument partitions each sample into approximately 20,000 nanoliter-sized water-in-oil droplets.
- PCR Amplification: Transfer the droplets to a 96-well plate and run a standard endpoint PCR protocol on a thermal cycler (e.g., 40 cycles).
- Droplet Reading and Analysis:
- Reading: Place the plate in a droplet reader, which sequentially aspirates each sample and flows the droplets single-file past a fluorescent detector.
- Analysis: The software counts the number of fluorescence-positive and negative droplets. Using Poisson distribution statistics, it directly calculates the absolute concentration of the target DNA in copies per microliter of the original reaction mix, with no need for a standard curve.
Research Reagent Solutions and Materials
A successful PCR-based quantification experiment relies on several key components. The table below details essential materials and their functions.
| Item | Function | Application Notes |
|---|---|---|
| Strain-Specific Primers | Amplify a unique genomic region of the target bacterial strain. | Essential for strain-level quantification; must be designed and validated for specificity [7]. |
| Probe-based Master Mix | Contains Taq polymerase, dNTPs, buffer, and a fluorescent probe for target-specific detection. | Preferred for multiplexing and specific detection in complex samples [60]. |
| SYBR Green Master Mix | Contains Taq polymerase, dNTPs, buffer, and a dye that fluoresces upon binding double-stranded DNA. | Cost-effective; requires melt curve analysis to confirm amplicon specificity [13]. |
| Droplet Generation Oil & Supermix | Specialized oil and PCR reagent mix for stable, uniform droplet formation. | Specific to ddPCR systems; critical for robust partitioning [60]. |
| DNA Extraction Kit (Stool) | For isolating high-quality, inhibitor-free genomic DNA from complex samples. | Kit-based methods (e.g., QIAamp, Protocol Q) are recommended for reproducibility and inhibitor removal [7] [20]. |
| Nuclease-Free Water | A pure, enzyme-free solvent for preparing all reaction mixes. | Prevents degradation of primers, probes, and template DNA. |
The decision between qPCR and ddPCR for absolute bacterial quantification is not one-size-fits-all and hinges on the specific priorities of the research project.
- Choose qPCR if: Your project demands high throughput and lower cost per sample, and your target abundance is sufficiently high. It is ideal for rapid screening of a large number of samples and when a well-characterized standard is available [1] [7] [60].
- Choose ddPCR if: Your research requires maximum precision, sensitivity for low-abundance targets, and absolute quantification without a standard curve. Its robustness to inhibitors also makes it superior for analyzing complex environmental or fecal samples where PCR efficiency can be variable [1] [7] [13].
This cost-benefit analysis underscores that qPCR remains the workhorse for high-throughput, cost-sensitive applications, while ddPCR offers a powerful tool for applications where precision, accuracy, and sensitivity are paramount.
In the field of bacterial quantification and research, the choice between quantitative real-time PCR (qPCR) and droplet digital PCR (ddPCR) represents a critical methodological crossroads. While both technologies amplify and detect nucleic acids, their underlying principles, performance characteristics, and suitability for specific applications differ substantially [37] [1]. This guide provides an objective comparison of these technologies, supported by experimental data, to help researchers and drug development professionals select the optimal platform for absolute bacterial quantification.
The fundamental distinction lies in their approach to quantification. qPCR is a well-established technology that monitors DNA amplification in real-time through fluorescent signals, requiring standard curves for relative quantification [1] [60]. In contrast, ddPCR employs a digital approach by partitioning samples into thousands of nanoreactions, enabling absolute quantification through Poisson statistics without external calibrators [88] [1]. This methodological difference creates a cascade of implications for precision, sensitivity, tolerance to inhibitors, and practical implementation in research settings.
Technical Comparison: How qPCR and ddPCR Measure Differently
Fundamental Working Principles
Quantitative PCR (qPCR) operates through a bulk reaction approach where fluorescence is measured after each PCR cycle. The point at which the fluorescence intensity increases above detectable levels (the quantification cycle or Cq) is proportional to the initial number of template DNA molecules in the sample [1]. This relationship between Cq and target concentration can be influenced by numerous factors including target sequence, background composition, PCR chemistry, primer efficiency, probe intensity, and the specific qPCR instrument used [1]. quantification relies on comparison to standard curves constructed from serial dilutions of known concentrations, introducing potential variables in accuracy and reproducibility between laboratories [1].
Droplet Digital PCR (ddPCR) fundamentally changes this paradigm through sample partitioning. The technique divides a PCR reaction into thousands to millions of nanoliter-sized droplets, each functioning as an individual PCR microreactor [88] [1]. After endpoint amplification, each droplet is analyzed for fluorescence to determine if it contains the target sequence (positive) or not (negative). The ratio of positive to total partitions allows for absolute quantification of the target nucleic acid using Poisson distribution statistics, completely eliminating the need for standard curves [88] [1]. This partitioning enriches targets from background, improving amplification efficiency and tolerance to inhibitors present in complex samples like bacterial lysates [1].
Visualizing Workflow Differences
The diagram below illustrates the fundamental workflow differences between these two technologies:
Figure 1: Workflow comparison between qPCR and ddPCR technologies
Performance Comparison: Experimental Data Analysis
Quantitative Performance Metrics
Multiple studies have directly compared the performance characteristics of qPCR and ddPCR across various parameters critical to bacterial quantification research. The table below summarizes key comparative metrics:
Table 1: Performance comparison between qPCR and ddPCR technologies
| Parameter | qPCR | ddPCR | Experimental Support |
|---|---|---|---|
| Quantification Method | Relative (requires standard curve) | Absolute (Poisson statistics) | [37] [1] [60] |
| Precision | Resolves ~2-fold differences | Higher precision, lower CV | [16] [1] [91] |
| Sensitivity (Mutation Detection) | >1% mutation rate | ≥0.1% mutation rate | [37] |
| Inhibitor Tolerance | Prone to PCR inhibitors | Higher tolerance to inhibitors | [37] [1] [60] |
| Dynamic Range | Broad (5+ logs) | Limited by partition count | [1] [60] |
| Sample Throughput | High (384-well format) | Moderate (up to 96 samples) | [1] [60] |
| Multiplexing Capability | Limited by fluorescence channels | Enhanced through concentration-based | [1] |
| Cost Considerations | Lower instrument cost, requires standards | Higher instrument cost, no standards needed | [1] [60] |
Experimental Evidence in Diagnostic Applications
Clinical studies provide compelling data on the performance differences between these technologies. In tuberculosis diagnostics, a systematic review and meta-analysis of 14 studies comprising 1,672 participants found that while qPCR showed higher sensitivity (0.66 vs. 0.56), ddPCR demonstrated superior discriminant capacity with a higher area under the ROC curve (0.97 vs. 0.94, p = 0.002) [97]. This difference was particularly pronounced for extrapulmonary tuberculosis, where ddPCR's partitioning technology provided significant advantages in detecting low bacterial loads in paucibacillary specimens [97].
For febrile hematological patients at high risk of bloodstream infections, ddPCR demonstrated remarkable performance in a 2025 study. The technology detected 113 pathogens in 72 plasma samples compared to only 39 pathogens identified by conventional microbiological testing (p < 0.0001) [88]. The turnaround time for pathogenic diagnosis was significantly shorter with ddPCR compared to conventional methods (p < 0.0001), and anti-infective treatment strategies were successfully adjusted for 30 patients based on positive ddPCR results, with 86.7% demonstrating treatment effectiveness [88].
Application-Specific Decision Framework
Decision Pathway for Bacterial Quantification Applications
The diagram below provides a structured decision framework for selecting the appropriate technology based on specific research requirements:
Figure 2: Decision framework for selecting between qPCR and ddPCR technologies
Application-Specific Recommendations
Recommended qPCR Applications
High-Throughput Bacterial Screening: qPCR's 384-well format and established automation capabilities make it ideal for large-scale screening studies [1] [60]. The technology efficiently processes numerous samples simultaneously, providing cost-effective analysis for surveillance studies, environmental monitoring, and clinical diagnostics with known, abundant targets.
Gene Expression Analysis in Bacterial Cultures: When studying bacterial gene expression under different conditions, qPCR's broad dynamic range efficiently quantifies both low and highly expressed genes in the same reaction [60]. The relative quantification approach suffices for comparing expression levels across experimental conditions.
Whole Genome Analysis: qPCR accommodates the extensive dynamic range required for analyzing different genomic regions with varying copy numbers in bacterial genomes [60]. This capability is particularly valuable for studies of gene dosage effects, plasmid copy number variations, and chromosomal duplications.
Recommended ddPCR Applications
Absolute Bacterial Load Quantification: ddPCR excels at providing absolute quantification of bacterial copy numbers without standard curves, essential for precise microbial load determination in clinical samples, environmental specimens, and pharmaceutical quality control [88] [1] [60].
Detection of Rare Bacterial Variants: For detecting minor bacterial populations—such as antibiotic-resistant subpopulations, engineered constructs in mixed communities, or low-abundance pathogens in complex backgrounds—ddPCR's partitioning technology provides superior sensitivity down to 0.1% mutation rates [37] [1] [60].
Analysis of Inhibitor-Rich Samples: Environmental samples (soil, wastewater), clinical specimens (blood, stool), and processed food samples often contain PCR inhibitors that compromise qPCR efficiency. ddPCR's partitioning dilutes inhibitors across reactions, maintaining robust quantification where qPCR might fail [1] [60].
Copy Number Variation in Bacterial Genomes: Determining precise plasmid copy numbers, chromosomal amplifications, or gene duplications benefits from ddPCR's absolute quantification and precision, particularly for small fold-changes below the detection limit of qPCR [37] [1].
Experimental Protocols for Bacterial Quantification
Sample Processing and Nucleic Acid Extraction
Protocol for Bacterial DNA Extraction from Complex Matrices [88] [98]
Sample Collection: Collect 5-10 ml of sample (blood, culture media, environmental sample) in appropriate collection tubes. For stool samples, use 0.1 g solid or 200 µl liquid specimen [98].
Centrifugation: Centrifuge at 1,600×g for 15 minutes at 4°C to separate cellular debris from supernatant [88].
Nucleic Acid Extraction: Extract DNA using commercial extraction kits (e.g., VIASURE RNA-DNA Extraction Kit, Auto-Pure nucleic acid purification Instrument) according to manufacturer's instructions [88] [98].
Elution: Elute nucleic acids in 100 µl elution buffer and store at -20°C until use [98].
Critical Considerations: For ddPCR applications, avoid excessive dilution as target concentration must fall within the dynamic range of partioning [1]. For qPCR, optimize dilution to minimize inhibitors while maintaining detectable target levels [16].
Reaction Setup:
- Prepare master mix containing:
- 10 µl of 2× qPCR master mix
- 1 µl of primer-probe mix (targeting genes such as invA for Salmonella, 16S rRNA for Campylobacter, or ail for Yersinia enterocolitica)
- 5 µl of template DNA
- Nuclease-free water to 20 µl final volume
- Prepare master mix containing:
Thermal Cycling Conditions:
- Initial denaturation: 95°C for 2 minutes
- 40 cycles of:
- Denaturation: 95°C for 15 seconds
- Annealing/Extension: 60°C for 60 seconds (with fluorescence acquisition)
Data Analysis:
- Generate standard curve using serial dilutions of known DNA concentrations
- Determine Cq values for unknown samples
- Calculate concentrations based on standard curve
Reaction Setup:
- Prepare reaction mixture containing:
- 10 µl of 2× ddPCR supermix
- 1 µl of primer-probe mix
- 5 µl of template DNA
- Nuclease-free water to 20 µl final volume
- Prepare reaction mixture containing:
Droplet Generation:
- Transfer reaction mixture to DG32 cartridge
- Generate droplets using droplet generator (20 minutes)
- Transfer droplets to 96-well PCR plate
PCR Amplification:
- Seal plate with foil
- Run thermal cycler with following conditions:
- Initial denaturation: 95°C for 10 minutes
- 40 cycles of:
- Denaturation: 94°C for 30 seconds
- Annealing/Extension: 60°C for 60 seconds
- Enzyme deactivation: 98°C for 10 minutes
Droplet Reading and Analysis:
- Read plate on droplet reader (30 minutes)
- Analyze using Poisson statistics software
- Results expressed as copies/µl with confidence intervals
Research Reagent Solutions for Bacterial Quantification
Table 2: Essential research reagents and materials for qPCR and ddPCR applications
| Reagent/Material | Function | Technology | Application Notes |
|---|---|---|---|
| Taq Polymerase | DNA amplification | Both | Thermostable enzyme essential for PCR; ddPCR shows better tolerance to partial inhibition [16] |
| Fluorescent Probes (FAM, HEX, VIC) | Target detection | Both | Sequence-specific binding and fluorescence emission; ddPCR enables better multiplexing [1] |
| Primer Sets | Target-specific amplification | Both | Must be validated for efficiency; qPCR requires 90-110% efficiency for reliable quantification [16] |
| Digital PCR Supermix | Partition stabilization | ddPCR | Formulated for stable droplet formation and endpoint fluorescence detection [88] |
| Droplet Generation Oil | Partition formation | ddPCR | Creates water-in-oil emulsion for nanoreactions [88] |
| qPCR Master Mix | Reaction optimization | qPCR | Contains additives for robust real-time amplification [98] |
| DNA Extraction Kits | Nucleic acid purification | Both | Critical for removing inhibitors; ddPCR more tolerant to residual contaminants [88] [98] |
| Standard Reference Materials | Calibration curves | qPCR | Essential for relative quantification; not required for ddPCR [1] [91] |
The choice between qPCR and ddPCR for bacterial quantification research depends fundamentally on the specific experimental requirements. qPCR remains the preferred technology for high-throughput applications, broad dynamic range needs, and established gene expression studies where relative quantification suffices [1] [60]. Its lower instrumentation costs and widespread adoption make it accessible for routine applications.
ddPCR provides distinct advantages for absolute quantification, rare variant detection, inhibitor-rich samples, and applications requiring high precision for small fold-changes [37] [88] [1]. The technology's ability to provide standard-free quantification and superior sensitivity positions it as increasingly valuable for clinical diagnostics, complex environmental samples, and rigorous research requiring absolute copy number determination.
As both technologies continue to evolve, emerging trends include the development of more automated ddPCR systems to increase throughput, reduced costs for digital PCR instrumentation, and integrated systems that combine the strengths of both technologies [4]. Researchers should regularly reassess their technology choices as the field advances, ensuring their methodological selections align with both current application needs and future research directions in bacterial quantification and analysis.
Conclusion
The choice between qPCR and ddPCR for absolute bacterial quantification is not one of superiority but of application-specific suitability. qPCR remains a powerful, cost-effective workhorse for high-throughput analyses where target abundance is moderate to high. In contrast, ddPCR excels in scenarios requiring superior sensitivity and precision for low-abundance targets, detection of subtle fold-changes, and analysis of complex, inhibitor-rich samples. Future directions point towards increased multiplexing capabilities, streamlined workflows, and the integration of these technologies with next-generation sequencing for comprehensive microbial analysis. By aligning platform strengths with experimental goals, researchers can unlock more robust, accurate, and impactful findings in biomedical and clinical research.
References
- 1. dPCR vs end-point qPCR vs PCR [https://www.qiagen.com/us/knowledge-and-support/knowledge-hub/bench-guide/pcr/digital-pcr/digital-pcr-vs-quantitative-pcr-vs-end-point-pcr]
- 2. Introduction & Historical Timelines [https://www.sigmaaldrich.com/US/en/technical-documents/technical-article/genomics/pcr/pcr-introduction-and-historical-timelines]
- 3. Droplet Digital for PCR of Pathogens Absolute Quantification [https://experiments.springernature.com/articles/10.1007/978-1-4939-2620-6_24?error=cookies_not_supported&code=8b6a2d9b-2ecf-4388-a001-df9a312bd81a]
- 4. PCR past, present and future - PMC [https://pmc.ncbi.nlm.nih.gov/articles/PMC7439763/]
- 5. Comparison of Droplet Digital PCR and Quantitative PCR Assays for Quantitative Detection of Xanthomonas citri Subsp. citri - PMC [https://www.ncbi.nlm.nih.gov/pmc/articles/PMC4948846/]
- 6. Comparison among the Quantification of Bacterial Pathogens by qPCR, dPCR, and Cultural Methods - PMC [https://www.ncbi.nlm.nih.gov/pmc/articles/PMC5487435/]
- 7. Highly accurate and sensitive absolute of quantification ... bacterial [https://microbiomejournal.biomedcentral.com/articles/10.1186/s40168-024-01881-2]
- 8. Comparison of microbial molecular diagnosis efficiency within unstable... [https://pmc.ncbi.nlm.nih.gov/articles/PMC10788361/]
- 9. of prokaryotes in the... | Nature Protocols Absolute quantification [https://www.nature.com/articles/s41596-025-01165-5?error=cookies_not_supported&code=b99561c0-aedf-419b-835a-32160fc656cb]
- 10. Absolute vs. Relative for Quantification qPCR [https://www.thermofisher.com/cl/en/home/life-science/pcr/real-time-pcr/real-time-pcr-learning-center/real-time-pcr-basics/absolute-vs-relative-quantification-real-time-pcr.html]
- 11. ChIP- qPCR Data Analysis [https://www.sigmaaldrich.com/GB/en/technical-documents/protocol/genomics/qpcr/chip-qpcr-data-analysis]
- 12. Comparison of Real-Time PCR and Droplet Digital PCR for the Quantitative Detection of Lactiplantibacillus plantarum subsp. plantarum - PMC [https://pmc.ncbi.nlm.nih.gov/articles/PMC9105557/]
- 13. surpasses classical ddPCR technology in quantitating qPCR ... bacteria [https://pubmed.ncbi.nlm.nih.gov/35587727/]
- 14. Tolerance of droplet-digital PCR versus real-time quantitative PCR to inhibitory substances - PMC [https://pmc.ncbi.nlm.nih.gov/articles/PMC4247175/]
- 15. Relative versus absolute RNA quantification: a comparative analysis based on the example of endothelial expression of vasoactive receptors | Biological Procedures Online | Full Text [https://biologicalproceduresonline.biomedcentral.com/articles/10.1186/s12575-021-00144-w]
- 16. Droplet Digital PCR versus qPCR for gene expression analysis with low abundant targets: from variable nonsense to publication quality data | Scientific Reports [https://www.nature.com/articles/s41598-017-02217-x]
- 17. Droplet Digital PCR: Advantages and Applications in Molecular... [https://www.labx.com/resources/droplet-digital-pcr-advantages-and-applications-in-molecular-diagnostics/5581]
- 18. Comparison of Droplet Digital PCR and Quantitative PCR Assays for Quantitative Detection of Xanthomonas citri Subsp. citri - PMC [https://pmc.ncbi.nlm.nih.gov/articles/PMC4948846/]
- 19. Highly accurate and sensitive absolute of quantification ... bacterial [https://pubmed.ncbi.nlm.nih.gov/39244633/]
- 20. Comparison of Quantitative Real-time PCR ... | ERA [https://era.library.ualberta.ca/items/753f3276-afee-45ae-b4d9-1e0c190dfa6f]
- 21. What is a Ct Value and does it differ from qPCR ? Cq Values [https://bitesizebio.com/24581/what-is-a-ct-value/]
- 22. Use and Misuse of Cq in qPCR Data Analysis and Reporting - PMC [https://pmc.ncbi.nlm.nih.gov/articles/PMC8229287/]
- 23. Direct elicitation of template concentration from quantification cycle (Cq) distributions in digital PCR - PMC [https://www.ncbi.nlm.nih.gov/pmc/articles/PMC4176345/]
- 24. Absolute quantification of prokaryotes in the microbiome by 16S rRNA qPCR or ddPCR | Nature Protocols [https://www.nature.com/articles/s41596-025-01165-5]
- 25. How qPCR Works [https://www.sigmaaldrich.com/HK/zh/technical-documents/technical-article/genomics/qpcr/how-qpcr-works]
- 26. Droplet Digital PCR versus qPCR for gene expression analysis with low... [https://www.nature.com/articles/s41598-017-02217-x?error=cookies_not_supported&code=1b7000f2-885a-4212-9dde-9508b4536e33]
- 27. Current PCR Methods [https://www.labome.com/method/Current-PCR-Methods.html]
- 28. Frontiers | Design of Bacterial Strain-Specific qPCR Assays Using NGS Data and Publicly Available Resources and Its Application to Track Biocontrol Strains [https://www.frontiersin.org/journals/microbiology/articles/10.3389/fmicb.2020.00208/full]
- 29. How does ddPCR work? – MOgene [https://mogene.com/how-does-ddpcr-work/]
- 30. Frontiers | Droplet Digital PCR for Estimating Absolute Abundances ... [https://www.frontiersin.org/articles/10.3389/fmicb.2019.01226/full]
- 31. Comparing the performance of conventional PCR, RTQ-PCR, and droplet digital PCR assays in detection of Shigella - ScienceDirect [https://www.sciencedirect.com/science/article/abs/pii/S0890850819304219]
- 32. Novel Species-Specific Primers Enable Accurate Detection and Quantification of Pseudomonas aeruginosa via qPCR - ScienceDirect [https://www.sciencedirect.com/science/article/pii/S0362028X25000195]
- 33. analysis of culture- and Comparative -based wastewater... ddPCR [https://pubs.rsc.org/en/content/articlelanding/2025/ew/d4ew00525b]
- 34. Current Applications of Absolute Bacterial Quantification in Microbiome Studies and Decision-Making Regarding Different Biological Questions - PubMed [https://pubmed.ncbi.nlm.nih.gov/34576694/]
- 35. Optimized bacterial absolute quantification method by qPCR using... [https://pubmed.ncbi.nlm.nih.gov/38331102/]
- 36. Precision performance of Crystal Digital PCR vs. quantitative PCR | Stilla Technologies [https://www.stillatechnologies.com/digital-pcr/naica-system-analysis/precision-performance-of-crystal-digital-pcr-vs-quantitative-pcr/]
- 37. dPCR vs. qPCR – QIAGEN [https://www.qiagen.com/us/applications/digital-pcr/beginners/dpcr-vs-qpcr]
- 38. Droplet digital PCR for absolute quantification of pathogens [https://pubmed.ncbi.nlm.nih.gov/25981265/]
- 39. A comparison between droplet digital and quantitative in the... PCR [https://pubmed.ncbi.nlm.nih.gov/25329701/]
- 40. A ddPCR method for simultaneous detection and quantification of... [https://www.nature.com/articles/s41598-025-17272-y?error=cookies_not_supported&code=753c3b58-16fc-4baa-b67d-697c1df23899]
- 41. Negative control and direct 16S ddPCR . versus qPCR comparisons [https://figshare.com/articles/figure/_Negative_control_and_direct_16S_ddPCR_versus_qPCR_comparisons_/1206746/1]
- 42. Quantitative PCR provides a simple and accessible method for quantitative microbiota profiling - PMC [https://www.ncbi.nlm.nih.gov/pmc/articles/PMC6961887/]
- 43. dPCR: A Technology Review - PMC [https://pmc.ncbi.nlm.nih.gov/articles/PMC5948698/]
- 44. Fundamentals of digital PCR [https://www.qiagen.com/us/knowledge-and-support/knowledge-hub/bench-guide/pcr/digital-pcr/what-is-digital-pcr]
- 45. Comparison of Droplet Digital PCR to Real-Time PCR for Quantitative Detection of Cytomegalovirus - PMC [https://pmc.ncbi.nlm.nih.gov/articles/PMC3553899/]
- 46. GitHub - daattali/ ddpcr : Analysis and visualization of Droplet Digital... [https://github.com/daattali/ddpcr]
- 47. Frontiers | Probiotic and postbiotic analytical methods: a perspective of available enumeration techniques [https://www.frontiersin.org/journals/microbiology/articles/10.3389/fmicb.2023.1304621/full]
- 48. Probiotic and postbiotic analytical methods: a perspective of available enumeration techniques - PMC [https://pmc.ncbi.nlm.nih.gov/articles/PMC10773886/]
- 49. An Integrated Analytical Approach for the Characterization of Probiotic Strains in Food Supplements - PMC [https://pmc.ncbi.nlm.nih.gov/articles/PMC9736879/]
- 50. Comparison of qRT-PCR and ddPCR for multi-strain probiotic ... [https://pmc.ncbi.nlm.nih.gov/articles/PMC12066471/]
- 51. Droplet digital PCR improves absolute quantification of viable lactic acid bacteria in faecal samples - ScienceDirect [https://www.sciencedirect.com/science/article/pii/S0167701218300563]
- 52. Quantification by qPCR of Pathobionts in Chronic Periodontitis: Development of Predictive Models of Disease Severity at Site-Specific Level - PMC [https://www.ncbi.nlm.nih.gov/pmc/articles/PMC5552702/]
- 53. Frontiers | Absolute abundance calculation enhances the significance of microbiome data in antibiotic treatment studies [https://www.frontiersin.org/journals/microbiology/articles/10.3389/fmicb.2025.1481197/full]
- 54. Evaluation of the analytical and diagnostic performance of a digital... [https://pubmed.ncbi.nlm.nih.gov/30586355/]
- 55. Quantitative Estimation of Low-Abundance Targets in Engineered Systems and Environmental Samples: Comparative Study Between Droplet Digital PCR and Real-Time PCR [https://www.mdpi.com/2076-2607/13/11/2426]
- 56. Frontiers | Development and application of a highly sensitive quadruple droplet digital PCR method for simultaneous quantification of sulfonamide resistance genes [https://www.frontiersin.org/journals/microbiology/articles/10.3389/fmicb.2025.1612740/full]
- 57. Assessment of absolute abundance in mother-infant gut microbiome using marine-sourced bacterial DNA spike-in and comparison with conventional quantification methods [https://www.oaepublish.com/articles/mrr.2024.94?to=comment]
- 58. versus metagenomics for monitoring Quantitative ... PCR antibiotic [https://orbit.dtu.dk/en/publications/quantitative-pcr-versus-metagenomics-for-monitoring-antibiotic-re]
- 59. Competitiveness of Quantitative ( Polymerase )... Chain Reaction qPCR [https://www.mdpi.com/2673-8007/1/3/28]
- 60. dPCR: Choosing the Right qPCR ... | Technology Networks vs PCR [https://www.technologynetworks.com/analysis/articles/qpcr-vs-dpcr-choosing-the-right-pcr-technology-to-suit-your-experimental-needs-386507]
- 61. Efficiency and sensitivity of the digital droplet PCR for the... [https://pubmed.ncbi.nlm.nih.gov/27844142/]
- 62. A Comparison between Droplet Digital and Quantitative PCR in the Analysis of Bacterial 16S Load in Lung Tissue Samples from Control and COPD GOLD 2 - PMC [https://pmc.ncbi.nlm.nih.gov/articles/PMC4199711/]
- 63. Current Applications of Absolute Bacterial Quantification in Microbiome Studies and Decision-Making Regarding Different Biological Questions - PMC [https://www.ncbi.nlm.nih.gov/pmc/articles/PMC8467167/]
- 64. in PCR , inhibition and MPS—mechanisms and solutions... qPCR dPCR [https://pmc.ncbi.nlm.nih.gov/articles/PMC7072044/]
- 65. Complex polysaccharides as PCR inhibitors in feces: Helicobacter pylori model - PMC [https://pmc.ncbi.nlm.nih.gov/articles/PMC229720/]
- 66. Improved amplification efficiency on stool samples by addition of spermidine and its use for non-invasive detection of colorectal cancer | BMC Biotechnology | Full Text [https://bmcbiotechnol.biomedcentral.com/articles/10.1186/s12896-015-0148-6]
- 67. A Duplex Digital PCR Assay for Simultaneous Quantification of the... [https://pmc.ncbi.nlm.nih.gov/articles/PMC4828229/]
- 68. Methods to remove inhibitors in sewage and other fecal wastes for enterovirus detection by the polymerase chain reaction - PubMed [https://pubmed.ncbi.nlm.nih.gov/7559857/]
- 69. A Comparison between Droplet Digital and Quantitative PCR in the Analysis of Bacterial 16S Load in Lung Tissue Samples from Control and COPD GOLD 2 | PLOS One [https://journals.plos.org/plosone/article?id=10.1371/journal.pone.0110351]
- 70. A comparison between quantitative and droplet digital PCR... PCR [https://pubmed.ncbi.nlm.nih.gov/27538962/]
- 71. Absolute Determination of Single-Stranded and Self-Complementary... [https://pmc.ncbi.nlm.nih.gov/articles/PMC3991984/]
- 72. the Comparing of two digital precision applications for copy... PCR [https://www.nature.com/articles/s41598-025-13143-8?error=cookies_not_supported&code=65bb69cc-66c5-45ae-bb59-6cd842ccfdfa]
- 73. Addgene: Molecular Biology Protocol - Restriction Digest of Plasmid DNA [https://www.addgene.org/protocols/restriction-digest/]
- 74. Restriction enzyme quality control [https://www.takarabio.com/learning-centers/cloning/traditional-molecular-cloning/restriction-enzyme-overview/qc-of-restriction-enzymes]
- 75. Activity of Promega Restriction Enzymes in GoTaq® Green and PCR Master Mixes [https://www.promega.com/resources/pubhub/enotes/activity-of-promega-restriction-enzymes-in-gotaq-green-and-pcr-master-mixes/]
- 76. Restriction enzyme digestion of host DNA enhances universal detection of parasitic pathogens in blood via targeted amplicon deep sequencing | Microbiome | Full Text [https://microbiomejournal.biomedcentral.com/articles/10.1186/s40168-018-0540-2]
- 77. Binding the gap between experiments, statistics, and method comparison: A tutorial for computing limits of detection and quantification in univariate calibration for complex samples - ScienceDirect [https://www.sciencedirect.com/science/article/abs/pii/S0003267021011685]
- 78. Limit of detection (LQD)/limit of quantitation (LOQ): comparison of the empirical and the statistical methods exemplified with GC-MS assays of abused drugs - PubMed [https://pubmed.ncbi.nlm.nih.gov/8013092/]
- 79. A comparison of qPCR and ddPCR used for quantification of the... [https://link.springer.com/article/10.1007/s00277-018-3451-1]
- 80. Droplet digital PCR real-time versus for in-house validation of... PCR [https://pmc.ncbi.nlm.nih.gov/articles/PMC10348585/]
- 81. of Comparison and Droplet Digital PCR Quantitative ... PCR Multiplex [https://pubmed.ncbi.nlm.nih.gov/26025892/]
- 82. Multiplex qPCR - Azure Biosystems [https://azurebiosystems.com/qpcr-applications/multiplexing/]
- 83. Expanded Droplet Digital PCR Multiplexing Capability Using Two Different Strategies [https://www.bioradiations.com/expanded-droplet-digital-pcr-multiplexing-capability-using-two-different-strategies/]
- 84. Optimisation of robust singleplex and multiplex droplet digital PCR assays for high confidence mutation detection in circulating tumour DNA | Scientific Reports [https://www.nature.com/articles/s41598-019-49043-x]
- 85. How to multiplex with color combination in Crystal Digital PCR®? | Stilla Technologies [https://www.stillatechnologies.com/digital-pcr/naica-system-analysis/how-to-multiplex-with-color-combination-in-crystal-digital-pcr/]
- 86. Qualitative and quantitative detection of surgical pathogenic microorganisms Escherichia coli and Staphylococcus aureus based on ddPCR system | Scientific Reports [https://www.nature.com/articles/s41598-021-87824-5]
- 87. Microbial DNA qPCR Assays [https://www.qiagen.com/us/products/discovery-and-translational-research/pcr-qpcr-dpcr/qpcr-assays-and-instruments/microbial-dna-qpcr-assays-and-panels/microbial-dna-qpcr-assays]
- 88. Frontiers | Plasma cell-free DNA Droplet Digital PCR provides rapid and efficient infectious microbiology diagnosis for febrile haematological patients [https://www.frontiersin.org/journals/cellular-and-infection-microbiology/articles/10.3389/fcimb.2025.1522426/full]
- 89. Frontiers | Establishment and validation of a dual qPCR method for the... [https://www.frontiersin.org/journals/cellular-and-infection-microbiology/articles/10.3389/fcimb.2025.1490528/full]
- 90. Digital PCR vs. Real-Time PCR : Understanding the Key... | Lab Manager [https://www.labmanager.com/digital-pcr-vs-real-time-pcr-understanding-the-key-differences-33665]
- 91. A comparison between quantitative PCR and droplet digital PCR technologies for circulating microRNA quantification in human lung cancer | BMC Biotechnology | Full Text [https://bmcbiotechnol.biomedcentral.com/articles/10.1186/s12896-016-0292-7]
- 92. Digital PCR outperforms quantitative real-time PCR for the detection ... [https://pubmed.ncbi.nlm.nih.gov/40708854/]
- 93. What Are the Advantages of ddPCR Over Other PCR Variants? – MOgene [https://mogene.com/what-are-the-advantages-of-ddpcr-over-other-pcr-variants/]
- 94. Measuring Digital PCR Quality: Performance Parameters and Their Optimization | PLOS One [https://journals.plos.org/plosone/article?id=10.1371/journal.pone.0153317]
- 95. Comparison of three qPCR-based commercial tests for detection of periodontal pathogens | Scientific Reports [https://www.nature.com/articles/s41598-021-85305-3]
- 96. qPCR and ddPCR Assay | BioAgilytix [https://www.bioagilytix.com/techniques/instrumentation/qpcr-ddpcr-assay/]
- 97. Frontiers | Droplet digital PCR vs. quantitative real time-PCR for diagnosis of pulmonary and extrapulmonary tuberculosis: systematic review and meta-analysis [https://www.frontiersin.org/journals/medicine/articles/10.3389/fmed.2023.1248842/full]
- 98. Comparison of several Real-Time PCR Kits versus a Culture-dependent Algorithm to Identify Enteropathogens in Stool Samples | Scientific Reports [https://www.nature.com/articles/s41598-020-61202-z]