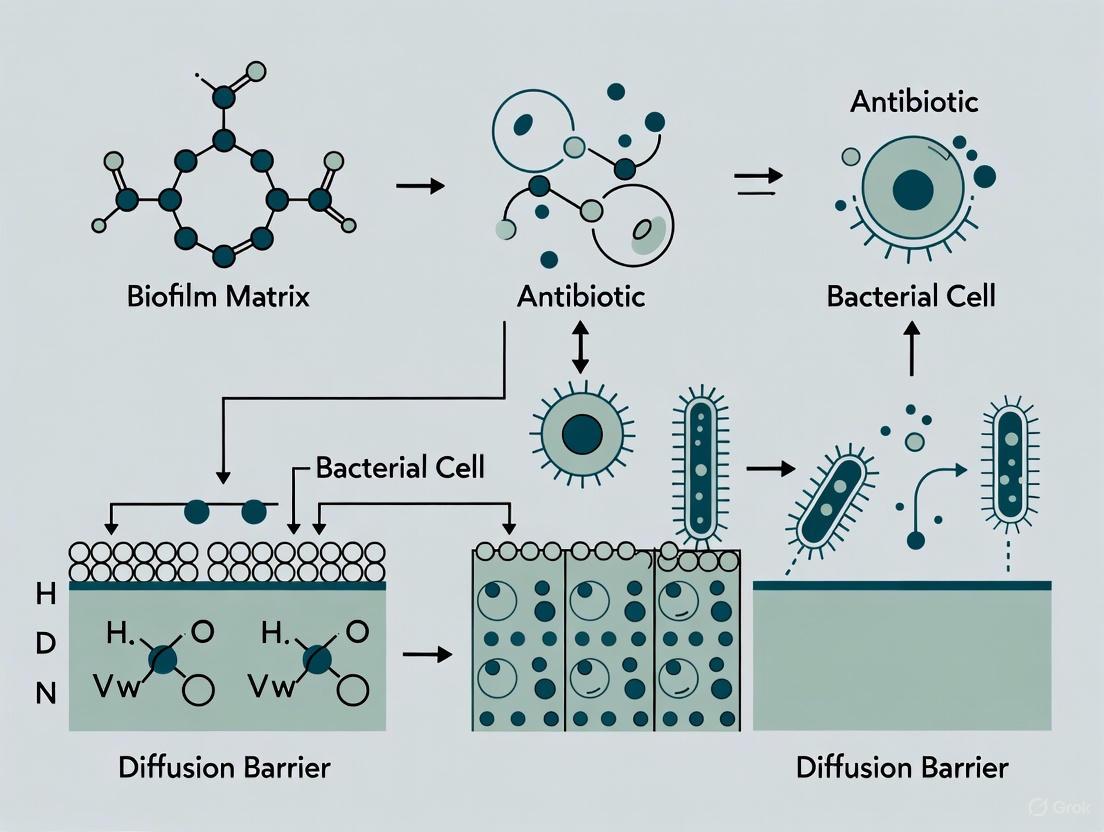
The Biofilm Matrix: Decoding the Diffusion Barrier and Its Role in Antibiotic Treatment Failure
Biofilms represent a fundamental mode of bacterial life that confers a remarkable level of protection against antimicrobial agents.
The Biofilm Matrix: Decoding the Diffusion Barrier and Its Role in Antibiotic Treatment Failure
Abstract
Biofilms represent a fundamental mode of bacterial life that confers a remarkable level of protection against antimicrobial agents. This review synthesizes current research on the biofilm matrix, focusing on its role as a critical diffusion barrier that contributes significantly to antibiotic treatment failure. We explore the structural and compositional complexity of the extracellular polymeric substance (EPS), detailing how components like polysaccharides, extracellular DNA, and proteins physically impede antibiotic penetration and sequester drug molecules. For researchers and drug development professionals, this article provides a comprehensive analysis of the mechanisms behind this intrinsic resistance, evaluates advanced models for studying antibiotic penetration, and surveys innovative therapeutic strategies designed to disrupt or bypass the matrix barrier. By integrating foundational knowledge with emerging methodologies and validation techniques, this review aims to guide the development of next-generation anti-biofilm therapies.
Deconstructing the Fortress: An In-Depth Look at Biofilm Matrix Composition and Structure
Frequently Asked Questions (FAQs)
Q1: What are the defining hallmarks of a mature biofilm that confer antibiotic resistance? A mature biofilm is not merely surface-attached bacteria; it is a structured, three-dimensional community. The key hallmark is the self-produced Extracellular Polymeric Substance (EPS) matrix, a complex mixture of polysaccharides, proteins, extracellular DNA (eDNA), and lipids that acts as a primary diffusion barrier and physical shield [1] [2]. Other critical features include:
- Metabolic Heterogeneity: The formation of nutrient and oxygen gradients from the top to the bottom layers of the biofilm creates zones of slow-growing or dormant persister cells, which are highly tolerant to antibiotics [3] [4].
- Upregulated Defense Mechanisms: Biofilms exhibit increased activity of efflux pumps and other stress responses, further limiting the efficacy of antimicrobial agents [4].
Q2: My in vitro biofilm model does not recapitulate the antibiotic tolerance seen in clinical isolates. What could be wrong? This common issue often stems from using oversimplified biofilm models. Static models, like microtiter plate assays, are useful for high-throughput screening but often fail to produce the complex 3D architecture and physiological heterogeneity of in vivo biofilms [5]. To better mimic clinical scenarios:
- Switch to Dynamic Models: Implement flow cell systems or bioreactors (e.g., Constant Depth Film Fermenters) that provide constant nutrient flow and shear stress, promoting the development of mature, structured biofilms with enhanced tolerance [5].
- Consider Non-Surface-Attached Aggregates: Be aware that many chronic infections (e.g., in cystic fibrosis lungs) feature non-surface-associated bacterial aggregates that share the resistant phenotype of classic biofilms. Your model should account for this lifestyle [6] [7].
Q3: Beyond the EPS, what are the key molecular mechanisms driving biofilm-specific antibiotic resistance? The EPS barrier is just one component of a multi-layered resistance strategy. Key molecular mechanisms include:
- Nutrient Gradient-Induced Persistence: As mentioned, nutrient depletion in the biofilm core induces a dormant state in subpopulations of cells, making them insensitive to antibiotics that target active cellular processes [4].
- Altered Microenvironment: Factors like hypoxia and low pH within the biofilm can alter bacterial metabolism and directly reduce the activity of some antibiotics [4].
- Efflux Pump Activity: Specific efflux pumps are upregulated in biofilms, actively extruding antibiotics from the cells [4].
- Presence of Extracellular DNA (eDNA): eDNA within the matrix can directly bind to and inactivate certain classes of antibiotics, such as aminoglycosides [4].
Troubleshooting Common Experimental Challenges
Challenge 1: Inconsistent Biofilm Formation in Static Assays
- Problem: High variability in biofilm biomass between experimental replicates.
- Solution:
- Standardize Inoculum Preparation: Ensure planktonic cultures are grown to the same optical density and physiological state for every experiment.
- Surface Pre-conditioning: Coat your substrate (e.g., plastic, glass, hydroxyapatite) with a relevant conditioning film (e.g., saliva for oral models, serum for implant models) to standardize the initial attachment surface [5].
- Control Environmental Factors: Maintain strict consistency in incubation time, temperature, and humidity, as minor fluctuations can significantly impact attachment.
Challenge 2: Poor Penetration of Antimicrobials into the Biofilm
- Problem: An antibiotic is effective against planktonic cells but shows markedly reduced efficacy against the biofilm.
- Solution:
- Verify Penetration: Use fluorescently labeled antibiotics combined with confocal microscopy to visually confirm whether the drug is penetrating to the base of the biofilm [5].
- Combine with Matrix-Disrupting Agents: Co-administer the antibiotic with agents that target the EPS. For example, use DNase I to degrade eDNA or dispersin B to target polysaccharides, which can increase antimicrobial penetration [1] [7].
- Increase Contact Time/Concentration: Recognize that the Minimum Inhibitory Concentration (MIC) for biofilms can be 100-800 times greater than for planktonic cells. Perform dose-response curves to determine the true minimum biofilm eradication concentration (MBEC) [7] [4].
Challenge 3: Difficulty in Distinguishing Between Live and Dead Cells in a Mature Biofilm
- Problem: Standard viability stains (e.g., SYTO9/PI) give ambiguous results in thick, dense biofilms.
- Solution:
- Use Metabolic Probes: Employ fluorescent probes that measure metabolic activity (e.g., CTC, resazurin) in combination with cell impermeant stains to better differentiate viable but non-culturable (VBNC) and dormant cells from dead cells.
- Employ Advanced Microscopy: Utilize time-lapse fluorescence microscopy or fluorescent probes that track cell fate in real-time to observe the heterogeneous physiological states within the biofilm [8] [5].
Experimental Protocols for Key Analyses
Protocol 1: Dynamic Biofilm Cultivation in a Flow Cell System
Purpose: To grow mature, architecturally complex biofilms under controlled hydrodynamic conditions for diffusion and resistance studies [5].
Materials:
- Sterile flow cell chambers (e.g., Stovall or Ibidi style)
- Peristaltic pump and silicone tubing
- Media reservoir and waste bottle
- Syringe bubble trap
- Appropriate bacterial growth medium
- Confocal laser scanning microscope (CLSM)
Method:
- Assembly and Sterilization: Connect the entire flow system (reservoir → pump → bubble trap → flow cell → waste) and sterilize by autoclaving or flushing with 70% ethanol.
- Inoculation: Dilute an overnight bacterial culture to the desired OD. Stop the flow and inject the bacterial suspension into the flow cell channel. Allow the cells to attach statically for 1-2 hours.
- Initiate Flow: Start the peristaltic pump at a low, constant rate (e.g., 0.2 mL/min) to remove non-adherent cells and provide fresh medium.
- Maturation: Allow the biofilm to develop under flow for 24-72 hours, depending on the species and desired maturity.
- Analysis: Stop the flow and introduce fluorescent dyes (e.g., for live/dead staining, matrix components) or labeled antibiotics. Image the biofilm architecture in 3D using CLSM [5].
Protocol 2: Quantifying Antimicrobial Penetration via Confocal Microscopy
Purpose: To visualize and quantify the diffusion coefficient and penetration profile of an antimicrobial agent through the biofilm matrix [4].
Materials:
- Mature biofilm grown in a flow cell or on a coverslip
- Fluorescently labeled antibiotic (e.g., vancomycin-fluorophore conjugate)
- Confocal laser scanning microscope (CLSM)
- Image analysis software (e.g., ImageJ, Imaris)
Method:
- Preparation: Grow a mature, thick biofilm using a dynamic or static method.
- Antibiotic Exposure: Introduce a solution of the fluorescently labeled antibiotic to the biofilm and start a timer.
- Time-Lapse Imaging: Immediately begin capturing Z-stack images of the biofilm at regular intervals (e.g., every 30 seconds) at the same XY location.
- Data Analysis:
- Use software to measure the fluorescence intensity from the top to the bottom of the biofilm over time.
- Plot the fluorescence intensity versus depth for each time point.
- Calculate the effective diffusion coefficient (D_eff) for the antibiotic within the biofilm matrix by fitting the concentration profiles to Fick's laws of diffusion.
The Biofilm Lifecycle: A Visual Guide
The following diagram illustrates the key stages of biofilm development, integrating both classic and contemporary models.
Research Reagent Solutions Toolkit
The table below lists essential reagents and their specific functions in biofilm research related to matrix and diffusion barrier studies.
| Research Reagent | Primary Function in Biofilm Research |
|---|---|
| DNase I | Degrades extracellular DNA (eDNA) in the matrix; used to disrupt biofilm integrity and enhance antibiotic penetration [1]. |
| Dispersin B | An enzyme that hydrolyzes the polysaccharide poly-N-acetylglucosamine (PNAG), a key matrix component in many staphylococcal and E. coli biofilms [7]. |
| Fluorescent Conjugates (e.g., WGA, ConA) | Lectins that bind to specific polysaccharides in the EPS, allowing for visualization and quantification of matrix components via microscopy [5]. |
| SYTO 9 / Propidium Iodide (PI) | A common live/dead viability stain. SYTO9 labels all cells, while PI penetrates only membrane-compromised cells [5]. |
| Resazurin (AlamarBlue) | A metabolic dye used to quantify the metabolic activity of cells within a biofilm, which can differ from sheer biomass [5]. |
| Crystal Violet | A simple stain that binds to biomass; used for basic, high-throughput quantification of total biofilm formation in microtiter plate assays [5]. |
| RNAIII-Inhibiting Peptide (RIP) | A quorum-sensing inhibitor that blocks biofilm formation in Staphylococci by interfering with cell-cell communication [1]. |
Quantitative Data on Biofilm Antibiotic Resistance
This table summarizes key quantitative data points that highlight the enhanced antibiotic resistance of biofilms compared to their planktonic counterparts.
| Parameter | Planktonic Cells | Biofilm Cells | Context / Notes |
|---|---|---|---|
| Antibiotic Tolerance (MIC) | 1x (Baseline) | 100 - 800x higher [4] | MIC for biofilms can be hundreds of times greater than for planktonic cells of the same species. |
| Relative Resistance | 1x (Baseline) | Up to 1000x more resistant [1] [7] | Biofilms can be up to 1000 times more resistant to antibiotics than planktonic cells. |
| Percentage of Chronic Infections | - | ~80% [9] [3] | An estimated 65-80% of all chronic human microbial infections are associated with biofilms. |
| Matrix Composition (EPS) | - | >90% of dry mass [4] | The extracellular matrix constitutes the vast majority of a biofilm's dry mass. |
Core Signaling Pathways in Biofilm Development
The diagram below outlines the key signaling pathways that regulate the transition from planktonic growth to a mature biofilm, a critical process for understanding resistance development.
Core Components of the Extracellular Polymeric Substance (EPS)
Core Components of the EPS Matrix
The Extracellular Polymeric Substance (EPS) matrix is a complex, dynamic mixture of biopolymers that constitutes the fundamental architectural element of microbial biofilms, forming a protective "house" for embedded cells [10]. This matrix is not a single substance but a sophisticated composite material that determines the physicochemical properties of the biofilm, including its porosity, density, charge, and mechanical stability [10]. The EPS accounts for 50% to 90% of the total organic matter in a biofilm, creating a three-dimensional, highly hydrated scaffold that encompasses microbial cells and mediates their interactions with the environment [11] [12].
The following table summarizes the primary chemical classes and their key characteristics found within the EPS:
| Component Class | Key Characteristics | Primary Functions in EPS Matrix |
|---|---|---|
| Polysaccharides | Heteropolymers or homopolymers; often polyanionic due to uronic acids or organic substituents like pyruvate or succinate [13] [14] [11]. | Provides structural integrity, mechanical stability, and cohesion; acts as a scaffold, facilitates adhesion, and retains water [14] [15]. |
| Proteins | Includes both structural proteins and extracellular enzymes (exoenzymes) [14] [12]. | Structural proteins stabilize architecture and provide cohesion; enzymes degrade matrix components and external nutrients [14] [15]. |
| Extracellular DNA (eDNA) | Double-stranded DNA derived from genomic DNA, often organized in distinct patterns or filaments [14] [10]. | Provides structural support and stability; facilitates cell-to-cell connectivity and exchange of genetic information [14] [10]. |
| Lipids | Includes surfactants and other amphiphilic molecules [13]. | Contributes to surface activity, hydrophobicity, and interaction at interfaces [10]. |
| Other Components | Humic substances, minerals (e.g., CaCO₃) from biomineralization [11] [10]. | Minerals provide structural integrity; humic substances contribute to sorptive properties [11] [10]. |
The Role of EPS in Antibiotic Resistance: A Troubleshooting FAQ
This section addresses common research challenges and questions regarding the EPS matrix's role as a diffusion barrier, a key focus in antibiotic resistance research.
FAQ 1: Why do my minimum inhibitory concentration (MIC) assays show such high resistance in biofilm-grown bacteria compared to planktonic cultures?
Issue: Standard MIC protocols developed for planktonic cells drastically underestimate the antibiotic concentration required to eradicate biofilms.
Explanation: The EPS matrix contributes to antibiotic resistance through multiple, synergistic mechanisms that are not active in planktonic cells.
- Physical Diffusion Barrier: The dense, anionic network of EPS components (e.g., polysaccharides, proteins) physically hinders the penetration of antibiotic molecules into the deeper layers of the biofilm. The diffusion of antibiotics is often slow and incomplete, leading to their inactivation by extracellular enzymes trapped within the matrix before they reach all target cells [14] [4].
- Chemical Binding and Inactivation: Functional groups (e.g., carboxyl, amine, hydroxyl) on EPS biopolymers can chemically interact with and sequester antibiotics. Studies show that EPS can bind antibiotics like tetracyclines, quinolones, and sulfonamides, forming stable complexes and reducing the bioavailable concentration [16]. The binding follows pseudo-second-order kinetics and the Freundlich isotherm model, indicating complex multilayer adsorption [16].
- Altered Microenvironment: The consumption of nutrients and oxygen by peripheral cells in a biofilm creates gradients, leading to nutrient depletion and slow growth in the inner layers. These dormant or "persister" cells are metabolically less active and thus less susceptible to many antibiotics that target active cellular processes [14] [4].
Troubleshooting Tip: When evaluating anti-biofilm agents, do not rely on planktonic MIC values. Instead, establish a Minimum Biofilm Eradication Concentration (MBEC) using assays like the Calgary Biofilm Device or similar biofilm-specific models [4].
FAQ 2: My enzymatic disruption of EPS is inconsistent across bacterial species. How can I optimize this protocol?
Issue: The efficacy of EPS-degrading enzymes (e.g., proteases, DNases, amylases) varies significantly between biofilms of different species and strains.
Explanation: The relative abundance and structural role of specific EPS components (proteins, eDNA, polysaccharides) differ greatly among bacterial species. For instance:
- Pseudomonas aeruginosa biofilms are highly dependent on eDNA and certain polysaccharides (e.g., Psl, Pel) for structural integrity [13] [15] [10]. They are often susceptible to DNase treatment.
- Staphylococcus aureus and S. epidermidis biofilms rely heavily on proteinaceous components and poly-β(1-6)-N-acetylglucosamine (PNAG) polysaccharide [13] [15]. They are more effectively disrupted by proteases (e.g., Savinase, Subtilisin A) or the PNAG-degrading enzyme dispersin B [13].
- Escherichia coli biofilms may be stabilized by curli fibers (amyloid proteins) and cellulose [15] [10].
Troubleshooting Guide: The table below outlines targeted enzymatic strategies based on the primary EPS composition.
| Target EPS Component | Recommended Enzymes | Example Application & Efficacy |
|---|---|---|
| Proteins | Proteases (e.g., Serratiopeptidase, Savinase, Subtilisin A) [13]. | Savinase reduced sessile biomass of P. aeruginosa and S. aureus by ≥70%; Serratiopeptidase enhanced ofloxacin activity against sessile cells [13]. |
| Polysaccharides | Amylases, Dispersin B (targets PNAG) [13]. | α-Amylase detached S. aureus biofilms in a concentration- and time-dependent manner [13]. |
| Extracellular DNA (eDNA) | DNase I [14]. | Effective against biofilms where eDNA is a major structural scaffold (e.g., P. aeruginosa) [14] [10]. |
Optimization Protocol:
- Characterize the EPS: Begin with a basic compositional analysis of your target biofilm using colorimetric assays (e.g., Lowry for protein, Phenol-Sulfuric acid for polysaccharide) or more advanced techniques like FT-IR spectroscopy [13] [12].
- Screen Enzymes: Perform a screen using a panel of enzymes targeting different EPS components. Use a standard biofilm biomass assay (e.g., crystal violet) or viability assay (e.g., resazurin) to quantify disruption.
- Combine Therapies: Consider enzyme-antibiotic combination therapy. Enzymatic disruption of the matrix can enhance antibiotic penetration, potentially lowering the required MBEC [13] [14].
FAQ 3: How can I accurately visualize the spatial distribution and composition of EPS in my biofilm models?
Issue: Standard plating and microscopy methods fail to reveal the complex three-dimensional architecture and heterogeneous composition of the EPS matrix.
Explanation: The EPS matrix is spatially heterogeneous, with components distributed in non-homogeneous patterns [13] [12]. Understanding this architecture is crucial for investigating diffusion barriers and microenvironments.
Experimental Workflow for EPS Visualization:
Recommended Techniques:
- Confocal Laser Scanning Microscopy (CLSM): This is the gold standard for in-situ, non-destructive analysis of biofilms [12]. It allows for the optical sectioning of thick biofilms and reconstruction of their 3D architecture.
- Fluorescent Labeling:
- Spectroscopic Techniques:
- Fourier Transform Infrared (FT-IR) Spectroscopy: Provides information on the overall chemical content (proteins, polysaccharides, lipids) and their relative proportions in the biofilm matrix without the need for extensive processing [13]. Specific absorption bands correspond to functional groups in different EPS classes.
The Scientist's Toolkit: Key Research Reagents for EPS Analysis
The following table lists essential materials and reagents used in the experimental methods cited for studying EPS composition and function.
| Research Reagent / Material | Function / Application in EPS Research |
|---|---|
| Savinase (Serine Protease) | Degrades protein components within the EPS matrix; used to study protein function and disrupt biofilm integrity [13]. |
| DNase I | Hydrolyzes extracellular DNA (eDNA); used to investigate the structural role of eDNA in biofilms and as a dispersal agent [14]. |
| Dispersin B | Specifically hydrolyzes poly-β(1-6)-N-acetylglucosamine (PNAG), a key polysaccharide in staphylococcal biofilms [14] [15]. |
| Fluorescently Labeled Lectins (e.g., Con A) | Bind to specific carbohydrate residues in EPS polysaccharides; used for visualization and spatial mapping via CLSM [12] [10]. |
| Calcium Chloride (CaCl₂) | Used to prepare competent bacterial cells for genetic transformation studies; also relevant as a divalent cation that can cross-link EPS components, influencing matrix stability [17]. |
| SYTO / Propidium Iodide Stains | Nucleic acid-binding fluorescent dyes used to label and visualize extracellular DNA (eDNA) within the biofilm matrix [10] [17]. |
Frequently Asked Questions for Researchers
FAQ 1: What are the primary components of the biofilm matrix responsible for impeding antibiotic penetration? The extracellular polymeric substance (EPS) matrix is a complex, heterogeneous structure that constitutes 75-90% of the biofilm's biomass [18]. The key components involved in antibiotic sequestration are:
- Exopolysaccharides: Such as Pel, Psl, and alginate in Pseudomonas aeruginosa. These act as a molecular glue and can form complexes with antibiotics [18] [19].
- Extracellular DNA (eDNA): The negatively charged backbone of eDNA can bind and sequester positively charged antibiotics, such as aminoglycosides [20] [19].
- Proteins: Include secreted enzymes, cell surface adhesins, and protein subunits of cell appendages which contribute to matrix stability and can entrap antibiotics [18].
FAQ 2: How does the biofilm matrix cause a reduction in effective antibiotic concentration? The reduction is not solely due to slow diffusion. Specific binding and inactivation events occur at the biofilm surface, creating a steep concentration gradient. Key mechanisms include:
- Binding and Inactivation: Antibiotics like aminoglycosides bind to negatively charged eDNA, effectively neutralizing them [19].
- Enzymatic Degradation: Enzymes within the matrix, such as β-lactamases, can deactivate susceptible antibiotics faster than they can diffuse into the biofilm's deeper layers [20] [21].
- Neutralization by Host Components: In chronic infections, host-derived DNA from neutrophil extracellular traps (NETs) can integrate into the matrix, forming a physical shield that further reduces antibiotic efficacy [19].
FAQ 3: What is the quantitative impact of biofilm-mediated resistance? Bacteria within a biofilm can exhibit a 10 to 1,000-fold increase in antibiotic resistance compared to their planktonic counterparts [20]. The table below summarizes key quantitative findings from recent studies.
Table 1: Quantitative Data on Biofilm-Mediated Resistance
| Observation | Quantitative Finding | Context / Pathogen | Source |
|---|---|---|---|
| Increase in Minimum Inhibitory Concentration (MIC) | 10 - 1,000 fold | General biofilm-mediated resistance | [20] |
| Resistance Development in Biofilm vs. Planktonic | 100% susceptible (planktonic) vs. ~75% resistant (biofilm) | Staphylococcus epidermidis treated with Vancomycin | [20] |
| Biofilm Producer Prevalence | 88.5% of isolates | Clinical ESKAPE pathogens (n=165) | [22] |
| Strong Biofilm Producers | 15.8% of isolates | Clinical ESKAPE pathogens (n=165) | [22] |
| Matrix Composition - Microbial Cells | 10-25% of biofilm volume | General biofilm architecture | [18] |
| Matrix Composition - EPS | 75-90% of biofilm volume | General biofilm architecture | [18] |
FAQ 4: My standard antibiotic treatments are failing against a suspected biofilm infection. What experimental approaches can I use to confirm the matrix is the cause? You should employ a combination of methods to directly test the barrier function of the matrix.
- Assay Antibiotic Penetration: Use fluorescently labeled antibiotics (e.g., vancomycin) in conjunction with Confocal Laser Scanning Microscopy (CLSM) to visualize and quantify the diffusion profile through the biofilm.
- Enzymatic Matrix Disruption: Treat biofilms with matrix-degrading enzymes like DNase I (targets eDNA), dispersin B (targets polysaccharides), or alginate lyase (targets alginate). A significant increase in antibiotic susceptibility post-treatment strongly implicates the matrix in the resistance phenotype [18] [21].
- Check for Persister Cells: After enzymatic disruption, plate the dispersed cells on antibiotic-containing media. If the cells remain viable but do not grow, it suggests the presence of dormant persister cells, which are a separate resistance mechanism [20] [19].
Troubleshooting Guides
Problem: Inconsistent results in biofilm antibiotic susceptibility assays. Solution: This is often due to variability in biofilm growth and methodology.
- Standardize Biofilm Growth: Ensure consistent inoculum size, growth medium, surface material, and incubation time. Use a validated model like the Calgary biofilm device or a continuous-flow reactor for more reproducible biofilms.
- Quantify Biofilm Mass: Prior to antibiotic exposure, normalize your experiments by measuring the biofilm biomass (e.g., via crystal violet staining) or determining the number of viable cells.
- Include Proper Controls: Always include a planktonic cell control and a biofilm viability control (no antibiotic) in every experiment.
Problem: An antibiotic that is effective in planktonic kill curves shows no efficacy against the same strain in a biofilm. Solution: This is a classic sign of biofilm-specific tolerance. Your troubleshooting should focus on the mechanisms outlined in FAQ 2.
- Test for Binding: Pre-incubate the antibiotic with purified matrix components (e.g., eDNA, alginate) and assess the reduction in antimicrobial activity against planktonic cells.
- Check for Penetration: Perform the fluorescent antibiotic penetration assay described above. The issue may be failure to reach the minimum bactericidal concentration at the core of the biofilm.
- Investigate Physiological State: Use staining (e.g., with LIVE/DEAD BacLight or a metabolic dye like CTC) to determine if the inner layers of the biofilm contain a high proportion of dormant, non-growing cells that are inherently tolerant [3].
Experimental Protocols
Protocol 1: Assessing the Role of eDNA in Aminoglycoside Sequestration
Purpose: To determine if extracellular DNA (eDNA) in the biofilm matrix is responsible for binding and neutralizing tobramycin.
Reagents:
- Biofilm-forming bacterial strain (e.g., P. aeruginosa)
- Tobramycin sulfate
- DNase I (RNase-free)
- Cation-adjusted Mueller Hinton Broth (CAMHB)
- Phosphate Buffered Saline (PBS)
- 96-well polystyrene microtiter plates
Method:
- Grow Biofilms: In a 96-well plate, incubate the standardized bacterial inoculum in CAMHB for 24-48 hours at 37°C to form mature biofilms.
- Wash Biofilms: Gently wash the biofilms twice with PBS to remove non-adherent cells.
- Experimental Groups:
- Group A (Test): Add CAMHB containing tobramycin (at desired concentration) and DNase I (100 µg/mL).
- Group B (Control): Add CAMHB containing tobramycin at the same concentration.
- Group C (Viability Control): Add CAMHB only.
- Incubate: Incubate the plate for an additional 18-24 hours at 37°C.
- Quantify Viability: Carefully aspirate the media, wash the biofilms, and disrupt them by sonication or scraping. Serially dilute and plate the suspensions on agar to determine the Colony Forming Units (CFU)/mL.
- Analysis: A statistically significant reduction in CFU/mL in Group A (DNase-treated) compared to Group B (antibiotic only) confirms that eDNA contributes to tobramycin resistance.
Protocol 2: Visualizing Antibiotic Penetration via Confocal Microscopy
Purpose: To directly observe and quantify the diffusion barrier of the biofilm matrix against a fluorescently labeled antibiotic.
Reagents:
- Biofilm strain
- BODIPY FL Vancomycin (or other fluorescent antibiotic conjugate)
- Flow cell reactor or glass-bottom dish
- Confocal Laser Scanning Microscope (CLSM)
Method:
- Grow Biofilms: Grow a mature biofilm in a flow cell or on a glass-bottom dish under relevant conditions.
- Stain Biofilm Structure (Optional): Introduce a non-inhibitory nucleic acid stain (e.g., SYTO 61) to label all bacterial cells, providing structural context.
- Introduce Fluorescent Antibiotic: Stop the flow and introduce a solution of BODIPY FL Vancomycin in PBS at a physiologically relevant concentration.
- Image Time-Lapse: Immediately begin acquiring Z-stack images at regular intervals (e.g., every 5-10 minutes) using CLSM. Use separate laser channels for the antibiotic (green) and the cell stain (red).
- Analyze Data: Use image analysis software (e.g., ImageJ) to plot the fluorescence intensity of the antibiotic signal across the biofilm depth over time. A shallow penetration gradient indicates a strong diffusion barrier.
Research Reagent Solutions
Table 2: Essential Reagents for Studying the Matrix Diffusion Barrier
| Research Reagent | Function / Application | Example Use Case |
|---|---|---|
| DNase I | Degrades extracellular DNA (eDNA) in the matrix. | Testing eDNA's role in sequestering aminoglycosides or other cationic antimicrobials [19] [21]. |
| Dispersin B | Glycosyl hydrolase that degrades poly-N-acetylglucosamine (PNAG) polysaccharide. | Disrupting biofilms of staphylococcal species and other pathogens that utilize PNAG [18]. |
| Alginate Lyase | Breaks down alginate, a key polysaccharide in P. aeruginosa biofilms. | Enhancing antibiotic penetration in mucoid P. aeruginosa infections, such as in cystic fibrosis [21]. |
| Fluorescently Labeled Antibiotics (e.g., BODIPY-Vancomycin) | Visualizing and quantifying antibiotic penetration and binding in live biofilms. | Directly measuring the diffusion coefficient and penetration depth of an antibiotic using CLSM [19]. |
| Modified Carbapenem Inactivation Method (mCIM/eCIM) reagents | Detecting carbapenemase and metallo-β-lactamase production. | Determining if enzymatic degradation within the matrix contributes to β-lactam antibiotic failure [22]. |
Signaling Pathways and Experimental Workflows
Diagram 1: Antibiotic Penetration Barrier in Biofilm
Diagram Title: Mechanisms of Antibiotic Failure in Biofilm Matrix
Diagram 2: Experimental Workflow for Matrix Barrier Analysis
Diagram Title: Workflow to Test Matrix Role in Resistance
FAQ: Understanding Biofilm Physiology and Resistance
Frequently Asked Questions
What are the key physiological states found within a single biofilm and how do they impact antibiotic efficacy? Biofilms are not homogeneous; they contain subpopulations of bacteria in distinct physiological states. A key gradient exists from the biofilm periphery to its core: cells on the outer layers are often metabolically active, while those in the inner core can enter a slow-growing or dormant state due to nutrient and oxygen gradients [1] [3]. This is critical because many conventional antibiotics, such as β-lactams, require active cell growth to be effective. Consequently, these dormant "persister" cells can survive antibiotic treatment and lead to recurrent infections [7] [23].
How does the biofilm matrix act as a diffusion barrier against antimicrobials? The extracellular polymeric substance (EPS) matrix is a primary contributor to resistance. It can hinder antibiotic penetration through two main mechanisms: binding and neutralization, and restricted diffusion. Positively charged antibiotics like aminoglycosides can bind to negatively charged components in the matrix, such as extracellular DNA (eDNA), preventing them from reaching their cellular targets [23]. The dense, gel-like physical structure of the EPS can also simply slow down the diffusion of antimicrobial molecules, creating a protective physical barrier for the encapsulated cells [1] [7].
What is the role of fluid shear during growth in determining biofilm architecture and subsequent treatment resistance? The hydrodynamic conditions under which a biofilm grows fundamentally shape its physical characteristics. Biofilms grown under high fluid shear (e.g., in flow cells or on medical device surfaces) tend to be thinner, denser, and stiffer, with a higher protein-to-polysaccharide ratio in their matrix. In contrast, biofilms grown under low fluid shear are often thicker, more porous, and more compliant [24]. These physical properties directly influence treatment success; stiffer, high-shear biofilms can require more intense adjuvant therapies (like low-frequency ultrasound) for effective antibiotic penetration compared to their low-shear counterparts [24].
Troubleshooting Common Experimental Challenges
Challenge: Inconsistent antibiotic susceptibility results in biofilm assays.
- Potential Cause: Variations in biofilm cultivation methods (e.g., static vs. flow conditions) leading to differences in biofilm maturity, thickness, and structure.
- Solution: Standardize growth conditions, including growth medium, incubation time, and hydrodynamic environment. Use assays like Optical Coherence Tomography (OCT) to characterize biofilm architecture before treatment [24]. Report key parameters like shear stress during growth.
Challenge: Failure to eradicate biofilms in a model system despite using high antibiotic concentrations.
- Potential Cause: The presence of nutrient/gradient-induced persister cells and limited antibiotic diffusion.
- Solution: Consider combination therapies. Incorporate anti-biofilm agents that disrupt the matrix (e.g., DNase to degrade eDNA, or glycoside hydrolases to break down polysaccharides) to enhance antibiotic penetration [1] [23]. Alternatively, use low-frequency ultrasound (LFU) as a physical method to increase biofilm permeability and antibiotic diffusivity [24].
Challenge: Difficulty in visualizing and quantifying metabolic heterogeneity within a biofilm.
- Potential Cause: Reliance on endpoint, bulk measurement techniques that average out local differences.
- Solution: Employ spatially resolved techniques. Use confocal laser scanning microscopy (CLSM) with fluorescent probes for metabolic activity (e.g., CTC for respiration, GFP reporters for stress) in combination with stains for live/dead cells. This allows for the correlation of metabolic activity with spatial location inside the biofilm [23].
Quantitative Data on Biofilm Heterogeneity and Resistance
Table 1: Impact of Growth Shear Conditions on Biofilm Physical Properties (P. aeruginosa model)
| Physical Property | Low-Shear Biofilm | High-Shear Biofilm | Measurement Technique |
|---|---|---|---|
| Average Thickness | 52 ± 20 µm | 29 ± 8 µm | Optical Coherence Tomography |
| Relative Roughness | 0.31 ± 0.09 | 0.18 ± 0.06 | Optical Coherence Tomography |
| Matrix Protein/Polysaccharide Ratio | 0.39 ± 0.20 | 1.15 ± 0.55 | Biochemical Assay |
| Creep Compliance (Inner Region) | 5570 ± 101 Pa⁻¹ | 31 ± 1 Pa⁻¹ | Microrheology |
| Dominant Mechanical Behavior | Viscous (α = 0.91) | Elastic (α = 0.17) | Microrheology Power Law Exponent |
Table 2: Comparative Resistance and Tolerance Mechanisms in Biofilms vs. Planktonic Cells
| Characteristic | Planktonic Cells | Biofilm Communities | Key Implication |
|---|---|---|---|
| Inherent Resistance Level | Baseline | Up to 1000x higher [1] [7] | Standard MIC tests are inadequate. |
| Primary Resistance Mechanisms | Genetic acquired resistance | Physical barrier, physiological heterogeneity, persister cells [3] [23] | Requires multi-target therapeutic strategies. |
| Contribution of Matrix | None | Critical (binding, enzymatic degradation of antibiotics) [1] [23] | Matrix-disrupting agents are essential. |
| Effect of Fluid Shear on Treatment | Minimal | Major; determines structure and stiffness, affecting adjuvant efficacy [24] | Growth conditions must be reported. |
Core Experimental Protocols for Studying Biofilm Gradients
Protocol: Measuring Antibiotic Penetration and Binding in the Biofilm Matrix
- Preparation: Grow a mature biofilm (e.g., 48-72h for P. aeruginosa) under defined shear conditions in a flow cell or on coupons.
- Fluorescent Tagging: Label the antibiotic of interest with a fluorescent tag (e.g., fluorescently tagged vancomycin). Ensure the tag does not significantly alter the antibiotic's activity.
- Perfusion and Imaging: Perfuse the tagged antibiotic over the biofilm for a set time. Use Confocal Laser Scanning Microscopy (CLSM) to capture time-lapse Z-stack images.
- Analysis: Quantify the fluorescence intensity profile from the top to the bottom of the biofilm. A steep gradient indicates poor penetration. Co-localization studies with matrix component stains (e.g., for eDNA or polysaccharides) can identify binding sites [23].
Protocol: Profiling Metabolic Gradients Using Fluorescent Reporters
- Strain Engineering: Use a bacterial strain harboring a fluorescent reporter plasmid (e.g., GFP) under the control of a promoter induced by metabolic stress (e.g., a starvation promoter) or low oxygen.
- Biofilm Growth: Grow the biofilm in a transparent flow cell or on a coverslip suitable for microscopy.
- Staining and Imaging: At maturity, counter-stain with a viability dye (e.g., propidium iodide). Image using CLSM.
- Data Quantification: Analyze the spatial distribution of the fluorescence signal. Higher GFP intensity in the biofilm core indicates a steeper metabolic gradient and identifies regions of dormant cells [23].
Visualization of Key Concepts and Workflows
Diagram 1: Biofilm development leading to heterogeneity.
Diagram 2: How matrix barriers and cell physiology cause resistance.
The Scientist's Toolkit: Essential Research Reagents and Materials
Table 3: Key Reagents and Equipment for Biofilm Microenvironment Research
| Item | Function/Application | Example Use Case |
|---|---|---|
| Flow Cell Systems | Provides controlled hydrodynamic conditions (shear) for biofilm growth. | Culturing biofilms with defined, reproducible architectures (low vs. high shear) [24]. |
| Confocal Laser Scanning Microscope (CLSM) | Non-destructive, high-resolution 3D imaging of live biofilms. | Visualizing spatial distribution of metabolic activity, pH, or oxygen gradients using fluorescent probes [23]. |
| Optical Coherence Tomography (OCT) | Label-free, real-time imaging of biofilm topography and structure. | Measuring biofilm thickness, roughness, and structural changes in response to treatments [24]. |
| DNase I | Enzyme that degrades extracellular DNA (eDNA) in the matrix. | Disrupting the biofilm matrix to study eDNA's role in antibiotic binding and to enhance antimicrobial efficacy [1] [23]. |
| Tobramycin | Aminoglycoside antibiotic commonly used in biofilm research. | A model positively charged antibiotic for studying matrix binding and penetration limitations [24] [23]. |
| Low-Frequency Ultrasound (LFU) Setup | Physical adjuvant therapy to enhance biofilm permeability. | Increasing antibiotic diffusivity within the biofilm structure in combination therapy studies [24]. |
| Fluorescent Viability/Stress Probes | Chemical dyes to report on cell physiological status. | Differentiating live/dead cells and identifying subpopulations of metabolically dormant persister cells within biofilms [23]. |
ESKAPE Pathogens and Notorious Biofilm-Formers in Clinical Settings
Quantitative Profiling of ESKAPE Pathogen Resistance and Biofilm Formation
Table 1: Antimicrobial Resistance and Biofilm Formation in Clinical ESKAPE Isolates [22]
| Pathogen | Multi-Drug Resistance (MDR) Rate | Key Resistance Markers | Strong Biofilm Formers | Notable Resistance Patterns |
|---|---|---|---|---|
| Enterococcus faecium | 90% | vanB gene (20% VRE) | Data not specified | High resistance to fluoroquinolopes (86.67%) |
| Staphylococcus aureus | 10% | mecA gene (46.7% MRSA) | Data not specified | Retained sensitivity to linezolid, SXT, gentamicin |
| Klebsiella pneumoniae | Elevated | Carbapenemase (34.3%) | High | Carbapenem (45.71%), Colistin (42.86%) |
| Acinetobacter baumannii | Elevated | Carbapenemase | High | Carbapenem (74.29%) |
| Pseudomonas aeruginosa | Relatively Lower | Carbapenemase | Moderate | Lower resistance compared to other Gram-negative pathogens |
Key Findings: A 2025 study of 165 clinical isolates revealed that 88.5% of ESKAPE pathogens form biofilms, with 15.8% being strong producers [22]. A significant correlation was observed between biofilm formation and resistance to carbapenems, cephalosporins, and piperacillin/tazobactam, suggesting biofilms play a key role in disseminating resistance to these antibiotics [22].
Essential Experimental Protocols for Biofilm Research
Function: This standard method quantifies total biofilm biomass and classifies isolates as weak, moderate, or strong biofilm producers.
Detailed Protocol:
- Inoculum Preparation: Grow bacteria overnight in a suitable broth (e.g., Tryptic Soy Broth). Dilute the culture to approximately 1 x 10^6 CFU/mL in fresh, sterile broth.
- Biofilm Growth: Dispense 200 µL of the diluted inoculum into the wells of a sterile, flat-bottom 96-well microtiter plate. Include negative control wells containing sterile broth only. Seal the plate with a lid and incubate under static conditions for 24-48 hours at the optimal temperature for the test organism (e.g., 37°C for human pathogens).
- Biofilm Staining:
- Carefully remove the planktonic cells by inverting the plate and gently tapping.
- Wash the adhered biofilms twice with 200 µL of phosphate-buffered saline (PBS), pH 7.2, to remove loosely attached cells.
- Air-dry the plate for 10-15 minutes.
- Fix the biofilms by adding 200 µL of 99% methanol to each well for 15 minutes.
- Empty the plate and allow it to dry completely.
- Stain the fixed biofilms with 200 µL of 0.1% (w/v) crystal violet solution for 5-15 minutes.
- Destaining and Quantification:
- Gently rinse the plate under running tap water to remove excess stain until the runoff is clear.
- Air-dry the plate.
- Add 200 µL of 33% (v/v) glacial acetic acid or 95% ethanol to each well to solubilize the crystal violet bound to the biofilm. Shake the plate for 10-20 minutes.
- Transfer 125 µL of the solubilized dye from each well to a new microtiter plate.
- Measure the optical density (OD) at 570-595 nm using a microplate reader.
Data Interpretation: The OD of the negative control is subtracted from the OD of test wells. Isolates are classified based on the calculated OD (ODc) as follows: Non-biofilm producer: OD ≤ ODc; Weak: ODc < OD ≤ 2xODc; Moderate: 2xODc < OD ≤ 4xODc; Strong: 4xODc < OD.
Function: Confirms the genetic potential of isolates for biofilm formation by screening for specific genes encoding surface adhesins and matrix components.
Detailed Protocol:
- DNA Extraction: Purify genomic DNA from fresh bacterial cultures using a commercial extraction kit or a standard boiling method.
- PCR Master Mix Preparation: For a 25 µL reaction, combine the following components on ice:
- 12.5 µL of 2X PCR Master Mix (containing Taq DNA polymerase, dNTPs, MgCl₂, and reaction buffers)
- 1 µL each of forward and reverse primer (10 µM stock)
- 2 µL of template DNA
- 8.5 µL of Nuclease-Free Water
- Thermal Cycling: Program a thermal cycler with the following steps:
- Initial Denaturation: 95°C for 5 minutes
- 30-35 cycles of:
- Denaturation: 95°C for 30 seconds
- Annealing: Primer-specific temperature for 30 seconds
- Extension: 72°C for 1 minute per kb of amplicon
- Final Extension: 72°C for 7 minutes
- Hold: 4°C ∞
- Amplicon Detection: Analyze the PCR products by agarose gel electrophoresis (1.5-2% gel) stained with GelRed, alongside a DNA molecular weight ladder, and visualize under UV light.
Troubleshooting Guide: FAQs for Biofilm Researchers
FAQ 1: The crystal violet assay shows high variability between replicates. What could be the cause and how can I improve consistency?
Answer: High variability often stems from technical inconsistencies. To improve reproducibility:
- Ensure Homogeneous Inoculum: Vortex the bacterial suspension thoroughly before aliquoting into the plate wells.
- Minimize Edge Effects: Use only the inner 60 wells of the 96-well plate. Fill the perimeter wells with sterile water or PBS to maintain uniform humidity and temperature during incubation.
- Standardize Washing: Use a multichannel pipette for consistent washing pressure and angle across all wells. Use the same volume of PBS for each wash step.
- Validate with Controls: Always include positive and negative controls. Ensure your assay can distinguish between known strong and weak biofilm-forming strains [25].
FAQ 2: My anti-biofilm compound is effective in the microtiter plate assay but fails in a more complex biofilm model. Why might this be happening?
Answer: This is a common translational challenge. Microtiter plate assays are excellent for screening but represent a simplified environment.
- Matrix Penetration Barrier: The EPS matrix in mature, complex biofilms can trap or neutralize compounds, preventing them from reaching all cells [1] [26]. Test your compound's efficacy against mature biofilms (e.g., 72-96 hours old) and consider using assays with continuous flow, which better model in vivo biofilm structures.
- Persister Cells: Biofilms contain metabolically dormant persister cells that are highly tolerant to antibiotics [1]. A viability assay (e.g., ATP measurement or colony counts) may show better efficacy than a biomass assay (crystal violet). Combine your compound with an agent that disrupts the matrix (e.g., DNase I, Dispersin B) to enhance penetration [27].
- Physiological Differences: Biofilm physiology differs from planktonic cells. Re-evaluate the compound's Minimum Biofilm Eradication Concentration (MBEC), which is often 10-1000 times higher than the MIC for planktonic cells [1].
FAQ 3: How can I conclusively prove that a newly identified gene is involved in biofilm formation?
Answer: Beyond correlation (e.g., PCR screening), functional validation is required.
- Create a Knockout Mutant: Use gene editing tools (e.g., CRISPR-Cas) to create an isogenic mutant strain lacking the gene of interest.
- Conduct a Complementation Test: Re-introduce a functional copy of the gene on a plasmid into the mutant strain. A true biofilm-related gene will show reduced biofilm formation in the mutant, and the phenotype will be restored to wild-type levels in the complemented strain.
- Perform Phenotypic Characterization: Compare the mutant and wild-type strains using multiple, relevant biofilm assays (e.g., microtiter plate, microscopy of biofilms on relevant surfaces, colonization in a flow cell). This demonstrates that the effect is not assay-specific [25].
Research Workflow: From Resistance Profiling to Biofilm Dispersal
The following diagram illustrates the logical workflow for investigating and targeting biofilm-mediated resistance in ESKAPE pathogens.
The Scientist's Toolkit: Key Research Reagents and Materials
Table 2: Essential Reagents for ESKAPE Biofilm Research [22] [1] [26]
| Reagent / Material | Function in Research | Example Application / Note |
|---|---|---|
| Crystal Violet (0.1%) | Stains total biofilm biomass for quantification. | Used in standard microtiter plate assays; measures adhered cells and matrix but does not indicate viability [25]. |
| Calgary Biofilm Device | Grows multiple, uniform biofilms for high-throughput susceptibility testing. | Used for determining Minimum Biofilm Eradication Concentration (MBEC). |
| DNase I | Degrades extracellular DNA (eDNA) in the biofilm matrix. | Used to study matrix composition and as a potential dispersal agent; can increase antibiotic efficacy [1] [27]. |
| Dispersin B | Hydrolyses polysaccharide (PNAG) in the biofilm matrix. | A specific glycoside hydrolase; shows >70% biofilm reduction in some models [27]. |
| PCR Reagents | Detects biofilm-forming and antibiotic resistance genes. | Primers for genes like mecA (MRSA), vanB (VRE), and species-specific adhesins are essential [22]. |
| Probiotic Strains (e.g., Lactobacillus spp.) | Source of natural anti-biofilm and antimicrobial compounds. | Caprine gut-derived isolates show growth inhibition and anti-biofilm effects against ESKAPE pathogens [28]. |
Tools of the Trade: Advanced Models and Techniques for Analyzing Matrix Barrier Function
In Vitro and In Silico Models for Studying Antibiotic Penetration Kinetics
Technical Troubleshooting Guides
Common Experimental Challenges and Solutions
FAQ: Why do my in silico predictions not match in vitro biofilm antibiotic efficacy results?
- Problem: Computational models predict effective antibiotic concentrations, but in vitro biofilm assays show persistent bacterial survival.
- Solution: This discrepancy often arises because standard molecular docking doesn't account for the extracellular polymeric substance (EPS) penetration barrier. Implement multi-scale modeling that couples:
- Verification: Correlate in silico penetration times with in vitro time-kill curve data, where a bacteriostatic effect (inhibition of growth without killing) in vitro may indicate failed penetration predicted in silico [31].
FAQ: How can I model antibiotic combinations with different half-lives in a dynamic in vitro system?
- Problem: Simulating realistic human pharmacokinetics for drug combinations where each antibiotic has a different elimination rate.
- Solution: Use a multi-compartment in vitro model with independent pump systems.
- Protocol Note: Calibrate pump flow rates based on the known half-lives (t½) of each drug to accurately mimic human serum concentration-time profiles [33].
FAQ: What causes the "Eagle Effect" in time-kill studies with biofilms, and how is it resolved?
- Problem: Paradoxically reduced bactericidal activity at high antibiotic concentrations in time-kill assays.
- Solution: This effect is often related to pH shifts, osmolarity changes, or induction of toxin-antitoxin systems in a high-density biofilm.
- Troubleshooting Steps:
- Monitor pH: Ensure the growth medium does not become acidic at high bacterial densities.
- Confirm Inoculum Size: Use a standardized, pre-grown biofilm inoculum rather than planktonic overnight culture.
- Extend Time Course: Take frequent measurements (e.g., every 2-4 hours) over 24-48 hours to capture the full dynamic of bacterial killing and potential regrowth [31].
- Troubleshooting Steps:
Model Validation and Quality Control
FAQ: How do I validate the structure of a homology-modeled protein target for in silico docking?
- Problem: The target bacterial protein (e.g., a quorum-sensing protein) has no experimentally resolved crystal structure, requiring homology modeling, which introduces uncertainty.
- Solution: Employ a multi-step validation protocol before docking studies:
- Ramachandran Plot Analysis: Use servers like MolProbity to assess the stereochemical quality of the modeled protein. >90% of residues should be in the most favored regions [29].
- Molecular Dynamics (MD) of the Apo-Protein: Run a 100-ns simulation of the "naked" protein (without ligand). A stable root mean square deviation (RMSD) after equilibration indicates a folded, stable structure [29].
- Check C-Score: If using I-TASSER for modeling, a higher C-score (e.g., >0) indicates a more reliable model [29].
Quantitative Data for Experimental Design
Key Parameters for In Vitro PK/PD Models
Table 1: Critical Parameters for Designing Dynamic In Vitro Kinetic Models
| Parameter | Description | Consideration for Biofilms | Typical Value/Example |
|---|---|---|---|
| Flow Rate | Rate of medium renewal in the system. | Slow flow mimics static biofilms (e.g., on implants); fast flow mimics shear stress conditions. | Adjusted to simulate human antibiotic half-life (e.g., for Gentamicin, t½ ~2 hrs) [32] [33]. |
| Inoculum Preparation | Method for growing the initial biofilm. | Use mature biofilms (e.g., 48-72h old) rather than planktonic cells to reflect in vivo resistance. | Pre-grow biofilm on coupons or pegs for 48 hours [34]. |
| Half-life Simulation | Simulating the exponential decline of antibiotic concentration in vivo. | Achieved by controlling the dilution rate via the hose pump. | Flow rate (K) = ln(2) / simulated t½ [33]. |
| Sampling Frequency | Intervals for collecting samples to determine bacterial counts and antibiotic concentration. | Frequent sampling is needed to capture the dynamic kill/regrowth kinetics in biofilms. | At fixed intervals (e.g., 0, 2, 4, 8, 24h) [32] [31]. |
| Synergy Analysis | Method to determine if a drug combination is synergistic. | For kinetic models, the relative reduction in bacterial count by the combination vs. individual components is calculated over time [32]. | Analogous to FIC indices from checkerboard assays [32]. |
Key Metrics for PD Analysis
Table 2: Essential Pharmacodynamic (PD) Metrics and Their Interpretation
| Metric | Definition | Significance in Biofilm Research | Methodological Note |
|---|---|---|---|
| Minimum Inhibitory Concentration (MIC) | The lowest antibiotic concentration that inhibits visible growth. | Often much higher for biofilm-derived cells than for planktonic cells, indicating tolerance. | Determined via broth microdilution using standardized inoculum [35] [31]. |
| Minimum Biofilm Eradication Concentration (MBEC) | The lowest concentration that eradicates a pre-formed biofilm. | A more clinically relevant measure for biofilm-associated infections. | Assessed using peg-lid assays (e.g., Calgary Biofilm Device) after exposing mature biofilms to antibiotics [34]. |
| Time-Kill Curve | A dynamic profile of changes in viable bacterial count over time at a fixed antibiotic concentration. | Reveals the rate and extent of bactericidal activity and can detect regrowth of resistant subpopulations in biofilms. | Samples are plated for viable counts at multiple time points (e.g., 0-24h) [31]. |
| Post-Antibiotic Effect (PAE) | The persistent suppression of bacterial growth after brief antibiotic exposure. | Can be prolonged in biofilms, influencing dosing interval design. | Determined by comparing growth recovery of exposed vs. unexposed bacteria after antibiotic removal [31]. |
Standard Experimental Protocols
Protocol: Dynamic In Vitro Kinetic Model for Antibiotic Combinations
Purpose: To simulate the in vivo concentration-time profiles of two antibiotics with different half-lives and assess their combined activity against a biofilm [32] [33].
Materials:
- Bioreactor vessel with magnetic stirrer.
- Two or more programmable hose pumps.
- Sterile nutrient broth reservoir.
- Antibiotic stock solutions.
- Waste collection vessel.
- Biofilm-coated coupons (e.g., titanium for implant studies).
Method:
- Setup: Place the pre-grown biofilm coupon into the bioreactor vessel.
- Priming: Fill the system with nutrient broth. Start the primary pump to continuously add fresh broth and remove an equal volume of waste, establishing a baseline equilibrium.
- Dosing: Inject a bolus of both antibiotics into the central chamber to achieve the target starting concentrations (e.g., peak serum levels).
- Kinetic Simulation:
- The primary pump simulates the systemic clearance shared by both drugs.
- Activate the secondary pump to continuously add a solution of the longer-half-life antibiotic, compensating for its slower elimination that cannot be mimicked by the primary pump alone [32].
- Sampling: Aseptically collect samples from the central chamber at predetermined time points (e.g., 0, 1, 2, 4, 8, 24 hours).
- Analysis:
- Viable Counts: Serially dilute samples, plate on agar, and incubate to determine CFU/mL.
- Antibiotic Assay: Use HPLC or bioassay to verify antibiotic concentrations over time.
Protocol: Integrated In Silico Workflow for Predicting Antibiotic-Biofilm Interaction
Purpose: To computationally predict the binding affinity and stability of an antibiotic or anti-virulence agent with a quorum-sensing protein target and infer its impact on biofilm formation [29].
Method:
- Target Identification & Preparation: Select a key protein involved in biofilm regulation (e.g., LuxS). If an experimental structure is unavailable, perform homology modeling using I-TASSER and validate with Ramachandran plots [29].
- Ligand Preparation: Obtain the 3D structure of the antibiotic/compound from PubChem. Energy-minimize it using software like UCSF Chimera [29].
- Molecular Docking: Perform docking simulations to predict the binding pose and affinity (e.g., binding energy ΔG). Use AutoDock Vina or similar tools.
- Molecular Dynamics (MD) Simulation:
- Solvate the protein-ligand complex in a triclinic box using water models (e.g., TIP3P).
- Use a force field (e.g., CHARMM36). Energy minimize the system.
- Equilibrate first under NVT (constant Number, Volume, Temperature) and then NPT (constant Number, Pressure, Temperature) ensembles.
- Run a production MD simulation for a sufficient time (e.g., 100-300 ns) to study stability [29] [36].
- Trajectory Analysis: Calculate key parameters to assess complex stability:
- RMSD: Backbone root mean square deviation to measure overall stability.
- RMSF: Root mean square fluctuation to identify flexible regions.
- Rg: Radius of gyration to measure compactness.
- H-Bonds: Number of consistent hydrogen bonds between ligand and protein [29].
- Binding Energy Calculation: Use Molecular Mechanics Poisson-Boltzmann Surface Area (MMPBSA) method to calculate the final free energy of binding from the MD trajectory [36].
The Scientist's Toolkit: Research Reagent Solutions
Table 3: Essential Reagents and Resources for Antibiotic Penetration Studies
| Category | Item | Function/Application | Example/Note |
|---|---|---|---|
| Software & Databases | I-TASSER | Protein structure prediction and function annotation via homology modeling. | Used for building models of quorum-sensing proteins when crystal structures are unavailable [29]. |
| GROMACS | A versatile package for performing MD simulations, energy minimization, and trajectory analysis. | Open-source software suitable for simulating antibiotic-protein interactions in a solvated environment [29]. | |
| PubChem | A database of chemical molecules and their activities. Source for 3D structures of antibiotics and bioactive compounds. | Provides .sdf files for ligands like coumaric acid, which can be energy-minimized for docking [29]. | |
| SWISS ADME | A web tool to compute ADME (Absorption, Distribution, Metabolism, Excretion) parameters and drug-likeness. | Predicts physicochemical properties (e.g., LogP, TPSA) of novel compounds early in the research pipeline [29]. | |
| In Vitro Models | Hollow Fiber Infection Model (HFIM) | An advanced in vitro system that more closely simulates human in vivo PK parameters for antibiotic studies over extended periods. | Allows for prolonged study of antibiotic effects on biofilms under dynamic concentration profiles [31]. |
| Calgary Biofilm Device | A high-throughput platform for growing multiple equivalent biofilms and assessing MBEC. | Essential for standardizing biofilm susceptibility testing [34]. | |
| Computational Resources | CHARMM Force Fields | A set of force fields for simulating biomolecular systems, including proteins, lipids, and nucleic acids. | Commonly used (e.g., CHARMM36) in MD simulations for biomolecular studies [29]. |
| UCSF Chimera | An extensible molecular modeling system for interactive visualization and analysis. | Used for ligand preparation, visualization of docking results, and trajectory analysis [29]. |
Imaging and Analytical Techniques to Visualize Drug Distribution in Biofilms
FAQs: Core Concepts and Techniques
1. Why is visualizing drug distribution in biofilms critical for antibiotic resistance research?
Biofilms are communities of bacteria encased in a self-produced extracellular polymeric substance (EPS) matrix. This matrix acts as a critical diffusion barrier, trapping and slowing the penetration of antimicrobial agents [7] [20]. Bacteria within a biofilm can exhibit a 10 to 1,000-fold increase in antibiotic resistance compared to their free-floating (planktonic) counterparts [20]. Visualizing how drugs distribute and penetrate this matrix is essential to understand the mechanisms of biofilm-specific tolerance and to develop more effective treatments that can eradicate these persistent infections [37].
2. What are the key challenges in imaging drug distribution within biofilms?
The primary challenges stem from the biofilm's complex physical and chemical nature:
- Structural Complexity: The EPS matrix is a highly hydrated, heterogeneous mixture of polysaccharides, proteins, lipids, and extracellular DNA (eDNA), which can hinder the penetration and detection of drugs [37].
- Sensitivity and Resolution: Techniques must be sensitive enough to detect often low concentrations of a drug amidst a dense biological background and provide sufficient spatial resolution to show distribution within the biofilm's 3D structure [37] [38].
- Chemical Specificity: The method must reliably distinguish the drug signal from the myriad of molecules present in the biofilm matrix [38].
3. Which molecular imaging techniques are best suited for studying drug distribution in biofilms?
No single technique provides a complete picture; a correlative approach is often most powerful. The table below summarizes the primary techniques and their applications.
Table 1: Molecular Imaging Techniques for Biofilm Drug Distribution Studies
| Technique | Key Principle | Information Gained on Drug Distribution | Spatial Resolution | Key Advantage | Key Limitation |
|---|---|---|---|---|---|
| Mass Spectrometry Imaging (MSI) [37] [38] | Maps the spatial distribution of ions based on their mass-to-charge ratio. | Direct, label-free detection and mapping of the drug molecule and its metabolites. | ~1-100 µm (technique-dependent) | High chemical specificity; can detect unknown compounds. | Requires specialized equipment and expertise; can be semi-destructive. |
| Raman Spectroscopy [39] [38] | Measures inelastic scattering of light to provide a molecular "fingerprint." | Provides information on the overall biochemical composition and can track drug presence and interaction. | ~0.5-1 µm | Label-free; can be used for live, hydrated biofilms. | Weak signal can be overwhelmed by background; requires complex data analysis. |
| Confocal Laser Scanning Microscopy (CLSM) [37] | Uses fluorescent labels and laser scanning to create optical sections. | Indirect visualization via fluorescently tagged antibiotics or dyes. | ~0.2-0.5 µm | Excellent for 3D visualization of structure and co-localization. | Requires fluorescent labeling, which may alter drug properties. |
4. Can machine learning assist in predicting antibiotic susceptibility in biofilms?
Yes. Conventional antibiotic susceptibility tests (ASTs) often fail with biofilms because they use planktonic bacteria. Recent research uses machine learning models trained on data from various analytical techniques to predict biofilm-specific susceptibility. For example:
- Matrix-Assisted Laser Desorption/Ionization-Time of Flight Mass Spectrometry (MALDI-TOF MS) has been used to predict the minimal inhibitory concentration (MIC) of tobramycin in Pseudomonas aeruginosa biofilms with 97.83% accuracy (within one dilution) [39].
- Multi-excitation Raman Spectroscopy (MX-Raman) has shown high performance in predicting the biofilm prevention concentration (BPC), achieving 80.43% accuracy [39]. These approaches represent a significant shift toward more predictive, biofilm-aware ASTs.
Troubleshooting Guides
Guide 1: Correlative Optical Spectroscopy and Mass Spectrometry Imaging
This protocol is adapted from a methodology designed for correlative imaging of drug distribution in skin tissues, which is directly applicable to biofilm sections [38].
Experimental Goal: To precisely overlay high-resolution structural information from optical spectroscopy with highly sensitive chemical mapping from mass spectrometry on the same biofilm sample.
Detailed Protocol:
Sample Preparation:
- Grow biofilms on an appropriate substrate (e.g., medical-grade material, porous membrane).
- Apply the drug of interest under desired conditions (e.g., specific concentration, time).
- Snap-freeze the biofilm and embed it in Optimal Cutting Temperature (OCT) compound.
- Section the biofilm into thin slices (5-20 µm) using a cryostat and mount them on a compatible microscope slide.
Stimulated Raman Scattering (SRS) Microscopy:
- Setup: Use a water immersion objective lens (e.g., 40x magnification) with a short working distance air condenser lens.
- Imaging: Place the mounted sample on the stage. Set laser power to a level that provides a good signal-to-noise ratio without damaging the tissue.
- Acquire a mosaic image of the entire section. Then, select a Region of Interest (ROI) and acquire high-resolution images (e.g., 512x512 pixels) at key wavenumbers:
- 2,850 cm⁻¹: Corresponds to CH₂ stretching, visualizing lipids and general biomass.
- 1,666 cm⁻¹: Corresponds to amide I, visualizing proteins [38].
Time-of-Flight Secondary Ion Mass Spectrometry (ToF-SIMS):
- Sample Transfer: Immediately transfer the same sample from the SRS microscope to the ToF-SIMS setup.
- Acquisition Parameters:
- Set ion polarity (e.g., negative ion mode for many drugs).
- Use a duty cycle of 100 ms and a mass range of 0-900 m/z.
- For the ROI, set a field of view (e.g., 0.5 x 0.5 mm) with a resolution of 256 x 256 pixels.
- Use an electron flood gun for charge compensation [38].
Data Analysis and Image Registration:
- Data Extraction: Use specialized software (e.g., SurfaceLab 7.1 for ToF-SIMS) to extract mass spectra and ion images.
- Registration: Reduce both the SRS and ToF-SIMS images to three dimensions using algorithms like Non-negative Matrix Factorization (NMF). Visualize them as RGB channels.
- Use a software tool (e.g., MATLAB's
cpselect) to select matching features between the two images. Perform image transformation to align the ToF-SIMS data (fixed image) with the optical SRS data (moving image) [38]. - Overlay: Once registered, overlay the datasets by assigning the respective images to RGB channels to create a correlative map showing drug location within the biofilm structure.
Table 2: Research Reagent Solutions for Correlative Imaging
| Item | Function / Application in the Protocol |
|---|---|
| Cryostat | For sectioning frozen biofilm samples into thin, consistent slices for imaging. |
| Optimal Cutting Temperature (OCT) Compound | An embedding medium that supports the biofilm structure during freezing and sectioning. |
| Water Immersion Objective Lens | Provides high-resolution imaging for SRS microscopy with minimal aberration. |
| Software (e.g., SurfaceLab, MATLAB) | For data acquisition, mass spectrum calibration, and advanced image processing/registration. |
Troubleshooting Common Issues:
- Problem: Poor Signal-to-Noise in SRS Imaging.
- Cause: Laser power may be too low, or the biofilm may be too thick or heterogeneous.
- Solution: Optimize laser power settings. Ensure sections are of uniform thickness. Increase line averaging during acquisition, though this will increase scan time.
- Problem: Charging Effects in ToF-SIMS.
- Cause: The biofilm sample is not sufficiently conductive, leading to a buildup of charge from the primary ion beam.
- Solution: Ensure the electron flood gun is correctly calibrated and operating. Apply a thin, conductive coating (if compatible with the analysis) or use lower primary ion currents [38].
- Problem: Poor Image Registration/Alignment.
- Cause: Lack of distinct, matching features between the SRS and ToF-SIMS images, or significant sample deformation between analyses.
- Solution: Use fiducial markers on the sample slide prior to analysis. Ensure the sample is transferred carefully and analyzed promptly after SRS imaging to minimize degradation or drift.
Guide 2: Addressing Biofilm Detection and Variability in Drug Response
Experimental Goal: To reliably detect and quantify biofilm formation, which is a prerequisite for meaningful drug distribution studies, and to account for heterogeneity in biofilm populations.
Detailed Protocol: Tissue Culture Plate Method (TCPM) - The Gold Standard [40]
- Biofilm Growth:
- Inoculate a loopful of test bacteria into 10 mL of trypticase soy broth supplemented with 1% glucose.
- Incubate for 24 hours.
- Biofilm Formation in Microplate:
- Dispense 180 µL of sterile trypticase soy broth into wells of a sterile 96-well flat-bottom polystyrene plate.
- Add 20 µL of the bacterial suspension to each well (1:10 dilution).
- Cover the plate and incubate at 37°C for 24 hours.
- Biofilm Staining and Quantification:
- Gently shake the plate and discard the contents to remove planktonic cells.
- Wash each well 3-4 times with sterile distilled water to remove non-adherent cells.
- Fix the adhered biofilm with 200 µL of 2% sodium acetate for 30 minutes.
- Wash the wells again.
- Stain the biofilm with 200 µL of 0.1% crystal violet for 15 minutes.
- Wash the plate thoroughly and let it dry inverted.
- Elute the bound dye with 200 µL of 95% ethanol or acetic acid.
- Measure the optical density (OD) of the eluted dye at 570-595 nm using a microplate reader [40].
Troubleshooting Common Issues:
- Problem: High Variability in Biofilm Formation Between Replicates.
- Cause: Inconsistent inoculation density, uneven temperature in the incubator, or plate edge effects.
- Solution: Standardize the initial bacterial suspension to a specific OD (e.g., 0.5 McFarland). Use a plate sealer to prevent evaporation and place the plate in the center of a well-calibrated incubator. Include control wells with broth only to subtract background.
- Problem: Drug Response Does Not Correlate with Planktonic AST Results.
- Cause: This is expected. Biofilms possess distinct tolerance mechanisms, including persister cells (dormant, tolerant cells) and altered microenvironments (e.g., low oxygen, acidic pH) that are not present in standard ASTs [7] [20].
- Solution: Use biofilm-specific susceptibility metrics like the Biofilm Prevention Concentration (BPC), defined as the lowest antibiotic concentration that prevents at least 90% of biofilm growth compared to the control [39]. Incorporate techniques like IMC or Raman spectroscopy that measure the metabolic response of the biofilm community [39].
Visualizing Workflows and Pathways
The following diagrams illustrate a general experimental workflow for correlative imaging and a key signaling pathway that influences biofilm properties relevant to drug penetration.
Frequently Asked Questions (FAQs)
FAQ 1: Why is measuring biofilm thickness critical in antimicrobial resistance research? Biofilm thickness is not just a structural metric; it is a direct determinant of treatment efficacy. Thicker biofilms can create significant physical and physiological barriers that reduce antibiotic penetration and foster heterogeneous microenvironments. This can lead to up to a 1000-fold increase in antibiotic resistance compared to planktonic cells [41]. Furthermore, an optimal thickness is context-dependent; for instance, in bioelectrochemical systems, a maximum current density was observed at a thickness of 100–150 µm, beyond which mass transfer limitations occur [42]. Accurate thickness measurement is therefore essential for understanding and overcoming treatment failures.
FAQ 2: My antibiotic diffusion assays are inconsistent. What key factors should I control? Inconsistent results often stem from unaccounted for variability in biofilm biology and experimental conditions. Key factors to control include:
- Biofilm Architecture: Biofilms are inherently heterogeneous. Ensure you sample multiple locations or use techniques that provide spatial averages (e.g., OCT) [43] [44].
- Sorption and Reaction: The antibiotic may not just diffuse; it can be bound (sorbed) or degraded (e.g., via enzymatic reaction) by the biofilm matrix [45]. These processes must be characterized for your specific antibiotic-biofilm pair.
- Nutrient and Growth Conditions: These drastically affect biofilm matrix composition, density, and thereby diffusion resistance [41]. Standardize growth media and incubation times.
FAQ 3: What are the primary techniques for non-invasive biofilm thickness monitoring, and how do I choose? The choice of technique depends on your required resolution, whether you need in-situ or ex-situ measurement, and your access to equipment. The following table summarizes key technologies:
Table 1: Non-Invasive Biofilm Thickness Measurement Techniques
| Technique | Typical Resolution | Key Principle | Primary Application Context | Advantages & Limitations |
|---|---|---|---|---|
| Optical Coherence Tomography (OCT) [43] [44] [42] | ~1 µm | Interferometry with near-infrared light to capture 2D/3D cross-sectional images. | Lab-scale; in-situ monitoring of biofilm development on transparent surfaces. | Advantages: Non-invasive, real-time, provides structural detail.Limitations: Often requires manual analysis; limited penetration of dense biofilms. |
| Ultrasound-based Sensors [46] | ±5 µm | Measures the time-of-flight of an ultrasonic pulse reflected from the biofilm-metal interface. | Industrial water systems; real-time, in-situ monitoring. | Advantages: Robust, suitable for opaque systems, direct thickness reading.Limitations: Lower resolution than OCT. |
| Heat-Transfer Based Sensors [42] | N/A (measures fouling factor) | Measures the reduction in heat transfer across a fouled surface. | Industrial systems (e.g., cooling towers, bioelectrochemical systems). | Advantages: In-situ, real-time, correlates with operational efficiency.Limitations: Does not directly measure thickness; requires calibration. |
FAQ 4: How can I quantify biofilm density and its effect on diffusion? Directly measuring the density of a hydrated biofilm is challenging. A common and effective proxy is to use Optical Coherence Tomography (OCT) in combination with other methods [44]. The workflow is:
- Use OCT to measure the biofilm thickness and total biovolume.
- Use a parallel method to quantify the total number of cells (e.g., via Colony Forming Units - CFU) or total biomass (e.g., protein content).
- Calculate an areal density (e.g., CFU per unit area) or volumetric density (e.g., CFU per unit volume of biofilm). In a study on MRSA biofilms, this combined approach (OCT + bioluminescence) was necessary to accurately predict the viable bacterial load from the bioluminescent signal, as density affects metabolic readouts [44].
FAQ 5: What are the emerging technologies for biofilm parameter analysis?
- Machine Learning/AI: Deep learning models, such as Convolutional Neural Networks (CNNs), can now predict biofilm thickness directly from simple surface images, potentially bypassing the need for complex OCT systems [43].
- Large-Area Automated AFM: This technique overcomes the traditional limitation of small scan areas, enabling high-resolution (nanometer-scale) topological and mechanical characterization over millimeter-scale areas, revealing details like flagellar interactions and single-cell orientation within biofilms [47].
- Molecular Analysis: Monitoring Quorum Sensing (QS)-related mRNA (e.g., lasI gene in Pseudomonas aeruginosa) in effluent water shows promise as a non-invasive proxy for detecting biofilm dispersion in systems like drinking water distribution networks [48].
Troubleshooting Guides
Guide for Penetration Failure in Diffusion Assays
Problem: Antibiotics are failing to penetrate the biofilm, leading to treatment resistance.
Table 2: Troubleshooting Biofilm Diffusion Barriers
| Observed Symptom | Potential Root Cause | Diagnostic Experiments | Recommended Solutions |
|---|---|---|---|
| No antibiotic detected in biofilm core. | Catalytic degradation: e.g., β-lactamases rapidly inactivating the antibiotic [45]. | - Measure antibiotic concentration in biofilm supernatant vs. core.- Test for presence of specific enzymes (e.g., with nitrocefin for β-lactamase). | - Use enzyme-stable antibiotics or combine with enzyme inhibitors.- Increase antibiotic concentration (if toxicity allows). |
| Antibiotic penetrates slowly but is not degraded. | Reversible sorption: Antibiotic molecules binding to components of the Extracellular Polymeric Substance (EPS) [45] [41]. | - Conduct sorption isotherm experiments with isolated EPS components. | - Use antibiotics with low binding affinity to common EPS components (e.g., DNA, polysaccharides).- Incorporate EPS-disrupting agents (e.g., DNase, dispersin B). |
| Gradient of antibiotic, with concentration decreasing from top to bottom. | Reaction-diffusion interaction: A combination of slow diffusion and consumption/reactivity within the biofilm [45]. | - Create a reaction-diffusion model to fit your experimental data. | - Focus on strategies to enhance diffusion (e.g., reduce biofilm density with matrix-targeting enzymes).- Consider non-standard antibiotic regimens (e.g., pulse dosing). |
Guide for Inaccurate Thickness Measurements
Problem: Measurements of biofilm thickness are highly variable or do not match visual observations.
Table 3: Troubleshooting Biofilm Thickness Measurements
| Observed Symptom | Potential Root Cause | Diagnostic Experiments | Recommended Solutions |
|---|---|---|---|
| OCT images appear blurry or cannot detect the biofilm-substratum interface. | Biofilm is too optically dense or the refractive index settings are incorrect [43]. | - Adjust the focus and signal intensity of the OCT.- Validate with a control sample of known thickness. | - Use a different wavelength if available.- Ensure proper calibration of the refractive index for your biofilm medium. |
| Ultrasound sensor shows biofilm growth, but values seem inaccurate. | Sensor calibration is off or the deposit is not purely biological (could be scale or organic foulant) [46]. | - Clean the surface and perform a new calibration.- Use a complementary method (e.g., microscopy of a coupon) to validate. | - Use a sensor with deposit differentiation capabilities [46].- Establish a site-specific correlation between sensor reading and actual thickness. |
| High variability between thickness measurements across the same sample. | True biological heterogeneity in biofilm structure [47] [42]. | - Take a larger number of measurements (e.g., multiple OCT scans across the surface). | - Report the average thickness and the standard deviation.- Use automated image analysis and large-area scanning to improve representativeness [43] [47]. |
Experimental Protocols
Protocol: Quantifying Biofilm Thickness and Density using OCT and Bioluminescence
This protocol is adapted from a dual-modality imaging study on MRSA biofilms [44].
1. Principle: Combine the 3D structural data from OCT with the metabolic activity data from bioluminescence to achieve a quantitative assessment of viable bacterial burden within the context of biofilm structure.
2. Reagents and Equipment:
- Strain: Bioluminescent bacterial strain (e.g., SAP231-luxCDABE for MRSA) [44].
- Growth Medium: Appropriate broth and agar.
- Imaging System: Optical Coherence Tomography (OCT) system.
- Detection System: Bioluminescence imager or luminometer.
- Software: Image analysis software (e.g., for OCT image segmentation, MATLAB, Python).
3. Procedure:
- Biofilm Cultivation: Grow biofilms in suitable devices (e.g., 24-well plates, macrofluidic flow cells) under controlled conditions for desired time.
- Bioluminescence Imaging (BLI): Acquire bioluminescence images of the biofilm to measure the total photon flux (Bioluminescence Intensity, BLI).
- OCT Imaging: Perform multiple, non-invasive OCT scans at various locations on the biofilm to obtain cross-sectional images.
- Image Analysis:
- Use a CNN-based regression model or standard image analysis to calculate the average biofilm thickness from OCT scans [43].
- Segment the OCT images to determine the total biofilm biovolume.
- Correlation and Modeling:
- For a subset of samples, homogenize the biofilm and perform Colony Forming Unit (CFU) counts to determine the absolute viable cell count.
- Construct a linear regression model to correlate BLI and OCT-derived metrics (thickness, biovolume) with the CFU data. The study found that BLI alone underestimated the burden in dense biofilms (R²=0.59), but combining it with OCT structural data significantly improved the correlation (R²=0.84) [44].
Protocol: Theoretical Framework for Analyzing Antibiotic Diffusion into Biofilms
This protocol outlines the mathematical modeling approach from a foundational theoretical study [45].
1. Principle: Solve unsteady material balance equations to model different scenarios of antibiotic interaction with the biofilm, which helps distinguish between mere diffusion limitation and active resistance mechanisms.
2. Reagents and Equipment:
- Data: Experimental data on antibiotic concentration over time at different biofilm depths (e.g., from microsensor measurements).
- Software: Mathematical computing software (e.g., MATLAB, COMSOL) for solving partial differential equations.
3. Procedure:
- Define the System: The model is based on unsteady material balances for the antibiotic and any reactive biomass constituents, with associated boundary and initial conditions [45].
- Test Different Scenarios: Solve the equations for these five cases, which increase in complexity:
- Case 1: Non-interacting solute. Establishes a baseline for pure diffusion time.
- Case 2: Reversibly sorbing solute. Tests for antibiotic binding to the matrix.
- Case 3: Irreversibly sorbing solute. Tests for permanent sequestration.
- Case 4: Stoichiometrically reacting solute. Models consumption of antibiotic.
- Case 5: Catalytically reacting solute. Models enzymatic degradation (e.g., by β-lactamases).
- Fit Model to Data: Input your experimental data and determine which model scenario best fits the observed penetration profile. The study concluded that while sorption causes some retardation, a sufficiently rapid catalytic reaction is the most viable explanation for severe penetration failure of antibiotics like β-lactams [45].
Visualization Diagrams
Biofilm Parameter Measurement Technologies
Mechanisms of Biofilm-Associated Antibiotic Resistance
The Scientist's Toolkit: Research Reagent Solutions
Table 4: Essential Reagents and Materials for Biofilm Parameter Analysis
| Item Name | Function/Application | Key Characteristics |
|---|---|---|
| Macrofluidic/Flow Cell Devices [44] [42] | Cultivating biofilms under controlled, reproducible hydrodynamic conditions that mimic natural or industrial environments. | Enable in-situ imaging; allow precise control of shear stress and nutrient delivery. |
| Bioluminescent Bacterial Strains (e.g., SAP231-luxCDABE) [44] | Serve as reporter strains for non-destructive, real-time monitoring of metabolic activity and viable bacterial burden in biofilms. | Genetically engineered to express luciferase enzymes; signal correlates with metabolic activity. |
| DNase I | An enzyme that degrades extracellular DNA (eDNA), a key structural component of the EPS matrix in many biofilms [41]. | Used experimentally to disrupt the biofilm matrix and test the role of eDNA in diffusion barrier function and stability. |
| Quorum Sensing Inhibitors (QSIs) (e.g., RNAIII-inhibiting peptides) [49] | Molecules that interfere with bacterial cell-to-cell communication, potentially reducing biofilm formation and virulence. | Research tools for investigating the role of QS in biofilm development and as potential anti-biofilm agents. |
| CNN-Based Thickness Prediction Model [43] | A deep learning tool trained to predict average biofilm thickness from simple 2D membrane surface images. | Emerging technology that can reduce reliance on complex OCT systems; offers rapid, automated analysis. |
High-Throughput Screening for Anti-Biofilm Compound Discovery
Troubleshooting Guides: Addressing Common HTS Challenges
FAQ: How can I distinguish between true antibacterial effects and specific antibiofilm activity during screening?
Challenge: A common issue in primary screening is the inability to differentiate between compounds that generally inhibit bacterial growth and those that specifically disrupt the biofilm matrix without affecting planktonic cell viability.
Solution: Implement a multi-tiered screening protocol with distinct assay conditions [50]:
- Primary Screen: Test compounds against biofilm-forming cultures. In a screen of 3,386 repurposed compounds, 72% showed activity against planktonic cells, but only 19.3% affected biofilm formation, and a mere 12.6% disrupted preformed biofilms [50].
- Counter-Screening: Immediately retest hits against planktonic cultures under identical conditions. Exclude compounds that show general antibacterial activity (growth inhibition >10%) from the antibiofilm hit list [50].
- Dose-Response Validation: Confirm specific antibiofilm activity through dose-response curves comparing biofilm inhibition versus planktonic growth inhibition.
Preventative Measures:
- Include control wells with known antibacterial agents (e.g., clarithromycin) and specific biofilm disruptors (e.g., DNase I) in every plate [51].
- Normalize biofilm measurements to bacterial biomass using crystal violet staining coupled with viability counts [51].
FAQ: What steps can I take when my HTS assay shows high variability and poor reproducibility?
Challenge: Inconsistent results between technical replicates and screening rounds, often due to suboptimal biofilm formation or assay conditions.
Solution: Systematically optimize and validate key assay parameters before primary screening [51]:
Table 1: Optimization Parameters for Biofilm HTS Assays
| Parameter | Optimal Range | Impact of Deviation | Validation Method |
|---|---|---|---|
| Inoculum Concentration | 10⁷ CFU/mL for mycobacteria [51] | 10⁶ CFU/mL: Weak biofilm, high variability; 10⁸ CFU/mL: Minimal antibiotic susceptibility [51] | CV staining + viability counts |
| Growth Medium | Synthetic cystic fibrosis sputum medium (SCFM) for physiological relevance [51] | Standard media may not induce relevant biofilm phenotypes [51] | Compare biofilm mass and architecture |
| Incubation Time | 5 days for M. abscessus biofilms [51] | Shorter times: Immature biofilms; Longer times: Excessive variability [51] | Time-course CV staining |
| Z-factor Threshold | >0.5 (ideal >0.65) [50] | <0.5: Unreliable assay unable to distinguish signals [50] | Calculate from positive/negative controls |
Additional Quality Controls:
- Technical Replicates: Use ≥12 replicates in 96-well format or ≥24 in 384-well format [51].
- Plate Uniformity: Test edge effects by comparing center versus perimeter well values.
- Control Performance: Monitor positive (antibiotic) and negative (DMSO) controls across plates to detect drift.
FAQ: How can I efficiently manage and analyze the large datasets generated from HTS campaigns?
Challenge: The volume of data from HTS (thousands of compounds across multiple conditions and replicates) creates analytical bottlenecks and difficulties in hit identification.
Solution: Implement specialized software platforms and machine learning approaches [52] [53]:
Data Management Strategies:
- Use integrated platforms like CDD Vault for HTS data management, providing visualization tools that handle hundreds of thousands of data points in real-time [53].
- Apply machine learning modules for automated population discrimination, as demonstrated with imaging flow cytometry data where a "super parameter" classifier combining dozens of morphological features distinguished single cells from aggregates [52].
- Implement standardized hit selection criteria prior to screening (e.g., ≥30% biofilm inhibition for primary hits, ≥60% for confirmation) [51].
Visualization Techniques:
- Utilize scatterplots and histograms to visualize multidimensional HTS data and identify outliers [53].
- Apply filters interactively to refine hit selection based on multiple parameters simultaneously [53].
Experimental Protocols for Key Assays
Protocol 1: High-Throughput Screening of Biofilm Inhibition Using Crystal Violet Assay
Purpose: Identify compounds that inhibit biofilm formation in a 384-well plate format [51].
Table 2: Key Reagent Solutions for Biofilm HTS
| Reagent | Function | Application Notes |
|---|---|---|
| Synthetic Cystic Fibrosis Sputum Medium (SCFM) | Mimics in vivo lung environment for physiologically relevant biofilm formation [51] | Essential for expression of pathogenicity factors not seen in standard media [51] |
| Crystal Violet Solution (0.1%) | Stains biofilm biomass [51] | Quantifies total biofilm, not distinguishing live/dead cells [54] |
| SYTO 60 (10μM) & TOTO-1 (2μM) | Membrane-permeable and impermeable dyes for identifying eDNA and living cells in biofilm matrix [54] | Superior to TO-PRO-3 which penetrates viable cells and overestimates biofilm [54] |
| Acoustic Ejection Mass Spectrometry | Label-free detection of enzymatic reactions and cellular metabolites [55] | Enables rich, high-resolution outputs for difficult-to-detect reactions [55] |
| Dispersin B & DNase I | Enzymatic degradation of polysaccharide and eDNA matrix components [56] | Positive control for biofilm disruption; enhances antibiotic penetration [56] |
Step-by-Step Workflow:
- Preparation: Dispense compounds into 384-well plates using liquid handlers. Include controls: negative control (DMSO only), positive control (70μg/mL clarithromycin), and blank (media only) [51].
- Inoculation: Add bacterial suspension (10⁷ CFU/mL in SCFM) to compound plates. For M. abscessus, use 5-day static incubation at 37°C [51].
- Staining:
- Carefully remove planktonic cells and media by inversion.
- Fix biofilms with methanol for 15 minutes, then air-dry.
- Add 0.1% crystal violet solution for 15 minutes.
- Wash thoroughly with water to remove unbound stain.
- Solubilize bound stain with 30% acetic acid.
- Quantification: Measure absorbance at 595nm. Calculate percentage inhibition compared to DMSO-treated controls.
- Hit Selection: Primary hits typically show ≥30% biofilm inhibition. For a library of 24,000 compounds, this typically yields 1.5-2% primary hits [51].
Protocol 2: Advanced Biofilm Phenotyping Using Imaging Flow Cytometry
Purpose: Characterize the structural complexity and metabolic heterogeneity of biofilm aggregates at single-cell resolution [52].
Procedure:
- Sample Preparation:
- Collect biofilm samples from surfaces using gentle scraping.
- Homogenize and sonicate at 120W for 5 minutes to disperse aggregates without killing cells [54].
- Dilute in equivalent volume of PBS.
Dual Staining:
- Prepare staining solution: 1mM TOTO-1 and 5mM SYTO 60 in 300μL PBS [54].
- Add to samples, protect from light, and incubate 10 minutes at room temperature.
- Wash by centrifugation and resuspend in FACS Buffer (PBS + 1% BSA).
Imaging Flow Cytometry:
- Use Amnis FlowSight or similar imaging flow cytometer.
- Set SSC as threshold using buffer-only control [54].
- Collect data for 10,000-50,000 events per sample.
Machine Learning Analysis:
- Use IDEAS software machine learning module.
- Manually select representative populations of singlets and aggregates.
- Generate "super parameter" classifier using linear discriminant analysis (LDA).
- Apply classifier to distinguish single cells, small aggregates (2-3 cells), and large aggregates (>3 cells) [52].
Metabolic Activity Assessment:
- Add RedoxSensor Green (RSG) to measure cellular redox potential.
- Correlate aggregation state with metabolic activity [52].
Interpretation: Biofilm samples with higher percentages of large aggregates (e.g., 17.5% of all objects) typically show dominant populations of active microbial cells (75.3%), confirming the protective role of cellular aggregates [52].
The Scientist's Toolkit: Essential Research Reagents and Solutions
Table 3: Comprehensive Reagents for Anti-Biofilm HTS
| Category | Specific Reagents | Function & Application |
|---|---|---|
| Biofilm Growth Media | Synthetic Cystic Fibrosis Sputum Medium (SCFM) [51] | Mimics in vivo conditions for clinically relevant biofilm phenotypes |
| Staining Dyes | SYTO 60 (10μM) + TOTO-1 (2μM) [54], Crystal Violet (0.1%) [51], RedoxSensor Green [52] | Distinguish live/dead cells, eDNA, metabolic activity, and total biomass |
| Enzymatic Disruptors | Dispersin B [56], DNase I [56] [51] | Positive controls for matrix degradation; enhance antibiotic efficacy |
| Advanced Detection | Acoustic Ejection Mass Spectrometry [55], MALDI-TOF [55] | Label-free detection of metabolites and reactions in complex matrices |
| Data Analysis Tools | CDD Vault [53], IDEAS Software ML Module [52] | Manage HTS data, visualize results, and apply machine learning classification |
| Reference Compounds | AHL analogs [56], Engineered AMPs [56], Silver nanoparticles [56] | Known antibiofilm agents for assay validation and mechanism studies |
Assessing the Role of Quorum Sensing in Matrix Production and Regulation
Frequently Asked Questions (FAQs)
1. What is the fundamental connection between Quorum Sensing (QS) and biofilm matrix production? QS is a cell-cell communication system that allows bacteria to coordinate gene expression based on population density. When the concentration of QS signaling molecules, known as autoinducers, reaches a threshold, it triggers the expression of genes responsible for producing extracellular matrix components [57] [58]. This matrix, composed of substances like exopolysaccharides (EPS), proteins, and extracellular DNA (eDNA), forms the protective structure of the biofilm, contributing significantly to antibiotic resistance [23] [59].
2. Why are biofilms associated with matrix production particularly resistant to antibiotics? The matrix contributes to antibiotic resistance through several mechanisms, many of which are regulated by QS [58]:
- Physical Barrier: The matrix can hinder antibiotic penetration into the biofilm [23].
- Chemical Modification: Some matrix components can bind to or degrade antibiotics [58] [23].
- Altered Microenvironment: The matrix creates heterogeneous conditions, leading to bacterial subpopulations with reduced metabolic activity that are more tolerant to antibiotics [58].
- Efflux Pumps: QS can upregulate efflux pump systems that actively expel antibiotics from bacterial cells [58].
3. Which QS systems regulate matrix production in Pseudomonas aeruginosa? P. aeruginosa, a model organism for biofilm studies, employs a hierarchical QS system [60]:
- LasI-LasR System: This is the primary regulator, using the signal molecule 3OC12-HSL. It directly activates the transcription of genes for matrix polysaccharides like Psl [61] and also controls the downstream Rhl system.
- RhlI-RhlR System: This system uses BHL as its signal and is involved in the translational regulation of Psl polysaccharide production [61].
- PQS System: The Pseudomonas Quinolone Signal system also contributes to biofilm development and maturation [60].
4. Can targeting Quorum Sensing be a viable strategy to combat biofilm-related antibiotic resistance? Yes, disrupting QS, a strategy known as "quorum quenching," is a promising alternative to traditional antibiotics [58] [62]. By inhibiting QS, the production of virulence factors and the development of the mature biofilm matrix can be prevented, potentially making the bacterial community more susceptible to antimicrobial agents and the host immune system [57] [63].
Troubleshooting Guides
Problem: Inconsistent Biofilm Matrix Production inP. aeruginosaCultures
Potential Causes and Solutions:
- Cause 1: Improper QS Signal Molecule Accumulation.
- Solution: Ensure cultures are grown with adequate aeration and for a sufficient duration to allow cell density to reach the required threshold. For static biofilms, do not disturb the cultures during incubation. Exogenously add synthetic autoinducers (e.g., 3OC12-HSL or C4-HSL) to the medium to confirm QS-dependent phenotypes [61].
- Cause 2: Use of QS-Deficient Mutants.
- Solution: Regularly streak for single colonies and check for pyocyanin production (a green-blue pigment) or other QS-controlled traits to ensure culture purity. Perform genotypic confirmation (e.g., PCR) of key QS genes like lasI, lasR, rhlI, or rhlR if working with lab strains [60].
- Cause 3: Variation in Growth Media.
- Solution: Use standardized, chemically defined media where possible. Be aware that matrix composition (e.g., Psl vs. Pel) can shift depending on the carbon source [23].
Problem: Difficulty in Quantifying Matrix Components
Potential Causes and Solutions:
- Cause 1: Inefficient Extraction of Matrix Components.
- Solution: For polysaccharide isolation, optimize the method based on the specific polymer. For Psl in P. aeruginosa, a common protocol involves harvesting biofilm cells, washing, and then incubating them in a Disruption Buffer (e.g., 10 mM Tris-HCl, 5 mM EDTA, pH 8.0) to solubilize the matrix. Subsequent centrifugation separates the cells from the crude matrix extract [61].
- Cause 2: Lack of Sensitive Detection Assays.
- Solution: Employ multiple complementary techniques:
- Psl Polysaccharide Detection: Use an ELISA-based method with Psl-specific antibodies [61].
- eDNA Quantification: Isclude the matrix component eDNA from biofilm samples using centrifugation and quantify it using a fluorescent dye like PicoGreen [23].
- General Staining: Use fluorescently-labeled lectins (e.g., concanavalin A) that bind specific sugars in the EPS and visualize via confocal microscopy [23].
- Solution: Employ multiple complementary techniques:
Quantitative Data on QS and Matrix Regulation
Table 1: Key Matrix Components and Their Regulation by Quorum Sensing in Model Bacteria
| Bacterial Species | QS System | Key Matrix Component | Regulatory Role of QS | Functional Impact |
|---|---|---|---|---|
| Pseudomonas aeruginosa | LasI/LasR | Psl polysaccharide | LasR activates psl operon transcription [61]. | Primary scaffold for biofilm structure [23]. |
| RhlI/RhlR | Psl polysaccharide | RhlR activates translation of psl mRNA [61]. | Primary scaffold for biofilm structure [23]. | |
| All Systems | Extracellular DNA (eDNA) | QS regulates bacterial autolysis and release of eDNA [60]. | Stabilizes matrix structure; contributes to cation gradient [23]. | |
| Vibrio cholerae | AI-2, Qrr sRNAs | RbmA, RbmC, Bap1 proteins | Qrr sRNAs suppress the master regulator HapR, de-repressing matrix protein production [64]. | RbmA drives fractal wrinkling and cell-cell adhesion; RbmC/Bap1 maintain interfacial stability [64]. |
| Staphylococcus aureus | Agr (AIP-based) | Phenol-Soluble Modulins (PSMs) | Agr system upregulates PSM production [58]. | Promotes biofilm structuring and dispersal [23]. |
Experimental Protocols
Protocol 1: Assessing QS-Regulated Psl Production inP. aeruginosavia ELISA
Objective: To quantitatively measure the production of the QS-regulated Psl polysaccharide in P. aeruginosa wild-type and QS-mutant strains.
Materials:
- Psl-specific antibody (commercially available)
- Anti-mouse IgG-HRP secondary antibody
- TMB substrate solution
- Blocking buffer (e.g., PBS with 1% BSA)
- icrotiter plate reader
- Research Reagent Solutions:
- Disruption Buffer: 10 mM Tris-HCl, 5 mM EDTA, pH 8.0. Function: Solubilizes the Psl matrix from bacterial cells for analysis [61].
Methodology:
- Biofilm Growth: Grow P. aeruginosa biofilms in 96-well polystyrene plates for 24-48 hours under static conditions at 37°C.
- Matrix Extraction: Carefully remove planktonic cells and wash the biofilm with PBS. Add Disruption Buffer to each well and incubate with shaking for 2 hours at room temperature [61].
- ELISA Procedure:
- Coat a new 96-well ELISA plate with the extracted matrix solution overnight at 4°C.
- Block plates with blocking buffer for 1-2 hours.
- Incubate with primary Psl antibody, followed by HRP-conjugated secondary antibody.
- Develop with TMB substrate and measure absorbance at 650 nm.
- Analysis: Compare Psl levels between strains. A significant reduction in a lasR or rhlR mutant confirms QS regulation of Psl [61].
Protocol 2: Visualizing QS-Dependent Biofilm Architecture via Confocal Microscopy
Objective: To visualize the impact of QS inhibition on the three-dimensional structure of the biofilm matrix.
Materials:
- Confocal Laser Scanning Microscope (CLSM)
- Flow cell system or glass-bottom culture dishes
- Fluorescent stains (e.g., SYTO 9 for cells, ConA-TRITC for polysaccharides)
- QS inhibitor (e.g., furanone compound) or synthetic autoinducer.
Methodology:
- Biofilm Growth: Grow biofilms in flow cells with a continuous supply of medium with or without a QS inhibitor [60].
- Staining: Gently introduce a fluorescent stain mixture into the flow channel and incubate in the dark.
- Image Acquisition: Use CLSM to capture Z-stacks of the biofilm at various locations.
- Image Analysis: Use software (e.g., ImageJ, COMSTAT) to calculate biovolume, thickness, and roughness. QS-inhibited biofilms are expected to be thinner and structurally underdeveloped compared to controls [57] [60].
Signaling Pathway Visualization
QS Regulation of Matrix in P. aeruginosa
Experimental Workflow for QS-Matrix Analysis
Research Reagent Solutions
Table 2: Essential Reagents for Investigating QS and Matrix Production
| Reagent | Function/Biological Role | Example Application |
|---|---|---|
| Synthetic Autoinducers(e.g., 3OC12-HSL, C4-HSL) | Chemically defined QS signaling molecules used to complement mutants or manipulate QS timing [61]. | Restoring matrix production in a lasI rhlI double mutant to confirm QS dependency [61]. |
| QS Inhibitors (QSI)(e.g., furanones, halogenated compounds) | Small molecules that block QS receptor binding or signal generation [62]. | Treating biofilms to observe inhibition of matrix production and increased antibiotic susceptibility [63]. |
| Psl-Specific Antibody | Monoclonal or polyclonal antibody for specific detection and quantification of Psl exopolysaccharide [61]. | Quantifying Psl via ELISA in different genetic backgrounds or under QSI treatment [61]. |
| Fluorescent Lectins(e.g., ConA, WGA) | Carbohydrate-binding proteins that label specific sugar residues in the EPS matrix [23]. | Visualizing polysaccharide distribution and overall biofilm architecture using confocal microscopy [23]. |
| Nucleic Acid Stains(e.g., PicoGreen, SYTO dyes) | Fluorescent dyes that bind to DNA, used to label cells (if membrane-permeant) or quantify eDNA [23]. | Quantifying the eDNA content of biofilm matrix extracts or visualizing it within the 3D structure [23]. |
| c-di-GMP Analogs/Modulators | Molecules that mimic or alter intracellular levels of the secondary messenger c-di-GMP, a key regulator of the biofilm lifestyle [60] [23]. | Investigating the interplay between QS and c-di-GMP signaling in controlling matrix gene expression [60]. |
Breaching the Wall: Innovative Strategies to Overcome and Disrupt the Matrix Barrier
Bacterial biofilms are structured communities of microorganisms enclosed in a self-produced extracellular polymeric substance (EPS) that constitutes the biofilm matrix [65] [66]. This matrix acts as a critical diffusion barrier, severely limiting the penetration and efficacy of antimicrobial agents [4]. Consequently, bacteria within biofilms can exhibit antibiotic tolerance up to 1,000 times greater than their free-floating (planktonic) counterparts [67]. The EPS is a complex mixture of exopolysaccharides, proteins, extracellular DNA (eDNA), and lipids [66] [67]. Targeting these structural components with matrix-degrading enzymes presents a promising therapeutic strategy to disrupt biofilm integrity, enhance antibiotic penetration, and restore susceptibility to treatment [66] [67]. This technical resource provides practical guidance for researchers employing DNases, Dispersin B, and Glycoside Hydrolases in their experiments against biofilm-mediated antibiotic resistance.
Frequently Asked Questions (FAQs)
Q1: What are the primary advantages of using enzymatic treatments over conventional antibiotics for biofilm eradication? Enzymes offer several key advantages: they function extracellularly without needing to cross cell membranes, exerting little selective pressure for traditional antibiotic resistance [66]. They are highly specific, effective at low concentrations, and can disrupt pre-existing biofilms rather than just preventing their formation [66] [67].
Q2: Why is Dispersin B considered a broad-spectrum antibiofilm agent? Dispersin B targets poly-β(1,6)-N-acetylglucosamine (PNAG), a biofilm matrix polysaccharide produced by a wide range of Gram-positive and Gram-negative pathogens, including Staphylococcus aureus, Escherichia coli, and Acinetobacter baumannii [68] [66] [67]. Its action against this common matrix component underpins its broad-spectrum activity.
Q3: Can I use these enzymes alone to completely eradicate a biofilm? While enzymes effectively disperse the biofilm matrix and detach cells, they often do not kill the bacteria. The dispersed planktonic cells become more susceptible to co-administered antimicrobials [68] [66]. Therefore, for complete eradication, enzyme therapy is most effective when combined with antibiotics or other antimicrobial agents [69].
Q4: How does extracellular DNA (eDNA) contribute to biofilm stability, and which enzyme targets it? eDNA is a key structural component in many biofilms, providing cell-to-cell adhesion and contributing to the matrix's physical stability [66]. Deoxyribonucleases (DNases), such as DNase I, degrade eDNA, leading to biofilm disruption and inhibition of formation [66] [70].
Troubleshooting Guide: Common Experimental Issues
Table 1: Common Issues and Solutions When Working with Matrix-Degrading Enzymes
| Problem | Potential Cause | Suggested Solution |
|---|---|---|
| Low enzyme efficacy in biofilm dispersal | Incorrect enzyme selection for the target biofilm's matrix composition. | Pre-characterize the major EPS components (e.g., PNAG, alginate, eDNA) of your target biofilm to select the appropriate enzyme (e.g., Dispersin B for PNAG, DNase for eDNA-rich biofilms) [66] [69]. |
| Enzyme instability or loss of activity | Degradation by host or bacterial proteases in the experimental system. | Consider using engineered enzyme variants with enhanced protease resistance [70]. Alternatively, use protease inhibitors or adjust the timing and delivery of the enzyme. |
| Inconsistent results between replicate assays | Use of static biofilm models (e.g., microtiter plates) that do not produce mature, robust biofilms [71]. | Transition to dynamic biofilm models such as flow cells or bioreactors that provide constant nutrient flow and shear stress, enabling the development of more physiologically relevant, mature biofilms [71] [72]. |
| Poor combination therapy outcome | Sub-optimal dosing or timing of enzyme and antibiotic. | Conduct checkerboard assays to determine the Fractional Inhibitory Concentration Index (FICI) and identify synergistic concentrations [69]. Apply the enzyme before or concurrently with the antibiotic to maximize penetration [67]. |
Standard Experimental Protocols
Protocol 1: Assessing Synergy Between Matrix-Degrading Enzymes and Antibiotics
This protocol is adapted from studies demonstrating the synergistic effect of α-amylase and ciprofloxacin against Burkholderia cepacia biofilms [69].
- Biofilm Formation: Grow biofilms in a suitable model system (e.g., 96-well polystyrene plates or on relevant surfaces like stainless-steel coupons) under conditions optimized for the target bacterium.
- Enzyme Preparation: Prepare serial dilutions of the matrix-degrading enzyme (e.g., α-amylase, Dispersin B, DNase) in an appropriate buffer.
- Antibiotic Preparation: Prepare serial dilutions of the antibiotic in growth medium.
- Combination Treatment: Treat pre-formed biofilms with combinations of the enzyme and antibiotic. A typical setup involves a matrix of enzyme concentrations against a matrix of antibiotic concentrations.
- Incubation and Viability Assessment: Incubate the plates for a specified period (e.g., 4-24 hours). Assess biofilm viability using a metabolic assay (e.g., resazurin) or by enumerating viable cells (CFU/coupon) after dislodging.
- Data Analysis: Calculate the Fractional Inhibitory Concentration (FIC) for each combination.
- FIC (Antibiotic) = MIC of antibiotic in combination / MIC of antibiotic alone
- FIC (Enzyme) = MIC of enzyme in combination / MIC of enzyme alone
- FICI = FIC (Antibiotic) + FIC (Enzyme)
- Interpret the FICI: ≤0.5 = synergy; >0.5 to ≤4 = additive/indifference; >4 = antagonism [69].
Protocol 2: Biofilm Dispersal Assay Using a Flow Cell System
This protocol leverages dynamic flow cells for growing mature biofilms that are more representative of in vivo conditions [71].
- Inoculation: Dilute an overnight culture of bacteria and inject it into the flow cell system. Stop the flow and allow cells to attach for 1-2 hours.
- Biofilm Growth: Restart the flow of fresh, sterile medium at a controlled rate (e.g., 0.2 mL/min) and incubate for 24-72 hours to allow mature biofilm development.
- Enzyme Treatment: Introduce the matrix-degrading enzyme, diluted in medium or buffer, into the flow system. A negative control should receive buffer only.
- Real-Time Imaging (Optional): If using a transparent flow cell and a microscope equipped with a stage incubator, monitor biofilm structure in real-time using techniques like Confocal Laser Scanning Microscopy (CLSM) before, during, and after enzyme treatment [71].
- Post-Treatment Analysis: After a set treatment period, the effluent can be collected and plated to quantify dispersed cells. Alternatively, the remaining biofilm on the surface can be stained for biomass quantification (e.g., with crystal violet) or imaged via scanning electron microscopy (SEM) to visualize structural changes [71] [69].
Workflow and Mechanism Diagrams
Enzyme Dispersal Mechanism
Experimental Workflow
Research Reagent Solutions
Table 2: Essential Reagents for Biofilm Matrix Degradation Research
| Reagent / Material | Function / Role in Experimentation | Example Use Case |
|---|---|---|
| Dispersin B | Glycoside hydrolase that degrades the PNAG exopolysaccharide [68] [67]. | Broad-spectrum dispersal of biofilms formed by S. aureus, E. coli, and other PNAG-producing pathogens [68]. |
| DNase I | Degrades extracellular DNA (eDNA) within the biofilm matrix [66] [70]. | Disrupts biofilms where eDNA is a primary structural component; prevents early-stage biofilm formation [66] [70]. |
| PslG | Glycoside hydrolase that specifically targets the Psl exopolysaccharide in Pseudomonas aeruginosa biofilms [70]. | Highly effective inhibition and dispersal of P. aeruginosa biofilms at nanomolar concentrations [70]. |
| Protease (e.g., Proteinase K) | Hydrolyzes protein components within the extracellular polymeric substance (EPS) [66] [69]. | Dispersal of protein-rich biofilms; often used in combination with other enzymes for broad-spectrum matrix degradation [69]. |
| α-Amylase | Targets α-glucan polymers (e.g., starch) within the biofilm matrix [69]. | Shown to synergize with antibiotics like ciprofloxacin to enhance destruction of Burkholderia cepacia biofilms [69]. |
| Standardized Biofilm Reactors | Reproducible growth of mature, relevant biofilms under controlled conditions (e.g., shear stress, nutrient availability) [71] [72]. | CDC Biofilm Reactor, Drip Flow Reactor, and Rotating Disk Reactor are ASTM-standardized methods for consistent testing [72]. |
Potentiating Conventional Antibiotics with Matrix-Targeting Adjuvants
Biofilms are structured communities of microorganisms encased in a self-produced extracellular polymeric substance (EPS) matrix. This matrix acts as a formidable diffusion barrier and protective shield, making biofilm-associated bacteria up to 1000 times more resistant to antibiotics than their free-floating (planktonic) counterparts [1]. This resilience is a primary contributor to persistent chronic infections and healthcare-associated infections, complicating treatment and leading to increased morbidity and healthcare costs [1] [73].
The EPS matrix is a complex mixture of polysaccharides, proteins, extracellular DNA (eDNA), and lipids [1]. Its protective function is multifaceted, involving:
- Restricted Antibiotic Penetration: The matrix physically hinders the diffusion of antimicrobial agents into the biofilm's deeper layers.
- Physico-chemical Interactions: Components of the matrix can bind to or neutralize antibiotic molecules.
- Altered Microbial Physiology: Bacteria within biofilms can exhibit reduced metabolic activity, leading to a higher proportion of "persister" cells that are tolerant to antibiotics [1].
Overcoming this barrier is critical for effective treatment. The strategy of potentiating conventional antibiotics with matrix-targeting adjuvants aims to disrupt the EPS structure, thereby breaking down this defensive wall and allowing antibiotics to reach their bacterial targets effectively [74]. This technical support guide provides detailed methodologies and troubleshooting advice for researchers developing and evaluating such adjuvant therapies.
Frequently Asked Questions (FAQs) on Matrix-Targeting Adjuvants
Q1: What exactly is an antibiotic adjuvant, and how does it differ from an antibiotic? An antibiotic adjuvant is a compound that, by itself, has little or no inherent antimicrobial activity. Instead, it enhances the efficacy of a co-administered antibiotic [74] [75]. Unlike antibiotics, which directly kill or inhibit bacteria, adjuvants work by targeting bacterial resistance mechanisms. In the context of biofilms, this means disrupting the EPS matrix, inhibiting efflux pumps, or blocking enzyme-based antibiotic inactivation [74] [76]. This approach can restore the activity of existing antibiotics against resistant strains.
Q2: What are the primary mechanisms by which matrix-targeting adjuvants work? Matrix-targeting adjuvants employ several strategies to disrupt the biofilm barrier, summarized in the table below.
Table 1: Mechanisms of Action for Matrix-Targeting Adjuvants
| Mechanism | Description | Example Adjuvants |
|---|---|---|
| Enzymatic Degradation | Uses specific enzymes to break down key structural components of the EPS matrix (e.g., polysaccharides, eDNA, proteins). | DNases (target eDNA), proteases, glycoside hydrolases [1]. |
| Matrix Dispersion | Disrupts the physical architecture and cohesion of the biofilm, leading to its breakdown and making embedded bacteria more vulnerable. | Quorum-sensing inhibitors, RNAIII-inhibiting peptides, DNABII proteins [1]. |
| Enhanced Penetration | Alters the physicochemical properties of the matrix to improve the diffusion and permeation of co-administered antibiotics. | Bioacoustic effects (e.g., Low-Frequency Ultrasound), chelating agents [24]. |
| Efflux Pump Inhibition | Blocks bacterial efflux pumps that actively expel antibiotics from cells, a common resistance mechanism in biofilms. | Phenylarginyl-β-naphthylamide (PaβN) and other synthetic or natural compounds [74] [76]. |
Q3: How do the physical characteristics of a biofilm (e.g., thickness, density) impact the efficacy of an adjuvant-antibiotic combination? Biofilm physical characteristics are critical determinants of treatment success. Key parameters include:
- Thickness and Density: Thicker, less dense biofilms can be more susceptible to disruption by certain physical agents (like ultrasound), while thinner, denser biofilms may be more resistant [24].
- Matrix Composition: The ratio of proteins to polysaccharides (PN/PS) in the EPS influences biofilm stiffness and cohesion. A higher PN/PS ratio is associated with a more compact, stable, and less porous biofilm [24].
- Mechanical Properties: Biofilms grown under high fluid shear stress are often stiffer and more robust. Research shows that low-shear biofilms can have a creep compliance (a measure of deformability) two orders of magnitude greater than high-shear biofilms, making them more susceptible to physical disruption [24]. Therefore, the adjuvant strategy may need to be tailored to the specific biofilm's physical properties.
Q4: What are the critical parameters to optimize in a microtiter plate biofilm assay for adjuvant screening? The microtiter plate assay is a high-throughput method for quantifying biofilm formation and evaluating anti-biofilm agents [77]. Key parameters to optimize and control are:
- Surface Treatment: Use microtiter plates that are not tissue-culture treated to facilitate bacterial adhesion.
- Inoculum Size and Growth Phase: Standardize the starting inoculum (often a 1:100 dilution of a stationary-phase culture) to ensure consistency.
- Incubation Time: The optimal time for biofilm formation is organism-dependent and must be determined empirically (often 24-48 hours).
- Washing Vigor: The method used to remove non-adherent (planktonic) cells must be consistent across all wells and experiments.
- Staining and Solubilization: The choice of stain (e.g., Crystal Violet for total biomass, fluorescent dyes for viability) and the solvent used to solubilize it (e.g., 30% acetic acid, ethanol) can significantly impact the results and must be appropriate for your bacterial strain [77] [78].
Troubleshooting Guides for Key Experiments
Guide: Microtiter Plate Biofilm Assay for Adjuvant Screening
This protocol is adapted from established methods for growing and analyzing static biofilms in a 96-well format [77].
Experimental Workflow: The following diagram outlines the key steps in the microtiter plate biofilm assay.
Diagram 1: Microtiter plate biofilm assay workflow
Detailed Protocol:
- Inoculation: Dilute an overnight bacterial culture 1:100 in fresh, appropriate medium. Pipet 100 µL of the diluted culture into the wells of a sterile, non-tissue-culture-treated 96-well plate. Include negative control wells (medium only) [77].
- Biofilm Formation: Cover the plate and incubate at the optimal growth temperature for the desired time (e.g., 24-48 h) without agitation.
- Adjuvant and Antibiotic Treatment:
- Carefully remove and discard the planktonic culture from the wells by briskly inverting the plate.
- Gently wash the adherent biofilms twice by submerging the plate in a tray of water or phosphate-buffered saline (PBS), shaking out the liquid each time.
- Add the matrix-targeting adjuvant diluted in medium to the test wells. Include control wells with medium only.
- Incubate for the desired treatment period (e.g., 2-4 h).
- Without washing, add the conventional antibiotic to the appropriate wells.
- Incubate for a further period (e.g., 2-24 h).
- Biofilm Quantification (Crystal Violet Staining):
- After treatment, invert the plate to remove the contents and wash the wells twice as before to remove non-adherent cells.
- Add 125 µL of a 0.1% (w/v) crystal violet solution to each well. Stain for 10-15 minutes at room temperature.
- Remove the stain and wash the wells thoroughly 2-3 times with water to remove unbound dye.
- Invert the plate and tap dry on paper towels. Allow the plate to air-dry completely.
- Add 200 µL of a solubilization solvent (e.g., 30% acetic acid, 95% ethanol) to each well to dissolve the crystal violet bound to the biofilm. Incubate for 10-15 minutes.
- Transfer 125 µL of the solubilized dye to a new, optically clear flat-bottom 96-well plate.
- Measure the optical density (OD) at a wavelength between 500-600 nm using a plate reader [77] [78].
Troubleshooting Table:
Table 2: Troubleshooting the Microtiter Plate Biofilm Assay
| Problem | Potential Cause | Solution |
|---|---|---|
| High variability between replicates | Inconsistent washing or inoculation. | Use a multichannel pipette for all liquid handling steps. Ensure washing is uniform across all wells. |
| Weak or no biofilm formation | Unsuitable surface or medium. Incorrect growth conditions. | Use non-tissue-culture-treated plates. Optimize medium (e.g., add glucose). Extend incubation time. |
| High background in negative controls | Incomplete washing after staining. | Increase the number of washes after the crystal violet staining step. Ensure water is changed between plates. |
| Adjuvant alone reduces biofilm | The adjuvant has inherent anti-biofilm or antibacterial activity. | Re-evaluate adjuvant concentration. Use a different, non-biocidal staining method (e.g., ATP bioluminescence) to assess viability separately from biomass [78]. |
Guide: Evaluating Biofilm Matrix Disruption
Objective: To visually and quantitatively assess the physical disruption of the biofilm matrix by an adjuvant.
Methodology:
- Microscopy: Use techniques like confocal laser scanning microscopy (CLSM) or optical coherence tomography (OCT) to visualize changes in biofilm architecture (thickness, roughness, porosity) in 3D after adjuvant treatment [24].
- EPS Component Quantification: Measure the release of specific EPS components (eDNA, proteins, polysaccharides) into the supernatant after adjuvant treatment using fluorescent dyes (e.g., PicoGreen for DNA) or colorimetric assays (e.g., Bradford for protein) [1] [24].
Troubleshooting:
- Problem: Microscopy shows no structural change.
- Solution: Verify the adjuvant is active in your assay conditions. Increase the adjuvant concentration or treatment duration. Confirm the adjuvant's mechanism targets a component present in your model biofilm (e.g., don't use a DNase on a biofilm that is not eDNA-dependent).
- Problem: High background in EPS quantification.
- Solution: Centrifuge the supernatant thoroughly to remove any bacterial cells before analysis. Run appropriate blanks and controls.
The Scientist's Toolkit: Essential Research Reagents
This table lists key materials and their functions for studying biofilm matrix disruption.
Table 3: Key Reagents for Biofilm Matrix Research
| Reagent / Material | Function / Application | Key Consideration |
|---|---|---|
| Crystal Violet | A basic dye that binds negatively charged molecules, staining total biofilm biomass (cells and matrix) [77] [78]. | Does not distinguish between live and dead cells; can overestimate biomass if cellular debris remains [78]. |
| DNase I | An enzyme that degrades extracellular DNA (eDNA), a key structural component in many biofilms. Used as a matrix-targeting adjuvant [1]. | Efficacy is highly biofilm-dependent. Requires optimized buffer conditions (Mg²⁺, Ca²⁺) for activity. |
| Proteases (e.g., Proteinase K) | Enzymes that degrade protein components within the EPS matrix. Used to disrupt protein-rich biofilms [1]. | Must be selected based on the specificity for the proteins in the target biofilm. Can be cytotoxic. |
| Fluorescein Diacetate (FDA) | A cell-permeant compound metabolized by live cells to fluorescent fluorescein. Used for viability staining within biofilms [78]. | Provides a measure of metabolic activity. Signal is lost rapidly upon cell death. |
| Non-Tissue-Culture-Treated Plates | 96-well plates with a surface that promotes bacterial attachment for static biofilm assays [77]. | Tissue-culture-treated plates are designed to inhibit cell attachment and will prevent robust biofilm formation. |
| Low-Frequency Ultrasound (LFU) Setup | A physical method to perturb the biofilm matrix and enhance antibiotic diffusion (bioacoustic effect) [24]. | Parameters (frequency, intensity, duration) must be carefully optimized for different biofilm types to avoid mere dispersal. |
Data Presentation: Quantitative Insights
To illustrate how experimental data can be synthesized, the table below summarizes hypothetical findings from a study investigating how biofilm growth conditions influence adjuvant efficacy, inspired by research on the topic [24].
Table 4: Impact of Biofilm Growth Conditions on Physical Properties and Susceptibility
| Biofilm Growth Condition | Average Thickness (µm) | Relative Roughness | PN/PS Ratio | Creep Compliance (Pa⁻¹) | % Inactivation (Antibiotic Only) | % Inactivation (Antibiotic + LFU Adjuvant) |
|---|---|---|---|---|---|---|
| Low Fluid Shear | 52 ± 20 | 0.31 ± 0.09 | 0.39 ± 0.20 | 5570 ± 101 (Inner) | ~20% | ~80% |
| High Fluid Shear | 29 ± 8 | 0.18 ± 0.06 | 1.15 ± 0.55 | 31 ± 1 (Inner) | ~15% | ~40% (Requires higher LFU intensity) |
Data is representative of findings from [24]. PN/PS: Protein-to-Polysaccharide ratio; LFU: Low-Frequency Ultrasound.
Interpretation: This data demonstrates that biofilms grown under different conditions develop distinct physical characteristics. Low-shear biofilms are thicker, rougher, and more compliant (less stiff), making them more susceptible to disruption by physical adjuvants like LFU. In contrast, high-shear biofilms are denser, stiffer, and more resistant, requiring more aggressive treatment parameters. This underscores the necessity of characterizing biofilm models when screening for adjuvant activity.
Nanotechnology-Based Drug Delivery Systems for Enhanced Penetration
Biofilm formation constitutes a significant challenge in antimicrobial therapy, primarily due to the dense extracellular polymeric substance (EPS) that limits antibiotic diffusion and promotes resistance. Nanotechnology-based Drug Delivery Systems (NDDS) offer a promising strategy to overcome these penetration barriers. By engineering nanoparticles with specific physicochemical properties, researchers can improve drug bioavailability, enable targeted delivery to biofilm microenvironments, and enhance therapeutic efficacy against resistant infections. This technical resource provides practical guidance for developing and characterizing nano-formulations specifically designed to combat biofilm-associated antibiotic resistance.
Nanoparticle Optimization for Biofilm Penetration
Critical Physicochemical Parameters
The ability of nanoparticles to penetrate biofilm matrices depends on several key properties, which must be carefully optimized during formulation design.
Table 1: Optimal Nanoparticle Properties for Enhanced Biofilm Penetration
| Parameter | Optimal Range | Impact on Biofilm Penetration | Characterization Methods |
|---|---|---|---|
| Size | 20-100 nm | Enables diffusion through EPS matrix; avoids rapid clearance | Dynamic Light Scattering (DLS), TEM |
| Surface Charge | Slightly positive or neutral | Reduces electrostatic repulsion with negatively charged EPS | Zeta potential measurement |
| Hydrophobicity | Moderate balance | Facilitates interaction with lipid components of biofilm | Contact angle measurement |
| Stimuli-Responsiveness | pH, enzyme, or redox-sensitive | Enables triggered drug release in biofilm microenvironment | Drug release studies under different conditions |
Quantitative Performance of Representative Nano-Formulations
Recent studies have demonstrated the efficacy of various nanoparticle systems against biofilm-related challenges.
Table 2: Experimentally Demonstrated Nano-Formulations for Enhanced Drug Delivery
| Nanocarrier System | Loaded Drug | Size (nm) | Encapsulation Efficiency | Key Findings | Reference |
|---|---|---|---|---|---|
| Silk Fibroin Particles (SFPs) | Curcumin & 5-FU | <200 nm | CUR: 37%, 5-FU: 82% | Sustained release over 72h; enhanced tumor necrosis | [79] |
| CLA-BSA Nanoparticles | Clarithromycin | Not specified | Not specified | Strong antibacterial effects against Bacillus cereus | [79] |
| Chitosan-coated lipid microvesicles | Diclofenac | Not specified | Not specified | Superior anti-inflammatory effects vs. free drug | [79] |
| Rutin-loaded HA Nanoparticles | Rutin | 179-209 nm | Not specified | Significant protection against endothelial damage | [79] |
Experimental Protocols: Development and Characterization
Protocol: Formulation of pH-Responsive Polymeric Nanoparticles
Objective: Synthesize nanoparticles that release antimicrobial payloads in response to acidic biofilm microenvironment.
Materials:
- Biodegradable polymer (PLGA, PLA, or chitosan)
- Antimicrobial drug (e.g., vancomycin, ciprofloxacin)
- Organic solvent (acetone or DCM)
- Surfactant (Poloxamer 407 or PVA)
- pH-sensitive polymer (Eudragit or poly(β-amino ester))
Methodology:
- Nanoprecipitation Technique:
- Dissolve 100 mg polymer and 10 mg drug in 10 mL organic solvent
- Inject rapidly into 20 mL aqueous phase containing 0.5% surfactant under magnetic stirring (500 rpm)
- Stir for 3 hours to evaporate organic solvent
- Centrifuge at 15,000 rpm for 30 minutes and collect nanoparticle pellet
- Resuspend in phosphate buffer (pH 7.4) and lyophilize for storage
Surface Functionalization (for active targeting):
- Incubate nanoparticles with 1 mg/mL targeting ligand (peptides, antibodies) in carbonate buffer (pH 9.0) for 2 hours
- Purify by centrifugation and resuspend in appropriate buffer
Quality Control:
- Determine particle size and PDI by DLS
- Measure zeta potential in 1 mM KCl solution
- Assess encapsulation efficiency using HPLC after drug extraction
Protocol: Biofilm Penetration and Efficacy Assessment
Objective: Evaluate nanoparticle penetration and antimicrobial efficacy against established biofilms.
Materials:
- Microbial culture (e.g., Pseudomonas aeruginosa, Staphylococcus aureus)
- Confocal laser scanning microscope (CLSM)
- Fluorescent dye (e.g., Coumarin-6, FITC)
- 96-well microtiter plates
- Crystal violet or resazurin for viability assessment
Methodology:
- Biofilm Formation:
- Grow biofilms in flow cells or 96-well plates for 48-72 hours
- Confirm biofilm formation by crystal violet staining
Penetration Studies:
- Incubate fluorescently-labeled nanoparticles with pre-formed biofilms
- Allow penetration for predetermined timepoints (1-24 hours)
- Wash gently to remove non-penetrated nanoparticles
- Analyze penetration depth using z-stack CLSM imaging
- Quantify fluorescence intensity at different biofilm depths
Anti-biofilm Efficacy:
- Treat biofilms with nano-formulations at sub-MIC concentrations
- Incubate for 24 hours at 37°C
- Assess viability using resazurin assay or colony counting
- Compare with free drug treatment at equivalent concentrations
- Perform statistical analysis (ANOVA with post-hoc tests)
Troubleshooting Guides and FAQs
Frequently Encountered Experimental Challenges
Q: My nanoparticles are aggregating during formulation. How can I improve stability? A: Aggregation commonly results from insufficient surfactant stabilization or rapid solvent evaporation.
- Solutions:
- Optimize surfactant concentration (typically 0.5-2% w/v)
- Implement slower solvent evaporation using rotary evaporation
- Include cryoprotectants (trehalose, sucrose) before lyophilization
- Consider surface PEGylation to enhance steric stabilization [80]
Q: Nanoparticles show poor encapsulation efficiency for hydrophilic antibiotics. How to improve? A: Hydrophilic drugs readily leak into aqueous phase during nanoprecipitation.
- Solutions:
- Utilize double emulsion (w/o/w) methods for hydrophilic compounds
- Implement ion pairing with counter-ions to increase drug hydrophobicity
- Consider alternative nanocarriers: liposomes or solid lipid nanoparticles
- Adjust organic:aqueous phase ratio to minimize drug partitioning
Q: How can I demonstrate specific nanoparticle targeting to biofilms? A: Confirmation requires multiple complementary approaches.
- Solutions:
- Incorporate biofilm-specific targeting ligands (antibodies, peptides)
- Perform competitive inhibition assays with free targeting ligands
- Use isogenic mutant strains lacking target receptors as negative controls
- Conduct comparative binding studies against planktonic cells
Q: My formulation shows good in vitro efficacy but poor in vivo performance. What could be wrong? A: This disconnect often reflects biological barriers not modeled in vitro.
- Solutions:
- Assess protein corona formation and its impact on targeting
- Evaluate nanoparticle stability in biological fluids
- Consider physiological clearance mechanisms (RES, renal)
- Implement surface coating strategies to improve circulation half-life [81]
Advanced Technical Challenges
Q: How can I achieve triggered drug release specifically in biofilm microenvironments? A: Design stimuli-responsive systems leveraging unique biofilm characteristics.
- Solutions:
- Incorporate pH-sensitive linkers (hydrazone, acetal) for acidic biofilm regions
- Use enzyme-cleavable substrates (matrix metalloproteinase, glycosidases)
- Develop redox-responsive systems (enhanced glutathione in biofilms)
- Design quorum sensing-responsive release mechanisms [82]
Q: What strategies can enhance nanoparticle diffusion through dense EPS matrices? A: EPS penetration requires addressing multiple barrier properties.
- Solutions:
- Optimize size (<100 nm) and surface charge (slightly cationic)
- Incorporate EPS-degrading enzymes (DNase, dispersin B) in formulations
- Use zwitterionic surface coatings to reduce non-specific interactions
- Apply external energy (ultrasound) to temporarily disrupt EPS structure
Research Reagent Solutions
Essential Materials for Nano-Formulation Development
Table 3: Key Research Reagents for Nanotechnology-Based Drug Delivery
| Reagent/Category | Specific Examples | Function/Application | Technical Notes |
|---|---|---|---|
| Biodegradable Polymers | PLGA, PLA, Chitosan, Gelatin | Nanoparticle matrix material | MW and copolymer ratio affect degradation rate and drug release |
| Lipid Components | Phosphatidylcholine, Cholesterol, DSPC | Liposome and lipid nanoparticle formation | Phase transition temperature determines stability and release |
| Surface Modifiers | PEG, Poloxamers, Polysorbates | Enhance stability and circulation time | PEG molecular weight and density affect stealth properties |
| Targeting Ligands | Peptides, Antibodies, Aptamers, Folate | Enable active targeting to biofilms | Consider conjugation chemistry and orientation |
| Stimuli-Responsive Materials | pH-sensitive polymers, Redox-sensitive linkers | Triggered drug release in biofilm microenvironment | Response kinetics should match application requirements |
| Characterization Standards | Latex beads, Fluorescent dyes | Instrument calibration and method validation | Use size standards close to expected nanoparticle size |
Visualization: Experimental Workflows and Mechanisms
Nanoparticle Development and Evaluation Workflow
Diagram Title: Nanoparticle Development Workflow
Biofilm Targeting and Penetration Mechanisms
Diagram Title: Biofilm Targeting Mechanisms
Frequently Asked Questions (FAQs)
Q1: Why do traditional antibiotics often fail against biofilm-associated infections? Biofilms possess multiple mechanisms that confer tolerance and resistance to antimicrobial agents. The extracellular polymeric substance (EPS) matrix acts as a physical diffusion barrier, trapping and slowing the penetration of many antibiotics, particularly cationic ones like tobramycin, which bind to negatively charged components like extracellular DNA (eDNA) [83] [84]. Furthermore, biofilms harbor metabolically heterogeneous populations, including dormant persister cells, which are largely insensitive to antibiotics that target active cellular processes [85]. This combination of physical protection and physiological dormancy makes biofilm infections notoriously difficult to eradicate with conventional antibiotics alone.
Q2: In an ultrasonic disruption experiment, my treatment fails to improve antibiotic efficacy. What could be going wrong? This is a common issue often traced to suboptimal ultrasound parameters or microbubble formulation. Key factors to check include:
- Microbubble Cavitation: Ensure the ultrasound pressure is sufficient to activate your phase-shift microbubbles. Inadequate pressure will not induce the stable cavitation needed to mechanically perturb the biofilm matrix [85].
- Antibiotic Selection: Verify that the antibiotic you are using is effective against the pathogen once it penetrates the biofilm. Ultrasonic disruption merely enhances delivery; it does not change the antibiotic's mechanism of action. Consider combining it with an adjuvant that targets persister cells [85].
- Biofilm Maturity: The efficacy of ultrasound can be influenced by the biofilm's developmental stage. Mature biofilms with dense, complex architectures are more challenging to disrupt than early-stage ones [86].
Q3: When applying a potential for electrochemical control, I observe no biofilm detachment. What should I investigate? First, confirm the fundamental setup of your electrochemical system:
- Current Density/Potential: The applied current or potential must be within an effective range. For instance, some studies report prevention of bacterial adhesion at -500 mV vs. Ag/AgCl, while others use current densities around ±0.015 mA cm⁻² for detachment [87]. Ineffective results may stem from using a current/potential that is too low.
- Electrode Configuration and Material: Ensure you are using a well-defined three-electrode system (Working, Counter, and Reference electrodes) for potential control. The material of the working electrode (e.g., gold, stainless steel, ITO) can significantly influence the electrochemical reactions and outcomes [87].
- Solution Conductivity: The ionic strength and composition of your electrolyte solution are critical, as they determine the system's conductivity and the types of electrochemical reactions (e.g., oxygen reduction) that can occur at the electrode surface [87].
Q4: My therapeutic phages rapidly select for bacterial resistance in vitro. How can I overcome this? The evolution of phage resistance is a major challenge. Several strategies can mitigate this:
- Use Phage Cocktails: Employ a mixture of phages that target different bacterial receptors. This approach broadens the host range and makes it more difficult for bacteria to develop simultaneous resistance to all phages in the cocktail [88].
- Phage-Antibiotic Synergy (PAS): Combine phages with antibiotics. Some phages can exploit bacterial efflux pumps as entry receptors. Mutations that confer phage resistance by altering these pumps can simultaneously resensitize the bacteria to conventional antibiotics [88] [89].
- Phage "Training": Use experimental evolution to pre-adapt phages against your target bacterial strain. A recent study demonstrated that evolving phages with Klebsiella pneumoniae for 30 days resulted in mutants with an expanded host range and enhanced ability to suppress bacterial growth [90].
Troubleshooting Guides
Guide 1: Ultrasonic Microbubble Therapy
Problem: Inconsistent biofilm disruption across experimental replicates.
- Step 1: Characterize Microbubble Uniformity. Use microscopy or a particle analyzer to confirm the size distribution and concentration of your microbubble preparation. High polydispersity can lead to variable cavitation effects.
- Step 2: Calibrate Ultrasound Transducer. Use a hydrophone to map the acoustic field and ensure consistent energy delivery across the entire sample, especially in multi-well setups. Confirm the fundamental parameters: Frequency (often in the kHz to low MHz range), Pressure (must be sufficient for stable cavitation), and Duration of exposure [91] [86] [85].
- Step 3: Standardize Biofilm Growth. Grow biofilms under tightly controlled conditions (media, temperature, gas exchange, time) to ensure consistent maturity, thickness, and matrix composition before treatment [86].
Guide 2: Electrochemical Biofilm Control
Problem: Uncontrolled pH shifts or gas bubble formation damaging the biofilm electrode.
- Step 1: Optimize Electrolyte Composition. Use a buffered electrochemical solution (e.g., phosphate buffer) to mitigate large pH swings at the electrode surface that result from water electrolysis.
- Step 2: Adjust Applied Potential/Current. Operate within a potential window that minimizes water splitting. If using current control, consider applying a lower current density for a longer duration to reduce the rate of gas evolution [87].
- Step 3: Implement Alternating Polarity. Some studies have successfully used alternating current (AC) or periodically reversed polarity to prevent the buildup of corrosive products and gas bubbles on the electrode surface [87].
Guide 3: Phage Therapy Experiments
Problem: Phage cocktail shows excellent in vitro lysis but fails in an in vivo animal model.
- Step 1: Determine Phage Pharmacokinetics. The phage may be being cleared by the host immune system too quickly. Consider the administration route and dose frequency. Literature reports that billions to trillions of plaque-forming units (PFU) are often required for in vivo efficacy [88] [89].
- Step 2: Check for Biofilm Penetration. The in vivo environment may promote biofilm formation that is more resistant to phage penetration. Consider combining phages with biofilm-disrupting agents like DNase to degrade eDNA in the matrix, or use phages that express depolymerases [88] [84].
- Step 3: Re-isolate and Identify Bacteria. After treatment, isolate bacteria from the infection site and re-test their susceptibility to your phage cocktail. The in vivo environment may select for bacterial subpopulations with reduced phage receptivity [92] [89].
The following tables summarize key experimental parameters and outcomes from the literature for the three non-chemical disruption methods.
Table 1: Quantitative Parameters for Ultrasonic Disruption Strategies
| Pathogen | Ultrasound Frequency | Microbubble Type | Key Outcome | Source Model |
|---|---|---|---|---|
| P. aeruginosa | Multiple kHz-MHz | Acoustic cavitation | Disruption of early/intermediate stage biofilms | In vitro [86] |
| S. aureus (MRSA) | Not Specified | Phase-shift emulsion | 99% reduction in bacterial load with antibiotic | Diabetic mouse wound [85] |
| P. aeruginosa | Not Specified | Not Specified | Improved antibiotic penetration (16-fold) | Bladder organoid [85] |
Table 2: Reported Efficacy of Electrochemical Biofilm Control
| Pathogen | Control Method | Parameters | Reported Efficacy | Electrode Material |
|---|---|---|---|---|
| P. fluorescens | Potential | -500 mV vs. Ag/AgCl | ~90% prevention of adhesion | Gold [87] |
| P. aeruginosa | Current | ±0.015 mA cm⁻² | ~80% detachment | ITO [87] |
| S. epidermidis | Current (DC) | 0.00476 mA cm⁻² | 78% detachment | Stainless Steel [87] |
Table 3: Phage Therapy Efficacy in Clinical Cases and Engineered Approaches
| Application Context | Causative Pathogen | Phage Type / Strategy | Reported Outcome | Source |
|---|---|---|---|---|
| Cystic Fibrosis Infection | M. abscessus | Cocktail (wild-type & engineered) | Significant clinical improvement | Clinical Case [88] |
| Multi-center Study | Various MDR pathogens | Phage-Antibiotic Combination | 70% superior eradication vs. monotherapy | Clinical Cohort [88] |
| Targeting K. pneumoniae | MDR/XDR K. pneumoniae | Experimentally evolved phages | Expanded host range & enhanced bacterial suppression | In vitro [90] |
Detailed Experimental Protocols
Protocol 1: Ultrasonic Disruption with Phase-Shift Microbubbles for Biofilm Eradication This protocol is adapted from methods used in diabetic wound models [85].
- Biofilm Cultivation: Grow a 48-hour mature biofilm of your target pathogen (e.g., S. aureus) in a suitable flow cell or on a membrane in a static culture. Confirm maturity via microscopy or staining.
- Microbubble-Antibiotic Preparation: Formulate a phase-shift emulsion. This is a liquid suspension of micro-droplets containing a perfluorocarbon gas precursor. Mix this emulsion with a selected antibiotic (e.g., gentamicin) and optionally, a membrane-permeabilizing adjuvant.
- Application and Sonication: Apply the mixture directly onto the biofilm. Use a therapeutic ultrasound transducer with a frequency between 1-3 MHz. Set the pressure amplitude to a level confirmed to induce the phase-shift transition and stable cavitation of the microbubbles (e.g., ~500 kPa). Treat the biofilm for a duration of 5-10 minutes.
- Viability Assessment: Following treatment, disaggregate the biofilm via vortexing with glass beads or sonication in a water bath. Serially dilute the suspension and plate on agar to quantify the remaining viable bacteria (CFUs). Compare to untreated and antibiotic-only controls.
Protocol 2: Electrochemical Prevention of Bacterial Adhesion using Potentiostatic Control This protocol is based on studies using a three-electrode system to prevent biofilm formation [87].
- Electrochemical Cell Setup: Set up a flow cell or a beaker with a conductive working electrode (e.g., gold-coated glass, stainless steel coupon), a platinum wire counter electrode, and a Ag/AgCl reference electrode. Use a potentiostat to control the potential of the working electrode.
- Polarization and Inoculation: Fill the cell with a suitable electrolyte (e.g., dilute nutrient broth or buffer). Apply a constant negative potential of -500 mV (vs. Ag/AgCl) to the working electrode. Introduce the bacterial inoculum (e.g., P. fluorescens) while the potential is maintained.
- Incubation and Monitoring: Allow the system to run for a set period (e.g., 3-8 hours) under flow or mild agitation. Continuously monitor the current if possible.
- Analysis of Adhesion: After the incubation, turn off the potential and flow. Gently rinse the electrode to remove non-adhered cells. Stain the adherent cells with a fluorescent dye (e.g., SYTO 9) and image using fluorescence or phase-contrast microscopy. Quantify the surface coverage and compare it to a non-polarized control electrode.
Protocol 3: Experimental Evolution of Phages for Host Range Expansion This protocol outlines the "training" of phages to overcome bacterial resistance, as recently demonstrated [90].
- Initial Co-culture: In a liquid growth medium, co-culture a naive phage stock with a high-titer culture (e.g., ~10⁸ CFU/mL) of the target antibiotic-resistant bacterial strain (e.g., K. pneumoniae).
- Serial Passaging: Monitor the culture until lysis is observed. Centrifuge the lysate, filter it through a 0.22 µm filter to remove remaining bacteria, and use the filtrate to infect a fresh, log-phase culture of the same bacterial strain. Repeat this serial passage for multiple cycles (e.g., 20-30 days).
- Plaque Isolation and Screening: After the final passage, plate the evolved phage population to obtain isolated plaques. Pick several distinct plaques and amplify them individually.
- Host Range Assessment: Test the host range of the evolved phage isolates against a panel of diverse strains of the target pathogen, including the original strain and other multidrug-resistant clinical isolates. Compare the lytic efficiency and plaque-forming ability to the original, non-evolved phage.
Mechanism and Workflow Diagrams
Diagram 1: Core mechanisms of non-chemical biofilm disruption strategies. The diagram illustrates how ultrasonic, electrochemical, and phage-based therapies target biofilms through distinct pathways that converge on eradication.
Diagram 2: Phage therapy development and troubleshooting workflow. This chart outlines a key experimental pathway for developing phage therapies, integrating critical troubleshooting feedback loops to address common failures related to bacterial resistance and in vivo efficacy.
The Scientist's Toolkit: Essential Research Reagents & Materials
Table 4: Key Reagents and Materials for Non-Chemical Biofilm Disruption Research
| Item | Function / Application | Specific Examples / Notes |
|---|---|---|
| Phase-Shift Microbubbles | Ultrasound contrast agent that transitions from liquid to gas upon insonation, creating mechanical forces to disrupt biofilm. | Perfluorocarbon-containing emulsions; size ~1-10 µm [85]. |
| Therapeutic Ultrasound Transducer | Generates high-frequency sound waves at controlled pressures and frequencies to activate microbubbles and induce cavitation. | Frequencies range from kHz for deep penetration to MHz for surface/sharper focus [91] [86]. |
| Potentiostat/Galvanostat | Instrument for applying precise electrical potentials or currents to electrodes in an electrochemical cell. | Essential for controlled electrochemical biofilm prevention/removal studies [87]. |
| Ag/AgCl Reference Electrode | Provides a stable, known reference potential in a three-electrode electrochemical cell setup. | Critical for accurate potentiostatic control [87]. |
| Lytic Bacteriophages | Viruses that specifically infect and lyse bacterial hosts; the active therapeutic agent in phage therapy. | Must be thoroughly characterized (host range, genome) to exclude toxin genes and lysogeny potential [88] [89]. |
| Depolymerase-Encoding Phages | Specialized phages that produce enzymes to degrade specific polysaccharides in the biofilm EPS matrix. | Enhances phage penetration and diffusion through the biofilm [88]. |
| Fluorescent Viability Stains (e.g., LIVE/DEAD) | Allows for simultaneous visualization of live and dead cells within a biofilm after treatment via fluorescence microscopy. | e.g., SYTO 9 (green, live) and propidium iodide (red, dead) [87]. |
Combination Therapies and the Challenge of Preventing Resistance Evolution
Frequently Asked Questions (FAQs)
FAQ 1: What is the primary rationale for using combination therapies against biofilms? The primary rationale is to combat antimicrobial resistance through multiple, simultaneous mechanisms. Using drugs with independent mechanisms of action can minimize the evolution of resistance and enhance treatment efficacy. This approach is crucial because biofilms can exhibit up to a 1000-fold increase in antimicrobial tolerance compared to planktonic cells [7]. Combinations can broaden the spectrum of activity, increase killing efficacy, and prevent or delay the emergence of resistant subpopulations [93].
FAQ 2: What is "collateral sensitivity" and how can it be exploited therapeutically? Collateral sensitivity is an evolutionary phenomenon where a bacterial population developing resistance to one antibiotic simultaneously becomes more susceptible to a second, unrelated antibiotic [93]. This creates a network of evolutionary trade-offs that can be therapeutically exploited. For instance, cycling or combining robust bidirectional collateral sensitive antibiotic partners can constrain the set of available evolutionary paths for bacteria, effectively delaying the emergence of full resistance [93].
FAQ 3: Why are standard antibiotic susceptibility tests (like MIC) often inadequate for biofilm-related infections? Conventional tests like minimum inhibitory concentration (MIC) measurements, based on broth microdilution or disk diffusion, primarily measure growth inhibition but often fail to provide information on bactericidal efficacy, particularly against biofilms [93]. They may overlook dormant persister cells and do not capture the tolerance conferred by the biofilm's unique physiological state, such as energy depletion or activation of stress responses [93] [65]. For biofilms, metrics like Minimum Biofilm Inhibitory Concentration (MBIC) and viability assays after prolonged drug exposure are more informative.
FAQ 4: What are the key functional categories of anti-biofilm molecules? Anti-biofilm strategies target specific stages and components of the biofilm lifecycle. The table below summarizes the main categories and their functions [7].
Table 1: Key Functional Categories of Anti-biofilm Molecules
| Category | Primary Function | Example Targets |
|---|---|---|
| Quorum Sensing Inhibitors | Disrupt cell-to-cell communication, preventing coordinated biofilm development [7]. | Quorum sensing signaling molecules (e.g., AHLs, AIPs) |
| Matrix-Disrupting Agents | Degrade or destabilize the extracellular polymeric matrix, weakening the biofilm structure [7]. | Exopolysaccharides (e.g., Pel, Psl), extracellular DNA (eDNA), proteins |
| Anti-adhesion Agents | Prevent the initial attachment of bacterial cells to surfaces [7]. | Surface-associated adhesins (e.g., OmpA, BAP) |
| Second Messenger Interference | Modulate intracellular signaling pathways that control the biofilm lifestyle [7]. | c-di-GMP levels |
Troubleshooting Guide: Common Experimental Challenges
Problem 1: Inconsistent Results with Combination Therapy in a Static Biofilm Model
- Potential Cause: The static model (e.g., 96-well plate) may not support the development of mature, structured biofilms with relevant physiological heterogeneity. Nutrient depletion and waste product accumulation can vary significantly between wells, leading to high variability [5].
- Solution: Transition to a dynamic biofilm model to ensure consistent nutrient supply and waste removal.
- Protocol: Setting Up a Flow Cell System [5]
- Assemble the system: Connect a media reservoir to a flow cell chamber via a peristaltic pump. Include a syringe bubble trap to prevent air bubbles from entering the chamber. Connect the chamber outlet to a waste bottle.
- Sterilize: Autoclave the entire assembly (excluding the pump) to prevent contamination.
- Inoculate: Introduce a standardized bacterial suspension into the flow cell chamber and allow cells to attach without flow for 1-2 hours.
- Initiate flow: Start the peristaltic pump to deliver fresh, sterile growth medium at a constant, controlled rate (e.g., 0.2 mL/min) for 24-72 hours to allow for mature biofilm development.
- Treat and Analyze: Replace the medium with one containing your drug combination for the desired exposure time. The biofilm can be imaged directly in the chamber using microscopy or harvested for viability counts.
- Protocol: Setting Up a Flow Cell System [5]
Problem 2: Failure to Eradicate Biofilms Despite Using High Antibiotic Concentrations
- Potential Cause: The presence of metabolically dormant persister cells and slow-growing cells in the biofilm's interior, which are highly tolerant to conventional bactericidal antibiotics [65] [7]. The biofilm matrix may also be limiting drug diffusion or inactivating the agents [65].
- Solution: Incorporate agents that target the underlying causes of tolerance.
- Protocol: Evaluating and Targeting Biofilm Persisters [65]
- Treat Mature Biofilms: Expose pre-formed biofilms to a high concentration of your combination therapy for a prolonged period (e.g., 24 hours).
- Quantify Survival: Do not rely on optical density alone. Use viable plate counts to quantify the number of surviving bacteria. Resuspend the biofilm via vigorous vortexing or sonication and plate serial dilutions.
- Target Dormancy: Re-treat the biofilm with a combination that includes an antibiotic effective against persisters. This could involve compounds that disrupt membrane potential or proton motive force, or non-antibiotic adjuvants that sensitize persister cells.
- Consider Metabolism: Ensure your treatment includes conditions that penetrate nutrient-depleted zones. Using a bioreactor like a Constant Depth Film Fermentor (CDFF) can help create a more uniform and representative biofilm for these studies [5].
- Protocol: Evaluating and Targeting Biofilm Persisters [65]
Problem 3: Difficulty in Distinguishing Between Biofilm Inhibition and Bactericidal Activity
- Potential Cause: Relying solely on single-endpoint assays like crystal violet (CV) staining, which measures total biofilm biomass (cells + matrix) but does not indicate whether the cells are dead or alive [5].
- Solution: Implement a tiered analytical approach that differentiates between biomass reduction and cell killing.
- Protocol: Multi-Parameter Biofilm Analysis [5]
- Crystal Violet (CV) Staining: Quantifies total attached biomass. This is a good first pass for anti-adhesion or matrix-disruption effects.
- Metabolic Assays (e.g., XTT, resazurin): Measures the metabolic activity of the biofilm cells. A reduction indicates loss of viability, but can be confounded by metabolic dormancy.
- Viable Plate Counts: The gold standard for determining the number of live, cultivable cells. This is essential for confirming bactericidal activity of your combination therapy.
- Live/Dead Staining with Confocal Microscopy: Provides a visual and quantitative measure of cell viability within the 3D biofilm structure, allowing you to see where in the biofilm killing is most effective.
- Protocol: Multi-Parameter Biofilm Analysis [5]
Research Reagent Solutions
The table below lists essential materials and their functions for advanced biofilm research on combination therapies.
Table 2: Key Research Reagent Solutions for Biofilm and Combination Therapy Studies
| Reagent / Material | Function in Experimentation |
|---|---|
| Hydroxyapatite Discs | Provides a standardized, biologically relevant surface (mimicking tooth enamel or bone) for growing biofilms in static or dynamic models [5]. |
| Microtiter Plates (96-well) | The workhorse for high-throughput static biofilm assays, such as CV staining and metabolic activity screens [5]. |
| Flow Cell Chambers | Enables the growth of biofilms under hydrodynamic conditions, which promotes the development of mature, complex structures that more closely mimic in vivo biofilms [5]. |
| Constant Depth Film Fermenter (CDFF) | An advanced bioreactor that maintains biofilms at a constant depth, ideal for studying biofilm development over time and under controlled nutrient conditions [5]. |
| Crystal Violet | A simple dye used to stain and quantify total biofilm biomass attached to a surface [5]. |
| Live/Dead BacLight Stains (e.g., SYTO9/PI) | A two-color fluorescence stain that distinguishes between live (green) and dead (red) cells within a biofilm, typically visualized via confocal laser scanning microscopy (CLSM) [5]. |
| Quorum Sensing Inhibitors (QSIs) | A class of molecules (e.g., natural compounds, synthetic analogues) used to investigate the role of cell-cell communication in biofilm formation and to potentiate antibiotic activity [7]. |
| c-di-GMP Modulators | Small molecule inhibitors or activators of the enzymes that synthesize or degrade the secondary messenger c-di-GMP, used to study its critical role in the switch between planktonic and biofilm lifestyles [7]. |
Essential Experimental Workflows and Pathway Diagrams
Diagram 1: Collateral Sensitivity Combination Therapy Strategy
This diagram visualizes the therapeutic strategy of exploiting collateral sensitivity, where resistance to Drug A sensitizes the bacterium to Drug B, creating a evolutionary trap.
Diagram 2: Multi-Parameter Biofilm Analysis Workflow
This flowchart outlines a comprehensive experimental protocol for evaluating the efficacy of combination therapies against biofilms, moving from simple to complex analyses.
Diagram 3: Key Biofilm Resistance Mechanisms as Therapeutic Targets
This diagram maps the primary mechanisms of biofilm-mediated resistance and aligns them with corresponding therapeutic intervention strategies.
From Bench to Bedside: Validating Efficacy and Comparing Anti-Biofilm Strategies
Standardizing Methods for Evaluating Anti-Biofilm Agent Efficacy
Why is standardizing anti-biofilm testing so crucial for research and development? Biofilms are complex, three-dimensional microbial communities responsible for approximately 65-80% of all microbial infections and 80-90% of all chronic infections [94] [95]. The biofilm phenotype is fundamentally different from its planktonic counterpart, exhibiting up to 1,500-fold greater resistance to antimicrobial agents [96]. This high tolerance, combined with the inherent variability of research methods, creates a critical reproducibility crisis in anti-biofilm research. A statistical meta-analysis of published data confirmed that the specific experimental method used is the single most important factor determining the outcome of an anti-biofilm efficacy test [97]. Without standardized methods, results cannot be reliably compared across laboratories, hindering the development and regulatory approval of effective anti-biofilm agents. Standardization ensures that efficacy data is repeatable, reproducible, rugged, and responsive—the essential "statistical R's" required for product registration and scientific advancement [98].
Core Concepts in Biofilm Biology and Resistance
Mechanisms of Biofilm Antibiotic Tolerance
Biofilm antibiotic tolerance is a multi-faceted phenomenon, distinct from simple genetic resistance. The table below summarizes the primary mechanisms that standardized tests must overcome to demonstrate efficacy.
Table 1: Key Mechanisms of Biofilm Antibiotic Tolerance
| Mechanism Category | Specific Process | Impact on Antimicrobial Efficacy |
|---|---|---|
| Physical Tolerance | Extracellular Polymeric Substance (EPS) barrier | Restricts penetration and diffusion of antimicrobial agents [99] [100] |
| Enzymatic Tolerance | Accumulation of antibiotic-degrading enzymes (e.g., β-lactamases) in the EPS | Inactivates antimicrobial molecules before they reach their cellular targets [100] [7] |
| Physiological Tolerance | Heterogeneous microenvironments; presence of dormant "persister" cells | Altered metabolic states and stress responses reduce susceptibility to many antibiotics [99] [95] |
| Genetic Adaptation | Enhanced horizontal gene transfer and mutation rates within the biofilm community | Accelerates the acquisition and dissemination of stable resistance genes [99] [95] |
Key Signaling Pathways in Biofilm Development
Biofilm formation is a highly regulated process. Effective anti-biofilm strategies often target these central regulatory systems, which should be considered when designing and interpreting efficacy tests.
Diagram 1: Core Biofilm Regulatory Pathways. Key signaling systems (Quorum Sensing, c-di-GMP, Stringent Response) integrate environmental cues to control biofilm maturation, and are prime targets for anti-biofilm agents [99] [95] [7].
Standardized Methodologies and Protocols
The Single Tube Method (ASTM E2871-19)
The Single Tube Method (STM) is a standardized test (ASTM E2871-19) designed to evaluate disinfectant efficacy against Pseudomonas aeruginosa biofilm grown in a CDC Biofilm Reactor [98]. Its primary advantage is partitioning the complex process into four discrete, controllable steps: Grow, Treat, Sample, and Analyze.
Experimental Protocol: ASTM E2871-19 Workflow
Diagram 2: Single Tube Method (ASTM E2871-19) Workflow. This standardized method sequences biofilm testing into discrete, controlled steps to ensure reproducibility [98].
Key Modifications in Recent Versions:
- Splashguard: A key ruggedness test finding was that coupon splashing during vortexing can cause significant bias. The use of a splashguard is now mandated to contain the sample [98].
- Disaggregation Method: Vortexing with glass beads was validated as more effective and reproducible than sonication for disaggregating biofilm cells without excessive cell death [98].
Key Quantitative Benchmarks from Standardized Methods
Standardized methods allow for the establishment of performance benchmarks. Data from an inter-laboratory study of the STM demonstrated excellent reproducibility.
Table 2: Quantitative Performance Data from STM Inter-laboratory Study
| Parameter | Result / Benchmark | Significance |
|---|---|---|
| Reproducibility Standard Deviation | 0.2442 (for untreated control LDs) | Indicates excellent cross-lab reproducibility of control biofilms grown in the CDC reactor [98] |
| Responsiveness (LR from treatment) | >3-log reduction for 5% NaOCl | Demonstrates the method's ability to detect a significant efficacy signal from a known antimicrobial [98] |
| Key Method Characteristic | Surface Area/Volume Ratio & Areal Cell Density | Must be reported, as they critically influence killing efficacy measurements [97] |
Troubleshooting Common Experimental Issues
FAQ 1: Why do I get inconsistent log reduction values between experiments, even when using the same agent and concentration?
- Primary Cause: Inconsistent biofilm growth and/or inadequate harvesting/disaggregation of the biofilm prior to plating.
- Solutions:
- Standardize Growth Conditions: Use a validated biofilm reactor (e.g., CDC, Drip Flow, MBEC device) and strictly control growth time, temperature, and nutrient medium. The ASTM E3161 method standardizes growth in the CDC reactor [98].
- Validate Harvesting: For the STM, ensure vortexing is performed with the correct size and quantity of glass beads. Sonication parameters must be optimized and calibrated if used [98].
- Report Key Parameters: Always document the surface area/volume ratio of the test system and the areal cell density (CFU/cm²) of the untreated control biofilms. These factors are critical for cross-study comparisons [97].
FAQ 2: My anti-biofilm agent works well in my initial plate assay, but shows no efficacy in a flow-cell model. Why?
- Primary Cause: Different biofilm models produce biofilms with vastly different structures and phenotypes. Static models may not generate the relevant EPS matrix or physiological heterogeneity present in flow-generated biofilms.
- Solutions:
- Use a Relevant Model: Choose a biofilm growth method that generates a biofilm relevant to your intended application. High-shear reactors like the CDC produce dense, robust biofilms, while drip flow reactors produce biofilms similar to those in chronic wounds [98].
- Test in Multiple Models: Include a standardized method (e.g., STM, MBEC) for benchmarking alongside your more complex research model [97].
- Check Penetration: The agent may be binding to or being degraded by the EPS matrix before reaching cells in the deeper layers. Use assays to verify agent penetration.
FAQ 3: How can I distinguish between a true anti-biofilm effect and simple antibacterial activity against planktonic cells shed from the biofilm?
- Primary Cause: The test method does not differentiate between killing on the surface and killing of cells removed from the surface in the bulk fluid.
- Solutions:
- Understand Method Limitations: The STM, for example, measures total kill and does not differentiate between killing and removal [98].
- Use a Transfer Method: Employ a method where the biofilm-coated coupon is treated in one vessel and then transferred to a second vessel containing neutralizer for harvesting. This allows for separate quantification of cells killed/removed in the treatment vessel (vessel 1) and cells remaining attached and viable (vessel 2) [98].
- Include a Rinse Step: After treatment, gently rinse the biofilm coupon with a neutral buffer to remove loosely associated cells before harvesting, allowing you to quantify the remaining, strongly adherent population.
The Scientist's Toolkit: Essential Reagents & Materials
Table 3: Key Research Reagent Solutions for Standardized Biofilm Testing
| Reagent / Material | Function in Experiment | Example & Notes |
|---|---|---|
| CDC Biofilm Reactor | Standardized platform for growing reproducible, high-shear biofilms | Vessel with mixing plate and coupon holders; defined in ASTM E3161 [98] |
| Neutralizing Buffers | Inactivates antimicrobial agent at the end of contact time to prevent carry-over effect | Dey-Engley broth is commonly used; validation is required to prove effective neutralization [98] |
| Glass Beads | Mechanical disaggregation of biofilm from coupons during harvesting | For use in vortexing step (e.g., in STM); size and quantity must be consistent [98] |
| Surfactants (e.g., Tween 80, Triton X-100) | Can be used to inhibit initial bacterial adhesion or to aid in biofilm dispersion for analysis | Tween 80 reduces S. aureus adhesion; Triton X-100 can alter EPS architecture [99] |
| Quorum Sensing Inhibitors | Research tools to target biofilm formation and virulence without killing cells | Natural and synthetic molecules that disrupt acyl-homoserine lactone (AHL) signaling [99] [100] |
| c-di-GMP Modulators | Research tools to investigate a key secondary messenger regulating the biofilm lifecycle | Molecules that inhibit diguanylate cyclase (DGC) activity can prevent biofilm formation [95] [7] |
Comparative Analysis of Monotherapy vs. Combination Therapy Outcomes
Frequently Asked Questions (FAQs)
Q1: Why are biofilms particularly resistant to antibiotic monotherapy?
Biofilms exhibit multiple mechanisms of resistance that make them highly tolerant to single-antibiotic treatments. The extracellular polymeric substance (EPS) matrix acts as a formidable physical barrier, limiting antibiotic penetration to the deeper layers of the biofilm. Furthermore, biofilms harbor heterogeneous bacterial populations, including metabolically dormant persister cells and bacteria in nutrient-deficient zones with slow growth rates, both of which are less susceptible to antibiotics that typically target actively growing cells. This is complemented by the upregulation of efflux pumps and the presence of extracellular enzymes that can inactivate antimicrobial agents [65] [4].
Q2: What is the primary mechanistic advantage of combination therapy against biofilms?
Combination therapy attacks the biofilm through multiple, simultaneous pathways. This synergistic approach can overcome the limitations of monotherapy by: 1) enhancing the penetration of drugs through the EPS matrix, often by using a partner drug that disrupts the matrix structure; 2) simultaneously targeting both actively growing and dormant persister cells; and 3) reducing the likelihood of de novo resistance emergence, as bacteria would need to develop concurrent resistance to multiple drugs, a statistically less probable event [101] [102] [103].
Q3: What are common non-antibiotic adjuvants used in combination therapy research?
Researchers are increasingly exploring adjuvants that sensitize biofilms to antibiotics. These include:
- EDTA (Ethylenediaminetetraacetic acid): Disrupts the outer membrane of Gram-negative bacteria by chelating stabilizing metals like magnesium [101].
- N-Acetylcysteine (NAC): Breaks down the EPS matrix by disrupting disulfide bonds in proteins, improving antibiotic penetration [101].
- Sodium Dodecyl Sulphate (SDS): A detergent that kills non-growing cells within the biofilm's inner layers [101].
- Efflux Pump Inhibitors: Compounds that block bacterial efflux pumps, preventing the expulsion of antibiotics [4].
Q4: How do I determine if a drug combination is synergistic in an in vitro biofilm model?
Synergy is typically determined by comparing the efficacy of the drug combination to the effect of each drug alone. Common methodologies include:
- Checkerboard Assay: Used to calculate the Fractional Inhibitory Concentration (FIC) Index. An FIC Index of ≤0.5 is generally considered synergistic.
- Time-Kill Assays: Evaluating the log reduction in colony-forming units (CFU) over 24 hours when the biofilm is exposed to the combination versus each drug alone. A combination is synergistic if it results in a ≥2-log10 CFU/mL reduction compared to the most active single agent [101] [102].
Q5: What are the key challenges in translating promising in vitro combination results to clinical use?
The translational gap is a significant challenge. It arises due to differences between controlled laboratory conditions and the complex in vivo environment. Key barriers include achieving and maintaining the precise drug concentration ratio that demonstrated synergy at the site of infection (e.g., within a biofilm on a medical implant), accounting for variable pharmacokinetics/pharmacodynamics (PK/PD) of the combined drugs in the human body, and the presence of host factors like the immune response which can unpredictably modulate drug activity [102].
Troubleshooting Guides
Problem: Inconsistent Synergy Results in Biofilm Assays
| Symptom | Potential Cause | Solution |
|---|---|---|
| Variable FIC Index values between replicates. | Inconsistent biofilm formation. | Standardize biofilm growth conditions (inoculum size, nutrient media, incubation time). Use assays like crystal violet staining to quantify baseline biofilm biomass before treatment. |
| Combination works in planktonic but not biofilm cells. | Failure of one drug to penetrate the biofilm matrix. | Incorporate a matrix-disrupting agent (e.g., NAC) into the combination or pre-treat the biofilm with it [101]. |
| No synergy observed with a promising pair. | Incorrect drug concentration ratio. | Perform a more detailed checkerboard assay with narrower concentration intervals to identify the optimal synergistic window. |
Problem: High Variance in Animal Model of Biofilm Infection
| Symptom | Potential Cause | Solution |
|---|---|---|
| Unpredictable bacterial load in control groups. | Inconsistent biofilm establishment on implant. | Use a standardized protocol for pre-colonizing implants with bacteria in vitro before surgical implantation. Ensure all animals receive implants from the same production batch. |
| Treatment failure despite in vitro synergy. | Inadequate drug dosing regimen or exposure at the biofilm site. | Conduct pilot PK/PD studies to measure drug concentrations at the target site. Adjust dosing frequency or route of administration to match the synergistic ratio identified in vitro [102]. |
Quantitative Data on Therapy Outcomes
Table 1: Efficacy of Selected Combination Therapies Against Biofilm-Forming Pathogens
| Combination Therapy | Target Pathogen | Model System | Key Outcome Metric | Result (Combination vs. Monotherapy) | Primary Proposed Mechanism |
|---|---|---|---|---|---|
| Fosfomycin + Ciprofloxacin [102] | Pseudomonas aeruginosa | In vitro biofilm model | Log CFU reduction | >3-log reduction vs. <1-log (either drug alone) | Sequential targeting of cell wall and DNA; disruption of persister cells. |
| N-Acetylcysteine (NAC) + Ciprofloxacin [101] | Pseudomonas aeruginosa | Cystic fibrosis patient sputum | Biofilm eradication (MBEC) | Synergistic; achieved MBEC at 8x lower Ciprofloxacin concentration | NAC degrades EPS matrix, enhancing antibiotic penetration. |
| Clarithromycin + Vancomycin [101] | Staphylococcus spp. | In vitro biofilm model | Reduction in biofilm biomass | >80% biomass reduction vs. <40% (Vancomycin alone) | Macrolide disrupts alginate matrix, allowing glycopeptide access. |
| Fosfomycin + Tobramycin [101] | Gram-negative pathogens | Inhaled formulation model | Synergistic killing rate | Enhanced killing rate; suppressed resistance emergence | Tobramycin targets outer layers, Fosfomycin penetrates to inner layers. |
Table 2: Comparative Analysis of Therapeutic Strategies for Biofilm-Associated Infections
| Parameter | Monotherapy | Combination Therapy |
|---|---|---|
| Resistance Emergence | High risk due to selective pressure [104]. | Significantly reduced; requires concurrent mutations [102] [103]. |
| Minimum Inhibitory Concentration (MIC) | Often requires 100-800x the planktonic MIC, frequently toxic [4]. | Can achieve efficacy at lower, safer doses of individual agents [101]. |
| Target Spectrum | Narrow; often ineffective against dormant persister cells. | Broad; can simultaneously target active and dormant populations and the EPS matrix. |
| Clinical Translation | Straightforward PK/PD but high failure rates in chronic infections. | Complex PK/PD (must achieve synergistic ratio at site) but higher potential for cure [102]. |
Experimental Protocols
Protocol 1: Checkerboard Assay for Synergy Screening in Biofilms
Principle: To determine the Fractional Inhibitory Concentration (FIC) Index of a two-drug combination against pre-formed biofilms.
Research Reagent Solutions:
- 96-well Polystyrene Plate: Standard tool for biofilm growth and treatment.
- Cation-Adjusted Mueller-Hinton Broth (CAMHB): Standardized growth medium for antibiotic susceptibility testing.
- Drug Stock Solutions: Prepare high-concentration stocks of Antibiotic A and B in appropriate solvent (e.g., water, DMSO). Filter sterilize.
- 0.1% Crystal Violet Solution: For staining and quantifying total biofilm biomass.
- 33% Glacial Acetic Acid: To solubilize crystal violet stain for spectrophotometric reading.
Methodology:
- Biofilm Formation: In a 96-well plate, incubate a standardized bacterial inoculum (e.g., 10^6 CFU/mL) in CAMHB for 24 hours at 37°C to form a biofilm.
- Washing: Gently remove planktonic cells by washing the biofilm twice with sterile phosphate-buffered saline (PBS).
- Checkerboard Setup: Create a two-dimensional dilution series. Serially dilute Drug A along the rows and Drug B along the columns, resulting in wells containing every possible combination of concentrations.
- Incubation: Add fresh, dilute media to the drug-containing wells and incubate the plate for a further 24 hours.
- Assessment: Measure the Minimum Biofilm Inhibitory Concentration (MBIC) visually or using a metabolic dye like resazurin. The MBIC is the lowest concentration that prevents visible biofilm growth or metabolic activity.
- Calculation: Calculate the FIC Index for each combination that resulted in inhibition:
Protocol 2: Time-Kill Assay of Biofilms
Principle: To evaluate the bactericidal activity and rate of killing of a drug combination over time against mature biofilms.
Research Reagent Solutions:
- Biofilm Reactor or 24-well Plate: Provides sufficient surface area and volume for robust biofilm growth and sampling.
- Sterile PBS for Sonication: Used to disaggregate biofilm for accurate CFU counting.
- Tryptic Soy Agar (TSA) Plates: For plating and enumerating viable bacteria (CFU).
Methodology:
- Grow Biofilm: Grow a mature biofilm on coupons (in a reactor) or on the bottom of a 24-well plate for 48 hours, refreshing media at 24 hours.
- Treat Biofilm: After washing, expose the biofilm to the following in fresh media: a) Control (no drug), b) Drug A at a predetermined concentration, c) Drug B at a predetermined concentration, d) Combination of A + B at the same concentrations.
- Sample: At timepoints T=0, 4, 8, and 24 hours, harvest biofilm from replicate wells/coupons.
- Viable Count: Sonicate the harvested biofilm briefly to disaggregate cells, perform serial dilutions in PBS, and plate on TSA. Count CFUs after 24-48 hours of incubation.
- Analysis: Plot Log10 CFU/mL versus time. Synergy is concluded if the combination produces a ≥2-log10 reduction in CFU/mL compared to the most effective single drug at the 24-hour time point [102].
Visualized Signaling Pathways and Workflows
Biofilm Defense and Attack
Synergy Screening Workflow
The Scientist's Toolkit
Table 3: Essential Research Reagents for Biofilm Combination Therapy Studies
| Reagent / Material | Function in Experiment | Key Considerations |
|---|---|---|
| 96-well Polystyrene Plates | Standard substrate for high-throughput, reproducible biofilm growth and treatment assays. | Surface properties can influence initial bacterial attachment; ensure consistency across experiments. |
| Crystal Violet Stain | A basic dye that binds to negatively charged surface molecules and polysaccharides in the EPS, allowing for quantification of total biofilm biomass. | Does not distinguish between live and dead cells. Must be used in conjunction with viability assays (e.g., CFU counting) [101]. |
| Resazurin (AlamarBlue) | A metabolic indicator dye used to measure cell viability within a biofilm. Metabolically active cells reduce blue resazurin to pink, fluorescent resorufin. | Provides an indirect measure of viability and can be more rapid than CFU counting, but may be less sensitive in very dense or slow-growing biofilms. |
| N-Acetylcysteine (NAC) | A reducing agent used as a biofilm-disrupting adjuvant. It breaks disulfide bonds in proteins within the EPS matrix, destabilizing the biofilm structure. | Concentration must be optimized, as high levels can be directly bactericidal, confounding the interpretation of synergy [101]. |
| Fosfomycin | A broad-spectrum, old-generation antibiotic that inhibits cell wall synthesis (MurA enzyme). Regained interest for combination therapy against MDR biofilms. | Requires the addition of Glucose-6-Phosphate (G6P) in culture media to induce the hexose phosphate transporter (UhpT) for effective bacterial uptake during susceptibility testing [102]. |
Core Concepts: Understanding Polymicrobial Biofilms
What are polymicrobial biofilms and why are they a significant challenge in antimicrobial research?
Polymicrobial biofilms are structured communities of diverse microbial consortia (e.g., different bacterial genera or even members of different kingdoms like bacteria and fungi) encased in a self-produced exopolysaccharide layer that forms on any biotic or abiotic surface [105]. They are more resilient and persistent due to their enhanced drug resistance compared to monospecies biofilms, making them exceedingly difficult to eliminate using standard antimicrobial therapies [105]. About 80% of chronic wounds contain polymicrobial biofilms, which are more severe, cause more inflammation and tissue damage, and can be up to 10 times more resistant to antibiotics than their single-species counterparts [105].
What are the common types of interkingdom interactions found in these biofilms? Interactions within polymicrobial biofilms can be synergistic, additive, or antagonistic [105].
- Synergistic: The establishment of the first pathogen creates a gateway for secondary pathogens to colonize the host, increasing infection severity [105].
- Bacterial-Fungal Interactions: Candida albicans with Staphylococcus epidermidis or Pseudomonas aeruginosa is common. Bacteria can facilitate fungal attachment, while the fungus can enhance bacterial growth and drug resistance [105].
- Fungal-Fungal Interactions: In mixed-species biofilms, such as those involving C. albicans and C. glabrata, one species may adhere to the hyphae of another, facilitating enhanced colonization, tissue invasion, and augmented resistance to antifungals like azoles and echinocandins [105].
Quantitative Data: Resistance in Polymicrobial vs. Monomicrobial Biofilms
The table below summarizes key quantitative findings on the enhanced resistance observed in polymicrobial biofilms, which validation experiments must be designed to detect.
Table 1: Documented Enhanced Resistance in Polymicrobial Biofilms
| Microbial Combination | Context/Model System | Observed Resistance Increase | Key Findings |
|---|---|---|---|
| Ocular isolates: Staphylococcus aureus, S. epidermidis, & Candida albicans | Ex vivo human cornea & in vitro assays [106] | Several-fold higher | Polymicrobial biofilms exhibited increased resistance to various antimicrobials compared to planktonic cells. The MBEC (Minimum Biofilm Eradication Concentration) in polymicrobial settings was either identical or decreased compared to monomicrobial biofilms. |
| General polymicrobial biofilms | Chronic wound models [105] | Up to 10 times more resistant | Compared to mono-species biofilms, making antibiotic treatment quite challenging. |
| General biofilm bacteria | Comparison to free-floating (planktonic) bacteria [107] | Up to 1,500 times more resistant | To antibiotics, highlighting the intrinsic protective nature of the biofilm lifestyle. |
Experimental Protocols: Validation in Complex Models
Protocol 1: Establishing and Quantifying Polymicrobial Biofilms on Biological Surfaces
This protocol, adapted from a study using ex vivo human corneas, provides a method for validating biofilm formation on a complex, biological surface [106].
- 1. Surface Preparation: Aseptically prepare the biological substrate (e.g., human cadaveric cornea). Place the tissue in a suitable sterile container with necessary nutrients to maintain tissue integrity during incubation.
- 2. Inoculation and Incubation:
- Simultaneous Incubation: Dilute overnight cultures of each microbial strain (e.g., S. aureus, S. epidermidis, C. albicans) to approximately 10^4 cells/mL in a rich medium like YPD. Combine the microbial suspensions and add them to the biological surface.
- Sequential Incubation: To model secondary colonization, first establish a monomicrobial biofilm on the surface for 24 hours. After carefully removing the planktonic cells, add the secondary microorganism(s) and continue incubation.
- Incubate the setup at the appropriate temperature (e.g., 37°C for human pathogens) for 24-48 hours under static or gentle agitation conditions.
- 3. Biofilm Quantification (Post-Incubation):
- Biomass (Crystal Violet Method): Gently wash the surface with phosphate-buffered saline (PBS) to remove non-adherent cells. Fix the adherent biofilm with methanol or ethanol for 15 minutes. Air dry and stain with 0.1% crystal violet for 20 minutes. Wash excess stain, elute the bound dye with absolute ethanol, and measure the optical density at 595 nm [106].
- Metabolic Activity (XTT Assay): After incubation and washing, prepare an XTT-menadione solution (e.g., 1 mg/mL XTT with 0.4 mM menadione in PBS). Add the solution to the biofilm and incubate in the dark for 3 hours. Transfer the solution to a fresh microtiter plate and measure the colorimetric change at 492-495 nm, which correlates with metabolic activity [106].
- 4. Microscopic Validation:
- Use Confocal Laser Scanning Microscopy (CLSM) or Scanning Electron Microscopy (SEM) to qualitatively assess the polymicrobial biofilm structure, thickness, and spatial organization of the different species on the surface [106].
Protocol 2: Determining Minimum Biofilm Eradication Concentration (MBEC) in Polymicrobial Setups
This protocol is crucial for evaluating the efficacy of antimicrobial agents against pre-established polymicrobial biofilms [106].
- 1. Biofilm Formation: Establish mature polymicrobial biofilms in a 96-well microtiter plate or on relevant surfaces (e.g., medical device coupons, tissue models) using the methods described in Protocol 1.
- 2. Antimicrobial Challenge:
- Prepare a logarithmic dilution series of the antimicrobial agent(s) in an appropriate medium.
- Gently wash the pre-formed biofilms to remove planktonic cells.
- Add the antimicrobial dilutions to the biofilms. Include a growth control (medium only) and a sterility control.
- Incubate the plate under conditions optimal for the biofilm for a specified period (e.g., 24 hours).
- 3. MBEC Determination:
- After incubation, remove the antimicrobial solution and wash the biofilms.
- The MBEC is defined as the lowest concentration of antimicrobial that results in no visible growth after subculturing the biofilm into a fresh medium, or that demonstrates ≥99.9% reduction in viable cell count compared to the untreated control. Viable counts are obtained by disrupting the biofilm (via sonication or vortexing with beads), serially diluting the suspension, and plating on non-selective and selective agars to enumerate total and species-specific survival [106].
The following workflow diagram illustrates the key stages of this experimental validation process.
Troubleshooting Common Experimental Issues
Problem: High Variability in Polymicrobial Biofilm Biomass Between Experimental Replicates.
- Potential Causes: Inconsistent initial cell concentrations; uneven mixing of different species; surface conditioning variability; temperature or CO₂ fluctuations during incubation.
- Solutions: Standardize overnight culture densities using a spectrophotometer. Use single, pre-mixed aliquots of the polymicrobial inoculum for all replicates within an experiment. Ensure consistent surface pre-treatment (e.g., with saliva, serum) if used. Validate environmental control of incubators [106].
Problem: Antimicrobial Treatment Fails to Eradicate the Biofilm Despite High Dosages.
- Potential Causes: The biofilm matrix is acting as a diffusion barrier and sequestering the agent; presence of persister cells; synergistic microbial interactions enhancing community-wide resistance.
- Solutions:
- Matrix Disruption: Incorporate matrix-degrading enzymes (e.g., Dispersin B for PNAG, DNase I for eDNA) into the treatment regimen to enhance antimicrobial penetration [108] [23].
- Combination Therapy: Use a combination of antimicrobials with different targets. Consider adding an anti-biofilm agent like hypochlorous acid (HOCl), which has demonstrated efficacy in mechanically disrupting the biofilm matrix and reducing bacterial counts [107].
- Physical Methods: Employ physical debridement or pressurized wound therapy in relevant models to mechanically disrupt the biofilm structure [107].
Problem: Difficulty in Differentiating and Quantifying Individual Species from a Polymicrobial Biofilm.
- Potential Causes: Overgrowth of one species masks others; some species may not grow on selective media; biofilm aggregation makes serial dilution inaccurate.
- Solutions: Use species-specific fluorescent tags (e.g., GFP, RFP) for direct visualization and quantification via fluorescence microscopy or flow cytometry. For viability counts, use a combination of selective and non-selective media. Validate culture-based methods with molecular techniques like qPCR to quantify species-specific gene markers [105] [106].
Key Resistance Mechanisms and Methodological Implications
Understanding the underlying mechanisms of resistance is critical for designing appropriate validation experiments. The following diagram and table connect these mechanisms to their experimental consequences.
Table 2: Research Reagent Solutions for Biofilm Matrix and Resistance Research
| Reagent / Material | Primary Function / Mechanism | Example Application in Validation |
|---|---|---|
| Dispersin B | A glycoside hydrolase enzyme that degrades poly-β(1,6)-N-acetyl-D-glucosamine (PNAG), a key biofilm matrix component in many bacteria [108]. | Used in combination with antibiotics to disrupt the matrix and enhance antimicrobial penetration in biofilms formed by Staphylococci, E. coli, and others [108]. |
| DNase I | Degrades extracellular DNA (eDNA) in the biofilm matrix, which can bind cationic antimicrobials and contribute to structural integrity [108] [23]. | Added to treatment suspensions to reduce biofilm stability and aminoglycoside sequestration, particularly in Pseudomonas aeruginosa and Staphylococcus aureus biofilms [23]. |
| Hypochlorous Acid (HOCl) | A powerful, non-antibiotic oxidizing agent that mechanically disrupts the extracellular polymeric matrix, penetrates biofilms, and reduces bacterial counts [107]. | Used as a topical solution or in pressurized irrigation systems (e.g., JetOx-ND) to cleanse and debride biofilm-infected wound models prior to antibiotic application [107]. |
| Crystal Violet | A general stain that binds to cells and polysaccharides, used for the quantitative assessment of total adhered biofilm biomass [106]. | Standard staining and elution protocol followed by OD₅₉₅ measurement to quantify biofilm formation in microtiter plates or on tissue samples [106]. |
| XTT-Menadione | A tetrazolium dye reduced by metabolically active cells to a soluble, colored formazan product, serving as a proxy for biofilm metabolic activity [106]. | Used after antimicrobial treatment to assess the viability and metabolic state of the remaining biofilm community [106]. |
| Cold Atmospheric Plasma (CAP) | A physical therapy that generates reactive oxygen and nitrogen species (RONS), causing oxidative damage to biofilm components and cells [105]. | Investigated as a non-thermal physical method for eradicating biofilms from medical device materials and wound surfaces [105]. |
Correlating Matrix Disruption with Restoration of Antibiotic Susceptibility
Troubleshooting Guides
Common Experimental Issues and Solutions
Q1: Despite applying a matrix-disrupting agent, my biofilm remains largely intact and antibiotic efficacy is not restored. What could be going wrong?
A: This common issue can stem from several factors:
- Insufficient Agent Concentration or Contact Time: The extracellular polymeric substance (EPS) matrix is a robust, complex structure. The concentration of your disrupting agent (e.g., DNase, glycoside hydrolase) may be too low, or the exposure time too short, to achieve effective breakdown.
- Incorrect Choice of Disrupting Agent: The composition of the biofilm matrix varies significantly between bacterial species and even strains [23]. An agent targeting polysaccharides may be ineffective against a protein- or eDNA-rich matrix.
- Agent Inactivation: The disrupting agent may be inactivated by other components in the growth medium or by enzymes secreted by the biofilm itself.
- Solution: Include a positive control using a purified component of the EPS (e.g., salmon sperm DNA for DNase activity) to verify the agent's activity in your experimental setup. Consider purifying the biofilm or washing cells before treatment to remove potential inhibitors.
Q2: I observe successful matrix disruption, but the antibiotic tolerance of the biofilm cells does not decrease. Why is there no correlation?
A: Matrix disruption alone may not be sufficient to resensitize all bacterial subpopulations.
- Persister Cells: Biofilms contain dormant, metabolically inactive persister cells that exhibit high tolerance to antibiotics regardless of physical barrier presence [65] [23]. Disrupting the matrix may not affect these cells.
- Solution: Combine matrix-disrupting agents with strategies that target persisters, such as specific metabolic stimulants or antimicrobial peptides (AMPs) that disrupt membranes [65] [109]. Assess cell viability using assays that differentiate between live/dead states (e.g., CFU counts combined with live/dead staining) rather than just biomass reduction.
- Inherent Genetic Resistance: The biofilm may harbor genetically resistant mutants whose resistance is independent of the matrix barrier. Matrix disruption will not affect this intrinsic resistance [23].
- Solution: Perform antibiotic susceptibility testing (AST) on planktonic cells derived from the disrupted biofilm to check for underlying genetic resistance. Use genomic analysis to identify resistance genes.
Q3: My results for restored antibiotic susceptibility are inconsistent across biological replicates. How can I improve reproducibility?
A: Biofilm experiments are notoriously heterogeneous. Inconsistency often arises from variations in initial biofilm formation.
- Solution: Standardize biofilm growth conditions meticulously. This includes:
- Inoculum Size: Use a precise and consistent cell density to initiate biofilm growth.
- Growth Surface and Medium: Ensure the material and sterility of the growth surface (e.g., polystyrene, glass) are identical. Use the same batch of growth medium.
- Environmental Control: Rigorously control temperature, shaking speed (if applicable), and humidity during biofilm development.
- Normalization: Always normalize your disruption and antibiotic efficacy data to a robust metric of initial biofilm biomass, such as crystal violet staining or total protein content [1].
Protocol-Specific Troubleshooting
Q4: When using enzymes like DNase I to disrupt extracellular DNA (eDNA), how do I confirm the enzyme is active and the eDNA is degraded?
A:
- Confirming Enzyme Activity:
- Run a gel-based activity assay concurrently with your biofilm experiment. Incubate DNase I with a control DNA (e.g., lambda DNA) in the same buffer used for your biofilms. Check for DNA degradation on an agarose gel.
- Ensure your buffer contains the necessary co-factors (e.g., Mg²⁺ or Ca²⁺ for DNase I).
- Confirming eDNA Degradation In Situ:
- Use a DNA-binding fluorescent dye (e.g., TOTO-1, SYTOX Green) that is impermeant to intact cell membranes. After DNase treatment, a significant reduction in extracellular fluorescence, as visualized by confocal microscopy, indicates successful eDNA degradation [23].
- Quantify eDNA in biofilm supernatants after mild centrifugation using a fluorescence-based DNA quantification assay.
Q5: When testing novel anti-biofilm peptides, how can I differentiate between inhibition of biofilm formation and disruption of a pre-formed biofilm?
A: These are two distinct experimental paradigms.
- Biofilm Inhibition Assay: Add the antimicrobial peptide (AMP) at the same time as the bacterial inoculum. This tests the compound's ability to prevent initial attachment and microcolony formation.
- Biofilm Disruption/Eradication Assay: Allow the biofilm to form for a defined period (e.g., 24-48 hours), then wash away planktonic cells and add the AMP to the pre-established biofilm. This tests the compound's ability to break down a mature structure [7] [109].
- Solution: Clearly design your experiments to test one mode of action at a time. Use a standard biofilm biomass assay (e.g., crystal violet) or a viability assay (e.g., resazurin, CFU counts) to quantify the effect in each scenario.
Frequently Asked Questions (FAQs)
Q6: What are the primary mechanisms by which the biofilm matrix confers antibiotic resistance?
A: The matrix contributes to resistance through multiple, often synergistic, mechanisms:
- Physical Diffusion Barrier: The dense, anionic EPS can physically hinder the penetration of antimicrobial molecules, causing them to diffuse slowly or become trapped before reaching cells in the deeper layers of the biofilm [65] [23].
- Chemical Deactivation: Some matrix components can directly interact with and neutralize antibiotics. For example, eDNA can bind to and sequester cationic aminoglycosides, while certain enzymes within the matrix (e.g., β-lactamases) can degrade antibiotics [65] [7].
- Creation of a Heterogeneous Microenvironment: The matrix contributes to gradients of nutrients, oxygen, and waste products. This leads to zones of slow or non-growing (dormant) cells that are inherently less susceptible to many antibiotics which target active cellular processes [65] [23].
Q7: Beyond classic enzymes, what are some emerging strategies for disrupting the biofilm matrix?
A: Recent research has focused on several innovative strategies:
- Antimicrobial Peptides (AMPs): Certain AMPs not only kill bacteria but also can disrupt the electrostatic and structural integrity of the EPS matrix [109].
- Nanoparticles (NPs): NPs can be engineered to deliver matrix-degrading enzymes or reactive oxygen species deep into the biofilm. They can also physically damage the matrix structure [1].
- Quorum Sensing Inhibitors (QSIs): These molecules interfere with bacterial cell-to-cell communication, preventing the coordinated gene expression required for matrix production and biofilm maturation without killing the bacteria [7].
- Bacteriophage-Derived Enzymes: Phages produce depolymerases that specifically degrade bacterial polysaccharides, making them highly effective and targeted matrix-disrupting agents [1].
Q8: How can I quantitatively measure the success of matrix disruption in restoring antibiotic susceptibility?
A: Success should be measured using a combination of metrics:
- Matrix Disruption:
- Direct Visualization: Use confocal laser scanning microscopy (CLSM) with component-specific stains (e.g., ConA for polysaccharides, SYPRO Ruby for proteins) to observe structural breakdown.
- Biomass Quantification: Measure a reduction in total biofilm biomass using a crystal violet assay.
- Component Release: Quantify the release of EPS components (DNA, polysaccharides, proteins) into the supernatant after treatment.
- Restored Antibiotic Susceptibility:
- Minimum Biofilm Eradication Concentration (MBEC): Compare the MBEC of an antibiotic alone versus the antibiotic combined with the disrupting agent. A significant drop in MBEC indicates successful restoration of susceptibility [7].
- Viability Staining: Use live/dead staining (e.g., SYTO9/propidium iodide) followed by fluorescence microscopy or quantification to show increased cell death after combination treatment.
- Colony Forming Unit (CFU) Counts: The gold standard. A several-log reduction in CFUs from the biofilm after combination treatment compared to either agent alone provides the most robust evidence of synergy [1].
Quantitative Data and Reagents
Table 1: Quantitative Efficacy of Selected Matrix-Disrupting Agents
| Disrupting Agent | Target in EPS | Typical Working Concentration | Reported Reduction in Biofilm Biomass | Effect on Antibiotic MIC/MBEC | Key References |
|---|---|---|---|---|---|
| DNase I | Extracellular DNA (eDNA) | 10-100 µg/mL | Up to 60-80% | Reduces MBEC of Tobramycin vs. P. aeruginosa by 10-100 fold | [7] [23] |
| Dispersin B | Poly-N-acetylglucosamine (PNAG) | 5-40 µg/mL | Up to 70-90% | Restores Aminoglycoside susceptibility in S. epidermidis | [7] [1] |
| Proteinase K | Proteinaceous components | 50-200 µg/mL | 50-70% | Enhances efficacy of β-lactams against protein-rich biofilms | [7] |
| Anti-biofilm Peptide T2-9 | Membrane & Matrix integrity | ~16 µM (MIC) | >95% (inhibition) | Exhibits strong antibacterial activity comparable to FDA-approved antibiotics | [109] |
| EDTA | Divalent Cations (Matrix stability) | 0.5-2 mM | 40-60% | Synergizes with various antibiotics by disrupting matrix integrity | [7] |
Table 2: Research Reagent Solutions for Biofilm Matrix Disruption Studies
| Reagent / Material | Function / Application in Research | Key Considerations |
|---|---|---|
| DNase I (RNase-free) | Degrades extracellular DNA (eDNA) in the biofilm matrix, weakening structure and reducing antibiotic binding. | Requires Mg²⁺ or Ca²⁺ for activity. Check for and inhibit host-derived DNase inhibitors in certain samples. |
| Glycoside Hydrolases | A class of enzymes that break down polysaccharide components (e.g., Pel, Psl, alginate) of the EPS. | Specificity is key; different enzymes are needed for different polysaccharides. |
| SYTOX Green / Propidium Iodide | Impermeant nucleic acid stains used to quantify cell membrane damage (dead cells) and, in the case of SYTOX Green, visualize eDNA in biofilms with compromised membranes. | Distinguish between fluorescence from eDNA and DNA from dead cells. |
| Concanavalin A (ConA) Tetramethylrhodamine | Fluorescently labels α-mannopyranosyl and α-glucopyranosyl sugar residues in polysaccharides for microscopic visualization of the matrix. | Can be used in conjunction with other fluorescent probes for multi-component analysis. |
| Crystal Violet | A basic dye that binds to negatively charged surface molecules and polysaccharides, used for simple, high-throughput quantification of total adhered biomass. | Does not differentiate between live and dead cells, only total biomass. |
| Calgary Biofilm Device (CBD) | Provides a standardized platform for growing multiple, equivalent biofilms for high-throughput susceptibility testing (MBEC assay). | Essential for generating reproducible and comparable MBEC data. |
| Antimicrobial Peptides (AMPs) | Potent broad-spectrum candidates that can disrupt microbial membranes and the EPS matrix; identified via advanced methods like deep learning models (e.g., deepAMP). | Potential for cytotoxicity. Stability in physiological conditions can be a challenge. |
| Functionalized Nanoparticles | Engineered carriers for targeted delivery of antibiotics and/or matrix-disrupting enzymes into the deep layers of the biofilm. | Synthesis and functionalization require specialized expertise. Biocompatibility must be assessed. |
Experimental Protocols & Workflows
Protocol: Assessing Synergy Between Matrix Disruption and Antibiotics Using a Pre-formed Biofilm Model
Objective: To quantitatively determine if a matrix-disrupting agent can restore the susceptibility of a mature biofilm to a specific antibiotic.
Materials:
- Standard bacterial strain (e.g., Pseudomonas aeruginosa PAO1, Staphylococcus aureus)
- Cation-adjusted Mueller Hinton Broth (CAMHB)
- 96-well flat-bottom polystyrene microtiter plates
- Matrix-disrupting agent (e.g., DNase I, Dispersin B) in appropriate buffer
- Antibiotic stock solution
- Phosphate Buffered Saline (PBS)
- Crystal violet solution (0.1% w/v) or resazurin solution for viability
Method:
- Biofilm Formation: Grow an overnight culture of the test organism. Dilute 1:100 in fresh CAMHB. Add 200 µL per well to a 96-well plate. Incubate statically for 24-48 hours at 37°C to form a mature biofilm.
- Washing: Carefully aspirate the planktonic culture from each well. Gently wash the adhered biofilm twice with 200 µL of sterile PBS to remove non-adherent cells.
- Treatment:
- Group 1 (Control): Add 200 µL of fresh CAMHB.
- Group 2 (Antibiotic Only): Add 200 µL of CAMHB containing the antibiotic at a sub-inhibitory or relevant concentration.
- Group 3 (Disruptor Only): Add 200 µL of CAMHB containing the matrix-disrupting agent.
- Group 4 (Combination): Add 200 µL of CAMHB containing both the antibiotic and the disrupting agent at the same concentrations as Groups 2 and 3.
- Incubation: Incubate the plate for a further 24 hours at 37°C.
- Assessment:
- Option A (Biomass): Aspirate treatments, wash, air-dry, and stain with crystal violet. Elute dye and measure OD590nm.
- Option B (Viability): After treatment, aspirate and add resazurin solution. Incubate and measure fluorescence/OD. Alternatively, scrape biofilms, vortex vigorously, serially dilute, and plate for CFU counts.
- Analysis: Compare the biomass/viability between the four groups. Synergy is demonstrated when the combination treatment (Group 4) results in a significantly greater reduction than the sum of the effects of the individual treatments.
Workflow: From Biofilm Cultivation to Analysis of Disruption Efficacy
The following diagram outlines the core experimental workflow for a standard biofilm disruption and susceptibility restoration assay.
Mechanism: Synergistic Action of Matrix Disruption and Antibiotics
This diagram illustrates the conceptual mechanism of how disrupting the biofilm matrix can restore antibiotic susceptibility by overcoming physical and physiological barriers.
The translational gap in biofilm science represents a critical bottleneck in the development of effective anti-biofilm agents. Despite significant advances in basic science, many promising compounds fail to demonstrate efficacy in clinical trials due to fundamental disconnects between industrial practices and academic research [110]. The global economic impact of biofilms is estimated at over $5 trillion USD annually, affecting health, food security, water security, and industrial processes [110]. A major barrier to translation lies in the persistent use of industrial standardised efficacy tests that utilize planktonic microbes (e.g., CLSI Minimum Inhibitory Concentration), despite overwhelming evidence that these have little relevance to sessile microbial communities observed across clinical settings [110]. This technical support document addresses these challenges through troubleshooting guides and FAQs specifically designed for researchers and drug development professionals working within the context of biofilm matrix diffusion barrier antibiotic resistance research.
Technical FAQs: Core Experimental Challenges
Q1: Why do my in vitro biofilm susceptibility results consistently fail to predict in vivo efficacy?
This represents a fundamental translational challenge. Most laboratory results struggle to address 'real-life' situations because canonical biofilm descriptions are simplifications, and there is greater complexity to biofilms found in clinically relevant settings [110].
- Troubleshooting Guide:
- Problem: Standard antimicrobial efficacy tests use planktonic microbes.
- Solution: Implement biofilm-specific testing methods such as Minimal Biofilm Eradication Concentration (MBEC) assays instead of Minimum Inhibitory Concentration (MIC) [111].
- Problem: Laboratory models use relatively 'immature' (12h) biofilms to represent clinical biofilms that present as chronic (>4 weeks).
- Solution: Develop longer-term maturation models that better mimic clinical biofilm age and complexity [110].
- Problem: Static well assays don't replicate the shear flow forces present in most clinical environments.
- Solution: Implement shear flow chamber systems that provide improved nutrition and enhanced biofilm attachment [112].
Q2: How can I improve the clinical relevance of my biofilm architecture models?
Traditional models often fail to generate the biofilm structures found in vivo, particularly for complex wound environments [110].
- Troubleshooting Guide:
- Problem: 2D models fail to generate clinically relevant biofilm structures.
- Solution: Implement 3D artificial dermal models including scaffold-free (Self-assembled skin substitutes) and scaffold-based systems [110].
- Problem: Standard models lack host environment components.
- Solution: Adapt models to include host elements like the Lubbock wound model which grows biofilms in media containing plasma and red blood cells [110].
- Problem: Models based on non-mammalian compounds may not replicate in vivo structures.
- Solution: Develop hydrogel-based cellulose models or collagen-based systems that better mimic host tissues [110].
Q3: What are the key considerations for designing experiments to overcome the biofilm matrix diffusion barrier?
The extracellular polymeric substance (EPS) matrix exhibits selective permeability, allowing nutrients and signaling molecules while impeding antimicrobial compounds, contributing to 10-1,000-fold higher antibiotic resistance compared to planktonic cells [113].
- Troubleshooting Guide:
- Problem: EPS matrix creates a physical barrier to antimicrobial penetration.
- Solution: Consider combination therapies including biofilm-disrupting agents such as microwave radiation, which causes significant structural disintegration [113].
- Problem: Metabolic heterogeneity within biofilms creates varied microenvironments.
- Solution: Utilize fluorescence-based protocols with multiple reporters to visualize cellular-scale arrangement and microenvironments within biofilms [114].
- Problem: Standard susceptibility testing doesn't account for persister cells.
- Solution: Implement regrowth potential assays and extended treatment exposure times in efficacy testing [113].
Research Reagent Solutions for Biofilm Research
Table 1: Essential Research Reagents for Biofilm Matrix Studies
| Reagent/Category | Specific Examples | Function/Application | Key Considerations |
|---|---|---|---|
| Fluorescent Reporters | pUA66-pompC::gfp, pEB2-mScarlet-I [114] | Cellular-scale visualization of biofilm structure and clonal organization | Ensure no spectral overlap; use 1:10 ratio of different colored cells to visualize patterns [114] |
| Matrix Staining Dyes | Conventional, immune histochemical, or fluorescent dyes [111] | EPS matrix visualization and quantification | Combine with direct visualization methods (SEM, CSLM) for structural analysis [111] |
| Specialized Culture Media | YESCA media + 4% DMSO [113], LB supplemented with plasma/red blood cells [110] | Mimic host environment for clinically relevant biofilm growth | YESCA with DMSO enhances E. coli UTI89 biofilm formation; plasma components increase antimicrobial resistance [110] [113] |
| Antibiofilm Agents | Rifampicin, Fluoroquinolones [111], Microwave radiation [113] | Penetrate biofilm matrix and target sessile cells | Rifampicin inhibits RNA polymerase; microwaves disrupt matrix via thermal and non-thermal mechanisms [111] [113] |
Quantitative Data Framework for Anti-Biofilm Agent Development
Table 2: Key Quantitative Metrics for Biofilm Agent Evaluation
| Parameter | Standard Approach | Enhanced Translational Approach | Clinical Relevance |
|---|---|---|---|
| Susceptibility Testing | Minimum Inhibitory Concentration (MIC) [111] | Minimal Biofilm Eradication Concentration (MBEC) [111] | Better predicts clinical efficacy against sessile populations |
| Biofilm Age | 12-24 hour models [110] | 4-day to several week maturation [110] [113] | Mimics chronic clinical biofilms (>4 weeks) [110] |
| Structural Analysis | Microtiter plate assays [114] | Hydrogel, 3D tissue models [110] | Recapitulates in vivo biofilm architecture |
| Physiological Conditions | Static well assays [112] | Shear flow systems (e.g., BioFlux) [112] | Replicates fluid dynamics in clinical environments |
| Treatment Efficacy Metric | Log reduction in planktonic cells | Regrowth potential (e.g., 25% after microwave treatment) [113] | Addresses persister cells and biofilm resilience |
Experimental Protocols for Translational Biofilm Research
Fluorescence-Based Protocol for Cellular-Scale Biofilm Visualization
This protocol enables high-magnification, multi-fluorescence imaging of cellular arrangements in biofilms, essential for understanding matrix penetration of anti-biofilm agents [114].
- Step-by-Step Methodology:
- Prepare Cultures: Transform cells with constitutively expressed fluorescent reporters (e.g., pUA66-pompC::gfp and pEB2-mScarlet-I). Culture strains overnight (16h) in appropriate media (e.g., LB with 50 μg/mL kanamycin) at 37°C with shaking at 300 rpm [114].
- Grow Biofilms on Cover Glass: Using 96-well microtitre plate static assays, fill wells with 200 μL fresh media containing 1:10 dilution of overnight cultures, mixing green and red fluorescent cells in 1:10 ratio. Carefully break 18×18 mm cover glass to fit inside wells and insert pieces perpendicularly. Incubate plates undisturbed for 16-24h at 37°C [114].
- Critical Steps to Prevent Artifacts:
- Prevent movement and disturbances during incubation as vibrations disrupt assembling biofilms
- Prevent evaporation using custom plastic lids and placing water bath in incubator
- Use appropriate safety precautions when handling cover glass pieces [114]
- Image and Visualize: Prepare samples by carefully retrieving cover glass with forceps. Image using high-magnification microscopy with multiple fluorescence channels to discern clonal organization within biofilms [114].
Microwave Disruption Protocol for Biofilm Matrix Diffusion Studies
This protocol utilizes microwave radiation to disrupt biofilm matrix integrity, providing insights into physical barrier disruption strategies [113].
- Step-by-Step Methodology:
- Biofilm Preparation: Prepare E. coli UTI89 biofilms on coverslips or catheter-mimicking surfaces using YESCA media with 4% DMSO. Incubate under static conditions at 25°C for 4 days to facilitate mature biofilm development [113].
- Microwave Exposure: Carefully retrieve substrates with established biofilms using sterile forceps. Place on butter paper and expose to microwave radiation (2.45 GHz) for 15 minutes. Monitor temperature with thermal gun (approximately 45-56°C) [113].
- Assessment of Efficacy: Evaluate cell viability reduction (up to 95%) and regrowth potential (reduced to 25%) through colony counting. Analyze structural disruption via FE-SEM and membrane permeabilization using CLSM [113].
- Control Experiments: Include UV radiation exposure (20 minutes in biosafety cabinet) and dry heat exposure (45°C for 10 minutes; 56°C for 15 minutes) in parallel to decouple thermal from non-thermal microwave effects [113].
Conceptual Framework: Biofilm Research-Industrial Engagement
The Biofilm Research-Industrial Engagement Framework (BRIEF) provides a systematic approach for classifying biofilm technologies according to their level of scientific insight and industrial utility [110]. This framework is essential for guiding translational research in anti-biofilm agent development.
Biofilm Research-Industrial Engagement Framework
The framework illustrates that optimal translation requires simultaneous advancement along both scientific and industrial axes, avoiding the common pitfalls of Quadrant 2 (well-understood science with poor translation) and Quadrant 3 (widely adopted practices with limited scientific basis) [110].
Advanced Methodologies: Complex Biofilm Model Systems
Polymicrobial Biofilm Models for Clinical Relevance
Approximately 80% of chronic wounds contain polymicrobial biofilms which are more severe than mono-species biofilms, causing more inflammation and tissue damage and demonstrating 10 times greater resistance to antibiotics [105].
- Key Implementation Considerations:
- Interkingdom Interactions: Include fungal-bacterial combinations such as Candida albicans with Staphylococcus epidermidis or Pseudomonas aeruginosa, commonly found in catheter-associated urinary tract infections [105].
- Synergistic Virulence: Recognize that some pathogen partnerships increase infection severity - for instance, C. glabrata adhering to C. albicans hyphae facilitates enhanced colonization and tissue penetration [105].
- Enhanced Resistance Mechanisms: Polymicrobial biofilms exhibit augmented resistance to antimicrobials through synergistic upregulation of efflux pump genes and other shared protective mechanisms [105].
Flow System Integration for Physiological Relevance
Traditional biofilm workflows involve significant manipulation that alters native biofilm morphology, yielding results that often don't transfer to in vivo models [112].
- Implementation Framework:
- Transition from Static to Flow Conditions: Implement systems like BioFlux that enable culture, assay, and imaging of biofilms under shear flow conditions without compression artifacts [112].
- Throughput Considerations: While DIY shear flow systems typically handle 1-6 samples, modern microfluidic systems can provide 24 sequential experiment throughput while maintaining biological relevance [112].
- Standardization Benefits: Controlled flow systems eliminate "fluid bursts" that occur at peristaltic pump startup, which can cause undesired biofilm detachment and experimental variability [112].
Bridging the translational gap in anti-biofilm agent development requires multidisciplinary approaches that address the complexity of biofilm matrix diffusion barriers. By implementing the troubleshooting guides, experimental protocols, and conceptual frameworks outlined in this technical support document, researchers can enhance the predictive validity of their preclinical models and improve the success rate of clinical trials for anti-biofilm therapeutics. The integration of advanced model systems, including polymicrobial communities and flow environments, with standardized quantitative metrics will accelerate the development of effective strategies to overcome biofilm-mediated antibiotic resistance.
Conclusion
The biofilm matrix is not a static shield but a dynamic and multifunctional barrier that is central to the recalcitrance of chronic infections. Overcoming this defense requires a paradigm shift from traditional bactericidal approaches to strategies that specifically target the matrix's integrity and function. The convergence of matrix-degrading enzymes, nanoparticle delivery systems, and quorum-sensing inhibitors holds immense promise for restoring the efficacy of existing antibiotics. Future success in this field hinges on multidisciplinary collaboration, the development of biofilm-aware diagnostic tools, and clinical trial frameworks capable of evaluating complex, combination therapies. By dismantling the diffusion barrier, we can transform the treatment landscape for millions of patients affected by persistent biofilm-associated infections.
References
- 1. Biofilm Resilience: Molecular Mechanisms Driving Antibiotic ... [https://pmc.ncbi.nlm.nih.gov/articles/PMC11852148/]
- 2. Biofilms and their role in pathogenesis [https://www.immunology.org/public-information/bitesized-immunology/pathogens-disease/biofilms-and-their-role-pathogenesis]
- 3. Biofilms: Understanding the structure and contribution ... [https://www.sciencedirect.com/science/article/pii/S2590097823000095]
- 4. Strategies for combating antibiotic resistance in bacterial ... [https://www.frontiersin.org/journals/cellular-and-infection-microbiology/articles/10.3389/fcimb.2024.1352273/full]
- 5. How to study biofilms: technological advancements in ... [https://www.frontiersin.org/journals/cellular-and-infection-microbiology/articles/10.3389/fcimb.2023.1335389/full]
- 6. The biofilm life cycle– expanding the conceptual model of ... [https://pmc.ncbi.nlm.nih.gov/articles/PMC9841534/]
- 7. Strategies for combating bacterial biofilms: A focus on anti ... [https://pmc.ncbi.nlm.nih.gov/articles/PMC5955472/]
- 8. ASM Conference on Biofilms | Scientific Program [https://asm.org/events/asm-biofilms/scientific-program]
- 9. The Role of Bacterial Biofilm in Antibiotic Resistance and ... [https://pmc.ncbi.nlm.nih.gov/articles/PMC7468660/]
- 10. The EPS Matrix: The “House of Biofilm Cells” - PMC [https://pmc.ncbi.nlm.nih.gov/articles/PMC2168682/]
- 11. Extracellular polymeric substance [https://en.wikipedia.org/wiki/Extracellular_polymeric_substance]
- 12. Detection techniques for extracellular polymeric substances in ... [https://bioresources.cnr.ncsu.edu/resources/detection-techniques-for-extracellular-polymeric-substances-in-biofilms-a-review/]
- 13. Extracellular polymeric substances, a key element in ... [https://pmc.ncbi.nlm.nih.gov/articles/PMC6604936/]
- 14. Innovative Strategies Toward the Disassembly of the EPS ... [https://pmc.ncbi.nlm.nih.gov/articles/PMC7264105/]
- 15. Contemporary strategies and approaches for ... [https://pmc.ncbi.nlm.nih.gov/articles/PMC11022105/]
- 16. Extracellular polymeric substances—antibiotics interaction ... [https://pmc.ncbi.nlm.nih.gov/articles/PMC9678949/]
- 17. Extracellular Polymeric Substances Acting as a Permeable ... [https://www.frontiersin.org/journals/microbiology/articles/10.3389/fmicb.2019.00736/full]
- 18. Microbial biofilm: formation, architecture, antibiotic resistance ... [https://pmc.ncbi.nlm.nih.gov/articles/PMC8578483/]
- 19. Mechanisms of antimicrobial resistance in biofilms - PMC [https://pmc.ncbi.nlm.nih.gov/articles/PMC11445061/]
- 20. The Role of Bacterial Biofilms in Antimicrobial Resistance [https://asm.org/articles/2023/march/the-role-of-bacterial-biofilms-in-antimicrobial-re]
- 21. Antibiotic resistance of bacterial biofilms [https://pubmed.ncbi.nlm.nih.gov/20149602/]
- 22. Comparative Analysis of Biofilm Formation and Antibiotic ... [https://pmc.ncbi.nlm.nih.gov/articles/PMC12382965/]
- 23. Mechanisms of antimicrobial resistance in biofilms [https://www.nature.com/articles/s44259-024-00046-3]
- 24. Effect of biofilm physical characteristics on their ... [https://www.nature.com/articles/s41522-024-00544-2]
- 25. A guide to publishing in Biofilm: how to avoid a desk rejection [https://pmc.ncbi.nlm.nih.gov/articles/PMC12206335/]
- 26. Understanding bacterial biofilms: From definition to treatment ... [https://pmc.ncbi.nlm.nih.gov/articles/PMC10117668/]
- 27. Biofilm-dispersal patterns in ESKAPE pathogens [https://ui.adsabs.harvard.edu/abs/2025ArMic.207..194S/abstract]
- 28. Restriction of growth and biofilm formation of ESKAPE ... [https://www.frontiersin.org/journals/microbiology/articles/10.3389/fmicb.2024.1428808/full]
- 29. Mechanistic In-Silico Insights into the Anti-quorum Sensing ... [https://pmc.ncbi.nlm.nih.gov/articles/PMC12594671/]
- 30. In Silico Modeling of Biofilm Formation by Nontypeable ... [https://pmc.ncbi.nlm.nih.gov/articles/PMC6669334/]
- 31. Frontiers | Enhancing antibiotic therapy through comprehensive... [https://www.frontiersin.org/journals/cellular-and-infection-microbiology/articles/10.3389/fcimb.2025.1521091/full]
- 32. [ In for the study of the concentration vitro of model ... kinetics antibiotic [https://pubmed.ncbi.nlm.nih.gov/3541460/]
- 33. for the Study of In Activities | SpringerLink Vitro Models Antibiotic [https://link.springer.com/chapter/10.1007/978-3-0348-9289-6_11]
- 34. In vitro models for studying implant-associated biofilms [https://www.sciencedirect.com/science/article/pii/S0142961224001121]
- 35. Action and resistance mechanisms of antibiotics: A guide ... [https://pmc.ncbi.nlm.nih.gov/articles/PMC5672523/]
- 36. In-silico and in-vitro study of novel antimicrobial peptide ... [https://www.nature.com/articles/s41598-024-76553-0]
- 37. Molecular imaging of bacterial biofilms —a systematic review - PMC [https://pmc.ncbi.nlm.nih.gov/articles/PMC11523921/]
- 38. Video: Correlative Optical Spectroscopy and Mass Spectrometry... [https://www.jove.com/v/67383/correlative-optical-spectroscopy-mass-spectrometry-imaging]
- 39. Harnessing machine learning to predict antibiotic ... [https://www.nature.com/articles/s41522-025-00833-4]
- 40. Comparative analysis of biofilm detection methods and ... [https://pmc.ncbi.nlm.nih.gov/articles/PMC12625357/]
- 41. Biofilms as Promoters of Bacterial Antibiotic Resistance ... [https://pmc.ncbi.nlm.nih.gov/articles/PMC7822488/]
- 42. Detecting Excess Biofilm Thickness in Microbial ... [https://pmc.ncbi.nlm.nih.gov/articles/PMC12235218/]
- 43. Precise biofilm thickness prediction in SWRO desalination ... [https://www.nature.com/articles/s41545-025-00451-9]
- 44. Integrating optical coherence tomography and ... [https://pubmed.ncbi.nlm.nih.gov/40994685/]
- 45. Theoretical aspects of antibiotic diffusion into microbial ... [https://pubmed.ncbi.nlm.nih.gov/8913456/]
- 46. Biofilm Thickness and Its Real-Time Impact [https://www.solenis.com/en/resources/blog/biofilm-thickness-and-its-real-time-impact/]
- 47. Analysis of biofilm assembly by large area automated AFM [https://www.nature.com/articles/s41522-025-00704-y]
- 48. Accurate and non-invasive monitoring of biofilms in ... [https://chemrxiv.org/engage/chemrxiv/article-details/68a4714ba94eede1547cb3bf]
- 49. Biofilm Resilience: Molecular Mechanisms Driving ... [https://www.mdpi.com/2079-7737/14/2/165]
- 50. PMC - PubMed Central [https://pmc.ncbi.nlm.nih.gov/articles/PMC12024424/]
- 51. Discovery of Biofilm-Inhibiting Compounds to Enhance ... [https://www.mdpi.com/1424-8247/18/2/225]
- 52. Imaging Flow Cytometry to Study Biofilm-Associated ... [https://pmc.ncbi.nlm.nih.gov/articles/PMC8659131/]
- 53. Data Mining and Computational Modeling of High ... [https://pmc.ncbi.nlm.nih.gov/articles/PMC6181121/]
- 54. Quantitative Assessment of Bacterial Growth Phase ... [https://pmc.ncbi.nlm.nih.gov/articles/PMC6957528/]
- 55. High-Throughput Screening | Genedata Screener [https://www.genedata.com/platform/screener/applications/high-throughput-screening]
- 56. Biofilms and multidrug resistance: an emerging crisis and the ... [https://pmc.ncbi.nlm.nih.gov/articles/PMC12237878/]
- 57. biofilms, quorum sensing, formation and prevention [https://pmc.ncbi.nlm.nih.gov/articles/PMC7086079/]
- 58. Quorum-Sensing Regulation of Antimicrobial Resistance in ... [https://pmc.ncbi.nlm.nih.gov/articles/PMC7143945/]
- 59. Understanding Quorum-Sensing and Biofilm Forming in ... [https://www.mdpi.com/1422-0067/25/23/12808]
- 60. Can Biofilm Be Reversed Through Quorum Sensing in ... [https://www.frontiersin.org/journals/microbiology/articles/10.3389/fmicb.2019.01582/full]
- 61. Quorum sensing regulation of Psl polysaccharide production ... [https://pubmed.ncbi.nlm.nih.gov/39530727/]
- 62. It is the time for quorum sensing inhibition as alternative ... [https://biosignaling.biomedcentral.com/articles/10.1186/s12964-023-01154-9]
- 63. Biofilm, resistance, and quorum sensing: The triple threat in ... [https://www.sciencedirect.com/science/article/pii/S2950194625003462]
- 64. Quorum-sensing control of matrix protein production drives ... [https://www.nature.com/articles/s41467-022-33816-6]
- 65. Understanding the Mechanism of Bacterial Biofilms ... [https://pmc.ncbi.nlm.nih.gov/articles/PMC5427689/]
- 66. Strategy to combat biofilms: a focus on biofilm dispersal ... [https://www.nature.com/articles/s41522-023-00427-y]
- 67. Microbial enzymes as powerful natural anti-biofilm candidates [https://microbialcellfactories.biomedcentral.com/articles/10.1186/s12934-024-02610-y]
- 68. Aggregatibacter actinomycetemcomitans Dispersin B [https://pmc.ncbi.nlm.nih.gov/articles/PMC11357414/]
- 69. Enhancing the destruction of Burkholderia cepacia biofilm ... [https://www.frontiersin.org/journals/cellular-and-infection-microbiology/articles/10.3389/fcimb.2025.1662291/full]
- 70. A Rational Designed PslG With Normal Biofilm Hydrolysis ... [https://www.frontiersin.org/journals/microbiology/articles/10.3389/fmicb.2020.00760/full]
- 71. How to study biofilms: technological advancements in clinical ... [https://pmc.ncbi.nlm.nih.gov/articles/PMC10753778/]
- 72. Standardized Biofilm Methods Laboratory (SBML) [https://biofilm.montana.edu/research-program/standardized_biofilm_methods_lab.html]
- 73. ESCMID guideline for the diagnosis and treatment of ... [https://www.sciencedirect.com/science/article/pii/S1198743X14000901]
- 74. Antibiotic adjuvants: synergistic tool to combat multi-drug ... [https://pmc.ncbi.nlm.nih.gov/articles/PMC10765517/]
- 75. Antibiotic potentiators as a promising strategy for ... [https://www.nature.com/articles/s44259-025-00112-4]
- 76. Antibiotic Potentiators Against Multidrug-Resistant Bacteria [https://www.frontiersin.org/journals/microbiology/articles/10.3389/fmicb.2022.887251/full]
- 77. Growing and Analyzing Static Biofilms - PMC [https://pmc.ncbi.nlm.nih.gov/articles/PMC4568995/]
- 78. 5.2.1. Evaluating the Biofilm Matrix [https://bio-protocol.org/bio101/r9061198?utm_source=miniprotocol]
- 79. Advances in Nanotechnology-Based Drug Delivery Systems [https://pmc.ncbi.nlm.nih.gov/articles/PMC12389492/]
- 80. Developments in nanotechnology approaches for the ... [https://ehoonline.biomedcentral.com/articles/10.1186/s40164-025-00656-1]
- 81. Engineering precision nanoparticles for drug delivery [https://www.nature.com/articles/s41573-020-0090-8]
- 82. Targeted and intelligent nano-drug delivery systems for ... [https://www.frontiersin.org/journals/bioengineering-and-biotechnology/articles/10.3389/fbioe.2025.1582659/full]
- 83. Population-Level Dynamics and Community-Mediated ... [https://pmc.ncbi.nlm.nih.gov/articles/PMC12467774/]
- 84. Mechanistic insights and therapeutic innovations in engineered nanomaterial-driven disruption of biofilm dynamics - RSC Advances (RSC Publishing) DOI:10.1039/D5RA01711D [https://pubs.rsc.org/en/content/articlehtml/2025/ra/d5ra01711d]
- 85. Busting biofilms with ultrasonic microbubbles [https://www.drugdiscoverynews.com/busting-biofilms-with-ultrasonic-microbubbles-16017]
- 86. Ultrasonic strategies for mitigating microbial adhesion and ... [https://www.frontiersin.org/journals/microbiology/articles/10.3389/fmicb.2025.1558035/full]
- 87. Electrochemical biofilm control: A review - PMC [https://pmc.ncbi.nlm.nih.gov/articles/PMC4668948/]
- 88. Phage therapy as a revitalized weapon for treating clinical diseases [https://www.oaepublish.com/articles/mrr.2025.31]
- 89. Phage Therapy: From Biologic Mechanisms to Future Directions - PMC [https://pmc.ncbi.nlm.nih.gov/articles/PMC9827498/]
- 90. Researchers develop new method to combat antibiotic ... [https://www.news-medical.net/news/20251119/Researchers-develop-new-method-to-combat-antibiotic-resistant-bacteria-using-bacteriophages.aspx]
- 91. Ultrasound‐mediated therapies for the treatment of biofilms ... [https://pmc.ncbi.nlm.nih.gov/articles/PMC7111087/]
- 92. New frontiers against antibiotic resistance - PMC [https://pmc.ncbi.nlm.nih.gov/articles/PMC11925186/]
- 93. Drug combinations targeting antibiotic resistance [https://www.nature.com/articles/s44259-024-00047-2]
- 94. RESOURCES | About Biofilm Infections [https://microgendx.com/biofilm-research/]
- 95. An Overview of Biological and Computational Methods for ... [https://www.frontiersin.org/journals/microbiology/articles/10.3389/fmicb.2021.640787/full]
- 96. Answering 4 Big Questions on Biofilms - Biomiq [https://biomiq.health/blogs/blog/answering-4-big-questions-on-biofilms?srsltid=AfmBOorxhKp3UF7JWtNVwpscLhR5DhWOODE4pb-uOtvdEcotBUeQy3xw]
- 97. Measuring Antimicrobial Efficacy against Biofilms: a Meta- ... [https://pmc.ncbi.nlm.nih.gov/articles/PMC6496104/]
- 98. Development, standardization, and validation of a biofilm ... [https://www.sciencedirect.com/science/article/abs/pii/S0167701219303896]
- 99. Recent Strategies to Combat Biofilms Using Antimicrobial ... [https://pmc.ncbi.nlm.nih.gov/articles/PMC8955104/]
- 100. Natural Anti-biofilm Agents: Strategies to Control ... [https://www.frontiersin.org/journals/microbiology/articles/10.3389/fmicb.2020.566325/full]
- 101. Combination drug strategies for biofilm eradication using ... [https://pmc.ncbi.nlm.nih.gov/articles/PMC10149696/]
- 102. Overcoming the drug resistance barrier: progress in ... [https://www.frontiersin.org/journals/microbiology/articles/10.3389/fmicb.2025.1702881/full]
- 103. Unraveling resistance mechanisms in combination therapy [https://www.sciencedirect.com/science/article/pii/S2405844024040155]
- 104. The Global Challenge of Antimicrobial Resistance [https://pmc.ncbi.nlm.nih.gov/articles/PMC12284435/]
- 105. Polymicrobial Biofilms: Interkingdom Interactions, Resistance ... [https://pmc.ncbi.nlm.nih.gov/articles/PMC12373980/]
- 106. Polymicrobial biofilms of ocular bacteria and fungi on ex ... [https://www.nature.com/articles/s41598-022-15809-z]
- 107. Answering 4 Big Questions on Biofilms - Biomiq [https://biomiq.health/blogs/blog/answering-4-big-questions-on-biofilms?srsltid=AfmBOoq1Y9WT78b8n3k3eDoZgqn5f7orARiacjbDw1GwdfGi85rC_hy9]
- 108. Biofilm Dispersal: Mechanisms, Clinical Implications, and ... [https://pmc.ncbi.nlm.nih.gov/articles/PMC3318030/]
- 109. A Foundation Model Identifies Broad-Spectrum ... [https://www.nature.com/articles/s41467-024-51933-2]
- 110. Translational challenges and opportunities in biofilm science [https://www.nature.com/articles/s41522-022-00327-7]
- 111. Antibiotics with antibiofilm activity – rifampicin and beyond [https://www.frontiersin.org/journals/microbiology/articles/10.3389/fmicb.2024.1435720/full]
- 112. How the experts are overcoming obstacles in biofilm ... [https://cellmicrosystems.com/blog/experts-overcoming-obstacles-in-biofilms/]
- 113. Breaking the barrier: disruption of bacterial biofilms using ... [https://www.frontiersin.org/journals/cellular-and-infection-microbiology/articles/10.3389/fcimb.2025.1670237/full]
- 114. Fluorescence-based protocol for revealing cellular ... [https://pmc.ncbi.nlm.nih.gov/articles/PMC10165451/]