Traditional vs. Molecular AST Methods: A Comprehensive Guide for Research and Diagnostic Applications
This article provides a comparative analysis of traditional phenotypic and modern molecular Antimicrobial Susceptibility Testing (AST) methods for researchers, scientists, and drug development professionals.
Traditional vs. Molecular AST Methods: A Comprehensive Guide for Research and Diagnostic Applications
Abstract
This article provides a comparative analysis of traditional phenotypic and modern molecular Antimicrobial Susceptibility Testing (AST) methods for researchers, scientists, and drug development professionals. It explores the foundational principles of established techniques like disk diffusion and broth microdilution, alongside emerging methods such as next-generation sequencing, microfluidics, and automated platforms. The content details practical applications, troubleshooting for common implementation barriers, and frameworks for clinical validation. By synthesizing current evidence and future trends, this guide aims to inform strategic decisions in AST methodology for both clinical diagnostics and antimicrobial drug development.
The Bedrock of AST: Understanding Traditional Phenotypic Methods and the Molecular Revolution
Core Principles of Conventional Phenotypic AST
Conventional phenotypic antimicrobial susceptibility testing (AST) represents a cornerstone of clinical microbiology, providing an empirical measure of a pathogen's response to antimicrobial agents in vitro. These methods directly observe the effect of antibiotics on bacterial growth, offering a functional profile of susceptibility or resistance that guides therapeutic decisions [1] [2]. Despite the emergence of molecular techniques, conventional phenotypic methods remain the gold standard against which new technologies are validated, forming an indispensable component of both routine clinical practice and antimicrobial resistance research [1] [3]. The fundamental principle underpinning these methods is the determination of the minimum inhibitory concentration (MIC)—the lowest concentration of an antimicrobial agent that prevents visible growth of a microorganism [2]. This quantitative measurement serves as the basis for categorizing isolates as susceptible (S), intermediate (I), or resistant (R) according to established breakpoints from standards organizations such as the Clinical and Laboratory Standards Institute (CLSI) and the European Committee on Antimicrobial Susceptibility Testing (EUCAST) [1].
The continued relevance of conventional phenotypic AST in an era of advancing technology stems from its ability to detect resistance regardless of genetic mechanism, including previously unidentified resistance patterns [1]. This comprehensive phenotypic profiling is crucial for effective antimicrobial stewardship, surveillance of emerging resistance trends, and validation of genotypic resistance detection methods [2]. This guide examines the core principles, methodologies, and performance characteristics of conventional phenotypic AST systems, providing researchers and drug development professionals with a foundation for evaluating their application in both clinical and research contexts.
Fundamental Methodologies and Principles
Conventional phenotypic AST encompasses several well-established techniques, each with distinct procedural approaches but shared fundamental principles. The three primary methods—disk diffusion, broth dilution, and agar dilution—all rely on measuring the interaction between antimicrobial agents and bacterial cells under standardized conditions to generate reproducible susceptibility profiles [1] [2].
Disk Diffusion Method
The disk diffusion method, also known as the Kirby-Bauer test, is one of the most widely used phenotypic AST techniques due to its simplicity, cost-effectiveness, and flexibility [1]. The methodology involves applying a standardized inoculum of the test microorganism to the surface of an agar plate, followed by placement of paper disks impregnated with specific concentrations of antimicrobial agents [1] [2]. After overnight incubation (typically 16-24 hours), the diameter of the zone of inhibition around each disk is measured in millimeters. This zone size correlates inversely with the MIC and is interpreted using established breakpoint tables to categorize the organism as susceptible, intermediate, or resistant to each antimicrobial agent [1].
Key advantages of disk diffusion include its ability to test multiple antibiotics simultaneously on a single plate, minimal equipment requirements, and cost efficiency for low-volume laboratories [1]. However, the method only provides qualitative or semi-quantitative results (categorical interpretations rather than precise MIC values) and requires strict adherence to standardized protocols for reliable results [1] [2].
Broth Dilution Methods
Broth dilution methods provide quantitative MIC values through a series of antimicrobial concentrations prepared in liquid growth media [2]. In macrobroth dilution, antibiotics are serially diluted in test tubes containing a standardized bacterial inoculum [1]. After incubation, the lowest concentration showing no visible growth is identified as the MIC. Microbroth dilution adapts this principle to microtiter plates, enabling high-throughput testing of multiple organism-antibiotic combinations simultaneously [1] [2]. The miniaturized format reduces reagent consumption and labor while maintaining accuracy, making it suitable for both clinical and research applications [2].
Broth dilution methods are particularly valuable for determining precise MIC values needed for treatment individualization, research studies, and establishing epidemiological cut-off values [1]. The methodology forms the basis for many automated AST systems and serves as the reference method for validating other AST techniques according to international standards [2].
Agar Dilution Method
The agar dilution method incorporates antimicrobial agents directly into the agar medium at predetermined doubling dilutions [2]. A standardized inoculum of test organisms is applied to the antibiotic-containing plates, typically using multi-point inoculators that enable efficient testing of multiple isolates against a single antibiotic concentration [1]. After incubation, the MIC is defined as the lowest antibiotic concentration that completely inhibits visible growth, with a faint haze or single colony being disregarded [2].
This method offers excellent reproducibility and is particularly efficient for testing large numbers of bacterial isolates against a limited panel of antibiotics [1]. It remains the recommended method for AST of fastidious organisms such as Helicobacter pylori and anaerobic bacteria, for which broth-based methods may not provide reliable results [2]. However, agar dilution is labor-intensive for testing single isolates against multiple antibiotics and requires preparation of numerous plates, making it less suitable for routine testing of individual clinical isolates [1].
The following diagram illustrates the generalized workflow common to these conventional phenotypic AST methods:
Performance Comparison of Conventional and Automated Phenotypic AST Systems
While manual methods remain in widespread use, automated systems have significantly improved the efficiency of phenotypic AST in clinical laboratories. The following table compares the performance characteristics of conventional methods with representative automated and rapid phenotypic systems:
Table 1: Performance comparison of antimicrobial susceptibility testing methods
| Method | Time to Result | Key Advantages | Key Limitations | Applications |
|---|---|---|---|---|
| Disk Diffusion [1] | 16-24 hours after isolation | Cost-effective, flexible, multiple drugs per plate | Qualitative/semi-quantitative only, labor-intensive | Routine clinical testing, epidemiological studies |
| Broth Microdilution [1] [2] | 16-24 hours after isolation | Quantitative MIC, reference method, suitable for fastidious organisms | Labor-intensive, requires precise preparation | Reference testing, research, fastidious organisms |
| Agar Dilution [1] [2] | 16-24 hours after isolation | Efficient for multiple isolates, excellent reproducibility | Not efficient for single isolates, labor-intensive | Large-scale screening, fastidious organisms |
| Selux DX System [4] | Average 5.5 hours after isolation | Rapid, automated, quantitative MIC | Longer setup time, higher cost | Rapid clinical testing, stewardship programs |
| LifeScale System [5] | 4-6 hours directly from positive blood culture | Direct from blood culture, measures bacterial mass | Limited database, primarily Gram-negative rods | Rapid bacteremia testing, critical care settings |
Recent evaluations of rapid phenotypic systems demonstrate significant advances in testing speed while maintaining acceptable performance compared to reference methods. A 2025 study of the Selux DX system reported ≥90% categorical agreement for most drug-organism combinations with an average turnaround time of 5.5 hours—substantially faster than conventional methods requiring 16-24 hours [4]. Similarly, the LifeScale system achieved AST results directly from positive blood cultures in less than 5 hours by utilizing microfluidic sensors with mechanical resonators that measure the mass of individual microbes [5].
Despite these advances, conventional methods maintain certain advantages, particularly for specialized applications. Disk diffusion remains unsurpassed for testing novel antimicrobial agents not yet incorporated into commercial panels, while broth and agar dilution provide definitive MIC values essential for establishing interpretive criteria and validating new methods [1] [2]. The choice of methodology therefore depends on the specific application, required turnaround time, available resources, and intended use of the results.
Experimental Protocols and Methodological Details
Standardized Disk Diffusion Protocol
The reliability of conventional phenotypic AST depends on strict adherence to standardized methodologies. The following protocol for disk diffusion testing follows CLSI and EUCAST guidelines [1]:
Inoculum Preparation: Select 3-5 well-isolated colonies of similar morphology from an overnight agar plate. Emulsify in sterile saline or broth to achieve a turbidity equivalent to a 0.5 McFarland standard (approximately 1-2 × 10^8 CFU/mL for most organisms) [1].
Inoculation: Within 15 minutes of standardization, dip a sterile cotton swab into the inoculum suspension. Express excess fluid by rotating the swab against the inside of the tube. Streak the entire surface of a Mueller-Hinton agar plate three times, rotating approximately 60° between streaks to ensure even distribution [1].
Disk Application: Allow inoculated plates to stand at room temperature for 3-15 minutes before applying antibiotic disks. Using sterile forceps or an automated dispenser, place disks firmly onto the agar surface to ensure complete contact. Place disks no closer than 24 mm from center to center [1].
Incubation: Invert plates and incubate at 35±2°C in an ambient air incubator for 16-24 hours. Incubate Staphylococcus aureus and Enterococcus faecalis for a full 24 hours when testing for oxacillin and vancomycin resistance, respectively [1].
Reading and Interpretation: After incubation, measure the diameter of each zone of inhibition to the nearest millimeter using calipers or an automated reading system. Compare measurements to current CLSI or EUCAST breakpoint tables to categorize isolates as susceptible, intermediate, or resistant [1].
Broth Microdilution Reference Method
As the reference standard for MIC determination, broth microdilution requires meticulous attention to technical details [2]:
Panel Preparation: Prepare antimicrobial agents in cation-adjusted Mueller-Hinton broth at twice the desired final concentration. Dispense 100 μL volumes into wells of sterile microdilution trays. Include growth control (no antibiotic) and sterility control (no inoculum) wells in each tray [2].
Inoculum Standardization: Adjust the turbidity of a log-phase broth culture or saline suspension of colonies to match a 0.5 McFarland standard. Further dilute the suspension 1:150 in broth to achieve a final inoculum of approximately 5 × 10^5 CFU/mL [2].
Inoculation: Add 100 μL of the standardized inoculum to each well of the microdilution tray, resulting in a 1:1 dilution of the antibiotic and the final target inoculum of 5 × 10^5 CFU/mL. Seal trays to prevent evaporation during incubation [2].
Incubation: Incubate trays at 35±2°C for 16-24 hours in an ambient air incubator. Certain fastidious organisms may require extended incubation or supplemented media [2].
Reading Endpoints: Examine trays for visible growth after incubation. The MIC is the lowest concentration of antimicrobial agent that completely inhibits visible growth. Note that a small button of growth at the bottom of the well or slight haziness should be considered as no growth for tetracyclines and sulfonamides, which exhibit partial inhibition [2].
The Scientist's Toolkit: Essential Research Reagents and Materials
Successful implementation of conventional phenotypic AST requires carefully controlled materials and reagents. The following table details essential components of the AST research toolkit:
Table 2: Essential research reagents and materials for conventional phenotypic AST
| Reagent/Material | Function | Specification Requirements |
|---|---|---|
| Mueller-Hinton Agar [1] | Growth medium for disk diffusion and agar dilution | pH 7.2-7.4; calcium 20-25 mg/L; magnesium 10-12.5 mg/L; thymidine content <0.03 μg/mL |
| Cation-Adjusted Mueller-Hinton Broth [1] [2] | Liquid medium for broth dilution methods | Calcium 20-25 mg/L; magnesium 10-12.5 mg/L |
| Antimicrobial Powder/Disks [1] | Active pharmaceutical ingredients | Known potency and purity; stored according to manufacturer specifications |
| McFarland Standards [1] | Inoculum density standardization | 0.5 McFarland (1.5 × 10^8 CFU/mL); verified periodically by quantitative colony counts |
| Quality Control Strains [1] [2] | Method verification | American Type Culture Collection (ATCC) strains with defined susceptibility profiles (e.g., E. coli ATCC 25922, S. aureus ATCC 29213) |
Quality control represents an essential component of reliable AST, requiring daily testing of QC strains when performing patient testing and each time a new lot of reagents or media is put into use [1] [2]. Results for QC strains must fall within established ranges before patient or research results can be reported. Additionally, proper storage of antimicrobial agents—particularly frozen stocks of powders and prepared solutions—is critical for maintaining stability and potency [1].
Conventional phenotypic AST methods continue to provide the foundation for antimicrobial susceptibility testing despite decades of technological advancement. Their enduring value lies in their comprehensive detection of resistance mechanisms—whether genetically mediated or expressed phenotypically—without requiring prior knowledge of underlying genetic determinants [1] [2]. While automated and rapid systems offer significant advantages in turnaround time, conventional methods remain essential for reference testing, method validation, and specialized applications [4] [5].
For researchers and drug development professionals, understanding the principles, performance characteristics, and methodological details of conventional phenotypic AST is crucial for designing robust studies, interpreting susceptibility data, and validating novel diagnostic approaches. These methods provide the evidentiary foundation for establishing interpretive criteria for new antimicrobial agents and tracking the evolution of resistance patterns over time [1] [2]. As the global threat of antimicrobial resistance continues to escalate, conventional phenotypic AST will maintain its central role in both clinical management and public health surveillance of resistant infections.
In the ongoing global battle against antimicrobial resistance (AMR), the ability to accurately determine a pathogen's susceptibility to antibiotics is a cornerstone of effective treatment and antimicrobial stewardship. While molecular methods are rapidly advancing, phenotypic Antimicrobial Susceptibility Testing (AST) remains the definitive reference for assessing how a bacterium will respond to a drug in a clinical setting [6]. Among these phenotypic methods, three techniques are widely regarded as gold standards: disk diffusion, broth microdilution, and the E-test. These methods provide the critical data that guide therapeutic decisions, from the community clinic to the intensive care unit.
The continued relevance of these techniques is underscored by the limitations of genotypic approaches. As one review notes, "a carbapenemase gene is identifiable in fewer than 50% of bacteria found to be phenotypically carbapenem resistant" [7]. This highlights the indispensable role of phenotypic methods in capturing the complex expression of resistance, regardless of the underlying genetic mechanism. This guide provides a detailed, objective comparison of these three foundational AST methods, framing them within the broader context of traditional versus molecular AST research for an audience of scientists, researchers, and drug development professionals.
Methodological Principles and Experimental Protocols
Disk Diffusion (Kirby-Bauer Test)
Principle: This method assesses bacterial susceptibility by measuring the zone of inhibition around an antibiotic-impregnated disk on an agar surface. The diameter of the zone, where bacterial growth has been prevented, is inversely correlated with the Minimum Inhibitory Concentration (MIC) of the antibiotic [8].
Detailed Experimental Protocol:
- Inoculum Preparation: A standardized inoculum of the bacterial isolate is prepared, typically to a turbidity of 0.5 McFarland standard (approximately 1-2 x 10^8 CFU/mL for Enterobacterales) [8].
- Inoculation: The surface of a Mueller-Hinton agar plate is uniformly inoculated with the bacterial suspension using a sterile cotton swab.
- Disk Application: Antibiotic-impregnated paper disks are aseptically placed on the inoculated agar surface.
- Incubation: Plates are inverted and incubated at 35±2°C for 16-24 hours under ambient air.
- Reading and Interpretation: After incubation, the diameter of the complete inhibition zone is measured to the nearest millimeter. The results are interpreted as Susceptible (S), Intermediate (I), or Resistant (R) based on guidelines published by the Clinical and Laboratory Standards Institute (CLSI) or the European Committee on Antimicrobial Susceptibility Testing (EUCAST) [8].
Broth Microdilution
Principle: This dilution-based method determines the Minimum Inhibitory Concentration (MIC) – the lowest concentration of an antimicrobial agent that prevents visible growth of a microorganism. It involves incubating a standardized bacterial inoculum in a series of wells containing doubling dilutions of an antibiotic [9].
Detailed Experimental Protocol:
- Panel Preparation: A microtiter plate with pre-dispensed, serial two-fold dilutions of antibiotics is used. These can be prepared in-house or purchased commercially.
- Inoculum Preparation: A bacterial suspension is adjusted to a standard turbidity (0.5 McFarland) and then further diluted in broth medium (e.g., Mueller-Hinton broth) to achieve a final inoculum of approximately 5 x 10^5 CFU/mL in each well [9].
- Inoculation: Each well of the panel is inoculated with the standardized bacterial suspension.
- Incubation: The panel is covered and incubated at 35±2°C for 16-24 hours.
- Reading and Interpretation: The MIC is read as the lowest concentration of antibiotic that completely inhibits visible growth. The MIC value is then categorized as S, I, or R using appropriate clinical breakpoints [10].
Gradient Diffusion (E-Test)
Principle: The E-test combines elements of both diffusion and dilution principles. A predefined, stable, and continuous exponential gradient of an antibiotic is immobilized on a plastic strip. When placed on an inoculated agar plate, the antibiotic is released immediately, creating a gradient of concentrations in the agar. The MIC is read where the ellipse of inhibition intersects the strip [11].
Detailed Experimental Protocol:
- Inoculum Preparation and Inoculation: This step is identical to the disk diffusion method. An agar plate is inoculated with a standardized bacterial suspension.
- Strip Application: The E-test strip, labeled with a concentration scale, is placed onto the inoculated agar surface with the antibiotic gradient facing downward.
- Incubation: The plate is inverted and incubated at 35±2°C for 16-24 hours.
- Reading and Interpretation: After incubation, the MIC is read directly from the scale on the strip at the point where the edge of the inhibition ellipse intersects it [11].
Comparative Performance Analysis
The following tables summarize the key characteristics and performance data of the three gold standard methods, synthesizing information from comparative studies and reviews.
Table 1: Key Characteristics and Performance Metrics of Gold Standard AST Methods
| Feature | Disk Diffusion | Broth Microdilution | E-Test |
|---|---|---|---|
| Principle | Diffusion-based [8] | Dilution-based [9] | Gradient diffusion [11] |
| Result Output | Qualitative (S/I/R) [8] | Quantitative (MIC) [9] | Quantitative (MIC) [11] |
| Turnaround Time | 16-24 hours [8] | 16-24 hours [9] | 16-24 hours [11] |
| Approx. Cost per Test | $2 - $5 [8] | Higher (commercial panels) | Higher (commercial strips) |
| Ease of Use | Simple, no specialized equipment needed [8] | Moderate, can be automated | Simple, no specialized equipment needed |
| Throughput | High | High (especially with automation) | Low to moderate (suitable for single agents/isolates) |
| Key Advantage | Cost-effective, flexible, good for screening [8] | Reference quantitative method, high throughput [9] [10] | Provides MIC directly from agar-based testing [11] |
| Key Limitation | Does not provide an MIC [8] | Labor-intensive if manual, higher cost | More expensive per test, not ideal for high-throughput [11] |
Table 2: Experimental Performance Data from Comparative Studies
| Study Context | Disk Diffusion Performance | Broth Microdilution (Reference) | E-Test Performance |
|---|---|---|---|
| Detecting Vancomycin Resistance in Enterococci (Scandinavian Study) | Sensitivity: 93% (VME* rate: 7.0%); Specificity: 98% (ME rate: 2.4%) [12] | CLSI Agar Screen: Sensitivity: 93% (VME rate: 6.6%); Specificity: 94% (ME rate: 5.6%) [12] | Not tested in this study |
| Antifungal Susceptibility Testing for Aspergillus spp. | Poor correlation with broth microdilution [11] | Reference method (CLSI M38-A) [11] | Essential agreement* with BMD: 69-85% across antifungals [11] |
| Testing on Early Growth Isolates (for Gram-positive bacteria) | Demonstrated acceptable performance in previous reports [9] | For Enterococcus spp.: 6.8% minor error rate, 0.09% major error rate, no very major errors [9] | Not tested in this study |
*VME: Very Major Error (false susceptible); ME: Major Error (false resistant); *Essential Agreement: MIC within ±2 dilutions.
Essential Research Reagent Solutions
The successful execution of these gold standard methods relies on a suite of critical reagents and materials. The following table details these essential components and their functions in the AST workflow.
Table 3: Key Research Reagent Solutions for Gold Standard AST
| Reagent/Material | Function in AST | Key Considerations |
|---|---|---|
| Mueller-Hinton Agar/Broth | The standard medium for non-fastidious aerobic bacteria for both diffusion and dilution tests [12] [8]. | Must comply with CLSI/EUCAST specifications for cation concentration and pH. Performance can vary between manufacturers (e.g., BBL vs. Oxoid vs. Merck) [12]. |
| Antibiotic Disks | Impregnated with a defined amount of antibiotic for disk diffusion tests [8]. | Stability and storage conditions are critical. Disks must be from certified suppliers and used before expiration. |
| Broth Microdilution Panels | Plastic trays with pre-dispensed, serial dilutions of antibiotics for MIC determination [9]. | Available commercially (e.g., Thermo Fisher Sensititre) or can be custom-made. Essential for high-throughput, standardized testing. |
| E-Test Strips | Plastic strips with a predefined, continuous antibiotic gradient for MIC determination on agar [11]. | Available for a wide range of antibiotics and antifungal agents. More costly per test than disks. |
| Brain Heart Infusion (BHI) Agar | Used in specific screening methods, such as the CLSI agar screen for vancomycin-resistant enterococci (VRE) [12]. | The agar base must be carefully selected, as performance can differ (e.g., Difco BHI performed significantly better than Oxoid BHI in one study) [12]. |
| Standardized Inoculum Systems | (e.g., McFarland standards, turbidity meters, automated colony pickers) To ensure a precise and consistent bacterial inoculum for all methods [8]. | Inoculum density is a critical variable affecting the accuracy and reproducibility of zone sizes and MICs. |
Workflow Integration and Logical Pathways
The selection and application of each AST method depend on the specific laboratory context and requirements. The diagram below outlines the decision-making workflow for implementing these gold standard methods.
Discussion: Gold Standards in a Molecular World
The data clearly illustrate that disk diffusion, broth microdilution, and E-test each occupy a distinct and vital niche in the AST landscape. Disk diffusion remains unparalleled for its cost-efficiency and flexibility in routine susceptibility screening and resistance surveillance [8]. Broth microdilution stands as the definitive reference quantitative method, essential for confirming MICs, testing novel compounds, and generating high-quality data for drug development and epidemiological studies [9] [10]. The E-test elegantly bridges the gap between these two, offering the practicality of an agar-based test with the quantitative output of an MIC, making it particularly valuable for confirming resistance in specific isolates or for testing antibiotics not available in commercial panels [11].
The strengths of these phenotypic methods become most apparent when contrasted with molecular techniques. Phenotypic AST is "hypothesis-free," capturing the net effect of all resistance mechanisms—known, unknown, and combined—in a single result that directly predicts clinical response [7] [6]. This is a significant advantage over targeted molecular tests, which can only detect the specific resistance genes they are designed to find.
However, the 16-24 hour turnaround time inherent to these growth-dependent methods is a significant limitation in acute care settings. This has spurred innovations such as "early growth AST" (egAST), where isolates incubated for only 6 hours are used in broth microdilution systems, reducing turnaround time by up to 18 hours without significantly compromising accuracy [9]. Furthermore, the field is moving toward integration. Modern clinical microbiology increasingly relies on a synergistic approach: using rapid molecular or mass spectrometry tools for initial pathogen identification and resistance gene detection, while relying on phenotypic gold standards for definitive confirmation and to guide final therapeutic adjustments [13] [6].
Disk diffusion, broth microdilution, and E-test form an indispensable triad of phenotypic AST methods. Despite the exciting rise of molecular diagnostics, these techniques continue to provide the definitive measure of antimicrobial susceptibility, validating new genetic resistance findings and ensuring patient care is guided by biologically relevant data. For researchers and drug developers, a deep understanding of the principles, performance, and appropriate application of these gold standards is fundamental to advancing the fight against antimicrobial resistance. Their role in validating next-generation rapid technologies and ensuring the accuracy of antimicrobial efficacy data will remain critical for the foreseeable future.
Antimicrobial resistance (AMR) represents one of the most urgent global public health threats of the 21st century, with projections estimating up to 10 million annual deaths attributable to AMR by 2050 if rigorous measures are not implemented [2]. Antimicrobial Susceptibility Testing (AST) stands as a critical laboratory function for guiding appropriate antimicrobial therapy, tracking resistance trends, and informing stewardship interventions [2] [1]. For decades, conventional phenotypic methods—including disk diffusion, broth microdilution, and agar dilution—have constituted the cornerstone of AST in clinical microbiology laboratories, providing the reference standard against which all newer technologies are validated [2] [1]. These methods directly measure bacterial response to antimicrobial agents, delivering a phenotypic result that reflects the net effect of all resistance mechanisms present in the microorganism.
However, a significant paradigm shift is underway, moving from pure phenotypic analysis toward genotypic profiling. This molecular shift is driven by the protracted turnaround times (often up to 48-72 hours from specimen collection) inherent to traditional culture-based methods, which necessitate multiple cultivation steps to obtain pure isolates [2] [14] [15]. During this diagnostic window, clinicians must rely on empirical broad-spectrum antibiotic therapy, which contributes to the selection of resistant pathogens and unfavorable patient outcomes [15]. The emerging molecular arsenal offers the potential to dramatically compress this timeline, in some cases providing results within hours, thereby enabling more precise and timely therapeutic decisions [7] [14]. This guide objectively compares the performance of traditional phenotypic and molecular genotypic AST methods, providing the experimental data and context essential for researchers and drug development professionals navigating this evolving landscape.
Methodological Comparison: Foundational Principles and Performance Metrics
The fundamental distinction between phenotypic and genotypic AST methods lies in what they measure. Phenotypic methods assess the observable growth response of bacteria to antibiotics, typically determining the Minimum Inhibitory Concentration (MIC)—the lowest concentration of an antimicrobial that prevents visible growth [2] [1]. In contrast, genotypic methods detect specific genetic determinants known to confer resistance, such as resistance genes (e.g., mecA, bla genes for ESBLs, carbapenemases) or mutations [2] [16].
Table 1: Core Principles and Outputs of AST Methodologies
| Feature | Traditional Phenotypic Methods | Molecular Genotypic Methods |
|---|---|---|
| What is Measured | Bacterial growth inhibition in presence of antibiotic [1] | Presence of specific resistance genes or mutations [16] |
| Primary Output | Minimum Inhibitory Concentration (MIC), categorized as S/I/R [1] | Detection/identification of genetic resistance markers |
| Key Advantage | Functional assessment of resistance, regardless of mechanism [1] | Rapid turnaround time (hours) [14] |
| Key Limitation | Long turnaround time (often >24 hours after isolation) [2] | Detects only targeted, known mechanisms; may not equate to expression [2] |
Performance Data and Validation
The translation of these fundamental principles into laboratory practice yields significant differences in performance metrics. A comprehensive review of over 90 rapid AST technologies, including both phenotypic and genotypic platforms, highlighted that while innovation is robust, extensive validation is required before these methodologies can be fully integrated into routine clinical practice [7]. The following table summarizes critical performance characteristics based on current literature and technological assessments.
Table 2: Comparative Performance of AST Methodologies
| Performance Characteristic | Traditional Phenotypic | Molecular Genotypic |
|---|---|---|
| Typical Turnaround Time (from pure culture) | 16-24 hours (standard) / 6-8 hours (automated) [14] | 1-6 hours [2] |
| Mechanism Coverage | Comprehensive, hypothesis-free [1] | Limited to targeted probes/assays [2] |
| Essential Agreement with Reference BMD | Gold standard [2] | Variable; high for specific gene targets [16] |
| Capacity for Direct Specimen Testing | Challenging (inoculum, mixed cultures) [17] | Possible and increasingly implemented [17] [16] |
| Quantitative Result | Yes (MIC) [1] | Typically qualitative or semi-quantitative |
For specific pathogens, the performance of molecular methods is particularly notable. In Helicobacter pylori, for instance, molecular assays can detect point mutations associated with clarithromycin resistance (e.g., in the 23S rRNA gene) directly from gastric biopsies, providing a valuable tool for guiding eradication therapy [16]. However, a significant limitation is that genotypic methods may overestimate resistance if a resistance gene is detected but not expressed, or if the resistance is mediated by a novel or untargeted mechanism [2]. This is exemplified by the fact that a carbapenemase gene is identifiable in fewer than 50% of bacteria found to be phenotypically carbapenem resistant [7].
Experimental Protocols: A Closer Look at Key Techniques
Reference Phenotypic Method: Broth Microdilution
The Broth Microdilution (BMD) method is widely considered the reference standard for phenotypic AST against which all other methods are validated [2] [1].
Detailed Protocol:
- Inoculum Preparation: Several colonies of a pure, overnight bacterial culture are suspended in saline or broth to a turbidity equivalent to a 0.5 McFarland standard (~1-2 x 10^8 CFU/mL). This suspension is then further diluted in a standardized broth medium (e.g., Mueller-Hinton Broth) to achieve a final concentration of approximately 5 x 10^5 CFU/mL [1].
- Plate Setup: A microtiter plate is used, where each well contains a predefined, serial two-fold dilution of an antimicrobial agent in broth. One well serves as a growth control (no antibiotic), and another as a sterility control (no inoculum) [1].
- Inoculation and Incubation: Each well of the plate is inoculated with the standardized bacterial suspension. The plate is sealed and incubated under standardized conditions (35±2°C, ambient air) for 16-20 hours [1].
- Result Interpretation: The MIC is determined visually as the lowest concentration of antimicrobial that completely inhibits visible growth. This MIC value is then interpreted as Susceptible (S), Intermediate (I), or Resistant (R) using CLSI or EUCAST clinical breakpoints [1].
Genotypic Method: PCR-Based Detection of Resistance Genes
Protocols for detecting specific resistance genes, such as mecA in Staphylococcus aureus or carbapenemase genes in Enterobacterales, follow a general workflow that can be adapted for real-time or conventional PCR.
Detailed Protocol:
- Nucleic Acid Extraction: Bacterial cells from a pure colony or directly from a clinical specimen (e.g., positive blood culture broth) are lysed. DNA is then purified using a commercial extraction kit, which may be manual or automated [16].
- Primer and Probe Design: Sequence-specific oligonucleotide primers and, for quantitative real-time PCR (qPCR), fluorescently-labeled probes are designed to bind to unique, conserved regions of the target resistance gene(s). Multiplex panels can be designed to detect several genes simultaneously [14] [16].
- Amplification: The reaction mix containing the extracted DNA template, primers, probes, nucleotides, and a thermostable DNA polymerase is subjected to thermal cycling. In qPCR, the accumulation of the amplification product is monitored in real-time by measuring the fluorescence signal released from the probes [16].
- Result Analysis: The cycle threshold (Ct) value, which indicates the number of cycles required for the fluorescence signal to exceed a background level, is determined. A sample is considered positive for the target resistance gene if its Ct value falls below a validated cutoff, indicating successful amplification [16].
Signaling Pathways and Logical Workflows
The logical progression from a suspected infection to a definitive AST result differs significantly between conventional and modern workflows. The following diagram illustrates the critical path and timeframes for each approach, highlighting where time savings are achieved.
A key advantage of molecular methods is their ability to bypass the lengthy culture and isolation steps, directly interrogating the genetic material in a sample. The core principle of these methods relies on detecting specific sequences within known resistance mechanisms. The following diagram generalizes the molecular logic for detecting antibiotic resistance genes.
The Scientist's Toolkit: Essential Research Reagents and Materials
Implementing and researching AST methods, particularly molecular techniques, requires a suite of specialized reagents and materials. The following table details key components essential for experimental work in this field.
Table 3: Key Research Reagent Solutions for Molecular AST
| Item | Function/Brief Explanation | Example Application in AST |
|---|---|---|
| Nucleic Acid Extraction Kits | For lysing bacterial cells and purifying DNA/RNA from clinical specimens or bacterial colonies. | Preparation of template for PCR-based detection of resistance genes from positive blood cultures [14]. |
| PCR Master Mix | A pre-mixed solution containing thermostable DNA polymerase, dNTPs, MgCl₂, and reaction buffers. | Essential for amplifying target resistance genes (e.g., mecA, vanA, carbapenemase genes) in conventional or real-time PCR [16]. |
| Sequence-Specific Primers & Probes | Short, synthetic oligonucleotides designed to bind complementary to specific resistance gene sequences. | Enable specific amplification and detection of target genes. Hydrolysis (TaqMan) probes are common in qPCR for multiplexed assays [16]. |
| Positive Control DNA | Genomic DNA from a strain known to harbor the target resistance gene(s). | Critical for validating the performance of each PCR run and ensuring reagents are functioning correctly [16]. |
| Standardized Culture Media (e.g., Mueller-Hinton Agar/Broth) | Defined media that ensures reproducible and comparable growth of non-fastidious organisms for phenotypic AST. | Used as the foundation for reference methods like disk diffusion, agar dilution, and broth microdilution [1]. |
| Antimicrobial Powders/Disks | Pure, quantified antimicrobial agents for incorporation into agar or broth, or impregnated onto filter paper disks. | Used to create the concentration gradient or diffusion field required to determine MIC or zone diameter [1]. |
The molecular shift in AST represents a transformative advancement in clinical microbiology, offering unprecedented speed in detecting antimicrobial resistance. However, the transition from phenotype to genotype is not a simple replacement but an evolution toward a more integrated, nuanced diagnostic paradigm. While molecular methods provide exceptional speed and specificity for known targets, phenotypic methods retain the irreplaceable advantage of being a comprehensive, hypothesis-free assessment of bacterial behavior under antimicrobial pressure [2] [1]. The future of AST lies not in the supremacy of one approach over the other, but in their strategic combination. Rapid genotypic screening can guide early, targeted therapy, which may later be refined or confirmed by comprehensive phenotypic profiling. This synergistic approach, supported by continued innovation in automation, microfluidics, and sequencing, holds the greatest promise for effectively combating the global AMR crisis and improving patient outcomes [7] [14] [15].
The relentless rise of antimicrobial resistance (AMR) represents one of the most severe threats to global public health, with projections suggesting it could cause 10 million annual deaths by 2050 [1]. The cornerstone of effective antimicrobial stewardship and successful patient outcomes is rapid and reliable Antimicrobial Susceptibility Testing (AST), which guides clinicians in selecting the most appropriate antibiotics [18] [1]. However, conventional phenotypic AST methods, often considered the gold standard, require a minimum of 72 hours from specimen collection to final results [7]. This critical time lag forces clinicians to rely on empirical therapy, contributing to antibiotic misuse, treatment failures, and the escalation of AMR [1] [7]. This article frames the urgent need for speed in AST within a comparative analysis of traditional and molecular methods, providing researchers and drug development professionals with a clear understanding of the current technological landscape and its driving innovations.
Table: The Impact of Delayed AST Results on Patient and Public Health
| Aspect | Consequence of Delay | Long-Term Impact |
|---|---|---|
| Patient Treatment | Delayed administration of effective therapy; continued use of inappropriate empiric antibiotics [7]. | Increased mortality, particularly in sepsis; longer hospital stays [7]. |
| Antimicrobial Stewardship | Inability to de-escalate therapy in a timely manner [17]. | Increased selective pressure, driving the emergence of resistant pathogens [1]. |
| Public Health | Hindered detection and monitoring of emerging resistance patterns [18]. | Limited effectiveness of public health interventions and policy guidelines [18]. |
Conventional Phenotypic AST: The Established Benchmark with Inherent Limitations
Conventional phenotypic methods determine a microorganism's susceptibility by observing its ability to grow in the presence of antimicrobial agents. The most widely used techniques include disk diffusion, broth dilution, and gradient diffusion (E-test) [1]. These methods provide a measure of the Minimum Inhibitory Concentration (MIC), the lowest concentration of an antibiotic that prevents visible growth, which is then interpreted as Susceptible (S), Intermediate (I), or Resistant (R) based on guidelines from the Clinical and Laboratory Standards Institute (CLSI) and the European Committee on Antimicrobial Susceptibility Testing (EUCAST) [1].
Experimental Protocols and Workflow
The standard broth microdilution method, a reference quantitative technique, follows a rigorous protocol [1]:
- Inoculum Preparation: A pure bacterial colony is suspended in a saline or broth medium. The turbidity is adjusted to a 0.5 McFarland standard, equating to approximately 1-2 x 10^8 Colony Forming Units (CFU)/mL.
- Dilution and Dispensing: The antimicrobial agent is serially diluted (often twofold) in a broth medium across the wells of a microtiter plate.
- Inoculation and Incubation: Each well is inoculated with a standardized volume of the adjusted bacterial suspension. The plate is then sealed and incubated at 35±2°C for 16-20 hours under appropriate atmospheric conditions.
- Reading and Interpretation: The MIC is determined by visually inspecting the wells for the absence of turbidity. The MIC value is compared to established clinical breakpoints to assign a categorical result (S, I, or R).
Despite their reliability, these methods are labor-intensive and possess a long turnaround time because they require prior isolation of pure bacterial colonies, which typically adds 24 hours to the process [1] [7]. Furthermore, they are limited by the need for manual interpretation and challenges in standardizing the inoculum [1].
Diagram 1: Workflow of conventional phenotypic AST methods, highlighting the multi-step, time-consuming process that contributes to the diagnostic bottleneck.
Molecular and Genotypic AST: Speed with a Narrow Focus
Molecular AST methods detect specific genetic markers, such as resistance genes (e.g., mecA for methicillin resistance in Staphylococcus aureus) or mutations, using techniques like polymerase chain reaction (PCR), DNA microarrays, and whole-genome sequencing (WGS) [18] [1]. The primary advantage of these methods is their rapid turnaround time, which can provide results in a matter of hours, directly from clinical specimens in some cases [17].
Performance Comparison with Traditional Methods
Table: Comparison of Conventional Phenotypic vs. Molecular Genotypic AST Methods
| Feature | Conventional Phenotypic Methods | Molecular Genotypic Methods |
|---|---|---|
| Principle | Measures bacterial growth inhibition [1]. | Detects specific resistance genes or mutations [1]. |
| Time-to-Result | ~72 hours from specimen [7]. | A few hours [17]. |
| Key Advantage | Functional, hypothesis-free assessment of susceptibility [7]. | Exceptional speed. |
| Key Limitation | Long turnaround time, labor-intensive [1]. | Limited target range; cannot detect novel or complex resistance mechanisms [7]. |
| Therapeutic Guidance | Directly informs on drug efficacy. | Indirect, based on genotype-phenotype correlation. |
| Application in Routine Labs | Widespread, gold standard [1]. | Primarily for specific pathogens (e.g., MRSA, MDR-TB) and research [1]. |
A significant limitation of genotypic methods is that they are not hypothesis-free. They can only detect the specific resistance mechanisms they are designed to target. For instance, a 2024 review noted that a carbapenemase gene is identifiable in fewer than 50% of bacteria found to be phenotypically carbapenem-resistant, highlighting a major gap in their predictive capability [7]. This makes them powerful supplements but not yet standalone replacements for phenotypic testing in routine clinical practice.
The Innovative Frontier: Next-Generation Rapid Phenotypic AST
The pressing need to shorten the AST timeline has catalyzed innovation in rapid phenotypic technologies. These platforms aim to retain the comprehensive, hypothesis-free nature of phenotypic testing while drastically reducing the time-to-result. A 2024 scoping review identified over 90 rapid phenotypic AST technologies in the development pipeline, leveraging diverse technical innovations [7].
Key Technology Categories and Methodologies
- Direct-from-Specimen Testing: These methods bypass the need for pure colony isolation by performing AST directly on patient samples like positive blood cultures or urine. The main challenge is standardizing the inoculum and managing polymicrobial samples [17].
- Microfluidics and Microdroplets: These technologies confine bacteria into picoliter- or nanoliter-sized droplets, drastically reducing the volume needed for analysis. This reduction increases the effective bacterial concentration, enabling detection of micro-colony growth within just 30 minutes to 4 hours using high-resolution imaging [1] [7].
- MALDI-TOF MS AST: While primarily used for identification, Matrix-Assisted Laser Desorption/Ionization Time-of-Flight Mass Spectrometry is being explored for AST by monitoring protein profile changes in bacteria exposed to antibiotics over a few hours [18] [1].
- Automated Digital Microscopy and Cytological Analysis: Advanced systems use time-lapse imaging and AI-powered software to monitor morphological changes and cell lysis in bacteria upon antibiotic exposure at the single-cell level, providing results in 2-4 hours [7].
Experimental Protocol: Microdroplet Growth Assay (DOT-MGA)
A prime example of a cutting-edge rapid phenotypic method is the Direct-On-Target Microdroplet Growth Assay (DOT-MGA) [1]:
- Sample Preparation: A bacterial suspension from a positive blood culture is prepared and encapsulated into thousands of nanoliter-sized droplets in an oil-emulsion mixture.
- Antibiotic Exposure: The droplet library is dispensed onto a substrate pre-patterned with a concentration gradient of different antibiotics.
- Incubation and Imaging: The platform is incubated for a short period (e.g., 30-120 minutes) and monitored with automated, high-throughput time-lapse microscopy.
- Growth Analysis: AI-driven image analysis software detects and quantifies micro-colony growth within each droplet. The MIC is determined by identifying the lowest antibiotic concentration that inhibits growth.
This method's power lies in its ability to perform high-throughput, single-cell analysis, compressing a process that traditionally takes a day into a couple of hours.
Validation and Implementation: The Path to Clinical Adoption
For any new AST technology to be adopted, it must undergo rigorous validation. A framework adapted from government agencies helps classify the Technology Readiness Level (TRL) of these platforms, ranging from basic principle observation (TRL 1-3) to clinical validation and commercial deployment (TRL 7-9) [7]. A 2024 review of the pipeline found that while 18 platforms have been commercialized (with FDA clearance or CE marking), the vast majority of the 81 non-commercialized technologies are still in the proof-of-concept or prototype stages (TRL 3-5) [7].
Furthermore, a standardized framework for the Phase of Clinical Validation is critical for assessing maturity. This spans from analytical feasibility studies (Phase I) to large-scale, multi-center clinical trials that assess impact on patient outcomes and antimicrobial stewardship (Phase IV) [7]. Most emerging technologies have not yet advanced to the latter stages, indicating a significant opportunity for further development and investment.
Diagram 2: Combined framework for evaluating rapid AST technologies, showing progression in Technology Readiness Level (TRL) and Phase of Clinical Validation.
The Scientist's Toolkit: Essential Research Reagents and Materials
The development and execution of both conventional and novel AST methods rely on a suite of critical reagents and materials.
Table: Key Research Reagent Solutions for Antimicrobial Susceptibility Testing
| Reagent/Material | Function in AST | Application Examples |
|---|---|---|
| Cation-Adjusted Mueller-Hinton Broth (CAMHB) | The standardized growth medium for broth microdilution, ensuring consistent ion concentration for antibiotic activity [1]. | Conventional broth microdilution; reference method for validating new assays. |
| Mueller-Hinton Agar (MHA) Plates | The standardized solid medium for agar-based diffusion and dilution methods [1]. | Disk diffusion testing; agar dilution MIC determination. |
| ATCC Quality Control Strains | Reference strains (e.g., S. aureus ATCC 25923, E. coli ATCC 25922) with known susceptibility profiles for daily quality control [1]. | Verifying performance and accuracy of AST reagents, equipment, and procedures. |
| Antimicrobial Powder Standards | High-purity antibiotics for preparing in-house stock solutions and dilution series [1]. | Creating custom antibiotic panels for research; broth/agar dilution methods. |
| Microtiter Plates | Multi-well plates, often 96-well, used for high-throughput broth microdilution assays [1]. | Conventional MIC testing; automated AST systems. |
| Microfluidic Chips/Cartridges | Miniaturized devices with microchannels and chambers for manipulating fluids at the nano/picoliter scale [1] [7]. | Rapid phenotypic AST using microdroplets or single-cell analysis. |
The "Urgent Need for Speed" in the AMR crisis is the paramount driver of innovation in the AST landscape. While conventional phenotypic methods remain the gold standard for their comprehensive, hypothesis-free nature, their slow turnaround time is a critical liability. Molecular methods offer unparalleled speed but are constrained by their narrow, targeted approach. The most promising future lies in next-generation rapid phenotypic technologies that leverage microfluidics, advanced imaging, and AI to deliver reliable, comprehensive susceptibility profiles in a fraction of the time. For researchers and drug developers, the focus must be on advancing these technologies through robust clinical validation (Phases III-IV) and overcoming implementation barriers to fully realize their potential for transforming patient care and stemming the tide of antimicrobial resistance.
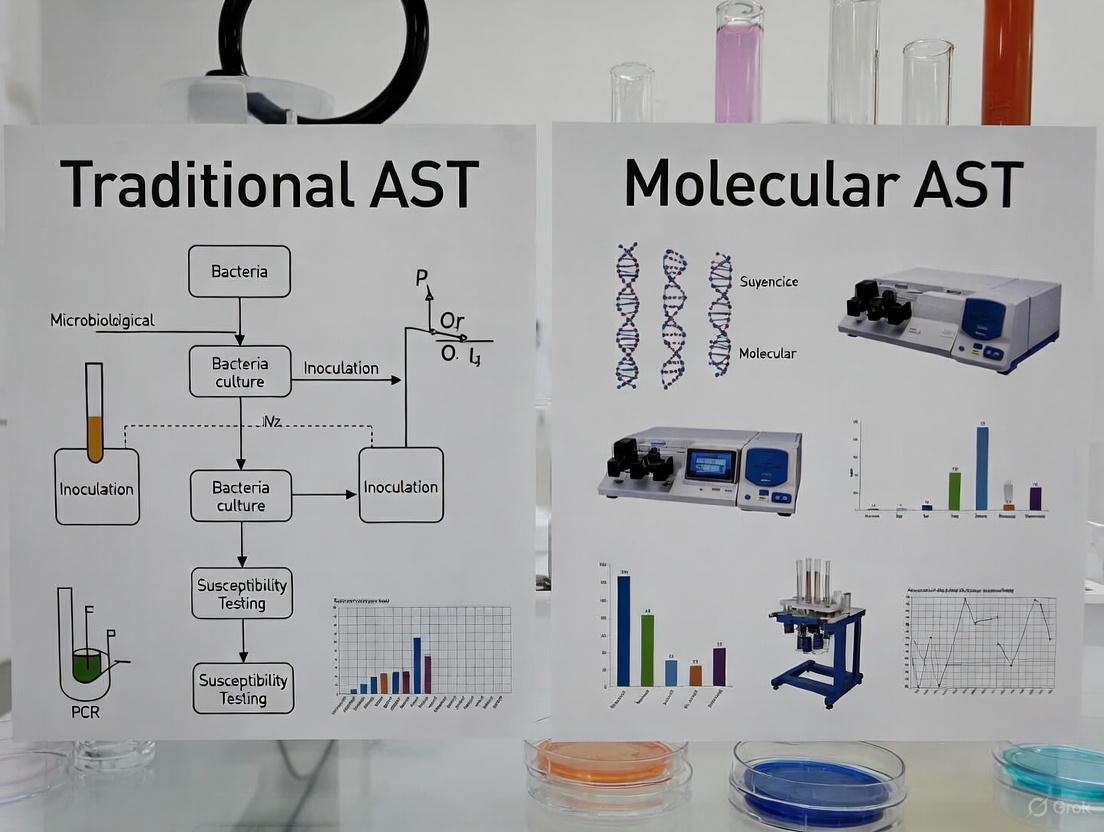
Methodologies in Action: A Deep Dive into Traditional and Molecular AST Workflows
Antimicrobial Susceptibility Testing (AST) is a critical methodology in clinical and research microbiology used to determine the sensitivity of a microorganism to specific antimicrobial agents. The results, reported as Minimum Inhibitory Concentrations (MICs), guide therapeutic decisions by identifying the lowest concentration of an antibiotic that prevents visible microbial growth [19]. In the context of a broader thesis examining traditional versus molecular AST methods, understanding the classic broth microdilution technique is foundational. While novel molecular methods offer speed, classic phenotypic methods like broth microdilution remain the reference standard for determining microbial susceptibility, providing a direct measure of bacterial response to antibiotics that genotypic methods cannot fully replicate [6] [19]. This guide provides a detailed, step-by-step protocol for executing the classic broth microdilution method, from culture preparation to MIC interpretation.
Workflow Visualization: From Culture to Result
The diagram below illustrates the key steps in the classic broth microdilution workflow and highlights where a modern molecular method intersects, offering a potential reduction in time-to-result.
Step-by-Step Experimental Protocol
The following section details the standard broth microdilution method as endorsed by the Clinical and Laboratory Standards Institute (CLSI) [19].
Materials Preparation
- Cation-Adjusted Mueller Hinton Broth (CA-MHB): Serves as the growth medium, with cations ensuring consistent antibiotic activity [19].
- Antibiotic Stock Solutions: Prepare high-concentration stocks in appropriate solvents (e.g., water, dimethyl sulfoxide) and filter-sterilize.
- Sterile Tubes or Plates: Use 14 mL polypropylene round-bottom tubes for macrobroth dilution or 96-well microtiter plates [19].
- Saline Solution: 0.9% sodium chloride for bacterial suspension.
Broth Microdilution Procedure
Prepare Antibiotic Dilution Series
- Create a two-fold serial dilution of the antibiotic in CA-MHB. For a typical test, prepare a concentration series that is twice the desired final concentration, as it will be diluted upon bacterial inoculation [19]. For example, to test a final range of 1 µg/mL to 64 µg/mL, prepare stock solutions from 2 µg/mL to 128 µg/mL.
- Include a growth control tube/well containing CA-MHB without antibiotic.
Standardize Bacterial Inoculum
- Select 3-5 well-isolated colonies from an overnight agar plate (e.g., Brain-Heart Infusion Agar).
- Suspend the colonies in saline and adjust the turbidity to a 0.5 McFarland standard, which equates to approximately 1-2 x 10^8 CFU/mL [19].
- Perform a 1:150 dilution of this suspension in CA-MHB to achieve a final inoculum density of approximately 5 x 10^5 CFU/mL [19].
Inoculate and Incubate
- Add 1 mL of the standardized bacterial inoculum to each 1 mL of antibiotic dilution and the growth control [19]. This step halves the antibiotic concentration, resulting in the desired final concentration range.
- Incubate the tubes or plates at 35 ± 2°C for 16-20 hours under ambient air, with shaking if using tubes [19].
Read and Interpret MIC
- After incubation, examine each tube/well for visible turbidity.
- The Minimum Inhibitory Concentration (MIC) is defined as the lowest concentration of antibiotic that completely inhibits visible growth of the organism [19].
- Compare the MIC value to the interpretive standards (breakpoints) provided by organizations like CLSI or EUCAST to categorize the organism as Susceptible, Intermediate, or Resistant.
Comparative Performance Data: Classic vs. Molecular
The table below summarizes a direct comparison between the classic broth microdilution method and the molecular Enzymatic Template Generation and Amplification (ETGA) method, based on experimental data [19].
Table 1: Quantitative Comparison of Classic Broth Microdilution and Molecular ETGA AST Methods
| Performance Metric | Classic Broth Microdilution | Molecular ETGA Method |
|---|---|---|
| Time to MIC Result | 20-24 hours [19] | 4-6 hours [19] |
| Agreement with Reference | (Reference Standard) | 100% agreement at 4, 6, and 22 hours for tested organisms (E. coli, S. aureus) [19] |
| Methodology Basis | Phenotypic (visible growth inhibition) | Functional (measurement of bacterial DNA polymerase activity) [19] |
| Key Application | Gold standard for routine AST and validation | Rapid screening, potential for same-day treatment guidance [19] |
| Throughput & Automation | Manual or semi-automated systems (e.g., Sensititre) [20] | Amenable to automation and integration with qPCR systems [19] |
The data demonstrates that while the classic method is the foundation of AST, molecular methods like ETGA can produce equivalent results in a fraction of the time. A 2013 feasibility study showed that ETGA could generate MICs for E. coli and S. aureus from spiked blood cultures in as little as 4-6 hours, with results showing complete agreement with the 22-hour broth microdilution reference method [19]. This significant reduction in turnaround time can profoundly impact clinical decision-making, especially in critical cases like sepsis.
Table 2: Experimental MIC Results for S. aureus and E. coli Strains: Classic vs. ETGA
| Bacterial Strain | Antibiotic | Reference MIC (Classic Broth, µg/mL) | ETGA MIC (4-6 hours, µg/mL) | Agreement |
|---|---|---|---|---|
| S. aureus (MSSA) ATCC 29213 | Oxacillin | 0.25 | 0.25 | Yes [19] |
| S. aureus (MRSA) NRS241 | Oxacillin | >256 | >256 | Yes [19] |
| S. aureus (MSSA) ATCC 29213 | Vancomycin | 1 | 1 | Yes [19] |
| E. coli ATCC 25922 | Ciprofloxacin | 0.015 | 0.015 | Yes [19] |
| E. coli ATCC 25922 | Tetracycline | 1 | 1 | Yes [19] |
The Scientist's Toolkit: Essential Research Reagents & Materials
A successful AST experiment relies on specific, high-quality materials. The following table details key components used in the classic broth microdilution workflow [19].
Table 3: Key Reagents and Materials for Broth Microdilution AST
| Item | Function/Description | Example from Protocol |
|---|---|---|
| Cation-Adjusted Mueller Hinton Broth (CA-MHB) | Standardized growth medium; cations (Ca²⁺, Mg²⁺) ensure accurate expression of antibiotic activity [19]. | Primary test medium for non-fastidious bacteria. |
| Macrodilution Tubes | Vessels for housing the antibiotic dilutions and bacterial culture during incubation [19]. | 14 mL polypropylene round-bottom tubes. |
| 0.5 McFarland Standard | Turbidity standard used to calibrate the initial bacterial inoculum density to ~1.5x10^8 CFU/mL [19]. | Essential for achieving a final inoculum of ~5x10^5 CFU/mL. |
| Brain-Heart Infusion (BHI) Agar | A general, nutritious non-selective agar for the propagation and isolation of bacterial strains prior to AST [19]. | Used for growing fresh colonies of S. aureus and E. coli. |
| Sterile Saline (0.9%) | An isotonic solution used to create the initial bacterial suspension from agar plates without causing osmotic shock [19]. | Used for preparing the 0.5 McFarland suspension. |
For laboratories seeking to streamline parts of this workflow, commercial systems like the Sensititre System offer a mix of manual, semi-automated, and fully automated solutions for inoculum preparation (e.g., nephelometer), plate inoculation (e.g., programmable pipettes), incubation, and fluorometric or digital reading of results [20].
In the ongoing battle against infectious diseases and the global threat of antimicrobial resistance (AMR), the accuracy and speed of pathogen detection are paramount [21]. Traditional methods, particularly in Antimicrobial Susceptibility Testing (AST), have long relied on microbiological culture and phenotypic techniques such as disk diffusion and broth microdilution to determine the Minimum Inhibitory Concentration (MIC) of antibiotics [21]. While these methods are standardized and cost-effective, they are inherently labor-intensive and slow, requiring 24 to 48 hours to yield results after the initial culture [21] [22]. This delay can critically impact patient management, leading to the empirical overuse of antibiotics and contributing to the rise of AMR [21] [22].
The development and implementation of molecular technologies represent a paradigm shift for clinical microbiology [23]. Polymerase Chain Reaction (PCR), and more specifically real-time PCR and multiplex panels, have revolutionized diagnostic workflows by enabling the rapid, sensitive, and simultaneous detection of multiple pathogens directly from clinical specimens [24] [23]. This article provides a comparative guide to these molecular tools, framing them within the broader thesis of transitioning from traditional to molecular AST methods. We will objectively compare the performance of various commercial multiplex panels, supported by experimental data, and detail the protocols and reagents that form the core of this modern molecular arsenal.
The Evolution of PCR in Diagnostics
Real-time PCR, also known as quantitative PCR (qPCR), is a sensitive and reliable method for gene expression analysis and pathogen quantification [25]. Unlike conventional PCR, which provides end-point analysis, real-time PCR quantitatively monitors the amplification of DNA in real-time through the use of fluorescent reporter molecules [26]. The cycle number at which the fluorescence crosses a predefined threshold (the Ct value) is the primary metric, which correlates directly with the initial amount of target nucleic acid [25].
The natural progression from detecting a single target is multiplex real-time PCR. This technique allows for the amplification of multiple DNA or RNA targets simultaneously in a single reaction [26]. This requires a specific pair of primers and a complementary DNA-binding probe for each target, with each probe labeled with a spectrally distinct fluorophore [26].
Advantages and Challenges of Multiplexing
The benefits of multiplexing are substantial for a clinical or research laboratory:
- Increased Throughput & Efficiency: Multiple targets can be assessed from a single sample in one reaction, saving time, reagents, and labor [27] [26].
- Comprehensive Data: Provides a broader diagnostic picture, which is crucial for syndromes with overlapping symptoms, such as respiratory or gastrointestinal infections [28] [23].
- Conservation of Sample: Maximizes data obtained from limited or precious sample material [26].
- Improved Data Normalization: An internal control can be included in each well to control for inhibition and pipetting errors [26].
However, multiplexing introduces technical challenges. The main pitfalls include competition for reagents between targets, which can skew the quantification of low-abundance targets, and the risk of undesired interactions between the numerous primers and probes in the reaction mix [26]. Careful experimental design, including meticulous primer/probe design and extensive validation, is required to ensure each reaction in the multiplex operates with equal efficiency [26].
Comparative Performance Evaluation of Commercial Multiplex Panels
To objectively assess the landscape of available molecular tools, we turn to published comparative studies. The diagnostic performance of a multiplex panel is primarily measured by its sensitivity (ability to correctly identify positive samples) and specificity (ability to correctly identify negative samples).
Comparison of Gastrointestinal Parasite Panels
A 2019 study provided a direct, head-to-head evaluation of four commercial multiplex real-time PCR assays for detecting diarrhoea-causing protozoa: Cryptosporidium hominis/parvum, Giardia duodenalis, and Entamoeba histolytica [24] [29]. The study used a reference panel of 126 well-characterized DNA samples to assess diagnostic performance [24].
Table 1: Diagnostic Sensitivity of Four Commercial Multiplex qPCR Assays for Enteric Protozoa [24] [29]
| Multiplex PCR Method | Manufacturer | Cryptosporidium hominis/parvum Sensitivity (%) | Giardia duodenalis Sensitivity (%) | Entamoeba histolytica Sensitivity (%) |
|---|---|---|---|---|
| RIDAGENE Parasitic Stool Panel | R-Biopharm | 87.5% | 91.5% | Similarly detected by all methods |
| Gastroenteritis/Parasite Panel I | Diagenode | 78.1% | 68.1% | Not detected |
| Allplex GI Parasite Panel 4 | Seegene | 75.0% | 93.6% | Similarly detected by all methods |
| FTD Stool Parasites | Fast Track | 53.1% | 100% | Similarly detected by all methods |
The data reveals that performance varies significantly depending on both the method used and the targeted pathogen [24]. The R-Biopharm assay demonstrated the best performance for Cryptosporidium, while the Fast Track assay was superior for Giardia [24] [29]. The study also highlighted differences in the limit of detection; the R-Biopharm method showed a 100-fold better detection limit for Cryptosporidium than other tests, while the Fast Track method had at least a 10-fold superior limit for Giardia [24]. These findings underscore that no single method is universally superior, and factors like targeted pathogens and local epidemiology must guide selection.
Concordance in Respiratory Virus Panels
Respiratory infections represent another major application for multiplex panels. A 2024 study compared the performance of three PCR-based platforms for detecting SARS-CoV-2, Influenza A/B, and Respiratory Syncytial Virus (RSV) [28].
Table 2: Performance Comparison of Respiratory Multiplex PCR Panels [28]
| Multiplex PCR Platform | Type | Overall Agreement with Comparator | Key Findings |
|---|---|---|---|
| TrueMark SARS-CoV-2, Flu A, Flu B, RSV | Laboratory-Developed Test (LDT) | 100% | 100% concordance with OpenArray LDT and BioFire RP2.1 |
| Open Array Respiratory Panel | Laboratory-Developed Test (LDT) | 100% | 100% concordance with TrueMark LDT and BioFire RP2.1 |
| BioFire Respiratory Panel 2.1 (RP2.1) | FDA-Approved IVD | 100% | Full concordance with both LDTs for nasopharyngeal samples |
This study demonstrates that well-validated laboratory-developed tests can achieve performance on par with FDA-approved in vitro diagnostic (IVD) tests [28]. The 100% concordance across all four respiratory viruses indicates that these multiplex tests can be confidently implemented in clinical settings for the accurate diagnosis of co-circulating respiratory pathogens [28].
Experimental Protocols for Multiplex Panel Evaluation
To ensure reliability and reproducibility, the evaluation of multiplex panels follows rigorous experimental protocols. The following workflow generalizes the key steps from the cited studies [24] [29] [28].
Detailed Methodology
1. Sample Collection and DNA Extraction [24] [28]
- Sample Type: The study should use well-characterized clinical samples (e.g., stool for GI panels, nasopharyngeal swabs for respiratory panels) suspended in an appropriate molecular transport medium [24] [28].
- Nucleic Acid Extraction: Purification is typically performed using automated systems (e.g., KingFisher Flex Purification System) and commercial kits (e.g., MagMAX viral/pathogen nucleic acid isolation kits) according to the manufacturer's instructions. This ensures high-quality, inhibitor-free DNA/RNA for downstream applications [28].
2. Multiplex Real-time PCR Setup and Execution [24] [29]
- Reaction Composition: Each commercial kit is used in strict accordance with its instructions. A typical reaction includes a preset master mix, specific primer-probe sets, and a defined volume of extracted nucleic acid (e.g., 5-10 µL) in a final reaction volume (e.g., 25 µL) [24] [29].
- Controls: Each run must include appropriate negative (no-template) controls, positive controls for each target, and internal controls to detect PCR inhibition [24].
- Amplification Protocol: The reaction is run on a suitable real-time PCR cycler (e.g., Corbett Rotor-Gene 6000, Bio-Rad CFX96, Agilent Mx3005P) with a standardized thermal cycling profile. This usually includes an initial activation step, followed by 40-45 cycles of denaturation, and a combined annealing/extension step [24] [28].
3. Data Analysis and Validation [24] [25]
- Ct Value Assignment: The cycle threshold (Ct) for each sample and target is determined by the instrument's software.
- Sensitivity/Specificity Calculation: Results are compared against a predefined reference standard (e.g., a well-characterized sample panel or a composite standard). Diagnostic sensitivity and specificity are calculated using standard formulas [24].
- Limit of Detection (LOD): The detection limit is determined by testing serial dilutions of a positive sample and identifying the last dilution that yields a positive result [24].
The Scientist's Toolkit: Essential Research Reagent Solutions
Successful implementation and validation of multiplex PCR require a suite of reliable reagents and tools. The following table details key components used in the featured experiments and the broader field.
Table 3: Essential Research Reagent Solutions for Multiplex PCR [24] [28] [27]
| Item | Function | Examples & Notes |
|---|---|---|
| Nucleic Acid Extraction Kits | Purifies DNA/RNA from complex clinical samples, removing PCR inhibitors. | MagMAX Viral/Pathogen Nucleic Acid Isolation Kits; automated systems like KingFisher Flex are standard [28]. |
| Multiplex PCR Master Mix | A optimized buffered solution containing DNA polymerase, dNTPs, and MgCl₂, formulated for efficient co-amplification of multiple targets. | Commercial mixes are pre-optimized to reduce primer-dimer formation and manage reagent competition [26]. |
| Primer & Probe Sets | Sequence-specific oligonucleotides that define the targets for amplification and detection. | TaqMan-style probes (5'-fluorophore, 3'-quencher) are standard for multiplexing. Designed to be specific and have distinct melting temperatures [27] [26]. |
| Commercial Multiplex Panels | Pre-designed and validated sets of primers and probes for simultaneous detection of a defined group of pathogens. | e.g., RIDAGENE Parasitic Stool Panel, Allplex GI Parasite Panel, TrueMark Respiratory Panels. Available as pre-spotted plates or single tubes [24] [27]. |
| Fluorescent Dyes & Quenchers | Reporters that generate the measurable signal proportional to amplicon production. | Fluorophores: FAM, HEX, Cy5, Texas Red. Must be spectrally distinct for multiplexing [27] [26]. |
| Positive Control Materials | Validates assay performance and helps monitor for contamination. Can be purified pathogen nucleic acids or non-infectious recombinant plasmids. | Chimeric plasmid DNA (cpDNA) can be designed to include multiple target sequences and even a contamination indicator probe [30]. |
The Future: Integrating AI and Advanced Technologies into AST
The evolution of molecular diagnostics continues, with the next frontier being the integration of artificial intelligence (AI) and machine learning (ML). These technologies promise to further revolutionize AST and infection control.
AI and ML models can be trained to predict pathogen antibiotic resistance and drug sensitivity by analyzing vast datasets, including clinical imaging, genomic sequences, and laboratory results [22]. This can provide rapid decision support to clinicians, potentially reducing the reliance on empirical antibiotic therapy and optimizing treatment choices long before traditional phenotypic AST results are available [22].
Furthermore, advancements in microfluidic technology, single-cell analysis, and next-generation sequencing (NGS) are pushing the boundaries of detection speed and multiplexing capability [21] [22]. These technologies, combined with the robust foundation of real-time PCR and multiplex panels, form a powerful molecular arsenal poised to meet the growing challenges of infectious diseases and antimicrobial resistance in the 21st century.
The escalating challenge of antimicrobial resistance (AMR) has intensified the demand for rapid, accurate diagnostic tools. Conventional antimicrobial susceptibility testing (AST) methods, while reliable, are often tedious, with high turnaround times (TAT) of up to several days [31]. This delay compels clinicians to prescribe empirical, broad-spectrum therapies, which can exacerbate the spread of AMR and increase patient mortality and healthcare costs [31]. The pressing need to prolong the lifespan of current antibiotics has catalyzed the development of next-generation tools. This guide objectively compares three pivotal technologies—Whole Genome Sequencing (WGS), Matrix-Assisted Laser Desorption/Ionization Time-of-Flight Mass Spectrometry (MALDI-TOF MS), and Microfluidics—that are reshaping the landscape of clinical microbiology and AST. Framed within the broader thesis of traditional versus molecular methods, this analysis provides researchers and drug development professionals with critical performance data and experimental protocols to inform their work.
Technology Comparison at a Glance
The table below provides a high-level comparison of the core next-generation tools against conventional methods.
Table 1: Comparative Overview of AST Diagnostic Technologies
| Technology | Principle of Operation | Key AST Applications | Typical Turnaround Time (after isolate) | Key Advantage | Primary Limitation |
|---|---|---|---|---|---|
| Conventional Phenotypic [31] | Measures bacterial growth in presence of antibiotics (e.g., broth microdilution, disk diffusion). | Gold standard for Minimum Inhibitory Concentration (MIC) determination. | 16–24 hours [7] | Provides definitive, phenotypic results. | Slow; high TAT leads to empirical therapy. |
| Whole Genome Sequencing (WGS) [31] | Comprehensive sequencing of the entire bacterial genome to identify resistance genes and mutations. | Detection of known antimicrobial resistance genes (ARGs); outbreak surveillance; hypothesis-free analysis. | 1–3 days (varies with workflow) [31] | Unbiased detection of all known resistance determinants. | Does not detect novel resistance mechanisms or provide MIC; requires bioinformatics expertise. |
| MALDI-TOF MS [32] [33] | Proteomic analysis of microbial ribosomal protein profiles for identification and resistance biomarker detection. | Bacterial/fungal identification; detection of specific resistance enzymes (e.g., β-lactamase activity). | Minutes to a few hours [32] [33] | Extremely rapid and low-cost identification. | Limited to detecting specific, known resistance biomarkers. |
| Microfluidics [31] [34] | Miniaturization of assays to manipulate picoliter-nanoliter volumes in microchannels for single-cell analysis. | Rapid phenotypic AST; single-cell analysis; combined with other methods for enhanced sensitivity. | 2–4 hours [7] | Drastically reduced TAT for phenotypic results; low reagent use. | Mostly in research and development phase; not yet widely commercialized. |
Performance and Experimental Data
Resolution and Identification Capabilities
A critical metric for any diagnostic tool is its ability to correctly identify organisms at the species and strain level.
Table 2: Comparison of Identification Resolution
| Technology | Identification Resolution | Supporting Experimental Data |
|---|---|---|
| WGS | Considered the gold standard for resolution, enabling strain-level tracking [35]. | In a study of Bacillus isolates, WGS successfully provided species-level identification for 9 out of 14 isolates (64%) [35]. |
| MALDI-TOF MS | High species-level resolution, comparable to WGS for many common pathogens [35]. | The same study on Bacillus isolates found MALDI-TOF MS correctly identified 13 out of 15 isolates (87%) at the species level [35]. For mycobacteria, a multicentre study reported 100% concordance for M. tuberculosis (43/43) and 85% for slow-growing NTM (42/48) [36]. |
| Conventional Methods (e.g., VITEK 2) | Lower resolution, often unable to differentiate closely related species [35]. | The identification of closely related species like those in the Bacillus genus or the HACEK group is challenging, with biochemical methods identifying less than 77% of HACEK isolates in one study [37]. |
Speed and Cost-Efficiency
Turnaround time and cost are decisive factors for clinical implementation.
Table 3: Comparison of Operational and Economic Factors
| Factor | WGS | MALDI-TOF MS | Microfluidics |
|---|---|---|---|
| Time-to-Result (from pure colony) | 1-3 days [31] | Minutes for identification [32]; 2-4 hours for specific β-lactamase AST [33] | 2-4 hours for phenotypic AST [7] |
| Approximate Cost per Test | ~$400 per isolate (library building) [35] | <$1 per isolate for identification [35] | Information varies; aims for cost-effectiveness but R&D costs are high. |
| Throughput | High, but data analysis can be a bottleneck. | High-throughput; hundreds of isolates per hour [35] | Variable; designed for high-throughput single-cell analysis. |
| Technology Readiness | Established in reference labs and for outbreak surveillance. | Routinely implemented in clinical labs for identification; AST applications emerging. | Over 90 technologies in development; mostly in research phase [7]. |
Experimental Protocols for Key Applications
MALDI-TOF MS for Detection of β-Lactamase Activity
This protocol is used to rapidly detect carbapenemase production directly from positive blood cultures or bacterial isolates [33].
Key Reagent Solutions:
- HCCA Matrix: α-cyano-4-hydroxycinnamic acid dissolved in 50% acetonitrile, 47.5% water, and 2.5% trifluoroacetic acid. Facilitates co-crystallization and ionization of the analyte.
- β-lactam antibiotic solution: E.g., imipenem or ertapenem at a defined concentration.
- Formic Acid: Used to overlay the sample spot on the target plate to assist in protein extraction and crystallization.
Detailed Workflow:
- Incubation: Incubate the bacterial suspension with the target β-lactam antibiotic (e.g., imipenem) for 30-120 minutes.
- Sample Spotting: After incubation, transfer a small aliquot of the reaction mixture onto a MALDI steel target plate.
- Matrix Application: Overlay the dried sample spot with 1 µL of HCCA matrix solution and allow it to co-crystallize.
- MS Analysis: Insert the target plate into the MALDI-TOF mass spectrometer for analysis.
- Result Interpretation: The mass spectrum is analyzed for the presence of the intact antibiotic peak and its hydrolysis products. A decrease in the antibiotic peak and the appearance of peaks corresponding to its hydrolyzed form indicate β-lactamase activity. Software modules (e.g., Bruker's MBT Compass STAR-BL) can automate this interpretation, providing a "sensitive" or "resistant" result [33].
The following diagram illustrates the logical relationship and workflow for this detection method.
Microfluidics-Enhanced MALDI-TOF MS for Sensitive Peptide Detection
This protocol describes the integration of droplet-based microfluidics (DMF) with MALDI-TOF to significantly improve detection sensitivity for analytes like peptides [34].
Key Reagent Solutions:
- Oil Carrier Phase: Fluorinated oil to encapsulate aqueous droplets, preventing biofouling and adsorption to microchannel surfaces.
- Acidified Matrix/Analyte Mixture: A mixture of the sample (e.g., peptide) and the HCCA matrix, acidified with Trichloroacetic Acid (TCA) to prevent proton migration into the oil phase.
- PDMS Microchip: A polydimethylsiloxane microfluidic device featuring a T-junction for droplet generation.
Detailed Workflow:
- Droplet Generation: The acidified matrix/analyte mixture is introduced into the microfluidic device, where an oil carrier phase shears it into uniform nanoliter droplets at a T-junction.
- Automated Deposition: The generated droplets are automatically and slowly deposited onto a commercial stainless-steel MALDI target plate.
- Evaporation and Crystallization: The oil carrier phase facilitates a "focusing effect" during droplet evaporation, leading to a highly homogeneous and concentrated crystallization of the analyte-matrix mixture in a small area.
- MS Analysis: The plate is analyzed by MALDI-TOF MS. This method has been shown to enhance signal intensity by 30-fold compared to conventional spotting, allowing detection down to the attomole range [34].
Essential Research Reagent Solutions
The table below lists key materials and reagents essential for implementing the described next-generation technologies.
Table 4: Key Research Reagent Solutions for Next-Generation AST
| Reagent / Material | Function / Application | Technology |
|---|---|---|
| HCCA Matrix (α-cyano-4-hydroxy-cinnamic acid) | Organic matrix that co-crystallizes with the analyte, enabling desorption/ionization during laser irradiation [32]. | MALDI-TOF MS |
| MALDI-TOF Reference Spectral Libraries (e.g., Bruker BDAL, MBT Mycobacteria Library) | Databases of known microbial spectral fingerprints used for organism identification by pattern matching [37] [36]. | MALDI-TOF MS |
| Fluorinated Oil & Surfactants | Carrier phase for generating and stabilizing aqueous droplets in microfluidic channels, preventing coalescence [34]. | Microfluidics |
| PDMS (Polydimethylsiloxane) | A silicone-based polymer used to fabricate transparent, flexible, and gas-permeable microfluidic chips [34]. | Microfluidics |
| Next-Generation Sequencing Kits (e.g., Illumina) | Library preparation kits for fragmenting, adapting, and amplifying DNA for high-throughput sequencing [38]. | WGS |
| Bioinformatics Software Suites | Tools for genome assembly, variant calling, and annotation of antimicrobial resistance genes from sequencing data [31]. | WGS |
The paradigm shift from traditional to molecular AST methods is well underway, driven by WGS, MALDI-TOF MS, and microfluidics. Each technology offers a unique set of advantages: WGS provides unparalleled comprehensiveness for genotypic resistance profiling, MALDI-TOF MS delivers unparalleled speed and cost-efficiency for identification and specific resistance mechanisms, and microfluidics holds the promise of radically accelerated phenotypic AST. The future of AMR diagnostics does not lie in a single technology superseding all others but in their strategic integration. Combining the rapid screening power of MALDI-TOF MS or microfluidics with the definitive, hypothesis-free genotypic analysis of WGS in a complementary workflow will provide clinicians with the rapid, actionable data needed to combat antimicrobial resistance effectively, ensuring targeted therapies and improved patient outcomes.
Antimicrobial resistance (AMR) is a critical global health threat, associated with millions of deaths annually and complicating the treatment of infectious diseases [6]. The rapid identification (ID) of pathogens and determination of their antimicrobial susceptibility testing (AST) profiles are essential for selecting effective therapies, improving patient outcomes, and combating the rise of resistant organisms [1]. Conventional phenotypic AST methods, such as disk diffusion and broth microdilution, have served as cornerstone techniques for decades. However, these methods typically require 2-5 days from sample collection to result, necessitating prolonged empirical antibiotic therapy that may be inadequate or overly broad [6] [39].
The integration of automation into microbiology laboratories has revolutionized diagnostic workflows. This guide objectively compares three advanced platforms for AST—VITEK 2, Accelerate Pheno, and dRAST—by analyzing their performance data, experimental methodologies, and operational characteristics. Understanding the capabilities of these systems is crucial for researchers, scientists, and drug development professionals working at the intersection of traditional microbiology and molecular innovation.
VITEK 2 System
The VITEK 2 (bioMérieux) is a widely established automated system for bacterial identification and antimicrobial susceptibility testing. It utilizes compact, plastic test cards containing 64 wells that hold substrates for biochemical identification or antibiotics at various concentrations for susceptibility testing. The system measures microbial growth through kinetic colorimetric and turbidimetric methods, automatically interpreting results against established breakpoints. It is designed for use with pure colonies grown on solid culture media, requiring a prior subculture step that adds to the total turnaround time [40] [41].
Accelerate Pheno System
The Accelerate Pheno System (APS) (Accelerate Diagnostics) is a fully automated platform that delivers both ID and phenotypic AST directly from positive blood cultures. It combines two core technologies:
- Fluorescence in situ hybridization (FISH) with genus and species-specific probes for pathogen identification, providing results within approximately 90 minutes.
- Morphokinetic cellular analysis to monitor how live microbial cells respond to antimicrobial agents, generating Minimum Inhibitory Concentration (MIC) values and susceptibility interpretations in about 7 hours post-identification [42] [40] [39].
By bypassing the subculture step, the APS significantly shortens the time to result compared to conventional methods.
dRAST System
The dRAST (QuantaMatrix Inc.) is a rapid phenotypic AST system that can be performed directly from positive blood culture bottles or from colony isolates. Its technology centers on micropatterned plastic microchips and microscopic imaging analysis. Samples are mixed with agarose and inoculated into a microchip containing lyophilized antibiotics. The system then uses automated microscopy to detect bacterial colony formation within the agarose matrix in the presence of antibiotics, providing AST results within 6 hours [43] [44]. This method is designed to handle a wide range of bacterial concentrations without requiring precise inoculum standardization.
Comparative Performance Data
Extensive studies have evaluated the performance of these systems against reference methods, typically broth microdilution (BMD) or disk diffusion. The tables below summarize key performance metrics.
Table 1: Overall System Characteristics and Workflow
| Feature | VITEK 2 | Accelerate Pheno | dRAST |
|---|---|---|---|
| Technology Principle | Kinetic colorimetric/turbidimetric measurement in microcards | FISH for ID & morphokinetic cellular analysis for AST | Microscopic imaging of microcolony growth in micropatterned chips |
| Sample Input | Pure colonies from subculture | Direct from positive blood culture | Direct from positive blood culture or colonies |
| Time to AST Result | ~18-24 hours post-subculture | ~8.5 hours total (1.5h ID + 7h AST) | ~6 hours |
| Hands-on Time | Moderate | ~2 minutes/sample | <5 minutes for chip setup |
| AST Output | MIC & Category (S/I/R) | MIC & Category (S/I/R) | Category (S/I/R) |
Table 2: Performance Metrics Against Reference Methods
| Performance Metric | VITEK 2 [41] | Accelerate Pheno [42] [40] | dRAST [43] [44] |
|---|---|---|---|
| Categorical Agreement (CA) | 92.7-94.1% (for non-fermenters) | 90.3% (GN), 97.2% (GP) | 91.11% - 95.5% |
| Essential Agreement (EA) | 99.2-99.5% (for non-fermenters) | 93.2% (GN), 98.89% (GP) | ~89.0% |
| Major Error (ME) Rate | Low (e.g., 0% for imipenem vs P. aeruginosa) | 1.7% (overall) | 2.72% (overall) |
| Very Major Error (VME) Rate | Low (e.g., 0% for imipenem vs P. aeruginosa) | 0.2% (overall) | 1.45% (overall) |
| Key Limitations | Requires pure isolate (24-48h subculture) | Limited ID panel; inferior performance with polymicrobial samples | Less reliable for specific antibiotic-bacteria combinations |
Experimental Protocols in cited Studies
To ensure the reproducibility of the data presented, this section outlines the key experimental methodologies from the cited studies.
Protocol for Evaluating the Accelerate Pheno System
A 2021 study evaluated the APS for use with positive blood culture bottles inoculated with primary sterile specimens (e.g., cerebrospinal fluid, ascites) [42].
- Sample Preparation: Positive BACTEC blood culture bottles (Becton Dickinson) were included within 24 hours of being flagged positive by the BACTEC 9240 instrument.
- Testing Procedure: The Accelerate PhenoTest BC kit was run according to the manufacturer's instructions. The system's automated process involves gel electrofiltration to lyse blood cells and concentrate intact microbial cells for subsequent FISH identification and morphokinetic AST.
- Reference Methods: Pathogen identification was confirmed by conventional methods (MicroScan Walkaway system supplemented by Vitek MS and Vitek II). AST was performed using the MicroScan Walkaway system, Vitek II, or Etest from colonies subcultured from the same positive bottle.
- Data Analysis: Identification agreement and AST categorical agreement were calculated. AST errors were classified as very major error (VME), major error (ME), or minor error (MiE) per European Committee on Antimicrobial Susceptibility Testing (EUCAST) guidelines.
Protocol for Evaluating the dRAST System
A 2017 study developed and evaluated the dRAST system for direct testing from positive blood cultures [43].
- Sample Preparation: A 10 μL sample was withdrawn from a positive blood culture bottle (BACTEC or BacT/ALERT) and diluted 100-fold with cation-adjusted Mueller-Hinton broth (CAMHB). This diluted sample was mixed with liquid-state 0.5% agarose at a 1:3 volume ratio.
- Testing Procedure: 10 μL of the mixture was inoculated into the radial-shaped chamber of a 96-well dRAST chip. After agarose solidification, culture medium was added to satellite wells to rehydrate the freeze-dried antibiotics, which then diffused into the agarose matrix. The chip was incubated at 37°C.
- Image Analysis & Interpretation: Bacterial growth was monitored via automated microscopic imaging. The system analyzed microcolony formation in the presence of antibiotics to determine susceptibility.
- Reference Method: AST results were compared to standard broth microdilution. Categorical agreement and error rates were calculated based on FDA performance criteria.
Protocol for a Comparative Study of VITEK 2
A 2017 study assessed the performance of VITEK 2 for AST of challenging non-fermenting Gram-negative bacteria [41].
- Isolate Preparation: The study used 99 Pseudomonas aeruginosa, 26 Acinetobacter baumannii, and 11 Stenotrophomonas maltophilia clinical isolates. Pure colonies were used to prepare standardized inoculum suspensions as per the manufacturer's instructions.
- Testing Procedure: The suspensions were loaded into AST-GN69 and AST-XN06 cards and run on the VITEK 2 instrument.
- Reference Method: The reference method was CLSI reference broth microdilution (BMD).
- Data Analysis: Essential agreement (EA) and categorical agreement (CA) were calculated using both VITEK 2 breakpoints and CLSI M100S 26th edition breakpoints. Very major and major error rates were determined.
Workflow Integration and Pathway Analysis
The following diagram illustrates the procedural workflows for conventional laboratory testing and the three automated platforms, highlighting critical differences in turnaround time.
Diagram Title: Workflow and Time Comparison of AST Methods
Essential Research Reagent Solutions
The table below details key reagents and consumables required for the operation of these platforms, which is critical for laboratory planning and procurement.
Table 3: Key Research Reagents and Consumables
| Item | Function/Description | Representative Platforms |
|---|---|---|
| Specialized Blood Culture Bottles | Contain growth media for patient blood or sterile fluid samples; compatible with automated incubator systems. | BACTEC Plus Aerobic/Anaerobic, BacT/Alert FA Plus [42] [43] |
| Proprietary Test Kits/Cards | Self-contained units with lyophilized antibiotics or identification substrates. | Accelerate PhenoTest BC Kit [42], VITEK 2 AST Cards [41] |
| Identification Probes/Substrates | Reagents for pathogen identification (e.g., FISH probes, biochemical substrates). | FISH probes in Pheno system [39], Substrates in VITEK 2 cards [41] |
| Liquid Growth Media | Broths for dilution, suspension, or supporting microbial growth during testing. | Cation-Adjusted Mueller-Hinton Broth (CAMHB) [43] |
| Solid Culture Media | Agar plates for subculturing and obtaining pure bacterial colonies. | Columbia blood agar, Chocolate agar, MacConkey agar [42] |
| Quality Control Strains | Reference strains for validating test performance and reagent functionality. | E. coli ATCC 25922, S. aureus ATCC 29213 [43] |
The comparative data reveals that each platform offers a distinct balance of speed, workflow integration, and performance.
- The Accelerate Pheno System provides the most integrated solution, combining rapid ID and phenotypic AST with minimal hands-on time, directly from positive blood cultures. This can potentially reduce the time to appropriate antibiotic therapy by 24-48 hours [40] [39]. Its limitations include a narrower ID panel and potentially inferior performance with polymicrobial infections [42].
- The dRAST System excels in delivering rapid phenotypic AST results within 6 hours, demonstrating high categorical agreement with reference methods [43] [44]. As a standalone AST system, it requires a complementary identification method. Its strength lies in its ability to handle a wide range of bacterial concentrations directly from positive blood cultures without complex separation steps.
- The VITEK 2 System remains a workhorse in clinical laboratories, providing reliable ID and AST from pure colonies. While its throughput is high, its requirement for a prior subculture means it does not shorten the overall turnaround time to the same degree as direct-from-bottle systems [40] [41]. Its extensive databases and established performance make it a robust choice for high-volume labs.
In conclusion, the selection of an AST platform must be guided by the specific needs of the laboratory, considering factors such as workflow priorities, the prevalence of resistant organisms, available budget, and the desired balance between speed and breadth of detection. These integrated systems represent a significant leap forward in diagnostic microbiology, enabling more precise and timely antimicrobial stewardship—a critical component in the global fight against antimicrobial resistance.
Navigating Challenges: Overcoming Technical and Operational Hurdles in AST
Addressing the Long Turnaround Time of Phenotypic Methods
The escalating global antimicrobial resistance (AMR) crisis demands rapid diagnostic solutions to guide effective therapy. Phenotypic Antimicrobial Susceptibility Testing (AST) remains the gold standard for determining bacterial susceptibility to antimicrobial agents, but its utility has been historically limited by long turnaround times (TAT). Conventional phenotypic methods typically require 72 hours or more from specimen collection to final susceptibility results, comprising multiple sequential processes: bacterial growth detection (up to 5 days), taxonomic identification (∼24 hours), and AST itself (4-24 hours after isolation) [45]. This diagnostic delay contributes significantly to the overuse of empirical broad-spectrum antibiotics, fueling further resistance development. In critical infections like bloodstream infections and sepsis, receiving suitable antibiotic treatment within 12 hours from blood sample collection or 1-3 hours after signs of septic shock is associated with reduced mortality [46]. This review comprehensively compares the performance of emerging rapid phenotypic AST technologies against conventional methods, focusing on TAT reduction while maintaining diagnostic accuracy.
Comparative Analysis of Conventional Versus Rapid Phenotypic AST Systems
Turnaround Time and Performance Metrics
Table 1: Comparative Performance of AST Systems in Clinical Practice
| AST System | Time-to-Result (TTR) | Total Turnaround Time (TAT) | Essential Agreement (EA) | Categorical Agreement (CA) |
|---|---|---|---|---|
| Conventional Methods (Broth microdilution, Agar dilution) | 18-24 hours [2] | 72+ hours [45] | Reference standard | Reference standard |
| Automated Routine Systems (BD Phoenix, VITEK 2, MicroScan) | 9-19 hours [46] | 22-45 hours [46] | >95% [46] | >95% [46] |
| QuickMIC Rapid AST System | 2-4 hours [46] | 10-11.5 hours [46] | >95% [46] | >95% [46] |
| EUCAST RAST (Disk diffusion) | 4-8 hours [46] | Varies with workflow | Limited validation [46] | Limited validation [46] |
Table 2: Emerging Rapid Phenotypic AST Technologies
| Technology Category | Examples | Key Innovations | Technology Readiness | Clinical Validation Status |
|---|---|---|---|---|
| Microfluidics-based | QuickMIC, QMAC-dRAST | Microfluidics-generated antibiotic gradients in 3D hydrogel; solid-phase cytometry [46] | FDA authorization/CE marking [46] | Multicenter clinical studies [46] |
| Automated Imaging | Alfred 60/AST, ASTar system | Automated microscopy, fluorescence imaging [45] | Commercialized/CE marking [45] | Variable validation [45] |
| Integrated Systems | Pheno system, VITEK REVEAL | Combined identification and AST; machine learning interpretation [45] | FDA authorization/CE marking [45] | Extensive clinical trials [45] |
Impact on Clinical Decision-Making
The implementation of rapid AST systems significantly transforms clinical workflows and therapeutic outcomes. The QuickMIC system demonstrated a 69-76% reduction in TTR (3 hours 4 minutes versus 9-19 hours) and 51-75% reduction in total TAT (10-11.5 hours versus 22-45 hours) compared to routine automated systems [46]. This acceleration enables same-shift diagnostics without requiring 24/7 staffing, facilitating earlier transition from empirical to targeted antibiotic therapy. For bloodstream infections with an incidence of 677.5 cases per 100,000, such TAT improvements could substantially impact mortality and healthcare costs [46].
Experimental Protocols and Methodologies
QuickMIC System Workflow and Validation Protocol
Experimental Protocol: Multicenter Evaluation of QuickMIC System
- Sample Preparation: Positive blood cultures with Gram-negative bacteria were processed following standard laboratory protocols. Species identification was performed using MALDI-TOF-MS (Bruker) or VITEK-MS (bioMérieux) [46].
- Inoculation: Bacterial suspensions were prepared and loaded into QuickMIC GN cassettes containing 12 different antibiotics in a microfluidics-generated gradient through 3D agarose hydrogel [46].
- Incubation and Monitoring: Cassettes were incubated at 35°C±2°C with continuous monitoring via solid-phase cytometry for bacterial growth detection [46].
- MIC Determination: The system automatically determined MIC values based on bacterial growth patterns in response to antibiotic gradients over 2-4 hours [46].
- Comparison Methodology: Parallel testing with routine AST systems (BD Phoenix, MicroScan WalkAway plus, VITEK 2) was performed using manufacturers' instructions. Essential Agreement (EA), Categorical Agreement (CA), bias, and error rates were calculated according to standardized performance parameters [46].
- Turnaround Time Analysis: TTR was recorded as the analysis time for each system. Total TAT was calculated from time of blood culture positivity or Gram-staining until result availability [46].
Diagram 1: Comparative workflow of conventional versus rapid phenotypic AST systems
Technology Readiness Assessment Framework
Table 3: AST Technology Readiness Level (TRL) Framework
| TRL Level | Development Stage | Key Milestones |
|---|---|---|
| TRL 1-3 | Basic research | Proof-of-concept; laboratory feasibility |
| TRL 4-6 | Technology development | Prototype validation; analytical performance |
| TRL 7 | Clinical validation | Multicenter studies; regulatory submission |
| TRL 8-9 | Commercialization | FDA/CE approval; clinical implementation |
The Scientist's Toolkit: Essential Research Reagents and Materials
Table 4: Key Research Reagent Solutions for Rapid Phenotypic AST Development
| Reagent/Material | Function | Example Applications |
|---|---|---|
| 3D Agarose Hydrogel | Microfluidics matrix for antibiotic gradient formation and bacterial embedding | QuickMIC system for creating stable antibiotic concentration gradients [46] |
| Solid-Phase Cytometry Reagents | Fluorescent markers for bacterial viability and growth detection | Rapid monitoring of bacterial proliferation in microfluidic channels [46] |
| Mueller-Hinton Agar/Broth | Standardized growth medium for AST | Reference method media; quality control [1] |
| Cation-Adjusted Broth | Broth supplementation for optimal antibiotic activity | Broth microdilution reference methods [1] |
| ATCC Quality Control Strains | Reference strains for quality assurance | Performance monitoring; standardization [1] |
| EUCAST/CLSI Breakpoint Panels | Interpretation criteria for susceptibility categories | Standardized result interpretation; regulatory compliance [1] |
Future Directions and Implementation Challenges
Despite promising advances, several challenges remain for widespread implementation of rapid phenotypic AST technologies. Current automated systems based on microdilution trays provide faster results (6-24 hours after initial isolation) but offer limited TAT improvement compared to broth microdilution reference methods [2]. Emerging technologies must undergo extensive validation to establish performance characteristics across diverse pathogen populations and resistance mechanisms. Implementation barriers include initial capital investment, workflow integration complexities, and staff training requirements, particularly in resource-limited settings where AMR burden is highest [45]. Future innovation priorities include further TAT reduction through direct specimen testing, enhanced automation, and artificial intelligence integration for result interpretation and prediction of resistance mechanisms.
Diagram 2: Technology classification and future innovation pathways for rapid AST
Rapid phenotypic AST technologies represent a transformative advancement in clinical microbiology, effectively addressing the critical limitation of long turnaround times associated with conventional methods. The documented 51-76% reduction in TAT achieved by systems like QuickMIC demonstrates the potential for same-shift diagnostics that can dramatically impact patient outcomes in serious infections. While validation and implementation challenges remain, the continued evolution of microfluidics, automation, and computational analysis promises to further bridge the gap between traditional phenotypic methods and molecular techniques, ultimately strengthening our collective defense against antimicrobial resistance.
Antimicrobial Susceptibility Testing (AST) stands as a critical pillar in clinical microbiology, guiding therapeutic decisions and combating the escalating crisis of antimicrobial resistance (AMR). The field is characterized by a fundamental dichotomy between traditional phenotypic methods, which directly observe microbial response to antibiotics, and molecular methods, which detect genetic determinants of resistance. While conventional techniques like disk diffusion and broth microdilution have served as gold standards for decades, their relatively long turnaround times (often 18-24 hours or more after initial isolation) have driven the pursuit of faster alternatives [2] [1]. Molecular methods for AST emerged with the transformative promise of radically accelerated diagnostics, potentially reducing turnaround times to approximately 1–6 hours by directly detecting resistance genes in bacterial isolates or even directly from clinical specimens [2] [6]. This capability positions molecular AST as a powerful tool for rapidly revising empiric antimicrobial regimens, a critical factor in improving patient outcomes, especially in sepsis and other severe infections [47].
The core premise of molecular AST is elegantly simple: detect the genetic basis for resistance, and you can predict the phenotypic outcome. These techniques, including polymerase chain reaction (PCR), sequencing, and microarray analysis, identify specific resistance genes (e.g., mecA for methicillin resistance in Staphylococcus aureus or carbapenemase genes like KPC and NDM in Gram-negative bacteria) or mutations associated with antibiotic failure [2] [48]. This approach offers undeniable advantages, including exquisite sensitivity and the potential for automation [47]. However, the assumption that genotype reliably predicts phenotype is fraught with complexities. The relationship between the presence of a resistance gene and the actual expression of a resistant phenotype is not always guaranteed, creating a significant gap that limits the absolute predictive power of molecular methods [2] [47]. This review critically examines the inherent limitations of inferring antimicrobial susceptibility phenotypes solely from genotypic information, framing the discussion within the ongoing evolution of AST methodologies.
Fundamental Disconnects Between Genotype and Phenotype
The translation from genetic code to observable trait is a complex biological process. In the context of antimicrobial resistance, several fundamental mechanisms can disrupt the link between the presence of a resistance gene and the expression of a resistant phenotype, leading to diagnostic discrepancies.
Unexpressed or Silenced Genes
A primary limitation of molecular AST is its inability to distinguish between actively expressed genes and those that are silent. A bacterium may harbor a resistance gene that is not transcribed or translated, resulting in a susceptible phenotype despite the genotypic potential for resistance. Molecular methods will correctly identify the gene but incorrectly predict therapeutic failure, potentially leading to the unnecessary avoidance of effective antibiotics [2] [47]. This can contribute to the overuse of broader-spectrum agents, a key driver of AMR.
Unknown and Novel Resistance Mechanisms
Molecular methods are inherently target-dependent; they can only detect the specific genetic sequences for which they are designed. This presents a major blind spot when faced with novel or uncharacterized resistance mechanisms. For instance, resistance can arise from new mutations in target sites, efflux pump regulators, or permeability genes that are not covered by standard assay panels. Phenotypic methods, being hypothesis-free, will detect any resistance mechanism that results in bacterial growth in the presence of an antibiotic. This critical difference is highlighted by the observation that carbapenemase genes are identifiable in fewer than 50% of bacteria found to be phenotypically carbapenem-resistant, underscoring the vast landscape of undetected resistance mechanisms [7].
Complex Multigenic and Regulatory Resistance
Not all resistance is monogenic. Many resistance phenotypes are polygenic, arising from the cumulative effect of multiple genes, such as combinations of efflux pump overexpression, porin loss, and modest beta-lactamase activity. Inducible resistance adds another layer of complexity, where gene expression is activated only upon exposure to the antibiotic [2]. Molecular tests may detect one component of this system but fail to capture the integrated phenotypic output. Furthermore, the presence of a resistance gene does not always correlate with a clinically significant level of resistance. The gene may confer only a low-level increase in MIC, which may not breach the clinical breakpoint for resistance, yet the molecular result would still flag the organism as resistant [47].
The following diagram illustrates the pathway from genotype to phenotype and the key points where this relationship can break down, leading to limitations in molecular AST.
Comparative Performance: Molecular vs. Phenotypic AST
The theoretical limitations of molecular methods manifest in tangible differences in performance when compared directly with traditional phenotypic AST. The following table summarizes the core characteristics and performance metrics of these two approaches, highlighting the trade-offs between speed and predictive completeness.
Table 1: Method Comparison: Molecular vs. Conventional Phenotypic AST
| Parameter | Molecular AST | Conventional Phenotypic AST |
|---|---|---|
| Basis of Detection | Detection of specific resistance genes or mutations (e.g., mecA, blaKPC, vanA) [2] [47] | Direct measurement of bacterial growth inhibition in the presence of antimicrobials [1] |
| Turnaround Time | ~1–6 hours [2] [6] | ~18–24 hours post-isolation (longer for slow-growing bacteria) [2] [1] |
| Key Advantage | Speed, high sensitivity, automation potential, works directly from some specimens [47] | Hypothesis-free; detects all resistance mechanisms, including novel ones; provides Minimum Inhibitory Concentration (MIC) [1] [7] |
| Critical Limitation | Target-dependent; cannot detect novel mechanisms; can overestimate resistance if gene is not expressed [2] [47] | Slow; requires viable, isolated pathogens; labor-intensive [6] [1] |
| Error Types | Major errors (false resistance) due to unexpressed genes; false susceptibility due to untargeted mechanisms [47] | Minor and major errors possible, often related to standardization and interpretation [2] |
The performance gap is further quantified in validation studies that measure essential agreement (EA) and categorical agreement (CA) with reference methods. While many commercial molecular assays demonstrate high CA for specific, common resistance markers, their overall clinical utility can be compromised by the issues outlined in Table 1. For example, a molecular test for methicillin resistance targeting the mecA gene is highly reliable, as the presence of mecA is a strong predictor of the phenotype [47]. In contrast, a molecular test panel for Gram-negative resistance might successfully detect common extended-spectrum beta-lactamase (ESBL) genes but miss resistance mediated by upregulated efflux pumps or porin mutations, leading to a false susceptible result [7]. This variability in predictive value across different organism-drug combinations must be carefully considered when implementing molecular AST.
Table 2: Quantitative Performance Metrics from Experimental Studies
| Resistance Mechanism / Organism | Molecular Method | Key Performance Finding | Experimental Implication |
|---|---|---|---|
| Carbapenemase-producing Enterobacterales | PCR-based panel for common carbapenemase genes (KPC, NDM, VIM, OXA-48, IMP) | Identifies a carbapenemase gene in <50% of phenotypically carbapenem-resistant isolates [7] | High rate of false negatives due to undefined or novel resistance mechanisms. |
| Methicillin Resistance in S. aureus (MRSA) | PCR for mecA gene | Considered the gold standard for detection, high correlation with phenotypic resistance [47] | Demonstrates the high predictive value when a single, definitive genetic determinant exists. |
| Gram-negative bacilli bacteremia | Multiplex PCR for ID and resistance markers (e.g., CTX-M, KPC) | Used in AST stewardship to rapidly de-escalate from carbapenems if no markers found [47] | Highlights utility for "rule-out" but not for "rule-in" of all possible resistances. |
Detailed Experimental Protocols for Validation
To rigorously assess the limitations of molecular methods, a standardized comparative validation against reference phenotypic methods is essential. The following protocols detail the key experiments for evaluating the predictive value of genotypic AST.
Protocol 1: Discrepancy Analysis Between Genotype and Phenotype
This protocol is designed to identify and resolve results where molecular and phenotypic AST results are not in agreement [2] [47].
- Sample Collection: Collect a representative set of clinical bacterial isolates (e.g., 200-500 isolates), ensuring inclusion of multidrug-resistant pathogens like ESBL-producing E. coli, MRSA, and carbapenem-resistant Pseudomonas aeruginosa.
- Reference Phenotypic Testing:
- Perform reference broth microdilution (BMD) according to CLSI/EUCAST guidelines [2] [1].
- Use cation-adjusted Mueller-Hinton broth.
- Prepare a standardized inoculum of 5 x 10^5 CFU/mL.
- Incubate at 35±2°C for 16-20 hours.
- Determine the MIC and interpret as Susceptible (S), Intermediate (I), or Resistant (R) using current breakpoints.
- Molecular Testing:
- Extract genomic DNA from a pure subculture of each isolate using a commercial bacterial DNA extraction kit.
- Perform a commercial or laboratory-developed multiplex PCR (or similar NAAT) for a panel of relevant resistance genes (e.g., mecA, vanA/B, blaCTX-M, blaKPC, blaNDM, blaOXA-48).
- Include appropriate positive and negative controls in each run.
- Data Analysis and Resolution:
- Compare results and categorize discrepancies:
- Major Error (False Resistance): Phenotype=S, Genotype=R (suggestive of an unexpressed gene).
- Very Major Error (False Susceptibility): Phenotype=R, Genotype=S (suggestive of an untargeted resistance mechanism).
- Resolve Discrepancies: For major errors, perform gene expression analysis (RT-PCR) or Western blot to confirm the lack of gene expression. For very major errors, use whole-genome sequencing (WGS) to identify the genetic basis of the untargeted resistance.
- Compare results and categorize discrepancies:
Protocol 2: Assessment of Clinical Impact in a Stewardship Program
This protocol evaluates the real-world consequences of using molecular AST for guiding therapy, specifically measuring its effect on optimizing antibiotic use [47].
- Study Design: Implement a prospective, controlled study in a high-acuity setting like an Intensive Care Unit (ICU).
- Intervention Arm:
- For positive blood cultures with Gram-negative bacilli, perform rapid molecular AST (e.g., a 1-2 hour PCR assay) directly from the blood culture bottle for identification and key resistance markers (e.g., CTX-M, carbapenemases).
- Report the molecular AST result to the antimicrobial stewardship team and treating physician.
- Record the antibiotic therapy pre- and post-reporting.
- Control Arm: Use a historical control or concurrent control group managed with conventional culture and phenotypic AST only.
- Outcome Measures:
- Primary Endpoint: Time to appropriate therapy (escalation or de-escalation).
- Secondary Endpoints: Duration of broad-spectrum antibiotic use (e.g., carbapenem days of therapy), length of hospital stay, and cost of antimicrobials.
- Data Analysis: Compare outcomes between the intervention and control arms using statistical methods like Kaplan-Meier analysis for time-to-event data and chi-square/t-tests for other endpoints. This quantifies the benefit of speed against the risk of genotypic-phenotypic discordance.
The Scientist's Toolkit: Key Reagents for AST Validation
Table 3: Essential Research Reagents for Comparative AST Studies
| Reagent / Material | Function in Experiment | Example Specification / Kit |
|---|---|---|
| Cation-Adjusted Mueller-Hinton Broth (CAMHB) | The standardized growth medium for reference broth microdilution, ensuring consistent cation concentrations that affect antibiotic activity [1]. | CLSI-compliant, prepared according to M07 guidelines. |
| Commercial DNA Extraction Kit | Isolates high-purity genomic DNA from bacterial isolates for downstream molecular analysis without inhibitors. | DNeasy Blood & Tissue Kit (Qiagen) or equivalent. |
| Multiplex PCR Resistance Panel | Simultaneously amplifies multiple pre-defined genetic targets for rapid detection of common resistance genes from purified DNA. | Commercial panels like BioFire FilmArray Blood Culture Identification panel or SeekPlex UTI-ESL panel. |
| Whole Genome Sequencing Service/Kit | Provides a hypothesis-free method to identify all resistance genes and mutations in a bacterial genome, used to resolve discordant results. | Illumina Nextera XT library prep kit with MiSeq sequencing; Oxford Nanopore MinION for rapid sequencing. |
| ATCC Quality Control Strains | Validates the correct performance of both phenotypic and molecular AST methods. Essential for quality assurance [1]. | E. coli ATCC 25922 (for phenotypic AST), S. aureus ATCC 29213 (for mecA PCR control). |
The limitations of molecular methods in reliably predicting antimicrobial phenotype from genotype are significant and inherent to their target-dependent design. The risks of both false resistance (from unexpressed genes) and false susceptibility (from untargeted mechanisms) mean that molecular AST cannot yet fully replace phenotypic testing as a comprehensive solution [2] [47]. Its greatest strength lies in its speed, making it an invaluable tool for specific, high-impact applications such as rapid screening for key resistance threats (e.g., MRSA, VRE) or for guiding early antimicrobial stewardship interventions in bloodstream infections when used as a "rule-out" test within a known local epidemiological context [47].
The future of AST does not lie in a contest between phenotypic and genotypic methods, but in their strategic integration. Molecular methods provide rapid, actionable intelligence, while phenotypic methods deliver the definitive, comprehensive result. Emerging technologies like whole-genome sequencing are bridging the gap by offering a more complete genotypic picture, but they still require phenotypic correlation for new mechanisms and for validating the clinical relevance of genetic findings [18] [1]. Furthermore, the development of rapid phenotypic technologies, such as microfluidics and automated microscopy, aims to provide the best of both worlds: the hypothesis-free nature of phenotype with a drastically reduced turnaround time [7]. For researchers and clinicians, a nuanced understanding of these limitations is paramount. The choice of AST method must be guided by the clinical question, the required speed, the local epidemiology, and, most critically, an awareness that the presence of a resistance gene is a powerful clue but not an absolute guarantee of therapeutic outcome.
Antimicrobial Susceptibility Testing (AST) is a critical laboratory technique used to determine the effectiveness of antimicrobial agents against specific microorganisms, guiding clinicians in selecting appropriate antimicrobial therapy [18]. The global rise of antimicrobial resistance (AMR), associated with nearly 5 million deaths annually, has intensified the need for accurate and timely AST [2] [49]. The diagnostic landscape is currently divided between traditional phenotypic methods, such as disk diffusion and broth microdilution, which have long turnaround times but are well-established, and molecular methods, which offer speed but have limitations in detecting novel resistance mechanisms [7] [2] [1].
The implementation of new AST technologies, particularly in clinical and research settings, faces significant barriers. A consensus statement in Nature Reviews Microbiology highlights that despite conceptual advances in rapid AST technologies, "there is no single major, or broadly accepted, technological breakthrough that leads the field of rapid AST platform development" due to multiple implementation barriers [49]. This analysis examines the comparative performance of traditional versus molecular AST methods through the lens of three critical implementation challenges: cost, required expertise, and workflow integration, providing a guide for researchers and drug development professionals navigating this complex field.
Comparative Analysis of AST Methodologies
Traditional Phenotypic Methods
Traditional phenotypic AST methods directly measure bacterial response to antimicrobial agents, providing functional assessment of resistance regardless of genetic mechanism [2]. These methods include disk diffusion, gradient diffusion, and both broth and agar dilution techniques [1]. The key strength of phenotypic testing lies in its ability to detect resistance emerging from any mechanism, including novel or unexpected pathways that genotypic methods might miss [50]. For instance, carbapenem-resistant bacteria may not carry a carbapenemase gene but demonstrate phenotypic resistance through porin switching, efflux pump upregulation, or overexpression of other β-lactamases [50].
The reference standard for phenotypic AST is broth microdilution, which determines the Minimum Inhibitory Concentration (MIC) - the lowest concentration of an antimicrobial that prevents visible growth [50]. MIC values are categorized using internationally recognized breakpoints from organizations like EUCAST and CLSI to classify pathogens as Susceptible (S), Susceptible with Increased Exposure (I), or Resistant (R) [1]. However, a significant limitation of conventional phenotypic methods is their extended turnaround time, typically requiring 16-48 hours or longer after initial bacterial isolation [7] [50].
Molecular AST Methods
Molecular AST methods detect specific genetic markers associated with antimicrobial resistance, such as resistance genes or mutations [49] [1]. These techniques include PCR-based assays, DNA microarrays, and whole-genome sequencing, offering rapid results often within 1-6 hours [2]. This speed represents a significant advantage for clinical decision-making in critical infections like sepsis, where delayed effective antibiotic therapy increases mortality [51] [49].
The fundamental limitation of molecular methods is their target-dependent nature; they can only detect known resistance mechanisms included in their design [7] [50]. This poses challenges for comprehensive resistance detection, as evidenced by studies showing that a carbapenemase gene is identifiable in fewer than 50% of bacteria found to be phenotypically carbapenem resistant [7]. Furthermore, the presence of a resistance gene does not always correlate with phenotypic expression due to variations in gene expression, regulation, or the presence of silent genes [50].
Table 1: Core Principles of Traditional vs. Molecular AST Methods
| Feature | Traditional Phenotypic Methods | Molecular Methods |
|---|---|---|
| Basis of Detection | Observable growth inhibition | Detection of specific resistance genes/mutations |
| Turnaround Time | 16-48 hours after isolation [50] | 1-6 hours [2] |
| Key Output | Minimum Inhibitory Concentration (MIC) | Presence/Absence of target genes |
| Detection Capability | All resistance mechanisms, including novel ones | Only known, targeted resistance mechanisms |
| Regulatory Standard | CLSI, EUCAST guidelines [1] | Varies; often requires phenotypic correlation |
Experimental Data and Performance Comparison
Accuracy and Detection Capabilities
Validation studies for novel AST platforms must demonstrate comparability to reference methods, with key metrics including essential agreement (comparable MIC values) and categorical agreement (same S/I/R categorization) [7]. Molecular methods excel for detecting specific, well-characterized resistance mechanisms like MRSA (mecA/mecC genes) or vancomycin resistance (vanA/vanB genes) [49]. However, their accuracy diminishes when facing unexpected resistance patterns or novel mechanisms.
Phenotypic methods maintain their position as the reference standard for comprehensive resistance detection. The iFAST (impedance-based Fast Antimicrobial Susceptibility Test), a novel phenotypic method, demonstrated consistency with classical broth microdilution across a range of antibiotics and bacterial species, including carbapenem-resistant K. pneumoniae, E. coli, A. baumannii, and P. aeruginosa [50]. This reliability across diverse pathogens and drug classes underscores the continuing value of phenotypic assessment.
Speed and Time-to-Result Comparisons
While molecular methods traditionally hold the speed advantage, advanced phenotypic systems are rapidly closing this gap. Technologies like the Accelerate Pheno system can provide AST results from positive blood culture in approximately 6 hours using morpho-kinetic time-lapse imaging [50]. Even more rapid phenotypic systems like Gradientech's QuickMIC and the iFAST system can determine MIC values within 2-4 hours using microfluidics and impedance-based detection, respectively [51] [50].
The critical time metric for clinical impact is the total turnaround time from specimen collection to final AST result [7]. Conventional workflow involves sequential processing: bacterial growth detection (up to 24h), identification (∼24h), and AST (4-24h) [7]. Both molecular and rapid phenotypic systems aim to compress this timeline, with some integrated systems combining identification and AST steps.
Table 2: Performance Comparison of Representative AST Technologies
| Technology/Platform | Method Type | Time to Result | Key Performance Metrics | Detection Range |
|---|---|---|---|---|
| Broth Microdilution | Traditional phenotypic | 16-24 h [50] | Reference standard for MIC determination | Comprehensive, mechanism-agnostic |
| Disk Diffusion | Traditional phenotypic | 18-24 h [1] | Categorical agreement with reference methods | Comprehensive, mechanism-agnostic |
| PCR-based Panels | Molecular | 1-6 h [2] | High accuracy for targeted genes | Limited to pre-defined genetic targets |
| Accelerate Pheno | Rapid phenotypic | ~6 h [50] | >90% essential agreement with reference | Comprehensive, mechanism-agnostic |
| QuickMIC | Rapid phenotypic | 2-4 h [51] | Comparable to conventional testing | Comprehensive, mechanism-agnostic |
| iFAST | Rapid phenotypic | <1 h [50] | Consistent with BMD for multiple drug classes | Comprehensive, mechanism-agnostic |
Detailed Experimental Protocols
Reference Broth Microdilution Method
The broth microdilution method remains the internationally recognized reference standard for phenotypic AST according to ISO 20776-1 [50]. The protocol requires preparing a standardized bacterial inoculum adjusted to 0.5 McFarland standard (approximately 1-5 × 10^8 CFU/mL) followed by dilution to achieve final testing density of 5 × 10^5 CFU/mL in cation-adjusted Mueller-Hinton broth [1]. Two-fold serial dilutions of antibiotics are prepared in microtiter plates, inoculated with the standardized bacterial suspension, and incubated at 35±2°C for 16-20 hours [1]. The MIC is determined as the lowest antibiotic concentration that completely inhibits visible growth. Quality control requires testing reference strains (e.g., ATCC controls) with each run to ensure accuracy and reproducibility [1].
Protocol for Impedance-Based Rapid AST (iFAST)
The iFAST method represents a novel rapid phenotypic approach that reduces testing time to approximately 1 hour [50]. The protocol begins with an inoculum from an overnight bacterial culture, which is resuspended in fresh growth medium and incubated for 30 minutes to ensure active division [50]. Bacteria are then exposed to antibiotics for 30 minutes, after which approximately 10^5 cells are analyzed individually using microfluidic impedance cytometry over 2-3 minutes [50]. The impedance measurements at multiple AC frequencies detect antibiotic-induced changes in bacterial electrical properties and morphology, which are analyzed to determine susceptibility profiles. This method has been validated for various antibiotic classes including β-lactams, aminoglycosides, fluoroquinolones, and polymyxins against Gram-negative organisms and MRSA [50].
Molecular Detection Protocol for Resistance Genes
A standard protocol for genotypic AST begins with nucleic acid extraction from bacterial isolates or directly from clinical specimens [1]. For PCR-based methods, amplification occurs using primers specific to targeted resistance genes (e.g., mecA for methicillin resistance, vanA/B for vancomycin resistance, carbapenemase genes like blaKPC, blaNDM) [49]. Reaction conditions follow manufacturer specifications with appropriate cycling parameters. Detection methods vary from gel electrophoresis to real-time fluorescence monitoring. Results are interpreted based on amplification curves or band presence, with strict controls including positive amplification controls and negative template controls [1]. While providing rapid results, this protocol requires prior knowledge of target resistance mechanisms and may not detect novel or unexpected resistance patterns [7].
Implementation Barrier Analysis
Cost Considerations
The economic aspects of AST implementation present significant barriers, particularly for newer technologies. Traditional methods like disk diffusion and manual broth microdilution have relatively low consumable costs but higher labor requirements [52] [1]. In contrast, automated and molecular systems typically involve substantial capital investment, with high-throughput automated AST systems representing particularly significant financial commitments [52]. Reagent costs for molecular tests and cartridge-based rapid systems also exceed those of conventional media and antibiotics [49].
The market for AST devices reflects these economic challenges. While the global AST device market is growing due to rising AMR concerns, cost remains a barrier to adoption, particularly in resource-limited settings [52]. As Professor Gian Maria Rossolini notes, for rapid AST systems to see widespread adoption, they "must be affordable and of validated superiority against conventional systems to justify this move" [51]. Cost-benefit analyses must consider not only test expenses but also potential savings from improved antibiotic stewardship, reduced hospital stays, and better patient outcomes [51].
Expertise and Personnel Requirements
Traditional AST methods demand significant technical expertise for proper execution and interpretation [49] [1]. Laboratory scientists must be proficient in standardization, quality control, and recognizing technical artifacts - skills that require specialized training and experience [49]. While automated systems reduce some manual technical requirements, they create needs for different expertise in instrument operation, maintenance, and troubleshooting [52].
Molecular methods introduce requirements for molecular biology expertise, including nucleic acid extraction, amplification techniques, and bioinformatics for sequence-based methods [1]. The complexity of these techniques can be prohibitive for smaller laboratories, contributing to what van Belkum et al. describe as "barriers that prevent the timely development and implementation of novel and rapid AST platforms in health-care settings" [50]. This expertise gap is particularly pronounced in low-resource settings, where only 1.3% of medical laboratories in 14 sub-Saharan countries offered any clinical bacteriology testing as of 2019 [7].
Workflow Integration Challenges
Integrating new AST technologies into established laboratory workflows presents substantial operational barriers [51] [49]. Laboratories must adapt their processes to accommodate different sample processing requirements, incubation times, and data management systems [51]. As Professor Rossolini observes, "Routine workflows would need to change" to implement rapid AST systems, though "the advantage is clear - faster information on AST, especially for critical care patients" [51].
Molecular methods often require separate, dedicated workspace to prevent contamination, while rapid phenotypic systems may need integration with existing identification platforms [49]. Sample processing workflows differ significantly between conventional culture-based methods and direct-from-specimen molecular tests, creating staffing and scheduling challenges [7]. Additionally, most clinical microbiologists are not yet ready to accept AST-only systems without pathogen identification, requiring integrated platforms or parallel testing workflows [49].
Diagram 1: Interrelationship of AST Implementation Barriers. The diagram illustrates how cost, expertise, and workflow barriers collectively contribute to delayed implementation of novel AST technologies.
The Scientist's Toolkit: Key Research Reagent Solutions
Table 3: Essential Research Reagents for AST Method Development
| Reagent/Material | Function in AST Development | Application Examples |
|---|---|---|
| Cation-Adjusted Mueller-Hinton Broth | Standardized growth medium for phenotypic AST | Reference broth microdilution methods [1] |
| Antimicrobial Gradient Strips | Create concentration gradients for MIC determination | Etest, MIC test strips [1] |
| Microfluidic Chips/Cassettes | Enable single-cell analysis and rapid testing | iFAST, QuickMIC systems [51] [50] |
| Impedance Cytometry Reagents | Detect biophysical changes in antibiotic-exposed bacteria | iFAST protocol [50] |
| Viability Staining Dyes | Differentiate live/dead bacteria for rapid endpoint detection | Flow cytometry-based AST [50] |
| Nucleic Acid Extraction Kits | Isolate DNA/RNA for genotypic resistance detection | PCR-based AST methods [1] |
| Target-Specific Primers/Probes | Amplify and detect resistance genes | Molecular panels for MRSA, VRE, ESBLs [49] |
| Quality Control Reference Strains | Validate test performance and reproducibility | ATCC strains for CLSI/EUCAST guidelines [1] |
The implementation of AST technologies presents a complex trade-off between the comprehensive, mechanism-agnostic detection of traditional phenotypic methods and the speed of molecular approaches, with newer rapid phenotypic systems bridging some of these differences. The barriers of cost, expertise, and workflow integration are interconnected, requiring holistic solutions rather than isolated technological fixes [49].
For researchers and drug development professionals, the choice of AST methodology must align with specific application requirements, considering whether comprehensive resistance detection or rapid result generation takes priority. Future development should focus on creating more accessible, cost-effective platforms that integrate seamlessly into diverse laboratory workflows while maintaining the reliability of conventional methods. As the field evolves, technologies that successfully address these implementation barriers will play a crucial role in combating the global antimicrobial resistance crisis.
Antimicrobial resistance (AMR) represents one of the foremost global health challenges of the 21st century, complicating the treatment of infectious diseases and contributing significantly to morbidity and mortality worldwide [6]. Within this complex landscape, heteroresistance has emerged as a particularly insidious and diagnostically challenging phenomenon. Heteroresistance occurs when a single bacterial strain harbors both susceptible and resistant subpopulations, creating a scenario where standard antimicrobial susceptibility testing (AST) methods may classify an isolate as susceptible despite the presence of resistant cells that can expand during antibiotic treatment [53]. This phenomenon is defined by the presence of a small, resistant subpopulation of bacteria with a significant increase (often an 8-fold or greater rise) in minimal inhibitory concentration (MIC) for a drug relative to the main susceptible population [53].
The clinical implications of undetected heteroresistance are profound. Mounting evidence links heteroresistance to increased risk of treatment failure across diverse bacterial pathogens including Staphylococcus aureus, Acinetobacter baumannii, and Klebsiella pneumoniae [53]. For instance, a retrospective analysis of pediatric leukemia patients with bloodstream infections caused by S. epidermidis revealed that vancomycin heteroresistance significantly increased the risk of treatment failure and poor clinical response [53]. Similarly, in animal models, colistin—a last-line antibiotic for gram-negative infections—failed to rescue mice infected with heteroresistant strains of carbapenem-resistant K. pneumoniae, despite the isolates appearing susceptible in standard laboratory tests [53].
The detection of heteroresistance presents substantial challenges for clinical microbiologists and researchers. The unstable nature of heteroresistance means that resistant subpopulations may be present during antibiotic treatment but become undetectable when bacteria are cultured on antibiotic-free media for standard AST [53]. This creates a "diagnostic nightmare" where an isolate may be classified as susceptible in the laboratory while behaving as resistant in a clinical context [53]. As noted by Dr. David Weiss, Director of the Emory Antibiotic Resistance Center, "I was taught if you pick a single colony and grow [it up], every [cell] is doing the same thing in there. And it looks like that is not the case, and it is way more complicated" [53].
This article provides a comprehensive comparison of traditional and emerging AST methods for detecting heteroresistant subpopulations, focusing on their relative sensitivities, technical requirements, and applicability in both research and clinical settings.
Methodological Comparison: Detection Capabilities for Heteroresistant Subpopulations
Established and Emerging Technologies
The landscape of technologies capable of detecting heteroresistance spans conventional phenotypic methods, molecular techniques, and emerging innovative platforms. Each approach offers distinct advantages and limitations in sensitivity, turnaround time, and technical requirements, as summarized in Table 1.
Table 1: Comparison of AST Methods for Detecting Heteroresistant Subpopulations
| Method Category | Specific Technology | Detection Limit for Resistant Subpopulations | Time to Result | Key Advantages | Major Limitations |
|---|---|---|---|---|---|
| Reference Phenotypic | Population Analysis Profile (PAP) | ~0.0001% (theoretical) [53] | 3-5 days [53] | Quantitative; considers frequency of resistant subpopulation [53] | Labor-intensive; time-consuming; not clinically feasible [53] |
| Conventional Phenotypic | Broth Microdilution (BMD) | ~10.15% ± 4.70% [54] | 16-24 hours [2] | Standardized; reference method [2] | Limited sensitivity for rare subpopulations [54] |
| Automated Phenotypic | VITEK Systems | <44% detection rate for heteroresistant subpopulations [54] | 6-24 hours [2] | Automated; integrated with ID [2] | Poor sensitivity for heteroresistance [54] |
| Enhanced Phenotypic | EZMTT Method | ~1.13% ± 0.30% [54] | 16-24 hours [54] | 5-20x more sensitive than BMD; detects drug-resistant subpopulations [54] | Limited clinical validation to date [54] |
| Genotypic | Droplet Digital PCR/Whole Genome Sequencing | Varies with target abundance and technical approach | 1-6 hours (PCR) to days (WGS) [2] | Rapid; comprehensive for known mechanisms [53] | May miss novel mechanisms; correlation with phenotype not guaranteed [53] [55] |
| Novel Platforms | Microscopy with AI Analysis | Single-cell level [53] | Hours [53] | Extreme sensitivity; quantitative [53] | Early development; not standardized [53] |
Sensitivity Analysis and Detection Thresholds
The critical parameter for evaluating heteroresistance detection methods is their sensitivity—the minimum proportion of resistant cells within a predominantly susceptible population that can be reliably detected. Conventional AST methods like broth microdilution (BMD) have a fundamental detection limit of approximately 10.15% ± 4.70% bacterial growth, meaning resistant subpopulations below this threshold typically go undetected [54]. This limitation explains why heteroresistance can lead to major discrepancies between laboratory results and clinical outcomes, as resistant subpopulations below this threshold can nonetheless expand during antibiotic therapy and cause treatment failure [53].
Recent technological innovations have demonstrated substantially improved sensitivity for detecting resistant subpopulations. The optimized Easy and Zooming MTT (EZMTT) method, for instance, achieves a remarkable detection limit of approximately 1.13% ± 0.30% growth, representing a 5- to 20-fold enhancement in sensitivity compared to conventional BMD [54]. This improved sensitivity enables the detection of drug-resistant subpopulations that were previously undetectable by the gold standard BMD method [54]. In one compelling demonstration, the EZMTT method achieved 100% detection rate for 13 drug-resistant subpopulations in a clinical K. pneumoniae strain (KP007), compared to 77% by BMD and less than 44% by the VITEK automated system [54]. Furthermore, when testing a series of artificially generated heteroresistant strains, the EZMTT method proved more than 3,000 times more effective at detecting resistant subpopulations compared to the VITEK system [54].
At the most sensitive extreme, emerging approaches that combine microscopy with artificial intelligence promise detection at the single-cell level, potentially identifying resistant subpopulations regardless of their frequency within a bacterial population [53]. While these methods remain in development and lack standardization, they represent the future direction for maximizing sensitivity in heteroresistance detection.
Experimental Protocols for Detecting Heteroresistance
Gold Standard Method: Population Analysis Profile (PAP)
The Population Analysis Profile (PAP) is widely considered the reference method for detecting heteroresistance, despite its impracticality for clinical use [53].
Table 2: Key Research Reagents for Population Analysis Profiling
| Reagent/Equipment | Function in Protocol | Technical Specifications |
|---|---|---|
| Mueller-Hinton Agar | Solid growth medium for bacterial cultivation | Prepared according to CLSI standards with defined cation concentrations |
| Antibiotic Stock Solutions | Creating concentration gradients for selection | Two-fold increasing concentrations spanning sub-MIC to resistant levels |
| Automated Spiral Plater | Even distribution of bacterial suspension | Deposits precise volumes in logarithmic pattern across agar surface |
| Colony Counting System | Quantification of viable bacteria at each antibiotic concentration | Automated or manual enumeration of colony-forming units (CFU) |
Protocol Overview:
- Prepare agar plates with two-fold increasing concentrations of the antibiotic of interest, spanning from below the expected MIC to well above the clinical breakpoint.
- Standardize the bacterial suspension to approximately 10^8 CFU/mL (0.5 McFarland standard), then perform a series of 10-fold dilutions.
- Plate 100 μL of each dilution onto the corresponding antibiotic-containing agar plates and antibiotic-free control plates.
- Incubate plates at 35±2°C for 24-48 hours based on the organism's growth characteristics.
- Enumerate viable colonies on each plate and calculate the proportion of bacteria surviving at each antibiotic concentration.
- Plot the log10 of CFU/mL against antibiotic concentration to generate the population analysis profile.
- Classify isolates based on the presence of distinct subpopulations growing at antibiotic concentrations above the established breakpoint.
The PAP method's key advantage is its ability to quantitatively determine the frequency of resistant subpopulations, which is essential for understanding the potential clinical significance of heteroresistance [53]. However, the method requires 3-5 days to complete, is labor-intensive, and is prohibitively expensive for routine clinical use, limiting its application primarily to research settings [53].
Enhanced Phenotypic Detection: EZMTT Method
The EZMTT method represents a significant advancement in phenotypic detection of heteroresistance, offering enhanced sensitivity while maintaining compatibility with standard laboratory workflows [54].
Table 3: Research Reagents for EZMTT Antimicrobial Susceptibility Testing
| Reagent/Equipment | Function in Protocol | Technical Specifications |
|---|---|---|
| MTT Reagent | Metabolic activity indicator | (3-[4,5-dimethylthiazol-2-yl]-2,5-diphenyl tetrazolium bromide) |
| Cation-Adjusted Mueller-Hinton Broth | Liquid growth medium for bacteria | Prepared according to CLSI standards for BMD |
| 96-Well Microtiter Plates | Platform for miniaturized dilution testing | U-bottom or flat-bottom based on reading method |
| Microplate Spectrophotometer | Absorbance measurement for quantitative results | Capable of reading at 450nm and reference wavelengths |
Protocol Overview:
- Prepare antibiotic serial dilutions in cation-adjusted Mueller-Hinton broth in 96-well microtiter plates according to CLSI standards for BMD.
- Adjust bacterial inoculum to approximately 5×10^5 CFU/mL in sterile saline or broth.
- Add standardized inoculum to each well of the microdilution plate, ensuring final testing concentration of approximately 5×10^4 CFU/mL.
- Incubate plates at 35±2°C for 16-20 hours based on the organism.
- Add MTT reagent (0.2 mg/mL final concentration) to each well and incubate for 30-60 minutes to allow formazan crystal formation by metabolically active cells.
- Add solubilization solution (typically 10% SDS in 0.01N HCl or DMSO) to dissolve formazan crystals.
- Measure absorbance at 450nm using a microplate spectrophotometer.
- Calculate MIC values by identifying the lowest antibiotic concentration that inhibits 90% of bacterial growth compared to drug-free controls.
- Identify heteroresistance by analyzing growth patterns at sub-MIC concentrations that suggest the presence of resistant subpopulations.
The enhanced sensitivity of the EZMTT method stems from its improved signal detection for low levels of metabolic activity, enabling more accurate quantification of small resistant subpopulations that would be missed by conventional BMD [54]. Validation studies demonstrate excellent agreement between EZMTT and BMD, with overall positive and negative compliance rates of 98.94% and 99.58%, respectively, and kappa values of 0.981 (95% CI: 0.974-0.988) [54].
Technological Workflows and Signaling Pathways in Heteroresistance Detection
The following diagrams illustrate key methodological workflows and conceptual frameworks for understanding heteroresistance detection, created using DOT language with compliance to the specified formatting requirements.
Diagram 1: Heteroresistance Detection Workflow Comparison. This workflow illustrates the divergent pathways between standard AST and enhanced detection methods for heteroresistance.
Diagram 2: Relative Sensitivity Hierarchy of AST Methods. This diagram illustrates the comparative sensitivity of different AST methods for detecting heteroresistant subpopulations, based on quantitative detection limit data from experimental studies.
The mechanistic basis of heteroresistance involves diverse biological pathways that can be independently detected by various methodologies. These include gene amplification (e.g., increased copies of β-lactamase genes in gram-negative bacteria), mutations in antibiotic targets, altered expression of transporters or core cellular components, and modification of co-factors essential for antibiotic function [53]. Critically, multiple resistance systems can simultaneously contribute to heteroresistance within a single bacterial population, creating complex phenotypes that challenge standard detection methods [53].
The detection of heteroresistant subpopulations represents a critical frontier in the battle against antimicrobial resistance. While conventional AST methods remain the foundation of clinical microbiology, their inherent sensitivity limitations necessitate complementary approaches when heteroresistance is clinically suspected. The emerging methodological landscape offers a spectrum of options balancing sensitivity, throughput, and clinical feasibility.
Enhanced phenotypic methods like EZMTT demonstrate that significant improvements in detection sensitivity (5- to 20-fold over conventional BMD) are achievable within standard laboratory workflows [54]. For research applications and critical clinical scenarios, the population analysis profile remains the gold standard, despite its practical limitations [53]. Meanwhile, emerging technologies combining single-cell analysis with artificial intelligence promise unprecedented sensitivity but require further development and standardization before clinical implementation [53].
The optimal approach to heteroresistance detection depends on the clinical context, available resources, and specific pathogen-antibiotic combinations of interest. While routine screening for heteroresistance remains impractical with current technologies, targeted application of enhanced detection methods for high-risk scenarios offers a pragmatic strategy for improving patient outcomes. As research in this field advances, the integration of sensitive phenotypic methods with genotypic characterization will likely provide the most comprehensive approach for understanding and detecting this clinically significant phenomenon.
Head-to-Head: Validating Performance and Comparative Analysis of AST Platforms
Frameworks for Clinical Validation and Regulatory Approval
The escalating global threat of antimicrobial resistance (AMR) has intensified the focus on Antimicrobial Susceptibility Testing (AST), a cornerstone of effective infectious disease treatment and antimicrobial stewardship [6]. The diagnostic landscape is rapidly evolving, moving from traditional phenotypic methods like disk diffusion and broth microdilution toward innovative molecular and next-generation rapid phenotypic technologies [7] [1]. This shift necessitates robust, clear frameworks for the clinical validation and regulatory approval of these new diagnostics. For researchers, scientists, and drug development professionals, navigating these frameworks is critical to successfully translating promising technologies from the laboratory into clinical practice. A thorough understanding of the requirements set forth by bodies like the Clinical and Laboratory Standards Institute (CLSI), the European Committee on Antimicrobial Susceptibility Testing (EUCAST), the U.S. Food and Drug Administration (FDA), and the Indian Council of Medical Research (ICMR) is not merely a regulatory hurdle but a fundamental component of developing reliable, impactful diagnostic tools that can ultimately improve patient outcomes and combat AMR [56] [57].
Foundational Regulatory and Standards Organizations
The validation and approval of AST diagnostics are governed by a network of international standards organizations and regional regulatory bodies. These entities provide the guidelines and specifications that ensure the accuracy, reliability, and clinical utility of AST methods.
Table 1: Key Organizations Governing AST Validation and Standards
| Organization | Primary Role in AST Validation & Regulation |
|---|---|
| Clinical and Laboratory Standards Institute (CLSI) | Develops globally recognized standards and guidelines (e.g., CLSI M52) for verifying commercial microbial identification and AST systems [57]. |
| European Committee on Antimicrobial Susceptibility Testing (EUCAST) | Defines European standards for AST, including breakpoints and methodologies for disk diffusion and development of verification isolate sets [57]. |
| U.S. Food and Drug Administration (FDA) | Grants market authorization (e.g., via 510(k) clearance) for IVD tests in the United States, with specific requirements for study design [7]. |
| Indian Council of Medical Research (ICMR) | Provides national guidance, such as the 2025 framework for validating rapid diagnostics for pathogen identification and AST, aligning with Medical Device Rules, 2017 [56]. |
| International Organization for Standardization (ISO) | Publishes international standards, such as ISO 15189, which outlines requirements for quality and competence in medical laboratories [57]. |
Core Frameworks for Clinical Validation
Clinical validation of an AST system is a multi-faceted process designed to demonstrate that the test reliably predicts a microorganism's phenotypic response to an antimicrobial agent in a clinical setting. The process can be broken down into key phases and performance metrics.
Phases of Clinical Validation
A comprehensive framework for AST diagnostic development extends from early research to post-market surveillance. One review synthesizes this pipeline into distinct phases of clinical validation [7]:
- Phase I (Pre-Clinical/Analytical): Focuses on initial proof-of-concept and analytical sensitivity/specificity using a limited set of banked isolates.
- Phase II (Assay Locking): Involves validating the finalized assay against a larger, retrospective collection of clinical isolates with well-characterized resistance mechanisms.
- Phase III (Clinical Trial): Represents a prospective clinical trial where the test is evaluated in a real-world clinical setting, often compared to a reference standard.
- Phase IV (Post-Market): Entails ongoing surveillance after regulatory approval to monitor real-world performance and identify any rare errors or emerging limitations.
Performance Metrics and Verification Protocols
For a laboratory to introduce a new, commercially available AST system, it must perform a local verification to ensure the system performs as specified by the manufacturer. The CLSI M52 guideline provides the definitive protocol for this process [57]. The core of this verification lies in assessing accuracy and precision (reproducibility) against a reference method.
Table 2: Key Performance Metrics for AST System Verification
| Metric | Definition | Acceptance Criteria |
|---|---|---|
| Categorical Agreement (CA) | The percentage of isolates where the susceptibility category (Susceptible-S, Intermediate-I, Resistant-R) matches the reference method. | ≥ 90% agreement [57]. |
| Essential Agreement (EA) | The percentage of Minimum Inhibitory Concentration (MIC) results that are within ±1 doubling dilution (or ±2 for yeast) of the reference MIC. | ≥ 90% agreement [57]. |
| Very Major Error (VME) | Occurs when the new test result is "Susceptible" but the reference result is "Resistant." | < 3% of resistant isolates [57]. |
| Major Error (ME) | Occurs when the new test result is "Resistant" but the reference result is "Susceptible." | < 3% of susceptible isolates [57]. |
| Precision (Reproducibility) | The ability of the test to yield consistent results when repeated. | ≥ 95% agreement for category and MIC within ±1 doubling dilution [57]. |
The scope of the verification study depends on the nature of the change in the laboratory. A comprehensive verification (requiring a minimum of 30 isolates) is needed for a new AST system or a change in testing method, whereas a limited verification (requiring a minimum of 10 isolates) may suffice for adding a new antimicrobial agent to an existing, verified method [57].
Comparative Analysis: Traditional vs. Molecular vs. Next-Gen Phenotypic AST
The choice of AST methodology significantly influences the validation strategy, as each technology has distinct strengths, weaknesses, and regulatory considerations.
Table 3: Comparison of AST Methodologies and Their Validation Pathways
| Aspect | Traditional Phenotypic Methods | Molecular/Genotypic Methods | Next-Gen Rapid Phenotypic Methods |
|---|---|---|---|
| Technology Principle | Measures observable bacterial growth inhibition (e.g., disk diffusion, broth microdilution) [1]. | Detects specific genetic markers associated with resistance (e.g., PCR, NAATs, WGS) [6] [58]. | Measures early bacterial growth/viability using sensitive detection (e.g., microscopy, microfluidics, mass spectrometry) [7] [58]. |
| Time to Result | 16-24 hours after isolate purification [58]. | A few hours, potentially direct from specimen [58]. | Aim for < 8 hours, faster than conventional methods [7]. |
| Key Validation Focus | Demonstration of equivalence to reference broth microdilution for MIC and category [57]. | Analytical sensitivity/specificity for each target; correlation to phenotype can be complex [58]. | Validating rapid readout against reference method; managing biological factors like lag phase [58]. |
| Primary Regulatory Challenge | Well-established pathways; high reproducibility but slow [1]. | Limited to known targets; may overcall resistance; poor for polygenic resistance in Gram-negatives [58]. | Standardizing TAT reporting from specimen collection; proving clinical utility of faster results [7]. |
| Best Application | Gold standard; routine use in clinical labs [1]. | Rapid detection of high-consequence resistance (e.g., MRSA, carbapenemases) [58]. | Closing the "AST gap" in sepsis; enhancing antimicrobial stewardship [7]. |
Experimental Protocols for AST Validation
A robust validation study requires a meticulously planned experimental design. The following protocol, based on CLSI M52, outlines the core steps for verifying a commercial AST system [57].
Detailed Verification Methodology
1. Isolate Selection and Preparation:
- Select a minimum of 30 clinical isolates for a comprehensive verification. The isolate panel should represent the species and resistance mechanisms relevant to the antimicrobial agents being verified [57].
- Include strains with relevant resistance mechanisms (e.g., ESBL, carbapenemases) to challenge the assay. Sources can include clinical isolates, proficiency testing isolates, or strains from reference banks like the CDC-FDA AR Bank or EUCAST panels [57].
- Prepare a standardized inoculum suspension for each test isolate according to the manufacturer's instructions, typically adjusted to a 0.5 McFarland standard.
2. Reference Method Testing:
- The reference method can be a previously verified and FDA-cleared AST system, or a CLSI-defined reference method such as broth microdilution or agar dilution [57].
- Test all selected isolates using the reference method in parallel with the new AST system.
3. New AST System Testing:
- Inoculate and run the test samples on the new AST system strictly following the manufacturer's instructions for use.
- Ensure that quality control (QC) strains are tested every day of the verification process to ensure proper system function [57].
4. Data Analysis and Interpretation:
- For each organism-antimicrobial combination, compare the results from the new system to the reference method.
- Calculate Categorical Agreement (CA), Essential Agreement (EA), and the rates of Very Major Errors (VME) and Major Errors (ME) as defined in Table 2.
- The verification is successful if the performance meets or exceeds the predefined acceptance criteria for all metrics.
AST Verification Workflow
The Scientist's Toolkit: Essential Research Reagents and Materials
A successful AST validation study relies on a suite of well-characterized biological and material resources.
Table 4: Essential Research Reagents for AST Validation Studies
| Reagent/Material | Function in Validation | Specific Examples |
|---|---|---|
| Quality Control (QC) Strains | Verifies daily performance and precision of the AST system; ensures reagents are functioning properly. | E. coli ATCC 25922, P. aeruginosa ATCC 27853, S. aureus ATCC 29213 [57]. |
| Characterized Clinical Isolates | Serves as the test panel for evaluating accuracy; challenges the system with relevant resistance phenotypes. | Isolates with defined mechanisms like ESBL, carbapenemase-production, or methicillin resistance [57]. |
| Reference Isolate Banks | Provides freely available, highly characterized strains with known resistance mechanisms for standardized verification. | CDC & FDA Antibiotic Resistance (AR) Isolate Bank; EUCAST panels of phenotypically defined strains [57]. |
| Standardized Growth Media | Provides a consistent and optimal environment for bacterial growth during AST, crucial for reproducible MIC results. | Cation-adjusted Mueller-Hinton Broth (CAMHB), Muller Hinton Agar (MHA) [1]. |
The pathway to clinical validation and regulatory approval for AST diagnostics is structured yet dynamic, evolving alongside technological advancements. A successful strategy is built upon a deep understanding of the frameworks established by CLSI, EUCAST, FDA, and other regional bodies like the ICMR. For researchers and developers, a methodical approach involving careful isolate selection, rigorous comparison to reference methods, and meticulous analysis of performance metrics (CA, EA, VME, ME) is non-negotiable. As the field pivots toward rapid phenotypic and complex genotypic assays, the validation paradigms may adapt, but the core principles of demonstrating accuracy, precision, and clinical utility will remain the bedrock of bringing effective new tools to the frontline in the fight against antimicrobial resistance.
Antimicrobial Susceptibility Testing (AST) is a critical pillar in clinical microbiology, providing the essential data to guide effective antimicrobial therapy and combat the growing threat of antimicrobial resistance (AMR) [1]. The core purpose of AST is to determine the susceptibility of a pathogenic microorganism to a panel of antimicrobial drugs, typically categorized as susceptible (S), intermediate (I), or resistant (R) [1]. This process is vital not only for individual patient care but also for antibiotic stewardship, epidemiological surveillance, and tracking emerging resistance trends [2]. The current landscape of AST methodologies is broadly divided into two camps: traditional phenotypic methods, which assess the observable growth response of bacteria to antibiotics, and modern molecular methods, which detect specific genetic markers associated with resistance [6].
The debate between these approaches centers on a fundamental trade-off. Traditional methods, such as disc diffusion and broth microdilution, are considered the gold standard for phenotypic profiling but are often hampered by long turnaround times, typically requiring 18 to 24 hours or more after initial bacterial isolation [1] [2]. In contrast, molecular techniques offer the promise of rapid results—sometimes within hours—by directly detecting resistance genes, but they may not always correlate with the expressed phenotype and are limited to known, pre-defined genetic targets [1] [6]. This guide provides a objective comparison of these methodologies based on the critical metrics of turnaround time, sensitivity, and cost-effectiveness, framing the analysis within the broader research context of optimizing AST for both clinical utility and laboratory efficiency.
Comparative Metrics Analysis
A quantitative comparison of key performance metrics reveals the distinct strengths and limitations of each AST method.
Table 1: Comparison of AST Method Turnaround Times
| Method Category | Specific Method/System | Average Turnaround Time (TAT) | Key Notes |
|---|---|---|---|
| Traditional Phenotypic | Disk Diffusion / Broth Microdilution [2] | 18 - 24 hours (after isolation) | Considered the reference standard. |
| Automated Phenotypic | BD Phoenix, VITEK 2 [46] | 9 - 19 hours (analysis time) | Widely used in clinical labs. |
| Rapid Phenotypic | QuickMIC [46] | ~3 hours (analysis time) | Ultra-rapid, growth-based system. |
| Rapid Phenotypic | Accelerate Pheno [59] | ~7 hours (for AST) | Includes ID (90 min) + AST. |
| Molecular | BioFire FilmArray BCID [59] | ~1 hour (for ID & resistance genes) | Does not provide phenotypic MIC. |
Table 2: Comparison of AST Method Sensitivity, Specificity, and Cost
| Method Category | Reported Sensitivity / Specificity (for ID) | Reported Categorical Agreement (CA) / Essential Agreement (EA) (for AST) | Relative Cost & Throughput |
|---|---|---|---|
| Traditional Phenotypic | N/A (Phenotypic gold standard) | N/A (Reference method for AST) | Low reagent cost, but high labor cost; high throughput possible [60]. |
| Rapid Phenotypic | QuickMIC: Not specified for ID [46] | QuickMIC: >95% CA/EA vs. routine systems [46] | N/A |
| Rapid Phenotypic | Accelerate Pheno: 97.9% / 99.9% [59] | Accelerate Pheno (Gram-negatives): 90.3% CA / 93.2% EA [59] | N/A |
| Molecular | BioFire BCID/BCID2: 100% / 100% [59] | N/A (Does not perform phenotypic AST) | High cost per test; very high throughput [60]. |
Key Metric Insights
- Turnaround Time (TAT): Molecular methods provide the fastest results for identification and detection of specific resistance markers. Rapid phenotypic systems are bridging the gap, offering same-shift results with full phenotypic profiles, a significant improvement over traditional and automated systems [46] [59].
- Sensitivity and Specificity: Molecular methods like BCID2 demonstrate excellent sensitivity and specificity for identifying targeted pathogens and resistance genes from positive blood cultures [59]. Advanced phenotypic systems like the Accelerate Pheno and QuickMIC show strong categorical agreement with reference methods, validating their accuracy for susceptibility reporting [46] [59].
- Cost-Effectiveness: The high cost of automated and molecular AST systems can be a barrier to adoption [60]. While traditional methods have lower reagent costs, they are labor-intensive. The cost-benefit analysis must therefore factor in the potential for improved patient outcomes and reduced antibiotic misuse through faster results.
Experimental Protocols and Methodologies
The comparative data presented in the previous section are derived from standardized experimental protocols designed to evaluate AST system performance in a clinical microbiology context.
Multicenter Evaluation of a Rapid AST System
A 2024 study evaluated the performance of the QuickMIC system against routine automated systems (BD Phoenix, VITEK 2, MicroScan) across clinical laboratories in the EU and USA [46].
- Sample Preparation: The study utilized leftover clinical samples from positive blood cultures (PBCs) containing Gram-negative bacteria. Species identification was first confirmed using MALDI-TOF MS [46].
- Testing Protocol: Each PBC sample was tested concurrently on the QuickMIC system and the site's routine AST system. This direct parallel testing allowed for a head-to-head comparison of time-to-result and result agreement without workflow interruptions [46].
- Data Analysis: Essential Agreement (EA) and Categorical Agreement (CA) were calculated by comparing MIC values and susceptibility categories (S/I/R) from QuickMIC with those from the routine systems. EUCAST clinical breakpoints were used for interpretation. Turnaround time was calculated from the time of blood culture positivity to the availability of an actionable AST result [46].
Comparative Evaluation of Molecular vs. Phenotypic Panels
A 2021 study compared the Accelerate Pheno system and BioFire FilmArray panels directly from positive blood cultures [59].
- Sample Preparation: Fresh, de-identified positive blood culture samples were enrolled within 8 hours of positivity. Specimens were also subcultured to obtain pure colonies for reference method testing [59].
- Reference Methods: Matrix-Assisted Laser Desorption Ionization Time-of-Flight Mass Spectrometry (MALDI-TOF MS) served as the reference standard for microbial identification. Broth microdilution (BMD) was the reference standard for Antimicrobial Susceptibility Testing [59].
- Testing Protocol: Each sample was processed using the Accelerate Pheno system for combined ID and AST, and the FilmArray BCID or BCID2 panel for ID and resistance gene detection. An additional "direct AST" was performed using the VITEK 2 system directly from the blood culture broth [59].
- Performance Metrics: For ID, sensitivity and specificity were calculated against MALDI-TOF MS. For AST, essential and categorical agreement were calculated against BMD. Hands-on time and total turnaround time were also recorded for each method [59].
Research Reagent Solutions
The following table details key reagents and materials essential for conducting the experiments cited in this comparison.
Table 3: Essential Research Reagents and Materials for AST Evaluation
| Item Name | Function in Experiment | Specific Example (from cited studies) |
|---|---|---|
| Blood Culture Bottles | Supports the growth of microorganisms from blood samples. | BACTEC Plus Aerobic/F Medium, BACTEC Lytic/10 Anaerobic/F Medium [59] |
| Culture Media | Supports bacterial growth for isolation and purity checks. | Trypticase Soy Agar with 5% sheep’s blood (SBA) [59] |
| Identification System | Determines the genus and species of the isolated pathogen. | MALDI-TOF MS (Bruker MALDI Biotyper, VITEK-MS) [46] [59] |
| Automated AST Panels | Contains antibiotics in predefined concentrations for MIC determination. | BD Phoenix (NMIC 306), VITEK 2 (AST-N330), MicroScan (Neg MDR Combo 100) [46] |
| Rapid AST Cassettes | Microfluidics-based platform for ultra-rapid phenotypic AST. | QuickMIC GN Cassette [46] |
| Molecular Identification Panels | Multiplexed PCR for rapid detection of pathogens & resistance genes. | BioFire FilmArray BCID and BCID2 Panels [59] |
Method Workflow and Logical Pathway
The following diagram illustrates the logical decision-making pathway and technical workflows for selecting between traditional and molecular AST methods, based on common research and clinical scenarios.
AST Method Selection Workflow
The comparative analysis of AST methods underscores that there is no single superior technology for all scenarios. The choice between traditional phenotypic, rapid phenotypic, and molecular methods is contingent on the specific clinical or research question, driven by the trade-offs between speed, comprehensiveness, and cost.
- Molecular methods are unparalleled for speed in screening for specific, high-consequence resistance genes (e.g., during an outbreak investigation of carbapenem-resistant Enterobacterales) [6] [59]. Their limitation lies in providing a genotypic prediction that may not always manifest as a resistant phenotype.
- Traditional phenotypic methods remain the indispensable gold standard for comprehensive susceptibility profiling, offering flexibility and lower reagent costs, albeit at the expense of time [1] [2].
- Rapid phenotypic systems represent a transformative advancement, dramatically shortening the time to a reliable, phenotypic AST result. Technologies like QuickMIC and Accelerate Pheno are closing the gap between the slow, gold-standard methods and the fast, but genetically limited, molecular panels [46] [59].
The future of AST lies not in the dominance of one method over another, but in their strategic integration within the diagnostic workflow. The evolving paradigm is to use rapid molecular tests for early alerts and initial guidance, followed or supplemented by rapid phenotypic confirmation to deliver a precise, actionable MIC. This synergistic approach, supported by continuous technological innovation, is key to advancing antimicrobial stewardship and improving patient outcomes in the face of rising antimicrobial resistance.
Bloodstream infections (BSIs) remain a significant global health challenge, associated with high morbidity and mortality rates. Effective management hinges on the rapid identification of causative pathogens and determination of their antimicrobial susceptibility profiles to guide appropriate antibiotic therapy [61]. Conventional antimicrobial susceptibility testing (AST) methods, while reliable, typically require 2-3 days from blood collection to result, often forcing clinicians to rely on empirical broad-spectrum antibiotic treatment [59]. This practice contributes to the escalating crisis of antimicrobial resistance (AMR) and suboptimal patient outcomes [62].
The evolution towards molecular and rapid phenotypic AST methods represents a paradigm shift in BSI management. These technologies significantly reduce turnaround times, enabling more precise antibiotic stewardship and potentially improving clinical results [63]. This case study objectively compares the performance of various rapid AST systems against conventional methods and each other, providing researchers and drug development professionals with experimental data and methodological insights crucial for advancing the field of rapid diagnostics.
Conventional AST Workflows and Limitations
The standard diagnostic pathway for BSIs begins with blood culture incubation until microbial growth is detected. Following positivity, laboratories typically perform subculturing to obtain pure colonies, which requires an additional 24-48 hours. Subsequent species identification and AST using methods like disk diffusion, broth microdilution, or automated systems such as VITEK 2 further extend the total turnaround time to approximately 72 hours or more [59] [61]. This diagnostic delay has significant clinical consequences, as each hour of delayed appropriate antibiotic therapy is associated with increased mortality in septic patients [61].
The Emergence of Rapid AST Systems
Recent technological innovations have produced rapid AST methods that substantially compress diagnostic timelines. These systems can be broadly categorized into:
- Rapid phenotypic tests that measure microbial growth or viability in the presence of antimicrobials, providing results in 1-8 hours directly from positive blood cultures.
- Genotypic tests that detect nucleic acid sequences indicative of resistance genes, typically within 1-2.5 hours [64] [6].
These approaches demonstrate the potential to transform BSI management by providing actionable AST results within a single clinical shift, enabling timely antibiotic adjustments [61].
Comparative Performance Analysis of Rapid AST Systems
Turnaround Time and Workflow Efficiency
Table 1: Turnaround Time Comparison of AST Systems
| System | Technology Type | Average Time to AST Result | Sample Input | Hands-on Time |
|---|---|---|---|---|
| Conventional AST (VITEK2) | Automated phenotypic | 9.6-18 hours [65] [61] | Pure colonies | Moderate |
| Accelerate Pheno | Morphokinetic cellular analysis | 7 hours [64] [59] | Positive blood culture | 2 minutes [59] |
| VITEK REVEAL | Small Molecule Sensors | 5.5-7 hours [64] [65] | Positive blood culture | Minimal |
| ASTar system | Time-lapse microscopic imaging | 6 hours [64] | Positive blood culture | Moderate |
| FASTinov | Flow cytometry | 2 hours [64] | Positive blood culture | Not specified |
| LifeScale system | Microorganism mass measurement | 4.5 hours [64] [61] | Positive blood culture | Not specified |
| BioFire FilmArray BCID2 | Multiplex PCR | ~1 hour (ID + resistance markers only) [65] | Positive blood culture | 2 minutes [59] |
The data demonstrate substantial time savings with rapid AST systems. A pivotal study evaluating the VITEK REVEAL system reported a significant reduction in time-to-result compared to conventional methods (7.0 hours versus 9.6 hours), with overall turnaround time from positive blood culture to actionable AST cut from 31.1 hours to 15 hours [65]. The Accelerate Pheno system provides similar benefits, delivering AST results within 7 hours with minimal hands-on time [59].
Diagnostic Accuracy and Analytical Performance
Table 2: Analytical Performance of Rapid AST Systems
| System | Gram-negative CA/EA | Gram-positive CA/EA | Identification Sensitivity/Specificity | Reference Method |
|---|---|---|---|---|
| Accelerate Pheno | 90.3%/93.2% [59] | 97.2%/98.89% [59] | 97.9%/99.9% [59] | BMD/MALDI-TOF |
| Direct VITEK2 | 92.6%/88.5% [59] | 97.2%/100% [59] | Not applicable | BMD |
| Colony VITEK2 | 94.4%/89.5% [59] | 97.2%/100% [59] | Not applicable | BMD |
| BioFire BCID2 | Not applicable (genotypic) | Not applicable (genotypic) | 100%/100% [59] | MALDI-TOF |
CA = Categorical Agreement; EA = Essential Agreement; BMD = Broth Microdilution
The performance data indicate that rapid phenotypic systems maintain high categorical agreement with reference methods, essential for clinical adoption. The Accelerate Pheno system demonstrates excellent performance for Gram-positive organisms and slightly lower but still substantial agreement for Gram-negatives [59]. Molecular systems like BioFire BCID2 achieve perfect identification sensitivity and specificity in validation studies, though they provide limited AST information based solely on resistance gene detection [59].
Experimental Protocols and Methodologies
Standardized Evaluation Framework
To ensure comparable performance assessment across systems, researchers have developed standardized validation approaches:
Sample Preparation Protocol:
- Positive blood culture bottles are collected within 8 hours of positivity signaling [59].
- Exclusion criteria include polymicrobial growth by Gram stain or organisms outside test specifications [59].
- Samples are divided for parallel testing with rapid and conventional methods.
- For seeded studies, bacterial suspensions are standardized to 0.5 McFarland, diluted to approximately 100 cells/mL, and inoculated into blood culture bottles containing fresh human donor blood [59].
Reference Methodologies:
- Bacterial identification: MALDI-TOF mass spectrometry serves as the reference standard [59].
- AST performance: Broth microdilution according to Clinical and Laboratory Standards Institute (CLSI) guidelines represents the gold standard [59].
- Additional resistance confirmation: PCR or targeted molecular assays validate resistance mechanisms (e.g., carbapenemase genes, vanA/B, mecA) [59].
Performance Metrics Calculation:
- Categorical agreement (CA): Percentage of isolates classified identically (susceptible, intermediate, resistant) between test and reference methods.
- Essential agreement (EA): Percentage of MIC results within ±1 doubling dilution of reference MIC.
- Error rates: Very major errors (false susceptible), major errors (false resistant), and minor errors (discrepancies in intermediate categorization) [59].
Implementation and Workflow Integration Studies
Research methodologies also assess real-world applicability through workflow simulations:
Time-Motion Analysis:
- Comparison of hands-on technologist time across systems [59].
- Total turnaround time measurement from blood culture positivity to final AST result reporting [65].
- Assessment of pre-analytical processing requirements [64].
Clinical Impact Simulation:
- Retrospective analysis of time-to-antibiotic adaptation under different testing scenarios [65].
- Comparison of same-day result availability based on laboratory working hours and test initiation cut-off times [65].
- Modeling of potential antibiotic modification opportunities with rapid versus conventional testing [65].
Visualization of AST Workflows and System Relationships
AST Methods Workflow Comparison
The diagram illustrates the significant temporal advantage of rapid AST systems, which bypass the lengthy subculture step required by conventional methods. This streamlined pathway enables same-shift result reporting, aligning with critical clinical decision timelines for antibiotic therapy adjustments [61].
The Researcher's Toolkit: Essential Reagent Solutions
Table 3: Key Research Reagent Solutions for AST Development
| Reagent/Component | Function | Application Examples |
|---|---|---|
| Sepsityper Kit | Direct pathogen extraction from positive blood cultures for MALDI-TOF identification | Sample preparation for rapid ID [59] |
| Saponin-based extraction reagents | Blood cell lysis to concentrate microorganisms | In-house sample preparation methods [59] |
| Fluorescence in situ hybridization (FISH) probes | Genus and species-specific bacterial identification | Accelerate Pheno system identification module [59] |
| Small Molecule Sensors | Detection of volatile organic compounds from microbial growth | VITEK REVEAL growth detection mechanism [65] |
| Morphokinetic cellular analysis reagents | Measurement of bacterial morphological changes under antimicrobial pressure | Accelerate Pheno AST determination [59] |
| Multiplex PCR master mixes | Simultaneous amplification of multiple pathogen and resistance gene targets | BioFire BCID/BCID2 Panels [65] [59] |
| Broth microdilution panels | Reference MIC determination for AST validation | Performance comparison gold standard [59] |
| Carba 5 assay reagents | Detection of carbapenemase genes (KPC, VIM, NDM, OXA-48, IMP) | Resistance mechanism confirmation [59] |
Discussion and Future Perspectives
The evidence demonstrates that rapid AST systems substantially outperform conventional methods in turnaround time while maintaining strong analytical performance. The clinical implications of these technological advancements are profound, potentially enabling antibiotic adjustments within the same clinical shift rather than after several days [61].
However, implementation challenges persist. Laboratory workflow integration, staff training requirements, and financial considerations significantly impact real-world utility [64]. Smaller, non-academic centers often lack the specialized personnel and infrastructure needed for optimal implementation [64]. Additionally, most rapid systems still require positive blood cultures as starting material, maintaining the initial 24-48 hour incubation delay before testing can commence [61].
Future development should focus on technologies that bypass blood culture altogether, testing directly from whole blood while maintaining sensitivity for low pathogen loads (1-100 CFU/mL) [61]. Emerging methods under development include:
- Whole-genome sequencing approaches directly from blood (e.g., LiDia Bloodstream Infection Test) promising results within 3-4 hours [61]
- Microfluidics-based phenotypic systems (e.g., QuickMIC) offering AST within 2 hours [61]
- Bacteriophage-based detection methods that may provide rapid phenotypic resistance profiling [61]
For researchers and drug development professionals, these advancements highlight the critical importance of considering not only analytical performance but also implementation practicalities, regulatory pathways, and compatibility with existing laboratory workflows when developing next-generation AST systems [64] [7].
The continuous innovation in rapid AST technologies represents a crucial frontier in the battle against antimicrobial resistance, offering the potential for personalized antibiotic therapy based on rapid diagnostic results rather than empirical prescribing patterns. As these technologies evolve, their integration into clinical practice will be essential for improving patient outcomes and stemming the tide of antimicrobial resistance worldwide.
Antimicrobial Susceptibility Testing (AST) stands as a critical function of clinical microbiology laboratories, guiding therapeutic decisions for infectious diseases and serving as a cornerstone of antimicrobial stewardship (AMS) programs [64]. The escalating global antimicrobial resistance (AMR) crisis, projected to cause 10 million deaths annually by 2050, underscores the urgent need for rapid, accurate diagnostic information to optimize patient care and curb resistance selection [2] [1]. Traditionally, clinical bacteriology has relied on phenotypic methods that require 48–96 hours from specimen collection to final AST results, often forcing clinicians to rely on empirical broad-spectrum antibiotic therapy [64] [7]. This landscape is now being transformed by technological innovations that fall into two broad categories: conventional phenotypic methods, which measure bacterial growth or viability in the presence of antimicrobials, and molecular/genotypic methods, which detect specific genetic markers associated with resistance [2] [6]. This review objectively compares the clinical utility of these approaches, focusing on their measurable impact on patient outcomes and stewardship metrics, framed within the broader thesis of evolving AST methodologies.
Methodological Comparison: Principles and Performance
Core Principles of Traditional and Molecular AST
Traditional Phenotypic Methods are based on observing the direct effect of antibiotics on bacterial growth. These include disk diffusion, broth microdilution (BMD), agar dilution, and gradient diffusion tests [2] [1]. The key output is the Minimum Inhibitory Concentration (MIC), the lowest concentration of an antimicrobial that prevents visible growth of a microorganism [2]. BMD serves as the international reference standard against which novel methods are validated [55]. These methods provide a comprehensive, hypothesis-free assessment of susceptibility but require prior bacterial isolation and a prolonged incubation period.
Molecular AST Methods detect specific genetic determinants of resistance (e.g., mecA, vanA/B, carbapenemase genes) using techniques such as PCR, nucleic acid amplification tests (NAAT), and CRISPR-based diagnostics [6] [55]. They offer rapid turnaround times (approximately 1–6 hours) and can be performed directly from clinical specimens, such as positive blood cultures [2]. However, their major limitation is the inability to detect novel or unexpected resistance mechanisms not targeted by the test's probes, and they cannot differentiate between expressed resistance and the mere presence of a resistance gene [7] [55].
Comparative Performance Data
The table below summarizes key performance characteristics of conventional and rapid phenotypic AST methods, which are most frequently compared in clinical validation studies.
Table 1: Comparative Performance of AST Methodologies
| Method Category | Example Platforms/Assays | Average Time to AST Result (after positive culture) | Categorical Agreement with BMD | Key Limitations |
|---|---|---|---|---|
| Reference Phenotypic | Broth Microdilution (BMD) | 16–24 hours [55] | Reference Standard [55] | Long turnaround time; labor-intensive [1] |
| Automated Phenotypic | VITEK 2, Phoenix | 6–24 hours [2] [1] | >90% [1] | Requires pure isolate; slower than rapid methods |
| Rapid Phenotypic | Accelerate PhenoTest BC, QuickMIC, Alfred 60/AST | 2–8 hours [64] [55] [51] | ~90-95% [55] | Higher cost per test; limited implementation in some labs [64] |
| Genotypic/Molecular | PCR-based assays (e.g., for mecA, carbapenemase genes) | 1–6 hours [2] | Varies by gene-target; high for mecA, vanA/B [55] | Limited target spectrum; cannot detect novel mechanisms [7] |
Experimental Data: Measuring Clinical Utility
Impact on Patient Outcomes
The ultimate validation of a diagnostic test is its ability to improve patient care. Studies measuring the impact of rapid AST consistently focus on time-sensitive infections like bloodstream infections (BSIs) and sepsis.
Table 2: Impact of Rapid AST on Key Clinical Outcome Metrics
| Metric | Traditional AST Workflow | Rapid AST Workflow | Clinical Significance |
|---|---|---|---|
| Time to Effective Therapy | ~48-72 hours post-culture [64] | Reduced by ~24-48 hours [51] | Inappropriate therapy is associated with higher mortality [64] [55]. |
| Time to Optimal Therapy | Delay of 1-2 days after culture positivity [64] | Significantly shorter (within hours of result) [51] | Enables earlier de-escalation or escalation, improving outcomes and stewardship [51]. |
| Mortality | Baseline mortality for BSIs is 12-32% [55] | Some observational studies suggest a trend toward reduction [64] | RCTs have not been sufficiently powered to confirm mortality benefit [64]. |
A core experimental protocol for assessing this impact involves a pre-post interventional study design. In such studies, patients with positive blood cultures are assigned to a control group (managed with conventional AST) or an intervention group (where rapid AST results are reported to clinicians immediately). Key data points collected include the time from culture positivity to: a) the first change to an effective antibiotic, b) the initiation of optimal/targeted therapy, and c) hospital discharge or mortality [64] [55]. Research consistently shows that rapid AST significantly reduces the time to results and improves antimicrobial therapy for patients with BSIs [64].
Impact on Antimicrobial Stewardship
Antimicrobial stewardship programs aim to optimize antibiotic use to improve patient outcomes while minimizing toxicity and selective pressure for resistance. Rapid AST serves as a powerful enabler for ASPs.
De-escalation: When rapid AST confirms susceptibility to a narrower-spectrum agent, clinicians can de-escalate from broad-spectrum empiric therapy sooner. This reduces the risk of Clostridioides difficile infection and other adverse events, and decreases selective pressure for resistance [64] [51]. Professor Gian Maria Rossolini notes that rapid AST "helps reduce the spectrum of antimicrobials used, minimizing selective pressure and supporting de-escalation strategies" [51].
Escalation: For pathogens resistant to initial empiric therapy, rapid AST allows for a more timely escalation to an effective agent. This is crucial in settings with high rates of AMR, where ~20-30% of BSI patients initially receive inadequate therapy [64]. Rapid AST provides the data needed to correct this promptly.
The measurable stewardship outcomes in experiments often include:
- Time to de-escalation: The interval from culture positivity to a change from a broad-spectrum to a narrower-spectrum antibiotic.
- Duration of broad-spectrum therapy: The total hours or days a patient receives broad-spectrum agents.
- Overall antibiotic exposure: Often measured as days of therapy (DOT) or defined daily doses (DDD) [64].
Essential Research Reagents and Workflows
The Scientist's Toolkit: Key Research Reagents
Table 3: Essential Research Reagents for AST Development and Validation
| Reagent / Material | Function in AST Research | Example Application |
|---|---|---|
| Cation-Adjusted Mueller-Hinton Broth (CAMHB) | Standardized growth medium for BMD and many automated systems [1]. | Provides consistent ion concentration for reliable, reproducible MIC results. |
| Mueller-Hinton Agar (MHA) Plates | Solid medium for disk diffusion and agar dilution methods [1]. | Used to create lawn of bacteria for measuring zones of inhibition (ZOI). |
| Antimicrobial Powder/Disks | Source of the antimicrobial agent for testing. | Impregnated in disks for diffusion or diluted in broth/agar for MIC tests. |
| ATCC Quality Control Strains | Reference strains with known MICs to monitor test performance [1]. | Used daily to ensure reagents and instruments are functioning within specifications. |
| Positive Blood Culture Bottles (Simulated or Clinical) | Sample matrix for validating direct-from-specimen tests. | Used to develop and optimize sample preparation protocols for rapid systems. |
Visualizing AST Workflows and Clinical Impact
The following diagrams illustrate the stark contrast in workflow and potential for clinical impact between traditional and modern AST pathways.
Diagram 1: Workflow comparison of traditional versus rapid AST. The significant reduction in turnaround time with rapid AST enables earlier clinical intervention.
Diagram 2: The logical pathway of clinical impact. Rapid AST results facilitate earlier clinical decisions that directly influence key outcomes for both patients and public health.
The definition of clinical utility in AST is multi-faceted, encompassing diagnostic accuracy, speed, and—most importantly—the capacity to drive actions that improve patient outcomes and advance antimicrobial stewardship. While traditional phenotypic methods remain the gold standard for accuracy and comprehensiveness, their prolonged turnaround time is a critical disadvantage in managing acute infections and controlling AMR [2] [1]. Molecular methods offer unparalleled speed for detecting predefined resistance mechanisms but provide an incomplete picture of the phenotypic resistance profile, limiting their standalone utility [7] [55].
The emerging generation of rapid phenotypic technologies, such as microfluidics and automated imaging systems, bridges this divide by providing MIC-comparable results in a clinically actionable timeframe of 2–8 hours [7] [51]. Evidence demonstrates that implementing these rapid AST systems significantly reduces time to optimal therapy, supporting both escalation and de-escalation strategies [64] [51]. For researchers and drug development professionals, the future lies in validating and refining these technologies to be more affordable and accessible, ensuring that the clear benefits of rapid AST can be realized universally to combat the ongoing AMR crisis.
Conclusion
The evolution of AST is characterized by a necessary synergy between traditional phenotypic methods, which provide a functional, holistic view of bacterial behavior, and molecular techniques, which offer unprecedented speed and specificity. While phenotypic methods remain the gold standard for determining microbial viability under antimicrobial pressure, molecular diagnostics are indispensable for rapid identification of known resistance mechanisms. The future of AST lies not in the replacement of one by the other, but in their strategic integration. Emerging technologies—including advanced phenotyping with digital imaging and microfluidics, hypothesis-free genotyping with whole-genome sequencing, and the push for point-of-care testing—promise to further shorten turnaround times, detect heteroresistance, and provide a more complete resistance profile. For researchers and drug developers, this progression underscores the imperative to develop novel AST platforms that are not only faster and more accurate but also accessible and validated for global clinical use, ultimately strengthening the fight against antimicrobial resistance.
References
- 1. methods and future trends in antimicrobial susceptibility... Conventional [https://pmc.ncbi.nlm.nih.gov/articles/PMC9958398/]
- 2. Antimicrobial Susceptibility Testing: A Comprehensive Review of... [https://pmc.ncbi.nlm.nih.gov/articles/PMC9024665/]
- 3. Conventional methods and future trends in antimicrobial susceptibility testing - ScienceDirect [https://www.sciencedirect.com/science/article/pii/S1319562X2300027X]
- 4. Evaluation of a Novel Rapid Phenotypic Antimicrobial Susceptibility Testing System [https://www.mdpi.com/2079-6382/14/10/962]
- 5. Performance of the LifeScale automated rapid phenotypic antimicrobial susceptibility testing on Gram-negative rods directly from positive blood cultures - PMC [https://pmc.ncbi.nlm.nih.gov/articles/PMC11633210/]
- 6. Frontiers | Detection of antimicrobial resistance via state-of-the-art technologies versus conventional methods [https://www.frontiersin.org/journals/microbiology/articles/10.3389/fmicb.2025.1549044/full]
- 7. Next-generation rapid phenotypic antimicrobial susceptibility testing | Nature Communications [https://www.nature.com/articles/s41467-024-53930-x]
- 8. Frontiers | Detecting antibiotic resistance: classical, molecular... [https://www.frontiersin.org/journals/microbiology/articles/10.3389/fmicb.2025.1673343/full]
- 9. Performance evaluation of early growth isolates for automated and manual broth microdilution antimicrobial-susceptibility testing - PubMed [https://pubmed.ncbi.nlm.nih.gov/40586583/]
- 10. Evaluation of MicroScan and VITEK 2 systems for susceptibility testing of Enterobacterales with updated breakpoints - PubMed [https://pubmed.ncbi.nlm.nih.gov/40304515/]
- 11. (PDF) Comparison of Disk , Diffusion - E and Test ... Broth [https://www.academia.edu/130487641/Comparison_of_Disk_Diffusion_E_Test_and_Broth_Microdilution_Test_in_Determination_of_Susceptibility_ofAspergillusSpecies_to_Amphotericin_B_Itraconazole_and_Voriconazole]
- 12. of the EUCAST Performance Method, the CLSI Agar... Disk Diffusion [https://pmc.ncbi.nlm.nih.gov/articles/PMC3993630/]
- 13. Microbiological methodologies: Comparative evaluation of microbial community and enhanced antibiotic susceptibility testing - ScienceDirect [https://www.sciencedirect.com/science/article/pii/S0717345825000053]
- 14. Frontiers | Modern Tools for Rapid Diagnostics of Antimicrobial Resistance [https://www.frontiersin.org/journals/cellular-and-infection-microbiology/articles/10.3389/fcimb.2020.00308/full]
- 15. The Future of AST : Towards faster results and quicker clinical decisions [https://www.thermofisher.com/hk/en/home/industrial/microbiology/microbiology-learning-center/susceptibility-testing-empowered/future-of-AST.html]
- 16. Molecular Detection of Antibiotic-Resistant Helicobacter pylori - PubMed [https://pubmed.ncbi.nlm.nih.gov/33765306/]
- 17. Direct from Specimen Antimicrobial Susceptibility Testing: State of the Art in 2019 - ScienceDirect [https://www.sciencedirect.com/science/article/abs/pii/S0196439919300303]
- 18. Mastering Antimicrobial Susceptibility Testing [https://www.numberanalytics.com/blog/mastering-antimicrobial-susceptibility-testing]
- 19. Feasibility study demonstrating that enzymatic template generation and... [https://pmc.ncbi.nlm.nih.gov/articles/PMC3766015/]
- 20. Antimicrobial Susceptibility Testing Workflow [https://www.thermofisher.com/us/en/home/clinical/clinical-microbiology/antimicrobial-susceptibility-testing/sensititre-ast.html]
- 21. Detection of antimicrobial resistance via state-of-the-art technologies... [https://pmc.ncbi.nlm.nih.gov/articles/PMC11893576/]
- 22. Frontiers | Advancements in AI-driven drug sensitivity testing research [https://www.frontiersin.org/journals/cellular-and-infection-microbiology/articles/10.3389/fcimb.2025.1560569/full]
- 23. Multiplexed Molecular Diagnostics for Respiratory, Gastrointestinal, and Central Nervous System Infections - PMC [https://pmc.ncbi.nlm.nih.gov/articles/PMC5091344/]
- 24. evaluation of four commercial Comparative ... performance multiplex [https://pmc.ncbi.nlm.nih.gov/articles/PMC6453453/]
- 25. Statistical analysis of real-time PCR data - PMC [https://pmc.ncbi.nlm.nih.gov/articles/PMC1395339/]
- 26. - Multiplex for Beginners - Nordic Biosite Real Time PCR [https://nordicbiosite.com/blog/multiplex-real-time-pcr-for-beginners]
- 27. Capabilities for Multiplex - Panel Workflows Real Time PCR [https://www.thermofisher.com/us/en/home/clinical/clinical-genomics/pathogen-detection-solutions/custom-capabilities/multiplex-panels.html]
- 28. Performance Assessment of a Multiplex Real-Time PCR Assay for Detection of Viruses Causing Respiratory Tract Infections - PMC [https://pmc.ncbi.nlm.nih.gov/articles/PMC11545397/]
- 29. Comparative performance evaluation of four commercial multiplex ... [https://journals.plos.org/plosone/article?id=10.1371/journal.pone.0215068]
- 30. Development of a novel strategy to reduce diagnostic errors in real-time polymerase chain reaction using probe-based techniques | Scientific Reports [https://www.nature.com/articles/s41598-024-78654-2]
- 31. Rapid Methods for Antimicrobial Resistance Diagnostics - PMC [https://pmc.ncbi.nlm.nih.gov/articles/PMC7924329/]
- 32. MALDI-TOF MS: A Reliable Tool in the Real Life of the Clinical Microbiology Laboratory - PMC [https://pmc.ncbi.nlm.nih.gov/articles/PMC10892259/]
- 33. Frontiers | Detection of Antibiotic-Resistance by MALDI - TOF Mass... [https://www.frontiersin.org/journals/cellular-and-infection-microbiology/articles/10.3389/fcimb.2020.572909/full]
- 34. DMF-MALDI: droplet based microfluidic combined to MALDI-TOF for focused peptide detection | Scientific Reports [https://www.nature.com/articles/s41598-017-06660-8]
- 35. Frontiers | Resolution of MALDI-TOF compared to whole genome sequencing for identification of Bacillus species isolated from cleanrooms at NASA Johnson Space Center [https://www.frontiersin.org/journals/microbiology/articles/10.3389/fmicb.2025.1499516/full]
- 36. An improved simple method for the identification of Mycobacteria by... [https://www.nature.com/articles/s41598-019-56604-7?error=cookies_not_supported&code=f0eec226-2efd-4d8f-af09-6f6b3d110222]
- 37. Benefits and Limitations of MALDI - TOF Mass Spectrometry for the... [https://www.infectiologyjournal.com/articles/benefits-and-limitations-of-malditof-mass-spectrometry-for-the-identification-of-microorganisms.html]
- 38. - Whole ( Genome ) Sequencing WGS [https://www.illumina.com/techniques/sequencing/dna-sequencing/whole-genome-sequencing.html]
- 39. Rapid microbial identification and phenotypic antimicrobial susceptibility testing directly from positive blood cultures: a new platform compared to routine laboratory methods - ScienceDirect [https://www.sciencedirect.com/science/article/abs/pii/S0732889319307680]
- 40. of novel rapid diagnostic of blood culture identification... Comparison [https://pmc.ncbi.nlm.nih.gov/articles/PMC8684256/]
- 41. of Performance 2 for Antimicrobial Susceptibility Testing of... Vitek [https://pubmed.ncbi.nlm.nih.gov/27881616/]
- 42. Evaluation of the Accelerate Pheno System for Rapid Identification and Antimicrobial Susceptibility Testing of Positive Blood Culture Bottles Inoculated with Primary Sterile Specimens from Patients with Suspected Severe Infections - PMC [https://www.ncbi.nlm.nih.gov/pmc/articles/PMC8091844/]
- 43. Direct, rapid antimicrobial susceptibility test from positive blood cultures based on microscopic imaging analysis | Scientific Reports [https://www.nature.com/articles/s41598-017-01278-2]
- 44. Performance of dRAST on Prospective Clinical Blood Culture Samples in a Simulated Clinical Setting and on Multidrug-Resistant Bacteria - PMC [https://pmc.ncbi.nlm.nih.gov/articles/PMC8941874/]
- 45. Next-generation rapid phenotypic ... | Nature Communications [https://www.nature.com/articles/s41467-024-53930-x?error=cookies_not_supported&code=b2f9fa86-5207-442c-af6a-f70124ee7e20]
- 46. Multicenter evaluation of the QuickMIC® rapid AST system in clinical... [https://link.springer.com/article/10.1007/s10096-025-05298-z]
- 47. Antibiotic Susceptibility Testing: Present and Future - Page 3 [https://www.medscape.com/viewarticle/851528_3]
- 48. The Ultimate Guide to AST in Medical Microbiology [https://www.numberanalytics.com/blog/ultimate-guide-to-ast-in-medical-microbiology]
- 49. Developmental roadmap for antimicrobial susceptibility testing systems | Nature Reviews Microbiology [https://www.nature.com/articles/s41579-018-0098-9]
- 50. A fast impedance-based antimicrobial susceptibility test | Nature Communications [https://www.nature.com/articles/s41467-020-18902-x]
- 51. The transformative impact of rapid AST on antimicrobial stewardship [https://www.selectscience.net/article/laboratory-leaders-are-turning-to-rapid-ast-to-advance-antimicrobial-stewardship]
- 52. Antimicrobial Susceptibility Testing Device Market Size 2026 [https://www.linkedin.com/pulse/antimicrobial-susceptibility-testing-device-market-size-qpwge]
- 53. : An Insidious Form of Antibiotic Resistance Heteroresistance [https://asm.org/articles/2024/july/heteroresistance-an-insidious-form-of-antibiotic-r]
- 54. High-throughput clinical antimicrobial susceptibility testing and... [https://pubmed.ncbi.nlm.nih.gov/40470969/]
- 55. Frontiers | Rapid Antimicrobial Susceptibility Testing Methods for Blood Cultures and Their Clinical Impact [https://www.frontiersin.org/journals/medicine/articles/10.3389/fmed.2021.635831/full]
- 56. ICMR’s 2025 Guidance on Rapid Diagnostic Validation & AST -CliniExperts [https://cliniexperts.com/regulatory-update/guidance-document-on-validation-of-rapid-diagnostics-for-pathogen-identification-and-antimicrobial-susceptibility-testing-ast-2025/]
- 57. Verification of AST systems | Thermo Fisher Scientific - US [https://www.thermofisher.com/us/en/home/industrial/microbiology/microbiology-learning-center/susceptibility-testing-empowered/AST-verification.html]
- 58. Rapid Susceptibility Testing Methods - PMC [https://pmc.ncbi.nlm.nih.gov/articles/PMC6686868/]
- 59. of novel rapid diagnostic of blood culture identification... Comparison [https://bmcmicrobiol.biomedcentral.com/articles/10.1186/s12866-021-02403-y]
- 60. Antimicrobial Susceptibility Testing Market Forecast, 2032 [https://www.coherentmarketinsights.com/market-insight/antimicrobial-susceptibility-testing-market-2449]
- 61. Diagnosis of Bloodstream Infections: An Evolution of Technologies towards Accurate and Rapid Identification and Antibiotic Susceptibility Testing - PMC [https://pmc.ncbi.nlm.nih.gov/articles/PMC9029869/]
- 62. Improve Bloodstream ... | Today's Clinical Lab Infection Management [https://www.clinicallab.com/improve-bloodstream-infection-management-with-faster-antimicrobial-susceptibility-testing-27963]
- 63. Rapid microbiological tests for bloodstream infections due to multidrug resistant Gram-negative bacteria: therapeutic implications - ScienceDirect [https://www.sciencedirect.com/science/article/abs/pii/S1198743X19305245]
- 64. Evaluating the impact of rapid antimicrobial susceptibility testing for... [https://pmc.ncbi.nlm.nih.gov/articles/PMC11412245/]
- 65. Retrospective evaluation of rapid genotypic ID and phenotypic AST systems on positive blood culture turnaround time and simulated potential impacts on bloodstream infection management - PMC [https://pmc.ncbi.nlm.nih.gov/articles/PMC11412238/]