Unlocking Microbial Dark Matter: ddPCR for Absolute Quantification of Low-Abundance Targets in Microbiome Research
Droplet Digital PCR (ddPCR) is revolutionizing microbiome research by enabling absolute, sensitive quantification of low-abundance nucleic acid targets in complex biological samples.
Unlocking Microbial Dark Matter: ddPCR for Absolute Quantification of Low-Abundance Targets in Microbiome Research
Abstract
Droplet Digital PCR (ddPCR) is revolutionizing microbiome research by enabling absolute, sensitive quantification of low-abundance nucleic acid targets in complex biological samples. This article explores the foundational principles that make ddPCR uniquely suited for detecting rare microbial strains and low-concentration pathogens, which are often missed by conventional methods. We detail methodological workflows for diverse applications, from probiotic tracking in clinical trials to environmental pathogen surveillance. The content provides actionable troubleshooting guidance for optimizing assays in inhibitor-rich matrices like stool and soil. Finally, we present a rigorous comparative analysis of ddPCR against qPCR and NGS, validating its superior sensitivity, precision, and resistance to PCR inhibitors. This resource equips researchers and drug development professionals with the knowledge to implement ddPCR for groundbreaking discoveries in microbial ecology and diagnostics.
The Digital Revolution: Core Principles of ddPCR for Sensitive Microbiome Analysis
The accurate quantification of nucleic acids is a cornerstone of modern molecular biology, particularly in microbiome research where analyzing low-concentration DNA samples from complex bacterial communities is a fundamental challenge. For years, quantitative real-time PCR (qPCR) has been the established method for gene expression analysis and pathogen detection. However, the emergence of digital PCR (dPCR) and its droplet-based counterpart, droplet digital PCR (ddPCR), represents a paradigm shift in detection and quantification technologies. This application note details the critical transition from qPCR to dPCR, focusing on the core principles of sample partitioning and absolute quantification without standard curves. Framed within the context of a broader thesis on applying ddPCR to low-concentration DNA samples in microbiome research, this document provides researchers, scientists, and drug development professionals with the theoretical foundation and detailed protocols needed to implement this powerful technology.
Fundamental Principles: qPCR vs. dPCR
Quantitative Real-Time PCR (qPCR)
qPCR is a widely used method that measures the accumulation of amplified PCR product in real time during each cycle of the PCR reaction. The key quantitative metric is the cycle threshold (Cq), the cycle number at which the fluorescence signal crosses a predefined threshold. The Cq value is inversely proportional to the starting quantity of the target nucleic acid. Quantification in qPCR is relative, requiring a standard curve of known concentrations to interpolate the quantity of an unknown sample [1] [2]. This method is highly sensitive but can be influenced by PCR inhibition and variations in amplification efficiency, factors that are particularly problematic when analyzing inhibitor-rich samples from complex microbiomes [3].
Digital PCR (dPCR) and Droplet Digital PCR (ddPCR)
dPCR takes a fundamentally different approach. The core principle is limiting dilution and sample partitioning. The PCR reaction mixture is partitioned into thousands to millions of individual reactions, such that some partitions contain one or more target DNA molecules and others contain none. Each partition acts as a separate PCR microreactor. Following end-point PCR amplification, the partitions are analyzed to count the number of positive (fluorescent) and negative (non-fluorescent) reactions [4] [3]. The proportion of positive partitions is then fitted to a Poisson distribution to calculate the absolute concentration of the target molecule in the original sample, expressed as copies per microliter, without the need for a standard curve [5]. This partitioning-based principle makes dPCR remarkably resistant to PCR inhibitors and enables the precise detection and quantification of rare targets, such as low-abundance bacterial species within a complex microbial community [3].
Table 1: Core Comparison of qPCR and dPCR/ddPCR Principles.
| Feature | Quantitative Real-Time PCR (qPCR) | Digital/Droplet Digital PCR (dPCR/ddPCR) |
|---|---|---|
| Quantification Basis | Relative to a standard curve | Absolute, based on Poisson statistics |
| Key Output Metric | Cycle Threshold (Cq) | Number of positive and negative partitions |
| Standard Curve | Required | Not required |
| Impact of PCR Inhibitors | Sensitive; can delay Cq and skew results | Tolerant; inhibitors affect partitions individually but not the binary count |
| Precision & Sensitivity | High | Superior, especially for low-abundance targets |
| Best Application | High-abundance target quantification, gene expression | Rare allele detection, copy number variation, pathogen detection in complex backgrounds |
Comparative Performance Data
Recent studies have directly compared the performance of dPCR and qPCR, particularly in the field of microbiology. The data consistently demonstrates the advantages of dPCR for applications requiring high precision and sensitivity.
A 2025 study on periodontal pathobionts found that a multiplex dPCR assay demonstrated superior sensitivity and precision compared to qPCR. dPCR was able to detect lower bacterial loads, which was especially critical for P. gingivalis and A. actinomycetemcomitans. The study reported that dPCR had a lower intra-assay variability (median CV%: 4.5%) than qPCR and was able to correct false negatives that occurred with qPCR at low concentrations (< 3 log10Geq/mL), leading to a 5-fold underestimation of pathogen prevalence when using qPCR alone [3].
Similarly, research on synthetic microbial consortia using Crystal Digital PCR demonstrated its ability to provide an absolute assessment of species abundance, reliably quantifying a low-abundance species even at a 1:10,000 ratio within a mixed community. This level of precision is crucial for understanding the dynamics and stability of engineered ecosystems in microbiome research [5].
Table 2: Summary of Comparative Performance Data from Recent Studies.
| Study & Target | Key qPCR Limitation Identified | Key dPCR/ddPCR Advantage Demonstrated | Quantitative Performance Data |
|---|---|---|---|
| Periodontal Pathobionts [3] | False negatives at low concentrations (<3 log10Geq/mL). | Superior sensitivity and precision for low-abundance targets. | - dPCR intra-assay CV: 4.5%- Corrected a 5-fold underestimation of A. actinomycetemcomitans prevalence. |
| Synthetic Microbial Consortium [5] | Reliance on standard curves for relative quantification. | Absolute quantification of species in a mixture without a standard curve. | - Reliable quantification down to a 1:10,000 ratio.- No interference between species during quantification. |
| Bacterial Community Analysis [6] | Biases from 16S rRNA regions, platforms, and kits. | A reference-based model using ddPCR data corrected NGS sequencing biases. | - ddPCR with rpoB-specific assays provided accurate bacterial quantification for bias correction. |
Experimental Protocols for ddPCR in Microbiome Research
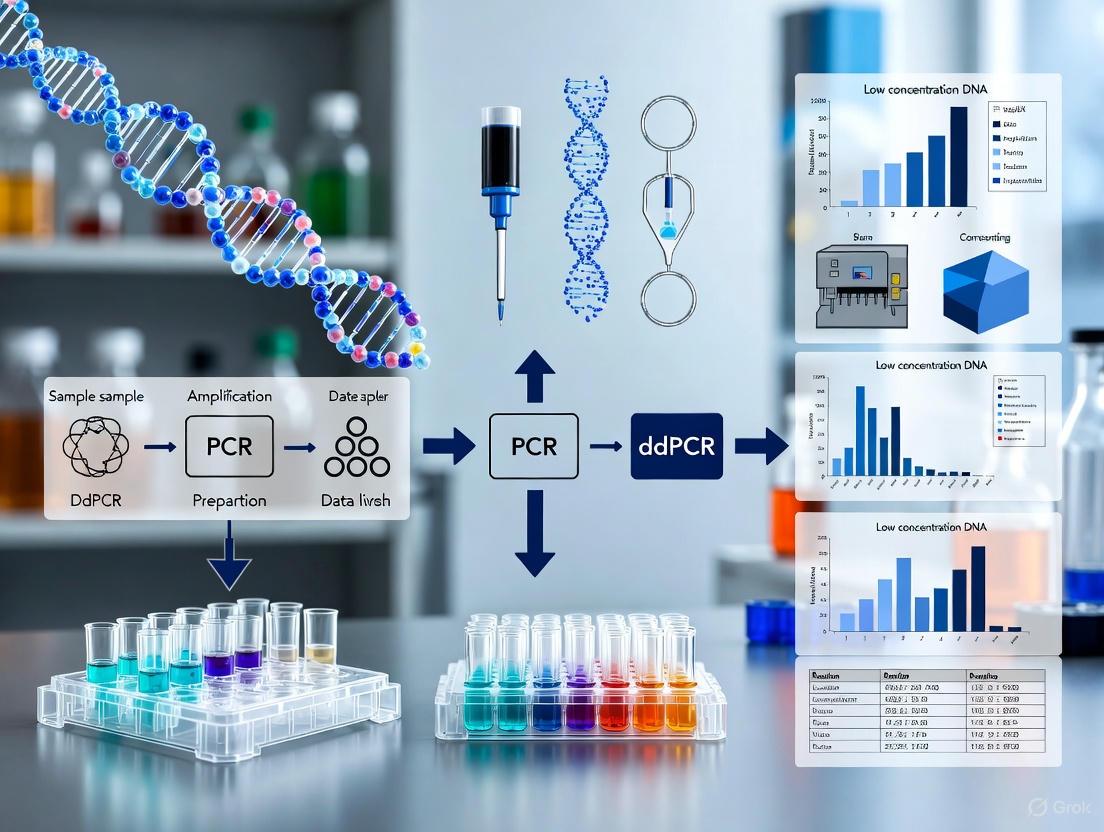
The following diagram illustrates the generalized workflow for a ddPCR experiment, from sample preparation to data analysis.
Detailed Protocol: Multiplex ddPCR for Bacterial Quantification
The following protocol is adapted from methods used for quantifying periodontal pathobionts and SARS-CoV-2, tailored for a microbiome research context [3] [7].
Procedure
- Reaction Mix Preparation: In a pre-plate, prepare the ddPCR reaction mix on ice. A typical 40 µL reaction may contain:
- 10 µL of sample DNA.
- 10 µL of 4× Probe PCR Master Mix.
- 0.4 µM of each forward and reverse primer for all target bacterial species (e.g., species-specific 16S rRNA or rpoB gene primers).
- 0.2 µM of each corresponding hydrolysis probe, each labeled with a distinct fluorophore (e.g., FAM, HEX/VIC).
- Nuclease-free water to a final volume of 40 µL.
- Partitioning: Transfer the reaction mix to a ddPCR nanoplate (e.g., QIAcuity Nanoplate 26k). Seal the plate and load it into the automated ddPCR instrument (e.g., QIAcuity Four, Bio-Rad QX200). The instrument will generate approximately 26,000 nanodroplets or partitions per sample.
- PCR Amplification: Perform end-point PCR amplification on the partitioned samples using a thermal cycler with the following standard conditions:
- Initial Enzyme Activation: 95°C for 2–10 minutes.
- Amplification (40–45 cycles):
- Denaturation: 95°C for 15–30 seconds.
- Annealing/Extension: 55–60°C for 1 minute (acquire fluorescence data if the platform allows).
- Enzyme Deactivation: 98°C for 10 minutes.
- Hold: 4°C.
- Fluorescence Reading and Analysis: After thermocycling, transfer the plate to the reader module. The instrument will read the fluorescence of each partition in all available channels (e.g., FAM, HEX, Cy5). Using the instrument's software, set appropriate fluorescence thresholds to distinguish positive partitions from negative partitions for each target. The software will automatically count the partitions and apply the Poisson distribution to calculate the absolute concentration of each target in copies/µL.
The Scientist's Toolkit: Essential Research Reagent Solutions
Table 3: Key reagents and materials required for implementing ddPCR in the laboratory.
| Item | Function/Description | Example |
|---|---|---|
| ddPCR Master Mix | A optimized PCR mix containing DNA polymerase, dNTPs, and buffer, formulated for the generation of stable droplets. | ddPCR Supermix for Probes (No dUTP) [7] |
| Species-Specific Primers | Oligonucleotides designed to uniquely amplify a gene region (e.g., 16S rRNA, rpoB) of a target bacterial species. | Primers targeting P. gingivalis, A. actinomycetemcomitans [3] |
| Fluorescent Probes | Hydrolysis (TaqMan) probes with a reporter dye (e.g., FAM, HEX) and a quencher; provide target-specific fluorescence upon amplification. | Double-quenched probes for rpoB genes [6] |
| Partitioning Oil/Reagent | A proprietary oil formulation used to generate a water-in-oil emulsion, creating the nanodroplets for partitioning. | Emulsion oil with droplet-stabilizing surfactants [4] |
| Restriction Enzyme | Used in some protocols to digest long genomic DNA strands, improving access to the target sequence and partitioning efficiency. | PvuII Restriction Enzyme [3] |
| Reference DNA/Control | Genomic DNA from a known bacterial strain or synthetic DNA standard for assay validation and as a positive control. | P. gingivalis ATCC 33277 [3] |
The transition from qPCR to digital PCR marks a significant advancement in nucleic acid quantification, offering a direct path to absolute quantification with exceptional precision and sensitivity. For microbiome researchers working with low-concentration DNA samples from complex environments, ddPCR provides a powerful tool to overcome the limitations of standard qPCR, including susceptibility to inhibitors and reliance on external standards. The detailed protocols and performance data outlined in this application note demonstrate that ddPCR is not merely an incremental improvement but a transformative technology. It enables the accurate profiling of bacterial communities, the detection of low-abundance species, and the validation of sequencing data, thereby providing a more robust foundation for discoveries in microbial ecology, diagnostics, and therapeutic development.
In microbiome research, the analysis of low-biomass samples presents a significant challenge. Traditional molecular methods, which rely on relative abundance measurements, often fail to provide accurate quantification when bacterial DNA is scarce. This limitation can lead to misinterpretations of community structure and function. Digital droplet PCR (ddPCR) overcomes this hurdle through its foundational principle: Poisson statistics. This mathematical framework enables the absolute quantification of nucleic acids by partitioning a sample into thousands of nanoliter-sized droplets, effectively converting a quantitative molecular analysis into a simple counting exercise. This application note details how Poisson statistics underpins absolute quantification in ddPCR and provides validated protocols for its application in low-concentration DNA samples from microbiome studies.
The Mathematical Principle of Poisson Distribution in ddPCR
In ddPCR, a single PCR reaction is partitioned into 20,000-30,000 nanodroplets, with the sample diluted to a degree where each droplet contains either 0 or 1 target molecule (or, in rare cases, more) [8] [9]. After thermocycling, droplets are classified as positive (fluorescence detected) or negative (no fluorescence). The fundamental assumption is that the target molecules are randomly distributed across the droplets according to a Poisson distribution [8].
The Poisson equation used for absolute quantification is: [ C = - \ln(1 - p) \times D ] Where:
Cis the calculated average number of target molecules per droplet (the concentration we want to find)pis the proportion of positive droplets (positive droplets / total droplets)Dis the total number of droplets analyzedlnis the natural logarithm
The calculated concentration C is then converted to copies per microliter of the original sample based on the volume of the PCR reaction and the degree of partitioning [8]. This direct quantification eliminates the need for standard curves required by qPCR, a significant advantage for quantifying low-abundance targets where reliable standards may be unavailable [10] [11].
Performance Comparison: ddPCR vs. Other Quantification Methods
The following tables summarize key performance characteristics of ddPCR compared to other common nucleic acid quantification techniques, with a focus on applications relevant to low-concentration samples in microbiome and clinical research.
Table 1: Comparative Analytical Performance of ddPCR, qPCR, and NGS
| Parameter | ddPCR | qPCR | NGS |
|---|---|---|---|
| Quantification Basis | Absolute (copies/μL) [10] [8] | Relative (requires standard curve) [10] | Semi-quantitative (compositional) [12] |
| Sensitivity (LOD) | 1-3 copies/μL [13] [14] | ~8 copies/μL [14] | Varies; can detect single molecules [14] |
| Precision at High CNV | High (5% average difference from PFGE) [10] | Low (22% average difference from PFGE) [10] | Not applicable |
| Effect of PCR Inhibitors | Less sensitive [15] | More sensitive [12] | Varies with protocol |
| Ideal for Low-Biomass | Excellent [16] [11] | Good [11] [12] | Poor due to high detection limit [12] |
Table 2: Performance in Specific Application Studies
| Study Context | ddPCR Performance | qPCR Performance | Reference |
|---|---|---|---|
| HPV16 Detection in Plasma | 70% sensitivity | 20.6% sensitivity | [14] |
| Absolute Quantification of L. reuteri | LOD: ~104 cells/g feces | LOD: ~103 cells/g feces | [12] |
| 16S rRNA in Low-DNA Samples | Enabled sequencing with DNA inputs <0.05 ng | Standard protocols failed with low inputs | [16] [15] |
| Copy Number Variation (CNV) | 95% concordance with gold-standard PFGE | 60% concordance with gold-standard PFGE | [10] |
Application in Microbiome Research: Protocol for 16S rRNA Gene Absolute Quantification
This protocol, adapted from Nature Protocols, describes how to use ddPCR for the absolute quantification of 16S rRNA genes from stool samples, a key metric for determining total prokaryotic abundance in a microbiome [11].
Workflow Overview:
Step-by-Step Procedure:
Sample Preparation and DNA Extraction:
- Weigh a specific amount of stool (e.g., 100-200 mg). Record the weight precisely.
- Extract total DNA using a robust, kit-based method (e.g., QIAamp Fast DNA Stool Mini Kit) to minimize contamination and maximize yield [11] [12].
- Determine DNA concentration and purity using a spectrophotometer. Note that for low-biomass samples, the DNA concentration might be below the detection limit of fluorometers, but can still be amplified by ddPCR [16].
ddPCR Reaction Setup:
- Prepare a 20-22 µL reaction mix containing:
- 1x ddPCR Supermix for Probes (or EvaGreen for intercalating chemistry).
- Forward and Reverse primers targeting the 16S rRNA gene (e.g., 337F and 1046R, both at a final concentration of 250-500 nM).
- The extracted DNA template (typically 2-5 µL, depending on expected bacterial load). Include no-template controls (NTC) to monitor contamination.
- Vortex and centrifuge the reaction mix briefly.
- Prepare a 20-22 µL reaction mix containing:
Partitioning and Amplification:
- Load the reaction mix into a droplet generator cartridge along with droplet generation oil.
- Generate approximately 20,000 droplets using an automated droplet generator (e.g., Bio-Rad QX200 or Stilla naica Geode) [8] [9].
- Carefully transfer the generated emulsion to a 96-well PCR plate and seal the plate.
- Perform PCR amplification on a thermal cycler using optimized cycling conditions for the 16S rRNA primers. A standard program is:
- Hold: 95°C for 10 minutes (enzyme activation).
- Cycle (40x): 94°C for 30 seconds (denaturation), 55-60°C for 60 seconds (annealing/extension).
- Hold: 98°C for 10 minutes (enzyme deactivation).
- Hold: 4°C ∞.
Droplet Reading and Data Analysis:
- After amplification, place the plate in a droplet reader (e.g., Bio-Rad QX200 or Stilla naica Prism).
- The reader will count the total number of droplets and the number of fluorescence-positive droplets for each sample.
- The software (e.g., QuantaSoft) automatically applies the Poisson correction to calculate the absolute concentration of the 16S rRNA gene target in copies/µL of the reaction mix.
- Calculate Final Absolute Abundance:
- Convert the concentration to copies per gram of stool using the formula: [ \text{(copies/µL from ddPCR)} \times \frac{\text{Total DNA elution volume (µL)}}{\text{DNA template volume (µL)} \times \text{Stool sample weight (g)}} = \text{copies/g stool} ]
Protocol for 16S rRNA Amplicon Sequencing from Low-DNA Samples
For very low-biomass samples where standard 16S library preparation fails, ddPCR can be used to generate sufficient amplicon product for sequencing [16] [15].
Workflow Overview:
Step-by-Step Procedure:
Initial Library Preparation:
- Perform the 1st-step PCR with a very low DNA input (as low as 0.01-0.5 ng) using 16S rRNA gene primers that contain Illumina overhang adapter sequences.
- Clean up the PCR products.
- Perform the 2nd-step PCR to attach dual indices and sequencing adapters (Nextera XT Index Kit primers). Clean up the resulting amplicons.
ddPCR Amplification:
- Dilute the purified 2nd-step PCR amplicons. The dilution factor should be calculated to aim for an average of less than one amplicon molecule per droplet to ensure optimal amplification [15]. A starting point is a 105-fold dilution.
- Set up the ddPCR reaction mix using plain P5 and P7 primers, which bind to the Illumina adapter sequences already incorporated into the amplicons.
- Generate droplets and run the PCR as described in the previous protocol.
Final Library Recovery and Sequencing:
- After ddPCR, break the emulsion and recover the aqueous phase containing the amplified DNA.
- Purify the DNA using standard methods (e.g., AMPure XP beads).
- Check the concentration and quality of the final library. If the concentration is still too low for sequencing (a common issue when starting with <0.05 ng DNA), perform a "rescue" PCR: a standard low-cycle-number (e.g., 8-12 cycles) PCR with P5 and P7 primers to amplify the ddPCR product [15].
- Pool libraries and sequence on an Illumina MiSeq or similar platform.
The Scientist's Toolkit: Essential Research Reagent Solutions
Table 3: Key Reagents and Equipment for ddPCR in Microbiome Research
| Item | Function/Description | Example Products/Brands |
|---|---|---|
| Droplet Generator | Partitions PCR reaction into nanodroplets. | Bio-Rad QX200 Droplet Generator; Stilla Technologies naica Geode [8] [9] |
| Droplet Reader | Quantifies fluorescence in each droplet. | Bio-Rad QX200 Droplet Reader; Stilla Technologies naica Prism [8] [9] |
| ddPCR Supermix | Optimized PCR master mix for droplet reactions. | Bio-Rad ddPCR Supermix for Probes (or EvaGreen) |
| Droplet Generation Oil | Creates stable water-in-oil emulsion. | Bio-Rad Droplet Generation Oil for Probes; Stilla Technologies Crystal Digital PCR Oil [8] |
| 16S rRNA Primers | Targets prokaryotic gene for absolute abundance. | 337F (5'-ACTCCTACGGGAGGCAGCAGT-3') / 1046R (5'-CGACRRCCATGCANCACCT-3') [11] |
| DNA Extraction Kit | Isols DNA from complex samples like stool. | QIAamp Fast DNA Stool Mini Kit [12] |
| Microfluidic Chips | Consumables for partitioning samples. | Bio-Rad DG8 Cartridges; Stilla Technologies Sapphire or Ruby Chips [8] [9] |
Poisson statistics provides the indispensable mathematical foundation that enables ddPCR to achieve absolute quantification of nucleic acids. This is particularly transformative for the analysis of low-concentration DNA samples in microbiome research, allowing scientists to move beyond the limitations of relative abundance data. The protocols and data presented herein demonstrate that ddPCR is a robust, sensitive, and precise tool for quantifying total bacterial load and for enabling sequencing from minimal template, thereby ensuring that low-biomass samples can be faithfully characterized and compared alongside high-biomass counterparts.
The accurate analysis of low-biomass samples, characterized by minimal microbial DNA amid significant background interference and potential inhibitors, presents a substantial challenge in microbiome research. Droplet Digital PCR (ddPCR) has emerged as a powerful solution, offering enhanced sensitivity and a robust dynamic range that makes it particularly suited for quantifying low-abundance targets in complex samples [17] [18]. Unlike next-generation sequencing (NGS) which provides relative abundances, or quantitative PCR (qPCR) which relies on external calibration curves, ddPCR provides absolute quantification of target genes without the need for standard curves, transforming nucleic acid detection into a precise counting method [10] [18]. This application note details the specific advantages of ddPCR for low-biomass applications and provides a validated protocol for targeting low-abundance genes in complex matrices, with a focus on microbiome studies.
Key Technical Advantages of ddPCR
The superior performance of ddPCR for low-biomass targets stems from its fundamental workflow, which partitions each sample into thousands of nanoliter-sized droplets, effectively creating individual microreactors. This core principle enables two significant improvements over traditional methods.
Exceptional Sensitivity and Precision at Low Concentrations
Partitioning the reaction dramatically increases the effective concentration of a single target molecule within its droplet, facilitating more efficient amplification and enabling the detection of rare targets. This partitioning also confers high resistance to PCR inhibitors, as inhibitors are similarly diluted across the droplet emulsion, minimizing their impact in any single reaction unit [17] [19].
- Direct Absolute Quantification: ddPCR quantifies nucleic acids directly through Poisson distribution analysis of positive and negative droplets, eliminating the need for a standard curve and its associated errors [10] [18].
- Superior Sensitivity: Studies consistently show ddPCR outperforms qPCR for low-abundance targets. In environmental samples, ddPCR demonstrated a enhanced capability to quantify ammonia-oxidizing bacteria (AOB) in complex samples characterized by low target concentrations and high non-target DNA [17]. For forensic applications, a triplex ddPCR system reliably detected DNA degradation in samples with as few as two copies [19].
- High Precision: A recent comparative study of ddPCR platforms demonstrated high precision (Coefficient of Variation < 5%) in quantifying gene copy numbers from unicellular eukaryotes, a crucial factor for tracking subtle changes in low-biomass communities [20].
Optimal Dynamic Range for Complex and Inhibited Samples
The technology's dynamic range is ideally suited for samples where microbial load varies drastically or where inhibitors are present.
- Performance in Inhibited Samples: The partitioning mechanism makes ddPCR more tolerant to common PCR inhibitors found in environmental and clinical samples (e.g., humic acids, heme) compared to qPCR [17] [19].
- Accurate Microbial Load Assessment: A 2025 study highlighted a strong correlation (
rho = 0.92) between DNA concentration and absolute prokaryotic abundance measured by ddPCR in stool samples, leading to a highly accurate machine learning model for predicting absolute abundance. This underscores ddPCR's reliability for foundational quantification in microbiome studies [21].
Table 1: Quantitative Performance Comparison of ddPCR vs. qPCR
| Performance Metric | ddPCR | qPCR | Experimental Context |
|---|---|---|---|
| Concordance with Gold Standard | 95% (38/40 samples) [10] | 60% (24/40 samples) [10] | Copy number variation (DEFA1A3 gene) vs. PFGE |
| Average Difference from Gold Standard | 5% [10] | 22% [10] | Copy number variation (DEFA1A3 gene) vs. PFGE |
| Sensitivity for E. coli BSI | 82.7% [22] | Information Not Available | Clinical bloodstream infection (BSI) diagnosis |
| Specificity for E. coli BSI | 100% [22] | Information Not Available | Clinical bloodstream infection (BSI) diagnosis |
| Limit of Detection (LOD) | ~3.98-6.16 copies/reaction [23] | Information Not Available | Multiplex detection of sulfonamide resistance genes |
Application in Microbiome Research: A Case Study
The following case study and workflow illustrate the practical application of ddPCR in a microbiome research context.
Case Study: Absolute Quantification of Sulfonamide Resistance Genes (sul)
A 2025 study developed a highly sensitive quadruple ddPCR method for the simultaneous quantification of four sulfonamide resistance genes (sul1, sul2, sul3, and sul4) across 115 diverse samples, including human feces, animal-derived foods, sewage, and surface water [23].
- Methodology: The assay used a ratio-based probe-mixing strategy in a two-channel ddPCR system to distinguish four targets. Primers and probes were meticulously designed, and critical parameters (annealing temperature, primer/probe concentration) were systematically optimized [23].
- Performance: The method demonstrated excellent sensitivity with limits of detection (LOD) ranging from 3.98 to 6.16 copies per reaction and good repeatability (coefficient of variation < 25%) [23].
- Results: The method achieved high positive detection rates: 100% for
sul1, 99.13% forsul2, 93.91% forsul3, and 68.70% forsul4, with gene concentrations ranging from non-detection to 2.14 × 10⁹ copies/g [23]. This showcases the method's power for comprehensive antimicrobial resistance (AMR) surveillance in low-biomass environments.
Diagram 1: ddPCR Workflow for Low-Biomass Targets. The core steps of the ddPCR process are shown, highlighting partitioning and absolute quantification as key advantages for analyzing low-concentration samples.
Detailed Experimental Protocol
This protocol is adapted from a published method for multiplex detection of antibiotic resistance genes and is optimized for low-biomass samples [23].
Reagent Setup and Sample Preparation
Table 2: Research Reagent Solutions for Quadruple ddPCR Assay
| Reagent / Material | Function / Description | Example Provider / Specification |
|---|---|---|
| ddPCR Supermix for Probes (No dUTP) | Provides optimized buffer, nucleotides, and polymerase for probe-based ddPCR. | Bio-Rad, QX200 ddPCR Supermix |
| Primer/Probe Sets | Target-specific oligonucleotides for amplification and detection. | HPLC-purified, resuspended in TE buffer |
| Restriction Enzyme (e.g., HaeIII) | Digests genomic DNA to improve access to target sequences and can enhance precision. | [20] |
| Droplet Generation Oil | Immiscible oil phase for generating stable water-in-oil emulsions. | Bio-Rad, DG Droplet Generation Oil |
| DNA Extraction Kit | Efficient isolation of high-quality microbial DNA from complex samples. | QIAGEN, DNeasy PowerSoil Pro Kit [17] |
Step-by-Step Procedure
DNA Extraction and Quality Control:
- Extract genomic DNA from samples (e.g., 200 mg stool, 8 mg mucosa) using a commercial kit designed for complex samples (e.g., DNeasy PowerSoil Pro Kit) [17] [21].
- Assess DNA concentration using a fluorometer. Note that for mucosal samples, high host DNA may require limiting input mass to avoid column saturation [24].
ddPCR Reaction Mix Preparation:
- Prepare a 22 µL reaction mixture on ice as follows:
- 11 µL of 2x ddPCR Supermix for Probes (No dUTP)
- Primers and Probes: Optimal concentrations must be determined empirically. The quadruple
sulgene assay utilized a ratio-based probe-mixing strategy [23]. A typical starting concentration is 0.9 µM for each primer and 0.25 µM for each probe [22]. - Restriction Enzyme: Optionally include a restriction enzyme (e.g., HaeIII) to improve precision, especially for targets with high copy numbers or tandem repeats [20].
- 2-5 µL of template DNA
- Nuclease-free water to 22 µL.
- Include a no-template control (NTC) with water replacing DNA to monitor contamination.
- Prepare a 22 µL reaction mixture on ice as follows:
Droplet Generation:
- Transfer 20 µL of the reaction mix to a DG8 cartridge well.
- Carefully add 70 µL of Droplet Generation Oil to the designated oil well.
- Place the cartridge in the QX200 Droplet Generator. The instrument will automatically generate approximately 20,000 nanoliter-sized droplets per sample.
PCR Amplification:
- Gently transfer 40 µL of the generated emulsion to a semi-skirted 96-well PCR plate. Seal the plate with a foil heat seal.
- Perform PCR amplification on a thermal cycler with the following profile, optimizing the annealing temperature (Ta) for your assay:
- Enzyme activation: 95°C for 10 minutes
- 40 cycles of:
- Denaturation: 94°C for 30 seconds
- Annealing/Extension: Ta (e.g., 56-60°C) for 1 minute
- Enzyme deactivation: 98°C for 10 minutes
- Hold at 4°C.
- After amplification, proceed to reading or store the plate at 4°C for up to 24 hours.
Droplet Reading and Data Analysis:
- Place the plate in the QX200 Droplet Reader.
- The reader will aspirate each sample and flow droplets single-file past a two-color (FAM/HEX) optical detection system.
- Analyze the data using the instrument's accompanying software (e.g., QuantaSoft).
- Set thresholds to distinguish positive and negative droplets for each fluorescent channel based on the NTC and positive controls.
- The software will automatically apply Poisson statistics to calculate the absolute concentration of each target in copies/µL of the original reaction mix.
Droplet Digital PCR represents a significant advancement for the quantification of low-biomass targets in microbiome research. Its key advantages—exceptional sensitivity, absolute quantification without standard curves, high tolerance to inhibitors, and superior precision for low-abundance targets—make it an indispensable tool for applications ranging from environmental antimicrobial resistance surveillance to the analysis of host-rich clinical samples. The provided protocol offers a robust starting point for researchers to implement this powerful technology in their own investigations of microbial ecosystems.
Addressing the Limitations of Compositional Data in NGS-based Microbiome Studies
Next-generation sequencing (NGS) has revolutionized microbiome research by enabling comprehensive profiling of microbial communities. However, standard 16S rRNA gene amplicon sequencing generates relative abundance data, where the measured abundance of each taxon depends on the abundance of all other taxa in the sample [24]. This compositional nature fundamentally limits biological interpretation, as an increase in one taxon's relative abundance could result from its actual growth or from the decline of other community members [24]. These limitations can lead to high false-positive rates in differential abundance analyses and obscure true biological relationships [24].
Digital PCR (dPCR), particularly droplet digital PCR (ddPCR), provides a powerful solution to these challenges by enabling absolute quantification of microbial taxa. ddPCR achieves this through massive sample partitioning into thousands of nanoliter-sized droplets, with Poisson statistics applied to count target DNA molecules without requiring standard curves [25]. This approach allows researchers to transform relative microbiome data into absolute abundances, revealing changes in microbial loads that remain invisible to relative abundance analysis alone [12] [24]. This Application Note details protocols for implementing ddPCR to overcome compositional data limitations in NGS-based microbiome studies.
Theoretical Framework: The Compositional Data Problem and the ddPCR Solution
Limitations of Relative Abundance Data
In compositional data analysis, the sum of all parts is constrained to a constant total (e.g., 100%), creating inherent dependencies between taxa. This means that relative abundance measurements cannot distinguish between the following scenarios when the ratio between Taxon A and Taxon B increases:
- Taxon A increases while Taxon B remains stable
- Taxon B decreases while Taxon A remains stable
- A combination of both effects [24]
This ambiguity fundamentally limits biological interpretation. Without absolute quantification, researchers cannot determine whether an individual taxon is truly increasing or decreasing, nor can they accurately measure the magnitude of change between experimental conditions [24].
Principles of Absolute Quantification with ddPCR
Droplet digital PCR addresses these limitations through absolute quantification of target nucleic acids. The core principles of ddPCR technology include:
- Massive Partitioning: Each sample is partitioned into approximately 20,000 nanoliter-sized droplets, creating individual reaction chambers [25].
- Endpoint Amplification: PCR amplification occurs within each droplet, culminating in a fluorescent signal for droplets containing at least one target DNA molecule [26] [25].
- Poisson Statistics: The ratio of positive to negative droplets is analyzed using Poisson statistics to determine the absolute concentration of target DNA in the original sample, expressed as copies per microliter [25].
This approach provides several key advantages for microbiome quantification:
- No Standard Curves Required: Unlike qPCR, ddPCR does not require standard curves for quantification [12] [25].
- High Sensitivity: Capable of detecting rare targets and low-abundance taxa [27] [12].
- Resistance to Inhibitors: The partitioning process dilutes PCR inhibitors present in complex samples [12].
- Precision: Provides highly reproducible results across a wide dynamic range [12].
Comparative Performance of ddPCR in Microbiome Research
Quantitative Comparison of DNA Quantification Methods
Table 1: Comparison of DNA quantification methods for microbiome analysis
| Method | Quantification Type | Standard Curve Required | Sensitivity | Resistance to Inhibitors | Throughput | Best Use Cases |
|---|---|---|---|---|---|---|
| ddPCR | Absolute | No | High (detects single molecules) [25] | High [12] | Medium | Absolute quantification of low-abundance targets [12] [24] |
| qPCR | Relative | Yes | Medium | Medium | High | Rapid screening with known standards [12] |
| 16S rRNA Amplicon Sequencing | Relative | No (but requires calibration) | Limited by sequencing depth [24] | High (with proper library prep) | Very High | Comprehensive community profiling [24] |
| Flow Cytometry | Absolute | No (cell counting) | Medium | Low (requires dissociation) [24] | Medium | Total microbial load determination [24] |
Experimental Validation of ddPCR for Microbial Quantification
Multiple studies have systematically validated ddPCR's performance for microbial quantification:
Sensitivity and Detection Limits: In a comparison of qPCR and ddPCR for quantifying Limosilactobacillus reuteri in human fecal samples, both methods showed comparable sensitivity with a limit of detection (LOD) of approximately 10⁴ cells/g feces when using kit-based DNA isolation methods. ddPCR demonstrated slightly better reproducibility [12].
Detection in Clinical Applications: For diagnosing neurosurgical central nervous system infections (NCNSIs), ddPCR showed a significantly higher detection rate (78.7%) compared to traditional culture methods (59.1%) and a faster turnaround time than both culture and metagenomic NGS (12.4 ± 3.8 hours for ddPCR vs. 22.6 ± 9.4 hours for culture vs. 16.8 ± 2.4 hours for mNGS) [28].
Environmental Monitoring Applications: In microbial source tracking studies, ddPCR demonstrated increased sensitivity for detecting both human and gull fecal contamination in water samples compared to qPCR methodologies, enabling identification of low levels of contamination that were undetectable by qPCR [27].
Integrated Protocol: Absolute Quantification of Microbial Taxa in Complex Samples
This protocol outlines the complete workflow for absolute quantification of specific bacterial taxa in fecal samples using ddPCR, adapted from validated approaches [12] [24].
Sample Preparation and DNA Extraction
Materials:
- QIAamp Fast DNA Stool Mini Kit (Qiagen) or similar
- Phosphate buffered saline (PBS), ice-cold
- Benchtop centrifuge
- Spectrophotometer (e.g., Nanodrop) for DNA purity assessment
Procedure:
- Sample Homogenization: Weigh 0.1-0.2 g of fecal sample and homogenize in 1 mL of ice-cold PBS.
- Cell Washing: Centrifuge at 8,000 × g for 5 minutes at 4°C. Discard supernatant and resuspend pellet in 1 mL ice-cold PBS. Repeat this washing step three times total.
- DNA Extraction: Follow manufacturer's protocol for the QIAamp Fast DNA Stool Mini Kit with these modifications:
- Resuspend final pellet in 100 µL of lysis buffer
- Incubate at 37°C for 30 minutes
- Continue with standard kit protocol
- DNA Quantification and Quality Control: Measure DNA concentration and purity (A260/A280 ratio ~1.8-2.0). Store DNA at -20°C or -80°C until ddPCR analysis.
Strain-Specific Primer and Probe Design
Materials:
- Bacterial genome sequences from public databases (NCBI, EBI)
- Primer design software (e.g., Primer3, Geneious)
- BLASTN for specificity verification
Procedure:
- Identify Strain-Specific Regions: Compare target strain genome with related strains to identify unique genomic regions.
- Design Primers and Probes:
- Amplicon length: 80-150 bp
- Primer length: 18-22 bases
- TaqMan probe with 5' reporter dye (FAM or HEX) and 3' quencher
- Verify Specificity: Use BLASTN against non-target genomes to ensure specificity.
- Validate Assay: Test primer specificity with pure target and non-target cultures.
ddPCR Reaction Setup and Amplification
Materials:
- ddPCR Supermix for Probes (Bio-Rad)
- Strain-specific primers and TaqMan probes
- Droplet Generator (Bio-Rad QX200 or similar)
- DG8 Cartridges and Gaskets
- Droplet Reader
- Thermal cycler
Table 2: ddPCR reaction setup components
| Component | Final Concentration | Volume (µL) for 20 µL Reaction |
|---|---|---|
| ddPCR Supermix for Probes | 1X | 10 |
| Forward Primer | 900 nM | 1.8 |
| Reverse Primer | 900 nM | 1.8 |
| TaqMan Probe | 250 nM | 1 |
| DNA Template | - | 2-5 |
| Nuclease-Free Water | - | To 20 µL total |
Procedure:
- Prepare Reaction Mix: Combine components in the order listed in Table 2 on ice.
- Droplet Generation:
- Load 20 µL of reaction mix into the middle wells of a DG8 Cartridge
- Load 70 µL of Droplet Generation Oil into the bottom wells
- Place a DG8 Gasket over the cartridge
- Process in the Droplet Generator
- PCR Amplification:
- Carefully transfer 40 µL of generated droplets to a 96-well PCR plate
- Seal the plate with a foil heat seal
- Run the following thermal cycling protocol:
- 95°C for 10 minutes (enzyme activation)
- 40 cycles of:
- 94°C for 30 seconds (denaturation)
- Primer-specific annealing temperature (55-60°C) for 60 seconds (extension)
- 98°C for 10 minutes (enzyme deactivation)
- 4°C hold
Data Acquisition and Analysis
Procedure:
- Droplet Reading: Transfer the PCR plate to the Droplet Reader for automated measurement of fluorescence in each droplet.
- Threshold Setting: Use manufacturer's software (QuantaSoft) or third-party tools like the
ddpcrR package [26] to set fluorescence thresholds distinguishing positive and negative droplets. - Concentration Calculation: The software automatically applies Poisson statistics to calculate the absolute concentration of the target gene in copies/µL of the original reaction mix.
- Conversion to Biological Units: Convert to cells/gram of original sample using the formula:
Research Reagent Solutions
Table 3: Essential research reagents for ddPCR-based microbiome quantification
| Reagent/Kit | Function | Example Use Case | Considerations |
|---|---|---|---|
| QIAamp Fast DNA Stool Mini Kit | DNA extraction from complex samples | Efficient microbial DNA isolation from feces [12] | Includes inhibitors removal steps; validated for fecal samples |
| ddPCR Supermix for Probes | Reaction mixture for probe-based ddPCR | Absolute quantification of specific bacterial strains [12] | Optimized for droplet stability and PCR efficiency |
| Strain-Specific Primers & TaqMan Probes | Target-specific amplification | Quantification of specific bacterial strains (e.g., L. reuteri) [12] | Requires careful in silico design and experimental validation |
| Droplet Generation Oil | Creates water-in-oil emulsion | Formation of nanoliter droplets for partitioning | Must be compatible with the specific ddPCR system |
| DG8 Cartridges and Gaskets | Microfluidic droplet generation | Physical partitioning of samples into droplets | Single-use consumables specific to Bio-Rad systems |
Application Examples and Case Studies
Diet-Induced Microbiome Changes
A murine ketogenic-diet study demonstrated the critical importance of absolute quantification. While relative abundance analysis suggested specific taxonomic changes, absolute quantification through dPCR anchoring revealed an overall decrease in total microbial loads on the ketogenic diet [24]. This finding fundamentally altered the interpretation of how diet affects gut microbiota, demonstrating that some taxa appeared to increase in relative abundance not because they were actually growing, but because other community members declined more dramatically.
Antimicrobial Resistance Gene Monitoring
A recently developed quadruple ddPCR method enables simultaneous quantification of four sulfonamide resistance genes (sul1, sul2, sul3, and sul4) in diverse matrices including human feces, animal-derived foods, and sewage [23]. This method demonstrated excellent sensitivity with limits of detection ranging from 3.98 to 6.16 copies/reaction and achieved positive rates of 100% for sul1, 99.13% for sul2, 93.91% for sul3, and 68.70% for sul4 across 115 environmental samples [23].
Bias Correction in NGS Data
A reference-based bias correction model was developed to address NGS sequencing biases in bacterial community profiling. In this approach, ddPCR with rpoB-specific assays provided accurate bacterial quantification for bias correction, successfully correcting biased ratios across different amplification regions and platforms to achieve results that closely matched the proportions predicted by ddPCR [6].
The integration of ddPCR with NGS-based microbiome analyses represents a significant advancement in overcoming the fundamental limitations of compositional data. By providing absolute quantification of microbial taxa, ddPCR enables researchers to distinguish true biological changes from apparent fluctuations caused by compositional constraints. The protocols and applications detailed in this document provide a roadmap for implementing this powerful approach across diverse research contexts, from basic microbial ecology to clinical and environmental monitoring. As the field moves toward more quantitative microbiome research, ddPCR offers a precise, sensitive, and reproducible method for transforming relative observations into absolute biological measurements.
From Theory to Bench: Developing Robust ddPCR Assays for Microbial Targets
Strain-Specific Primer and Probe Design for Probiotic and Pathogen Detection
Accurate detection and quantification of specific bacterial strains within complex microbial communities is a cornerstone of advanced microbiome research, particularly for applications involving probiotics and pathogen surveillance. Next-generation sequencing (NGS) approaches provide valuable community insights but suffer from limitations as semi-quantitative tools with high detection limits and compositional data constraints [12]. For studies requiring precise quantification of specific microbial strains—such as tracking probiotic colonization, monitoring pathogenic incursions, or assessing antimicrobial resistance gene propagation—digital droplet PCR (ddPCR) offers a transformative approach for absolute quantification of low-abundance targets.
This application note details comprehensive protocols for designing strain-specific primers and probes, with particular emphasis on their application in ddPCR workflows for challenging sample matrices. The digital partitioning nature of ddPCR enables unparalleled sensitivity for low-concentration DNA targets, making it particularly suitable for quantifying specific bacterial strains in complex backgrounds like fecal samples, soil, and wastewater [12] [29]. By providing structured methodologies, comparative performance data, and optimized workflows, this document serves as an essential resource for researchers and drug development professionals implementing precise molecular detection systems.
Technical Foundations of Strain-Specific Detection
Comparative Analysis of Detection Platforms
Table 1: Comparison of Molecular Detection Methods for Strain-Specific Quantification
| Parameter | qPCR | ddPCR | NGS Approaches |
|---|---|---|---|
| Quantification Type | Relative (requires standard curve) | Absolute (no standard curve) | Semi-quantitative (compositional) |
| Detection Limit | ~10³ cells/g feces [12] | 0.92 copies/μL [30] | High detection limit [12] |
| Dynamic Range | Wide [12] | Wide but superior for low abundance | Limited [12] |
| Reproducibility | Good [12] | Excellent [12] | Variable |
| Susceptibility to Inhibitors | Moderate [12] | Low [29] [31] | High |
| Cost and Throughput | Lower cost, faster [12] | Higher cost, medium throughput | Highest cost, variable throughput |
| Best Applications | High-abundance targets, cost-sensitive studies | Low-abundance targets, complex samples, absolute quantification required | Discovery-based studies, community profiling |
Key Advantages of ddPCR for Low-Biomass Applications
The fundamental advantage of ddPCR lies in its partitioning technology, which divides each sample into thousands of nanoliter-scale reactions, enabling absolute quantification of target DNA molecules without reliance on standard curves [31]. This approach significantly enhances detection sensitivity for low-abundance targets, with demonstrated limits of detection as low as 0.92 copies/μL compared to 920 copies/μL for qPCR in fungal pathogen detection [30]. This 1000-fold improvement in sensitivity makes ddPCR particularly valuable for monitoring specific probiotic strains during early colonization phases or detecting nascent pathogenic invasions before they reach clinically relevant thresholds.
Furthermore, ddPCR exhibits superior resistance to PCR inhibitors present in complex sample matrices like feces, soil, and wastewater [29]. By partitioning the sample, inhibitors are diluted into discrete droplets, reducing their impact on amplification efficiency compared to bulk reactions in qPCR [31]. This robustness is particularly valuable for clinical and environmental samples where DNA extraction may be incomplete or co-purification of inhibitory substances is unavoidable.
Strain-Specific Marker Identification Strategies
Genomic Subtraction for Marker Discovery
Suppression subtractive hybridization (SSH) provides a powerful method for identifying strain-specific genomic regions when full genome sequences are unavailable. This technique was successfully implemented for Lactobacillus reuteri DSM 16350, using the type strain DSM 20016 as the driver to isolate tester-specific sequences [32]. The protocol involves:
- Digestion and Adapter Ligation: Digest tester DNA with restriction enzymes and ligate to specific adapters
- Hybridization: Mix tester DNA with excess driver DNA to allow hybridization of common sequences
- Selective Amplification: Use adapter-specific primers to preferentially amplify tester-specific sequences
- Cloning and Sequencing: Clone amplified products and sequence to identify unique genomic fragments
This approach yielded specific genetic markers that differentiated the probiotic strain from closely related variants, enabling specific tracking in chicken intestinal samples [32].
Random Amplification and Inverse PCR
Random amplified polymorphic DNA (RAPD) analysis offers an alternative method for discovering strain-specific markers without prior sequence knowledge. This technique was successfully employed for Bacillus mesentericus strain TO-A, generating a 991-bp RAPD marker that was subsequently sequenced and validated for strain specificity [33]. The workflow includes:
- RAPD Profiling: Amplify genomic DNA with short arbitrary primers under low-stringency conditions
- Band Isolation and Cloning: Excise strain-specific bands from agarose gels, clone, and sequence
- Sequence Analysis: Verify specificity through database alignment (BLAST)
- Inverse PCR: For extended flanking sequences, digest DNA with restriction enzymes, circularize, and amplify with outward-facing primers
This RAPD-based approach facilitated the development of highly specific primers that accurately quantified the probiotic strain in human feces without cross-reacting with 25 related Bacillus subtilis strains [33].
Whole Genome Sequencing-Based Identification
For strains with available genome sequences, comparative genomics represents the most efficient approach for identifying strain-specific markers:
- Comparative Genomics: Align target strain genomes against closely related strains to identify unique regions
- Specificity Validation: In silico analysis against database sequences to confirm uniqueness
- Marker Selection: Choose regions with appropriate length (150-300 bp) and GC content (40-60%) for optimal PCR efficiency
- Functional Considerations: Preferentially select markers from non-hypothetical genes when possible
This approach formed the basis for the highly accurate qPCR assay for Limosilactobacillus reuteri 17938, which achieved a detection limit of approximately 10⁴ cells/g feces [12].
Primer and Probe Design Guidelines
Design Parameters for Strain-Specific Assays
Table 2: Optimal Design Parameters for Strain-Specific Primers and Probes
| Parameter | Primers | Hydrolysis Probes |
|---|---|---|
| Length | 18-24 nucleotides | 15-30 nucleotides |
| Melting Temperature (Tm) | 58-62°C | 68-70°C (7-10°C higher than primers) |
| GC Content | 40-60% | 30-80% |
| Amplicon Size | 75-200 bp (optimal for ddPCR) | N/A |
| 3' End | Avoid complementary regions; no G at terminus | N/A |
| Specificity Checking | BLAST against NR database | BLAST against NR database |
| Secondary Structures | Avoid self-complementarity (>3 bp) and dimer formation | Avoid self-complementarity |
| Dye Selection | N/A | FAM, HEX, ROX, TAMRA, Cy5, ATTO700 [34] |
Specificity Validation Workflow
Ensuring primer specificity is paramount for accurate strain-specific detection:
In Silico Validation:
- Perform BLAST analysis against comprehensive databases
- Check for cross-reactivity with phylogenetically related strains
- Verify absence of binding to host DNA (for clinical applications)
Empirical Testing:
- Test against a panel of closely related strains (Table 1 in [32])
- Include environmental isolates from similar niches
- Validate with non-target strains likely present in sample matrix
Performance Optimization:
- Determine optimal annealing temperature through gradient PCR
- Assess primer concentration (100-900 nM) for optimal signal-to-noise ratio
- Verify amplification efficiency (90-110%) for quantitative applications
The Lactobacillus reuteri DSM 16350 assay exemplifies this rigorous validation, demonstrating no cross-reactivity with non-target strains from various sources [32].
Experimental Workflow for Strain Detection
The following diagram illustrates the complete experimental workflow from sample processing to data analysis:
Sample Collection and DNA Extraction
Proper sample handling and DNA extraction are critical for accurate quantification:
Fecal Samples:
- Immediate freezing at -80°C after collection [12]
- Use of kit-based DNA isolation methods (e.g., QIAamp Fast DNA Stool Mini Kit) [12]
- Incorporation of mechanical lysis steps for Gram-positive bacteria [32]
- Optional sample washing with ice-cold PBS to remove PCR inhibitors [12]
Environmental Samples:
- Wastewater concentration via centrifugation (4100g for 20 minutes) [29]
- Soil homogenization using bead-beating systems [33] [30]
- DNA purification using commercial kits (e.g., Chemagic Prime Viral DNA/RNA Kit) [29]
The choice of extraction method significantly impacts detection sensitivity. For fecal samples, kit-based methods demonstrated superior performance compared to phenol-chloroform extraction, with detection limits of approximately 10³ cells/g feces for L. reuteri strains [12].
ddPCR Reaction Setup and Optimization
Reaction Composition:
- 20-40 μL total reaction volume
- 1× ddPCR Supermix
- 900 nM primers (final concentration)
- 250 nM probe (final concentration)
- 5-100 ng template DNA
- Nuclease-free water to volume
Droplet Generation:
- Use appropriate droplet generator for system
- Target 10,000-20,000 droplets per sample
- Verify droplet integrity by microscopy if needed [31]
Thermal Cycling Conditions:
- Enzyme activation: 95°C for 10 minutes
- 40 cycles of:
- Denaturation: 94°C for 30 seconds
- Annealing/Extension: Strain-specific temperature for 60 seconds
- Enzyme deactivation: 98°C for 10 minutes
- 4°C hold
Optimal Annealing Temperatures must be empirically determined for each primer set. The Bacillus mesentericus TO-A assay utilized 67°C annealing [33], while Fusarium solani detection employed 60°C [30].
Validation and Applications
Assay Validation Parameters
Table 3: Essential Validation Parameters for Strain-Specific Detection Assays
| Validation Parameter | Target Performance | Example from Literature |
|---|---|---|
| Specificity | No amplification with non-target strains | No cross-reactivity with 25 B. subtilis strains [33] |
| Limit of Detection (LOD) | <10³ cells/g sample matrix | 10³ cells/g feces for L. reuteri [12] |
| Limit of Quantification (LOQ) | CV <25% at target concentration | 0.92 copies/μL for F. solani [30] |
| Linearity | R² > 0.98 | R² > 0.98 for L. reuteri [12] |
| Dynamic Range | 4-6 orders of magnitude | 10³-10⁸ cells/g feces [12] |
| Precision | CV <15% for replicates | High reproducibility in wastewater surveillance [29] |
| Accuracy | 80-120% of expected value | Correlation with culture methods [33] |
Representative Applications
Probiotic Monitoring: Strain-specific ddPCR enabled precise quantification of Lactobacillus reuteri in human fecal samples after probiotic supplementation, demonstrating superior sensitivity compared to NGS approaches [12]. Similarly, Bacillus mesentericus TO-A was accurately tracked in human feces during supplementation trials, detecting approximately 10⁵ cells/g feces during administration and monitoring clearance post-cessation [33].
Pathogen Surveillance: In ginseng cultivation, Fusarium solani detection achieved remarkable sensitivity (0.92 copies/μL) using ddPCR, enabling early diagnosis of root rot pathogens before visible symptoms manifested [30]. The method quantified pathogen loads ranging from 0-2,100 copies/g in uncultivated soil to 10,605-43,697 copies/g in infected fields.
Antimicrobial Resistance Tracking: Multiplexed ddPCR assays successfully monitored five carbapenemase-encoding genes (blaKPC, blaOXA-48, blaNDM, blaIMP, blaVIM) in wastewater surveillance, providing community-level resistance monitoring that complemented clinical surveillance data [29].
Research Reagent Solutions
Table 4: Essential Research Reagents for Strain-Specific Detection
| Reagent Category | Specific Products | Application Notes |
|---|---|---|
| DNA Extraction Kits | QIAamp Fast DNA Stool Mini Kit, Chemagic Prime Viral DNA/RNA Kit | Kit-based methods preferred for fecal samples [12] [29] |
| ddPCR Master Mixes | QIAcuity Probe PCR Kit, ddPCR Supermix for Probes | Optimized for droplet generation and stability |
| Primer/Probe Design | Custom dPCR Microbial Assays, Self-designed primers | Hydrolysis probes recommended for specificity [34] |
| Droplet Generation | QIAcuity Nanoplates, DG8 Cartridges | System-dependent consumables |
| Positive Controls | Target strain genomic DNA, Synthetic gBlocks | Essential for quantification standards |
| Inhibition Controls | Internal amplification controls, Spike-in DNA | Critical for complex matrices [29] |
Troubleshooting and Optimization
Common challenges in strain-specific detection and recommended solutions:
Inhibition Issues:
- Symptom: Reduced amplification efficiency, failed droplets
- Solutions: Dilute template DNA, implement purification steps, use inhibitor-resistant enzymes [31]
Poor Partitioning:
- Symptom: Low droplet count, irregular droplet formation
- Solutions: Vortex samples thoroughly, filter viscous samples, optimize oil-to-sample ratio [31]
Non-Specific Amplification:
- Symptom: False positives in negative controls
- Solutions: Increase annealing temperature, redesign primers, optimize Mg²⁺ concentration [32] [33]
Low Sensitivity:
- Symptom: High limit of detection
- Solutions: Concentrate template DNA, increase sample input, improve extraction efficiency [12]
Strain-specific primer and probe design for ddPCR applications represents a powerful methodology for precise microbial quantification in complex sample matrices. The exceptional sensitivity and absolute quantification capabilities of ddPCR make it particularly valuable for low-abundance targets in probiotic research, pathogen surveillance, and antimicrobial resistance monitoring. By adhering to the detailed protocols for marker identification, primer design, and validation outlined in this application note, researchers can develop robust detection assays that overcome the limitations of traditional molecular methods. The structured approaches to sample processing, reaction optimization, and data interpretation ensure reliable results that advance our understanding of microbial dynamics in diverse environments.
The reliability of microbiome research and molecular diagnostics is fundamentally dependent on the initial quality of extracted nucleic acids. Complex biological matrices such as stool, soil, and processed foods present significant challenges due to their potent PCR inhibitors, structural complexity, and often low target DNA concentrations. The integration of droplet digital PCR (ddPCR) into this workflow offers a transformative advantage for analyzing low-concentration samples, as its partitioning technology enhances resistance to inhibitors and enables absolute quantification without standard curves [35] [36] [15]. This application note provides detailed, optimized DNA extraction protocols for these challenging matrices, framed within the context of a thesis focusing on ddPCR for low-concentration DNA samples in microbiome research.
Optimized DNA Extraction Protocols
Stool Samples: Preservation and Extraction for Microbial Community Integrity
Stool samples present a uniquely challenging matrix due to their complex microbial composition and the presence of numerous PCR inhibitors. Preservation method and DNA extraction efficiency critically influence the resulting microbial community profiles.
- Optimal Preservation Buffers: For studies requiring sample storage before processing, the choice of preservation buffer is paramount. Evidence indicates that PSP (Invitek PSP Stool Stabilising Buffer) and RNAlater most closely recapitulate the microbial diversity profile of immediately snap-frozen samples (the gold standard). In contrast, 95% ethanol has been associated with significant DNA yield reduction and frequent sequencing failures [37].
- Critical Washing Step for RNAlater: When using RNAlater, a phosphate-buffered saline (PBS) washing step before DNA extraction dramatically improves DNA yield, making it comparable to unbuffered (dry) stool and PSP-buffered samples. Without this step, DNA yield can be prohibitively low [37].
- Inhibition Management: Efficient removal of PCR inhibitors is achieved through specialized commercial kits designed for stool or soil, which often incorporate inhibitors-absorbing compounds such as polyvinylpyrrolidone (PVP) [38].
Table 1: Evaluation of Stool Sample Preservation Methods
| Preservation Method | DNA Yield | Microbial Profile Fidelity | Key Considerations |
|---|---|---|---|
| Immediate Freezing (-80°C) | High | Gold Standard | Not always feasible for longitudinal/field studies |
| PSP Buffer | High (Similar to dry stool) | High | Closely mirrors frozen sample profile |
| RNAlater (with PBS wash) | High | High | Washing step is critical for high yield |
| 95% Ethanol | Significantly Lower | Variable | High rate of sequencing failure; not recommended |
Soil Samples: Overcoming Matrix Interference for Reliable dsRNA/DNA Recovery
Soil, particularly clayed and sandy types, contains potent nucleases and enzymatic inhibitors that degrade nucleic acids and hinder downstream applications. A multi-faceted chemical approach is required for successful extraction.
- Key Chemical Additives:
- Aluminum Sulfate: A crucial additive for effectively removing persistent PCR inhibitors from the soil matrix [38].
- β-Mercaptoethanol (β-ME): Serves to inhibit RNases and DNases, protecting target nucleic acids from degradation [38].
- Polyvinylpyrrolidone (PVP) : Adsorbs polyphenolic compounds and other humic substances that are common PCR inhibitors in soil [38].
- Mechanical Lysis Optimization: The intensity of mechanical lysis is a critical determinant of DNA fragment length. Low-intensity bead beating (e.g., 4 m s⁻¹ for 10 s) can increase the mean extracted DNA fragment length by over 70% compared to high-intensity manufacturer recommendations (e.g., 6 m s⁻¹ for 30 s). While higher intensity increases yield, it causes severe DNA fragmentation, which is detrimental to long-read sequencing applications. The optimized low-intensity lysis still provides sufficient DNA yield for library preparation while preserving DNA integrity [39].
- Reduced Soil Input: Lowering the initial amount of soil processed can significantly improve dsRNA yield and purity by reducing the co-extraction of inhibitors [38].
The following workflow summarizes the optimized protocol for nucleic acid extraction from complex soil samples:
Food Matrices: DNA Extraction from Highly Processed Products
Processed foods and beverages are challenging due to degraded DNA and the presence of complex PCR inhibitors from ingredients and processing.
- Effective Kits and Methods: For processed chestnut rose juice, a combination approach (often involving silica-column-based purification) demonstrated superior performance in recovering amplifiable DNA compared to several commercial kits alone (e.g., Plant Genomic DNA Kit, Magnetic Plant Genomic DNA Kit) and a non-commercial CTAB-based method. While potentially more time-consuming and costly, the combination method provided the best quality DNA for downstream PCR analysis [40].
- Addressing Degradation: DNA in processed foods is highly fragmented due to mechanical, thermal, and chemical treatments (e.g., acidity). Successful amplification requires targeting short amplicon sizes (<100-150 bp) in subsequent ddPCR or qPCR assays [40].
- Inhibitor Removal: Food matrices contain polysaccharides, polyphenols, proteins, and organic acids that inhibit DNA polymerases. Extraction methods must efficiently remove these contaminants without compromising the already low yield of degraded DNA [40].
The Scientist's Toolkit: Essential Reagents and Materials
Table 2: Key Research Reagent Solutions for DNA Extraction from Complex Matrices
| Reagent/Material | Function | Application |
|---|---|---|
| PSP Stool Stabilising Buffer | Preserves microbial community structure post-collection | Stool sample storage and transport |
| RNAlater | Stabilizes and protects RNA and DNA | Stool, tissue samples (requires PBS wash) |
| Aluminum Sulfate | Flocculates and removes persistent PCR inhibitors | Soil and environmental samples |
| Polyvinylpyrrolidone (PVP) | Binds to and removes polyphenolic compounds | Soil and plant-derived matrices |
| β-Merccaptoethanol | Reduces disulfide bonds; inhibits nucleases | General use to prevent nucleic acid degradation |
| Silica-Membrane Columns | Selective binding of nucleic acids in presence of chaotropic salts | General purification in many commercial kits |
| Magnetic Ionic Liquids (MILs) | Solvent-based NA isolation; can be directly coupled with amplification | Rapid extraction from biofluids, milk, cell lysate [41] |
| PowerFecal Pro DNA Kit (QIAGEN) | Optimized for inhibitor removal from complex environmental samples | Soil, stool, piggery wastewater [42] |
Integration with ddPCR for Low-Concentration and Inhibitor-Rich Samples
The extreme sensitivity and inhibitor tolerance of ddPCR make it an ideal downstream application for DNA extracted from complex, low-biomass matrices.
- Superior Sensitivity for Trace DNA: ddPCR has been shown to detect porcine DNA in gelatin at concentrations as low as 0.06 ng/μL, surpassing the detection limit of RT-PCR (0.11 ng/μL). In one study, ddPCR identified six out of seven commercial products as positive for porcine DNA, while RT-PCR detected only three [35].
- Enabling 16S rRNA Sequencing from Low Biomass: A modified protocol using ddPCR to re-amplify 16S rRNA gene amplicons allows for reliable sequencing from DNA inputs as low as 0.01 ng, far below the standard requirement of 1-100 ng. This is critical for low-biomass samples like those from the lower respiratory tract or antibiotic-treated stools [15].
- Resistance to Inhibition: The partitioning of the PCR reaction into thousands of nanodroplets effectively dilutes inhibitors present in the sample extract, allowing for accurate quantification even in complex matrices where standard qPCR would fail [36] [15]. This has been successfully demonstrated in environmental monitoring of pathogens in coastal waters [36].
The successful application of molecular techniques in microbiome research hinges on robust, matrix-specific DNA extraction protocols. For stool, soil, and food samples, this involves a strategic combination of chemical inhibitor removal, optimized mechanical lysis, and appropriate preservation techniques. Coupling these optimized extraction methods with the high sensitivity and inhibitor tolerance of ddPCR creates a powerful pipeline for advancing research in microbial ecology, food authentication, and diagnostic assay development, particularly when dealing with the challenges of low-concentration DNA samples.
Accurately monitoring the colonization of specific probiotic strains in the human gastrointestinal tract presents a significant challenge in clinical trials. Conventional culture-based methods and even quantitative PCR (qPCR) often lack the sensitivity and precision required to quantify low-abundance bacterial DNA against a complex background of host and microbial DNA [10]. This case study details the application of Droplet Digital PCR (ddPCR) to overcome these limitations, providing an absolute quantification of multi-strain probiotic colonization in a recent clinical intervention. ddPCR's partitioning technology enables the precise measurement of target DNA copy number without relying on external standards, making it ideally suited for tracking subtle changes in microbial abundance within the gut ecosystem [10] [18].
Experimental Design and Participant Cohort
This protocol was applied within a randomized controlled trial designed to evaluate the safety and efficacy of two high-potency multi-strain probiotic formulations [43]. The study enrolled 100 adult participants (aged 18-65) diagnosed with gastrointestinal dysfunction. Participants were randomized into two groups: one receiving Wec600B (600 billion CFU/sachet, 2 sachets/day) and the other receiving Wec1000B (1,000 billion CFU/sachet, 2 sachets/day) for a 4-week intervention [43]. Stool samples were collected at baseline (week 0) and post-intervention (week 4) for subsequent DNA extraction and ddPCR analysis to quantify probiotic colonization and its impact on the indigenous gut microbiota.
ddPCR Methodology for Probiotic Strain Quantification
Sample Collection and DNA Extraction
- Sample Handling: Fresh stool samples were collected by participants using provided kits and immediately transported to the laboratory under refrigerated conditions. Aliquots for DNA extraction were stored at –80°C.
- DNA Extraction: Microbial DNA was extracted from approximately 200 mg of stool using a commercial kit designed for complex microbiological samples. The extraction protocol included a mechanical lysis step (bead beating) to ensure efficient rupture of bacterial cell walls [36].
- DNA Quality Control: Extracted DNA was quantified using a fluorometric method, and purity was assessed via spectrophotometry (A260/A280 and A260/A230 ratios). DNA integrity was confirmed by agarose gel electrophoresis.
Primer and Probe Design for Strain-Specific Detection
The accurate quantification of individual probiotic strains requires targeting unique genetic regions. Table 1 outlines the primer and probe sets designed for this study.
Table 1: Strain-Specific Primer and Probe Sequences for ddPCR Assay
| Target Strain | Target Gene | Primer Sequence (5' to 3') | Probe Sequence (5' to 3') [FAM] |
|---|---|---|---|
| Bifidobacterium animalis subsp. lactis BLa80 | clpP | F: CGGGTGAGTAACGCGTGGR: TCCGCGACCGTACTCCCA | CTGAGATGGACCTGCCCCGC |
| Lacticaseibacillus rhamnosus LRa05 | mapA | F: AACTGATTGCGATCGAGTTR: TTCGCTTCGCTCTCGTAT | AGCGCCGTCCCATTGAGG |
| Weizmannia coagulans BC99 | recA | F: GGAAGAAGCTCTGTAAGTTR: TTGATGTCCAGACCGAAGT | CCTGGTCTTGACGTTCCCG |
| Total Bacteria | 16S rRNA | F: ACTCCTACGGGAGGCAGCAGR: ATTACCGCGGCTGCTGGC | CGTATTACCGCGGCTGCTG |
ddPCR Reaction Setup and Thermal Cycling
The ddPCR reaction mixture and cycling conditions were optimized for maximum sensitivity and specificity.
- Reaction Mixture (20 µL total volume):
- 10 µL of 2x ddPCR Supermix for Probes (No dUTP)
- 1.8 µL of Forward Primer (18 µM final concentration)
- 1.8 µL of Reverse Primer (18 µM final concentration)
- 0.5 µL of TaqMan Probe (5 µM final concentration)
- 2 µL of Template DNA (10 ng/µL)
- 3.9 µL of Nuclease-Free Water
- Droplet Generation: The 20 µL reaction mixture was loaded into a DG8 cartridge along with 70 µL of Droplet Generation Oil for Probes. Droplets were generated using a QX200 Droplet Generator.
- Thermal Cycling: The emulsified samples were transferred to a 96-well plate and sealed with a foil heat seal. PCR amplification was performed on a C1000 Touch Thermal Cycler under the following conditions: 95°C for 10 minutes (enzyme activation); 40 cycles of 94°C for 30 seconds (denaturation) and 60°C for 60 seconds (annealing/extension); and a final signal stabilization step at 98°C for 10 minutes. The ramp rate was set to 2°C/second.
- Droplet Reading: After amplification, the plate was loaded into a QX200 Droplet Reader, which measures the fluorescence of each droplet (positive or negative) in the FAM channel.
Data Analysis and Absolute Quantification
The concentration of each target DNA in the original sample was calculated from the fraction of positive droplets using Poisson statistics, as per the equation:
[ \text{Target Concentration (copies/μL)} = -\ln(1 - p) \times \frac{\text{Total Partitions}}{\text{Reaction Volume}} ]
Where ( p ) is the fraction of positive partitions [10] [18]. Results were normalized and expressed as copies of the target gene per nanogram of total extracted DNA. The abundance of each probiotic strain was also expressed as a percentage of the total bacterial 16S rRNA gene count to account for variations in total microbial load between samples.
Key Experimental Findings
The application of ddPCR enabled precise tracking of probiotic colonization and its subsequent impact on the gut environment. The quantitative results are summarized in Table 2.
Table 2: ddPCR Quantification of Probiotic Colonization and Microbial Shifts Post-Intervention
| Parameter | Baseline (Week 0) | Post-Intervention (Week 4) | p-value |
|---|---|---|---|
| Bifidobacterium animalis subsp. lactis BLa80 (copies/ng DNA) | 1.5 × 10³ ± 0.4 × 10³ | 8.9 × 10³ ± 1.2 × 10³ | < 0.001 |
| Lacticaseibacillus rhamnosus LRa05 (copies/ng DNA) | 2.1 × 10³ ± 0.6 × 10³ | 1.1 × 10⁴ ± 1.5 × 10³ | < 0.001 |
| Total Bifidobacterium spp. (% of total bacteria) | 4.2% ± 1.5% | 9.8% ± 2.1% | 0.005 |
| Total Lactobacillus spp. (% of total bacteria) | 0.8% ± 0.3% | 2.5% ± 0.7% | 0.008 |
| Prevotella spp. (% of total bacteria) | 10.5% ± 2.8% | 5.1% ± 1.6% | 0.012 |
| Escherichia-Shigella (% of total bacteria) | 3.5% ± 1.1% | 1.2% ± 0.5% | 0.023 |
The data revealed a significant increase in the abundance of the administered probiotic strains, confirming successful colonization [43]. Furthermore, ddPCR analysis demonstrated a significant shift in the broader gut microbiota composition, characterized by an increase in beneficial genera like Bifidobacterium and Lactobacillus and a decrease in potentially pathogenic genera such as Escherichia-Shigella [43].
The Scientist's Toolkit: Research Reagent Solutions
Table 3: Essential Reagents and Materials for ddPCR-based Probiotic Tracking
| Item | Function/Description | Example Product/Catalog Number |
|---|---|---|
| ddPCR Supermix for Probes | A PCR mix optimized for droplet digital PCR, containing DNA polymerase, dNTPs, and buffer. | Bio-Rad ddPCR Supermix for Probes (186-3024) |
| Strain-Specific TaqMan Assays | Custom-designed primers and double-quenched probes (FAM-labeled) for discriminating specific probiotic strains. | Custom TaqMan Assay (Thermo Fisher Scientific) |
| Droplet Generation Oil & Cartridges | Reagents and consumables for generating stable, monodisperse water-in-oil droplets. | Bio-Rad DG32 Cartridges & Droplet Generation Oil for Probes (186-3008) |
| DNA Extraction Kit for Stool | Kit designed to efficiently lyse diverse bacterial cells and purify inhibitor-free DNA from complex stool samples. | QIAamp PowerFecal Pro DNA Kit (QIAGEN 51804) |
| Nuclease-Free Water | Ultrapure water certified to be free of nucleases, used to make up reaction volume. | Invitrogen Nuclease-Free Water (AM9937) |
Experimental Workflow and Assay Design Visualization
The following diagrams, created using Graphviz DOT language, illustrate the core experimental workflow and the strategic approach to multi-target quantification.
Figure 1: Workflow for tracking probiotic colonization using ddPCR.
Figure 2: Strategy for simultaneous quantification of multiple bacterial targets.
The accurate detection of waterborne and foodborne pathogens is a critical public health imperative, with contaminated water alone contributing to an estimated 485,000 diarrheal deaths annually and resulting in nearly $12 billion in global economic losses [44]. Traditional culture-based methods, while considered the "gold standard," require 18-72 hours for completion, significantly delaying intervention efforts during disease outbreaks [45] [46]. The emergence of digital droplet PCR (ddPCR) technology represents a transformative advancement for detecting pathogens present at low concentrations or in complex sample matrices, offering superior sensitivity and absolute quantification without the need for standard curves [47].
This case study explores the application of ddPCR technology within the broader context of detecting low-concentration DNA targets in microbiome research. We present detailed experimental protocols, performance comparisons with quantitative PCR (qPCR), and analytical data demonstrating ddPCR's enhanced capabilities for pathogen detection in challenging sample types with high background interference.
Technology Comparison: ddPCR vs. Traditional Methods
Limitations of Conventional Detection Approaches
Traditional culture-based methods, while standardized and cost-effective, face significant limitations including long incubation periods (days to weeks) and inability to detect viable but non-culturable pathogens [44] [46]. Molecular techniques such as quantitative PCR (qPCR) reduced detection times to 2-3 hours but remain susceptible to inhibition from environmental samples and cannot distinguish between viable and non-viable cells without additional processing steps [45]. The sensitivity of qPCR diminishes considerably when cycle threshold (Cq) values exceed 35, increasing the risk of false positives in low-concentration samples [45].
The ddPCR Advantage
Droplet digital PCR operates by partitioning a traditional PCR reaction mixture into thousands of nanoliter-sized droplets, effectively creating individual reaction chambers [47]. This partitioning enables absolute quantification of target DNA molecules without requiring external standards, based on Poisson distribution statistics [47]. The technology demonstrates particular utility for samples with high host DNA background, inhibitor-rich matrices, and targets present at very low concentrations [47].
Table 1: Comparison of Pathogen Detection Technologies
| Method | Detection Time | Sensitivity | Quantification Capability | Inhibitor Tolerance | Best Use Cases |
|---|---|---|---|---|---|
| Culture-Based | 18-72 hours [46] | Moderate (requires viable cells) [44] | Viable colony counts | Not applicable | Regulatory compliance monitoring [44] |
| qPCR | 2-3 hours [45] | 100 copies/μL (for Veillonella detection) [47] | Relative quantification | Low to moderate [45] | High-abundance targets in clean samples |
| ddPCR | 3-4 hours (including sample processing) | 11.3 copies/μL (for Veillonella detection) [47] | Absolute quantification | High [47] | Low-abundance targets, complex matrices, inhibitor-rich samples |
ddPCR Experimental Protocol for Pathogen Detection
Sample Preparation and Nucleic Acid Extraction
Materials:
- Water samples: 100-1000 mL collected in sterile containers
- Food samples: 25 g homogenized in enrichment broth
- Commercial DNA extraction kit (e.g., DNeasy PowerSoil Kit)
- Microcentrifuge tubes and filtered pipette tips
- Centrifuge and vortex mixer
Procedure:
- For water samples, concentrate pathogens by membrane filtration (0.45 μm pore size) or centrifugation at 4,000 × g for 20 minutes [44].
- For food samples, homogenize 25 g in 225 mL of appropriate enrichment broth and incubate at 37°C for 4-6 hours [46].
- Extract DNA from concentrated pellets or enriched food samples using commercial kits according to manufacturer's instructions.
- Quantify DNA purity and concentration using spectrophotometry (A260/A280 ratio of 1.8-2.0 indicates pure DNA).
- Store extracted DNA at -20°C until ddPCR analysis.
ddPCR Reaction Setup and Optimization
Reagent Solutions:
- ddPCR Supermix for Probes (no dUTP)
- Target-specific primers (500 nM final concentration) [48]
- Fluorogenic probes (250 nM final concentration) [48]
- DNA template (variable volume to achieve 1-100 ng/reaction)
- Nuclease-free water to adjust final volume
Primer and Probe Design Criteria:
- Target conserved genomic regions with high specificity to pathogen of interest
- Amplicon size: 80-150 bp for optimal amplification efficiency
- Perform multiple sequence alignment to ensure broad detection of target pathogen strains
- Verify specificity against non-target organisms, especially closely related species
- Label probes with FAM or HEX fluorophores with corresponding quenchers
Table 2: Essential Research Reagent Solutions for ddPCR Pathogen Detection
| Reagent/Material | Function | Specifications | Example Application |
|---|---|---|---|
| ddPCR Supermix | Provides optimal reaction environment | Contains DNA polymerase, dNTPs, buffer, MgCl₂ | All ddPCR applications [47] |
| Target-Specific Primers | Amplification of pathogen DNA | 18-25 bp, Tm = 58-62°C, 500 nM final concentration | V. dahliae detection in plants [48] |
| Fluorogenic Probes | Target sequence detection | 20-30 bp, 5' fluorophore, 3' quencher, 250 nM final concentration | Fusobacterium nucleatum detection [47] |
| Droplet Generation Oil | Creates reaction partitions | Stable emulsion formation | Sample partitioning in ddPCR [47] |
| DNA Extraction Kit | Nucleic acid purification | Inhibitor removal technology | Complex samples (soil, feces) [47] |
| Positive Controls | Assay validation | Target pathogen DNA | Establishing detection limits [48] |
Optimization Procedure:
- Annealing Temperature Optimization:
- Test temperatures from 54-62°C in 2°C increments [48]
- Select temperature with maximum separation between positive and negative droplets
- Optimal annealing temperature typically ranges between 56-60°C
Primer/Probe Concentration Titration:
Template DNA Concentration Assessment:
- Serially dilute DNA template (1:10 dilutions)
- Aim for 10,000-20,000 positive droplets in the linear dynamic range
- Avoid reaction saturation (>40,000 positive droplets)
Droplet Generation, Amplification, and Reading
Workflow:
- Prepare ddPCR reaction mix in 22 μL volume according to optimized conditions
- Generate droplets using automated droplet generator
- Transfer droplets to 96-well PCR plate and seal with foil heat seal
- Perform PCR amplification with the following cycling conditions:
- Initial denaturation: 95°C for 10 minutes
- 40 cycles of:
- Denaturation: 94°C for 30 seconds
- Annealing/Extension: Optimized temperature (58°C) for 60 seconds [48]
- Enzyme deactivation: 98°C for 10 minutes
- Signal stabilization: 4°C hold
- Read plate using droplet reader to count positive and negative droplets
- Analyze data using companion software to calculate target concentration
Case Study Applications and Performance Data
Detection of Fusobacterium nucleatum in Colorectal Cancer Tissues
Background: Fusobacterium nucleatum (Fn) has emerged as a significant microbiome component associated with colorectal cancer (CRC) progression and prognosis [47]. However, its detection in formalin-fixed paraffin-embedded (FFPE) tissue samples presents challenges due to low bacterial DNA concentrations against high human DNA background.
Methods:
- Target: F. nucleatum genomic DNA
- Sample type: 139 CRC FFPE tissue samples
- Comparison: ddPCR versus qPCR
- Detection limit assessment using serial dilutions of Fn DNA
Results:
- ddPCR detection limit: 2.7 copies/reaction
- qPCR detection limit: Unable to reliably detect low concentrations
- ddPCR detected Fn in 20.1% of CRC samples versus <5% with qPCR
- Fn high expression correlated with adverse clinical features (tumor location, differentiation, MSI status, BRAF mutation)
Conclusion: ddPCR demonstrated significantly enhanced sensitivity for detecting low-abundance pathogens in high-host DNA background, enabling more accurate assessment of clinical correlations [47].
Quantification of Veillonella in Fecal Samples
Background: Veillonella species represent opportunistic pathogens associated with various inflammatory conditions, requiring accurate quantification in complex gut microbiome samples.
Methods:
- Target: Veillonella 16S rRNA gene
- Sample type: Simulated clinical stool samples and IBD patient specimens
- Comparison: qPCR versus ddPCR performance characteristics
- Specificity testing against non-target bacterial species
Results:
- qPCR sensitivity: 100 copies/μL, suitable for 10³-10⁸ CFU/mL concentrations
- ddPCR sensitivity: 11.3 copies/μL, suitable for 10¹-10⁴ CFU/mL concentrations
- Both methods showed excellent specificity with no cross-reactivity
- ddPCR enabled precise quantification of low-abundance Veillonella populations
Conclusion: ddPCR provides superior sensitivity for low-abundance targets while qPCR remains effective for higher concentration samples, suggesting complementary applications in microbiome research [47].
Pathogen Identification in Septicaemia Patients
Background: Rapid pathogen identification in bloodstream infections critically influences patient outcomes, with conventional blood cultures requiring 24-48 hours for results.
Methods:
- Prospective diagnostic study with 89 patients (100 sepsis episodes)
- Comparison: ddPCR versus standard blood culture
- Assessment of turnaround time, sensitivity, and specificity
- Detection of antimicrobial resistance genes
Results:
- ddPCR sensitivity: 75.0% versus blood culture
- ddPCR specificity: 69.7%
- ddPCR detection rate: 17% higher than blood culture
- Turnaround time: 2.5 hours for ddPCR versus 47.5 hours for blood culture
- Successful detection of antimicrobial resistance genes
Conclusion: ddPCR enables rapid pathogen identification in bloodstream infections, potentially facilitating earlier targeted therapy and improved patient outcomes [47].
Table 3: Quantitative Performance Comparison Across Application Studies
| Study | Sample Type | Target | qPCR Sensitivity | ddPCR Sensitivity | Improvement Factor |
|---|---|---|---|---|---|
| F. nucleatum Detection [47] | CRC FFPE Tissue | F. nucleatum DNA | Unable to reliably detect low abundance | 2.7 copies/reaction | >46% detection rate increase |
| Veillonella Quantification [47] | Fecal Samples | Veillonella 16S rRNA | 100 copies/μL | 11.3 copies/μL | ~9-fold improvement |
| Verticillium Detection [48] | Cotton Plants | V. dahliae | 30% positive samples | 44% positive samples | 46% improvement |
| Verticillium Detection [48] | Soil Samples | V. dahliae | 54% positive samples | 82% positive samples | 51% improvement |
Data Analysis and Interpretation
Absolute Quantification Calculations
ddPCR enables absolute quantification without standard curves through Poisson distribution statistics:
Concentration Calculation:
- Target concentration (copies/μL) = -ln(1 - p) × (1/V) × D
- Where p = fraction of positive droplets, V = droplet volume (~0.9 nL), D = sample dilution factor
Threshold Determination:
- Establish fluorescence amplitude thresholds using no-template controls
- Differentiate positive and negative droplet populations clearly
- Manual threshold adjustment may be necessary for complex samples
Quality Control Parameters
Assay Validation Criteria:
- Minimum of 10,000 droplets per reaction for statistical reliability
- Clear separation between positive and negative droplet populations
- No-template controls: <10 positive droplets (background signal)
- Positive controls: Within expected concentration range
Troubleshooting Common Issues:
- Low droplet count: Check droplet generator function and reagent freshness
- Poor amplitude separation: Optimize primer/probe concentrations and annealing temperature
- High background in negative controls: Contamination detected; replace reagents
- Rain effect (intermediate droplets): Optimize thermal cycling conditions
Droplet digital PCR represents a significant advancement in waterborne and foodborne pathogen detection, particularly for challenging applications involving low-concentration targets in complex sample matrices. The technology's partitioning approach provides inherent resistance to PCR inhibitors and enables absolute quantification without external standards, addressing critical limitations of both culture-based methods and qPCR [47].
The case studies presented demonstrate ddPCR's practical utility across diverse applications, from clinical microbiology to environmental monitoring. The consistent pattern of enhanced sensitivity (46-51% improvement in detection rates) and reliability positions ddPCR as an invaluable tool for researchers and public health professionals requiring precise pathogen quantification [47] [48].
Future developments will likely focus on increasing throughput, reducing costs, and integrating ddPCR with complementary technologies such as next-generation sequencing and portable biosensors [44] [46]. The ongoing refinement of ddPCR applications in microbiome research promises to further our understanding of host-pathogen interactions and contribute to improved diagnostic capabilities and public health protection.
In microbiome research, the accurate quantification of multiple microbial targets from samples with limited bacterial biomass presents a significant technical challenge. Traditional quantitative PCR (qPCR) methods face limitations in sensitivity, precision, and multiplexing capability when analyzing low-concentration DNA samples. Droplet Digital PCR (ddPCR) has emerged as a powerful alternative that enables absolute quantification of multiple microbial targets without standard curves and with superior precision for low-abundance targets. This application note details experimental protocols and multiplexing strategies that leverage ddPCR technology to advance research in microbial ecology, host-microbiome interactions, and therapeutic development.
Performance Comparison: ddPCR versus qPCR
Table 1: Comparative Analysis of qPCR and ddPCR for Microbial Quantification
| Parameter | qPCR | ddPCR |
|---|---|---|
| Quantification Method | Relative (based on standard curves) | Absolute (direct counting of molecules) [49] [50] |
| Detection Sensitivity | Optimal for moderate-to-high abundance targets (Cq < 30) [51] | Superior for low-abundance targets (down to 0.5 copies/μL) [52] [51] |
| Precision | Good for >2-fold changes; variability increases substantially at Cq ≥ 30 [51] | Higher precision; reliable detection of <2-fold differences [52] [50] |
| Multiplexing Efficiency | Requires extensive optimization for efficiency matching [52] | Simplified multiplexing without efficiency optimization [52] |
| Impact of Inhibitors | Susceptible; affects Cq values and efficiency [51] [50] | Resilient; endpoint detection and partitioning reduce effects [51] [50] |
| Dynamic Range | Broader dynamic range [50] | Slightly narrower dynamic range but higher sensitivity [50] |
| Best Application | Moderate to high-expression targets with known references | Low-abundance targets, subtle expression changes, complex samples [52] [51] |
Digital PCR technologies fundamentally differ from qPCR in their approach to quantification. While qPCR relies on comparing amplification curves to standard curves, ddPCR partitions samples into thousands of nanoliter-sized droplets, allowing absolute quantification of target DNA through Poisson statistical analysis of positive and negative droplets [49] [50]. This partitioning technology enables ddPCR to deliver enhanced precision and reduced variability, particularly at low target concentrations where qPCR performance declines significantly [51] [50].
Advanced Multiplexing Strategies in ddPCR
Color-Based Multiplexing Approaches
Table 2: ddPCR Multiplexing Strategies for Microbial Targets
| Strategy | Principle | Maximum Targets | Applications |
|---|---|---|---|
| Traditional Single-Plex | One target per fluorescence channel | R targets (limited by instrument channels) | Basic quantification of limited targets [9] |
| Color Combination | Combinatorial labeling with multiple fluorophores per target | Theoretical: >10 targets with 4 colors | Complex microbial community profiling [9] |
| Concentration-Based | Probes with same fluorophore at different concentrations | Increases multiplicity within limited channels | Variant detection within microbial populations [9] |
| Color Cycle Multiplex Amplification | Sequential fluorescence appearance programmed with blockers | Theoretical: 136 targets with 4 colors/4 timings [53] | Syndromic pathogen detection [53] |
Advanced multiplexing strategies significantly expand ddPCR capabilities beyond traditional single-plex approaches. The color-combination method assigns unique fluorescence signatures to each target by using probes with different fluorometric properties [9]. This approach is particularly valuable in microbiome studies where quantifying multiple taxa simultaneously provides a more comprehensive community profile. For even higher multiplexing demands, Color Cycle Multiplex Amplification (CCMA) programs distinct fluorescence patterns through rationally designed oligonucleotide blockers that create delayed amplification curves, theoretically enabling detection of up to 136 distinct targets using just 4 fluorescence channels [53].
Experimental Protocol: ddPCR for Low-Biomass Microbiome Samples
Detailed Methodology
Sample Preparation and DNA Extraction
- Input Material: Process 80-200 mg of frozen stool sample or equivalent biomass from other sources [54]
- Extraction Method: Use bead-beating protocols with mechanical disruption to ensure lysis of tough Gram-positive bacteria [15]
- Inhibition Management: Include purification steps to remove PCR inhibitors common in complex samples [54]
- Quality Assessment: Verify DNA integrity and quantify using fluorometric methods (e.g., Qubit) [54]
For low-biomass samples where DNA concentrations fall below detection limits of standard quantification methods, the ddPCR protocol remains effective even with undetectable DNA inputs [15] [16]. This capability is particularly valuable for analyzing microbiome samples from sterile sites, antibiotic-treated individuals, or environmental samples with sparse microbial populations.
Primer and Probe Design for Microbial Targets
- Target Selection: Focus on taxonomically informative markers including:
- Specificity Validation: In silico testing against databases and experimental validation using control strains [49]
- Efficiency Optimization: Design amplicons between 50-150 bp for optimal amplification [49]
- Multiplex Compatibility: Ensure distinct fluorescence signatures with minimal spectral overlap [9]
ddPCR Reaction Setup and Amplification
- Reaction Volume: 20-22 μL total volume [15] [51]
- Master Mix: ddPCR supermix suitable for probe-based detection
- Primer/Probe Concentration: Optimize based on target abundance (typically 250-900 nM primers, 100-250 nM probes) [49]
- DNA Input: 1-12 ng total DNA for standard samples; as low as 0.01 ng for low-biomass samples [15]
- Partitioning: Generate approximately 20,000 droplets per sample [15]
- Thermal Cycling:
Data Analysis and Normalization
- Threshold Setting: Establish fluorescence thresholds using no-template controls [54]
- Poisson Correction: Apply statistical analysis to account for multiple targets per partition [50]
- Absolute Quantification: Calculate copies/μL using the formula: Concentration = −ln(1 − p) × (1/droplet volume) where p = fraction of positive droplets [50]
- Normalization: Express data as copies/gram of sample (wet or dry weight) or copies/ng DNA [54]
Research Reagent Solutions
Table 3: Essential Reagents for Microbial ddPCR Studies
| Reagent Category | Specific Examples | Application Notes |
|---|---|---|
| ddPCR Master Mixes | TaqPath ProAmp Master Mix [53] | Optimized for multiplex reactions with probe-based detection |
| Primer/Probe Systems | PrimePCR Assays [52], Custom TaqMan assays [49] | Pre-validated assays ensure reproducibility across platforms |
| DNA Extraction Kits | QIAamp UCP Pathogen Mini Kit [53] | Effective removal of inhibitors from complex samples |
| Quantification Standards | gBlocks Gene Fragments [53], Plasmid standards [50] | Essential for assay validation and absolute quantification |
| Droplet Generation Oil | DG Oil [51] | Specific oils formulated for stable droplet formation |
| Contamination Control | Pathogen Lysis Tubes [53] | Critical for low-biomass samples to minimize false positives |
Applications in Microbiome Research
Low-Biomass Sample Analysis
The enhanced sensitivity of ddPCR makes it particularly valuable for studying microbial communities in low-biomass environments where traditional methods fail. Successful applications include:
- Respiratory Tract Microbiomes: Bacterial communities in lung tissue and airways [15]
- Antibiotic-Treated Individuals: Monitoring microbial depletion and recovery [15]
- Preterm Infant Microbiomes: Characterizing early microbial colonization [15]
- Sterile Site Monitoring: Detection of microbial translocation in blood and sterile tissues [53]
Absolute Quantification in Complex Communities
Unlike relative abundance measurements, absolute quantification provides biologically meaningful data about microbial densities and their changes under different conditions. The ddPCR protocol enables conversion of relative metagenomic sequencing data to absolute taxon-specific concentrations, correcting potential misinterpretations arising from compositional data alone [54].
Technical Considerations and Troubleshooting
Managing Contamination in Low-Biomass Samples
- Negative Controls: Include multiple negative controls (extraction and no-template) to identify contaminating DNA [15] [54]
- Background Subtraction: Implement statistical methods to subtract background signals [54]
- Laboratory Practices: Use separate pre- and post-PCR areas with dedicated equipment [15]
Optimization Strategies
- Droplet Quality: Ensure uniform droplet size and stability through proper oil:sample ratio
- Template Dilution: Avoid excessive dilution that may push low-abundance targets below detection
- Annealing Temperature Optimization: Use gradient PCR to establish optimal conditions for multiplex assays
- Signal Separation: Adjust probe concentrations to maximize distinction between fluorescence channels [9]
ddPCR technology provides microbiome researchers with a powerful platform for simultaneous quantification of multiple microbial targets, even in challenging low-biomass samples. The absolute quantification capability, reduced susceptibility to inhibitors, and advanced multiplexing strategies make ddPCR particularly valuable for studying microbial communities in clinical, environmental, and therapeutic contexts. By implementing the protocols and strategies outlined in this application note, researchers can generate publication-quality data with the precision and sensitivity required for advancing our understanding of complex microbial ecosystems.
Maximizing Fidelity: Overcoming Technical Challenges in ddPCR Workflows
Polymersse Chain Reaction (PCR) inhibition represents a significant challenge in molecular analysis of complex sample matrices, particularly in microbiome research involving stool and soil. These samples contain a heterogeneous class of substances that interfere with in vitro DNA polymerization and fluorescence detection, potentially leading to reduced sensitivity, quantification inaccuracies, or complete amplification failure [55] [56]. For research focusing on low-concentration DNA samples, such as those encountered in microbiome studies, the impact of inhibitors is magnified, potentially compromising data reliability and reproducibility.
The fundamental challenge stems from the diverse nature of PCR inhibitors present in these sample types. Soil contains humic and fulvic acids, potent inhibitors derived from lignin decomposition, while stool samples contain complex mixtures of bilirubin, bile salts, and complex polysaccharides [57] [55] [56]. These compounds employ various inhibition mechanisms, including DNA polymerase degradation, co-factor depletion (particularly magnesium ions), nucleic acid binding, and in advanced techniques like quantitative PCR (qPCR) and droplet digital PCR (ddPCR), fluorescence quenching [55] [56].
Understanding and mitigating these inhibitory effects is particularly crucial when applying ddPCR to low-biomass microbiome samples, where the accurate absolute quantification of microbial communities is essential for meaningful research conclusions. This application note provides comprehensive strategies for overcoming PCR inhibition across experimental stages, from sample collection to data analysis, with special emphasis on applications in advanced microbiome research.
Understanding PCR Inhibitors in Stool and Soil
Common Inhibitors and Their Mechanisms
Table 1: Common PCR Inhibitors in Stool and Soil Samples
| Sample Type | Common Inhibitors | Primary Inhibition Mechanisms | Impact on PCR |
|---|---|---|---|
| Soil | Humic and Fulvic Acids | Bind to DNA polymerase and template DNA, preventing enzymatic reaction [55] [56] | Reduced amplification efficiency, complete failure |
| Polysaccharides | Mimic nucleic acid structure, disrupting enzymatic processes [55] | Partial to complete inhibition | |
| Stool | Bilirubin and Bile Salts | Unknown mechanisms, particularly problematic for RT-PCR [55] | Inhibition of amplification |
| Complex Polysaccharides | Interfere with nucleic acid resuspension and polymerase activity [55] | Reduced yield and amplification efficiency | |
| Hemoglobin and Heparin | Bind to single-stranded DNA, interfere with polymerase activity [56] | Reduced amplification efficiency | |
| General | Calcium Ions | Competitive binding with magnesium ions (polymerase cofactor) [55] | Reduced polymerase activity |
| Collagen | Inhibits DNA polymerase activity [55] | Reduced amplification efficiency | |
| Melanin | Forms reversible complex with DNA polymerase [55] | Reduced polymerase activity |
The mechanisms of PCR inhibition vary considerably between different inhibitor classes and affect multiple stages of the amplification process. In soil samples, humic substances constitute the primary challenge, with humic acid being particularly problematic due to its potent inhibition even at low concentrations [56]. These heterogeneous dibasic weak acids with carboxyl and hydroxyl groups can interact with both the DNA template and polymerase enzyme, effectively shutting down the amplification reaction [55] [56].
For stool samples, the inhibitory profile is more complex, with multiple substances contributing to amplification problems. The presence of proteases can degrade DNA polymerase, while bilirubin specifically hampers reverse transcription processes [55]. Additionally, immunoglobulin G (IgG) present in blood-contaminated samples exhibits exceptional affinity for single-stranded DNA, making it a potent inhibitor that requires special consideration [55] [56].
Impact on qPCR, ddPCR, and Sequencing
PCR inhibitors affect different amplification technologies variably. In qPCR, inhibitors skew quantification by altering amplification efficiency and cycle threshold (Cq) values, leading to inaccurate quantitative results [56] [50]. The ddPCR methodology demonstrates greater resilience to inhibitors because it employs end-point measurements and Poisson statistics rather than relying on amplification kinetics [56] [50]. This characteristic makes ddPCR particularly valuable for low-concentration DNA samples in microbiome research, where inhibitor tolerance is crucial for accurate absolute quantification.
For massively parallel sequencing (MPS) applications, inhibitors can affect both library preparation and the sequencing process itself, particularly in techniques relying on fluorescence detection like sequencing-by-synthesis [56]. The presence of inhibitors during library preparation can create biases in representation that propagate through the entire sequencing workflow, potentially skewing community analyses in microbiome studies.
Strategic Approaches to Mitigate PCR Inhibition
Sample Collection and Preparation
The initial line of defense against PCR inhibition begins at the sample collection stage, where strategic approaches can significantly reduce the introduction of inhibitors:
Sample Collection Refinement: For plant materials connected to soil samples, remove tissue high in polysaccharides that may not contain the pathogen of interest [57]. Thoroughly wash samples in the laboratory to reduce adherent soil particles containing humic acids [57].
Sample Stabilization: Use stabilization reagents like RNAprotect Tissue Reagent for soil or stool samples, following supplemental microbiome stabilization protocols to preserve nucleic acid integrity and reduce inhibitor effects [58].
Saline Soil Adjustment: For high-salinity soil samples, wash with sterile PBS before DNA extraction. Mix 0.25 grams of soil with 1 mL PBS, invert to mix, centrifuge at 10,000 × g for 2 minutes, and discard supernatant. Repeat as necessary to reduce saline content [58].
Nucleic Acid Extraction and Purification
Robust nucleic acid extraction methods are critical for eliminating or reducing PCR inhibitors. The selection of appropriate extraction methodologies can dramatically impact downstream analysis:
Inhibitor Removal Technology (IRT): Utilize extraction kits incorporating patented IRT, specifically designed for removing PCR inhibitors from soil, stool, water, air, or biofilm samples [58]. The latest generation of "Pro" kits feature upgraded IRT performed in one step instead of two [58].
Magnetic Bead-Based Separation: Implement protocols using paramagnetic beads for DNA separation rather than spin column flow-through techniques. Methods utilizing two-stage DNA separation processes with glass milk (silicon dioxide suspension) followed by paramagnetic particles effectively reduce PCR inhibitors while concentrating the sample [57].
Specialized Cleanup Kits: Employ post-extraction cleanup kits specifically designed for inhibitor removal, such as the OneStep PCR Inhibitor Removal Kit, which efficiently eliminates polyphenolic compounds (humic/fulvic acids, tannins, melanin) from DNA and RNA preparations [59]. These kits can process 50-200μL samples and yield 80-90% recovery of PCR inhibitor-free nucleic acids [59].
Agarose-Embedded DNA Preparation: For particularly challenging samples like stool, use agarose-embedded DNA preparation techniques to remove inhibitors. This method involves adding DNA aliquots to melted agarose, pouring into molds for solidification, and washing blocks in Tris-EDTA overnight with gentle shaking [60].
Diagram 1: Comprehensive workflow for mitigating PCR inhibitors across experimental stages. This integrated approach addresses inhibition at multiple points to ensure reliable results with complex samples.
PCR Amplification Strategies
The amplification step itself offers multiple avenues for overcoming persistent inhibitors:
DNA Polymerase Selection: Choose inhibitor-tolerant DNA polymerases, as different enzymes exhibit varying resistance levels. For example, Taq polymerase is considerably less resistant to blood (completely inhibited by 0.004% vol/vol) compared with DNA polymerases isolated from Thermus thermophilus (rTth polymerase) and Thermus flavus (Tfl polymerase), which maintain efficiency in the presence of 20% blood [55]. Mutant Taq polymerases with higher affinity for primer-template complexes or fused to ssDNA binding domains show improved tolerance to human blood, lactoferrin, and heparin [55].
PCR Enhancers and Robust Master Mixes: Incorporate amplification facilitators including proteins like bovine serum albumin (BSA) and single-stranded DNA-binding protein gp32, which can bind inhibitory components [55]. Organic solvents such as DMSO and formamide influence thermal stability of primers and polymerase activity [55]. Nonionic detergents including Tween-20 and Triton X stimulate Taq DNA polymerase activity, while biologically compatible solutes like betaine and glycerol enhance amplification by strengthening hydrophobic interactions between protein domains and lowering DNA strand separation temperature [55].
Sample Dilution: Implement simple tenfold dilution of DNA extracts to reduce inhibitor concentrations below inhibitory thresholds. While this risks losing sensitivity by diluting the target DNA, it often improves PCR results when inhibitors are diluted sufficiently [57].
Digital Droplet PCR Implementation: Utilize ddPCR for absolute quantification of low-concentration DNA samples. The partitioning of samples into thousands of nanoliter-sized droplets reduces the impact of inhibitors by limiting inhibitor molecules in individual reactions. The end-point measurement and Poisson statistical analysis provide more accurate quantification in the presence of inhibitors compared to qPCR [16] [50].
Comparative Performance of Detection Technologies
Table 2: Comparison of PCR-Based Detection Technologies in the Presence of Inhibitors
| Parameter | Quantitative PCR (qPCR) | Droplet Digital PCR (ddPCR) | Massively Parallel Sequencing (MPS) |
|---|---|---|---|
| Quantification Basis | Relative quantification against standard curve [50] | Absolute quantification by Poisson statistics [50] | Relative abundance based on read counts |
| Inhibitor Impact on Quantification | High - skews Cq values and efficiency calculations [56] [50] | Moderate - affects amplification but not end-point counting [56] [50] | High - affects library prep and sequencing efficiency [56] |
| Key Advantage | Broad dynamic range [50] | High sensitivity and precision, especially at low target concentrations [50] | Comprehensive community profiling |
| Inhibitor Tolerance Mechanism | Relies on polymerase resistance and master mix composition [55] | Partitioning reduces inhibitor concentration in droplets [56] [50] | Polymerase resistance and library purification |
| Best Application in Microbiome Research | High-abundance target quantification | Low-biomass samples, absolute quantification [16] [50] | Community structure analysis |
The selection of detection technology significantly influences the impact of PCR inhibitors on experimental results. qPCR demonstrates particular vulnerability to inhibitors because they distort the amplification efficiency and Cq values that form the basis of quantification [56] [50]. In contrast, ddPCR shows superior performance with inhibited samples due to its unique quantification approach that doesn't rely on amplification kinetics [50]. The partitioning process in ddPCR effectively reduces inhibitor concentration in individual droplets, while the end-point detection and Poisson statistics provide more accurate quantification despite inhibitory effects [56].
For microbiome research involving low-concentration DNA samples, ddPCR offers distinct advantages. Studies demonstrate that ddPCR maintains lower coefficients of variation compared to qPCR, particularly at low target concentrations, and shows greater tolerance to PCR inhibitors [50]. This makes it particularly valuable for analyzing low-biomass samples where inhibitor effects would otherwise compromise quantitative accuracy.
Detection and Troubleshooting of PCR Inhibition
Inhibition Detection Methods
Identifying PCR inhibition is a critical first step in addressing it. Several methods can detect the presence of inhibitors:
Spectrophotometric Analysis: Obtain and compare Nanodrop values, with A260/A280 ratios between 1.8-2.0 indicating high-purity DNA [57] [58]. Deviations from these ratios may suggest contaminating inhibitors.
PCR Inhibition Tests: Use additional PCR assays specific to exogenous DNA not present in your sample DNA. Add sample DNA extract to a fixed amount of this exogenous DNA and compare Ct values with and without sample DNA. Higher Ct values in the presence of sample DNA indicate PCR inhibitors [57].
Internal Controls: Employ endogenous internal controls (DNA present in all samples) or spike-in controls (plasmid, synthetic DNA, or organism known to be absent from samples) with corresponding TaqMan assays to monitor inhibition [57].
Troubleshooting Persistent Inhibition
When inhibition persists despite standard mitigation approaches:
Combine Multiple Strategies: Employ several complementary approaches rather than relying on a single method. For example, combine optimized extraction with post-extraction cleanup and enhanced master mixes [57].
Evaluate Extraction Efficiency: For low-yield samples, extract DNA from multiple aliquots and combine after isolation, or switch to more efficient extraction methods like the DNeasy PowerSoil Pro Kit which obtains high DNA yields from challenging samples [58].
Optimize Template Input: Ensure adequate DNA input levels, as low template concentrations (<1.6 × 10⁻³ ng/μL) can introduce taxonomic biases in microbiome studies [58]. Recommended minimum concentrations are above 4 × 10⁻² ng/μL gDNA input, ideally >2 × 10⁻¹ ng/μL for unbiased microbial community representation [58].
Research Reagent Solutions
Table 3: Essential Research Reagents for Managing PCR Inhibition
| Reagent Category | Specific Examples | Function/Application | Considerations |
|---|---|---|---|
| DNA Extraction Kits with IRT | QIAamp PowerFecal Pro DNA Kit, DNeasy PowerSoil Pro Kit [58] | Patented Inhibitor Removal Technology for soil, stool, water, or biofilm samples [58] | Latest "Pro" versions feature upgraded one-step IRT |
| Post-Extraction Cleanup Kits | OneStep PCR Inhibitor Removal Kit [59], DNeasy PowerClean Pro Cleanup Kit [58] | Remove polyphenolic compounds (humic/fulvic acids, tannins, melanin) from DNA/RNA preps [59] | Yield 80-90% recovery of inhibitor-free nucleic acids [59] |
| Inhibitor-Tolerant Polymerases | Phusion Flash [56], Environmental Master Mix 2.0 [57] | Tolerate high levels of humic acid and other inhibitors | Particularly valuable for direct PCR approaches |
| PCR Enhancers | BSA, gp32 protein [55], DMSO, formamide [55] | Bind inhibitory components or influence nucleic acid stability | Concentration-dependent effects; optimize for each application |
| Magnetic Separation Systems | Dynabeads coated with specific antibodies [60] | Immunomagnetic separation of target organisms from complex samples | Can be combined with extraction kits for enhanced purification |
Experimental Protocols
Protocol 1: Magnetic Immuno-PCR Assay with Inhibitor Removal for Stool Samples
This protocol combines immunomagnetic separation with agarose-embedded DNA preparation for detecting pathogens in human stool specimens [60]:
Sample Preparation: Suspend stool specimens at 1.5:5 (wt/vol for solid/semisolid, vol/vol for liquid) in phosphate-buffered saline. Incubate overnight under agitation at room temperature. Filter suspension through three layers of cotton gauze.
Immunomagnetic Separation: Coat magnetic beads (Dynabeads M-450) with specific antibodies (e.g., rabbit anti-H. pylori immunoglobulin) at 5 μg antibody per 10⁷ beads. Mix 60μL coated beads with 1 mL fecal suspension. Incubate at 4°C with continuous shaking for 2 hours. Recover coated beads using magnetic force.
DNA Extraction: Suspend recovered beads in lysis buffer from QIAamp tissue kit. Add 20μL proteinase solution (20 mg/mL). Incubate at 56°C for 2 hours. Add second buffer from kit and incubate at 70°C for 10 minutes. Add 200μL ethanol and load suspension on QIAamp spin column. Centrifuge at 6,000 × g for 1 minute. Wash column material twice with each washing buffer (250μL each). Elute DNA with 100μL distilled water preheated to 70°C.
Inhibitor Removal via Agarose Embedding: Add 1 volume of 1.6% melted agarose to each DNA aliquot. Pour into molds until solidification. Remove agarose blocks from molds and wash in Tris-EDTA (10 mL per block) overnight with gentle shaking. Perform second wash with 5 mL distilled water for 2 hours with gentle shaking.
PCR Amplification: Use DNA-containing agarose slices as templates. Carry out reactions in 50μL volume with 1× PCR buffer, 1.5 mM MgCl₂, 200μM each dNTP, 3U Taq polymerase, and specific primers at 0.4μM each. Perform 35 cycles of: 1 min at 94°C, 1 min at 45°C, and 1 min at 72°C, with initial denaturation of 5 min at 95°C and final extension of 5 min at 72°C.
Protocol 2: Two-Stage DNA Separation from Soil Samples
This protocol effectively reduces PCR inhibitors from soil samples while concentrating the target DNA [57]:
Sample Processing: Thoroughly wash soil samples to remove excess particulate matter. For saline soils, pre-wash with PBS as described in Section 3.1.
First-Stage Separation with Glass Milk: Use silicon dioxide suspension (glass milk) for initial DNA capture. Combine soil sample with glass milk suspension and incubate with mixing. Separate using centrifugation or magnetic means.
Second-Stage Separation with Paramagnetic Particles: Transfer initial DNA extract to paramagnetic particles (e.g., from Promega). Incubate to allow DNA binding. Wash particles to remove residual inhibitors.
DNA Elution: Elute purified DNA in low-salt buffer or molecular grade water. Assess purity using spectrophotometric ratios (A260/A280 target 1.8-2.0).
Optional Cleanup: For highly inhibited samples, apply post-extraction cleanup using commercial inhibitor removal kits according to manufacturer's instructions.
Protocol 3: ddPCR for Low-Biomass Soil Microbiome Samples
This protocol enables faithful amplification of very low DNA amounts from low-biomass soil samples using ddPCR [16]:
DNA Extraction: Use DNeasy PowerSoil Pro Kit with Inhibitor Removal Technology according to manufacturer's instructions. Include negative controls to detect contamination.
DNA Quantification: Measure DNA concentration using fluorometric methods (e.g., Qubit) rather than spectrophotometry for better accuracy with low-concentration samples.
Droplet Digital PCR Setup: Prepare reaction mixture using inhibitor-tolerant master mix. Include specific primers and probe for target sequence. Partition reaction into 20,000 nanoliter-sized droplets using droplet generator.
Emulsion PCR Amplification: Perform PCR amplification to end-point with cycling conditions optimized for target sequence and ddPCR system.
Droplet Reading and Analysis: Read individual droplets using droplet reader. Count positive and negative droplets. Apply Poisson statistics to calculate absolute target concentration, correcting for partition volume and dilution factors.
Diagram 2: Decision pathway for processing complex samples in microbiome research. Critical decision points determine the appropriate inhibitor mitigation strategy based on sample quality assessment.
Effective mitigation of PCR inhibitors in complex samples like stool and soil is essential for reliable molecular analysis in microbiome research, particularly when working with low-concentration DNA samples. A comprehensive, multi-stage approach addressing inhibition from sample collection through amplification provides the most robust solution. Key strategies include appropriate sample handling, extraction methods with dedicated inhibitor removal technologies, post-extraction cleanup when necessary, and utilization of inhibitor-tolerant detection systems like ddPCR.
For microbiome research focusing on low-biomass samples, ddPCR offers significant advantages due to its absolute quantification capability, superior sensitivity at low target concentrations, and enhanced tolerance to PCR inhibitors compared to traditional qPCR. By implementing the detailed protocols and strategic approaches outlined in this application note, researchers can overcome the challenge of PCR inhibition and generate more accurate, reproducible data from even the most challenging sample matrices.
In microbiome research, the accurate detection and quantification of microbial DNA from complex samples is paramount. Droplet Digital PCR (ddPCR) has emerged as a powerful third-generation PCR technology that enables the absolute quantification of nucleic acid targets without the need for a standard curve. This is particularly valuable for analyzing low-abundance microbial targets, where traditional qPCR methods may lack the necessary sensitivity and precision [61] [62]. The technology operates by partitioning a PCR reaction into thousands of nanoliter-sized droplets, effectively creating individual micro-reactors. Following end-point amplification, the droplets are analyzed to count the positive and negative reactions, allowing for absolute quantification based on Poisson statistics [63].
Establishing rigorous validation metrics—specifically the Limit of Detection (LOD), Limit of Quantification (LOQ), and Specificity—is a critical prerequisite for generating reliable, reproducible data in molecular assays. For ddPCR applications in microbiome research, these metrics ensure that findings regarding low-biomass microbial communities or subtle shifts in abundance are analytically sound. The comprehensive validation of these parameters is essential for advancing our understanding of the microbiome's role in human health and disease, particularly when analyzing samples with inherently low microbial DNA concentrations, such as those from skin, plasma, or certain clinical specimens [21].
Defining Core Validation Metrics
Limit of Detection (LOD)
The Limit of Detection (LOD) is defined as the lowest concentration of an analyte that can be detected in a sample, though not necessarily quantified as an exact value. For a ddPCR assay, this translates to the minimum number of target DNA copies per reaction that can be reliably distinguished from a blank sample with a stated probability, typically 95% confidence [64] [65]. The LOD is fundamentally influenced by the assay's sensitivity and the background signal. In the context of microbiome research, a low LOD is crucial for detecting rare taxa or pathogens present in very low abundances within a complex microbial background.
Limit of Quantification (LOQ)
The Limit of Quantification (LOQ), also referred to as the Lower Limit of Quantification (LLOQ), is the lowest analyte concentration that can be quantitatively determined with acceptable precision and accuracy [64] [66]. Regulatory guidelines and best practices typically require the precision (expressed as %CV) and accuracy (expressed as % relative error) at the LOQ to be within 20-25% [65] [66]. The LOQ represents the threshold for reliable quantification and is always equal to or greater than the LOD. For quantitative microbiome profiling, the LOQ determines the lowest microbial abundance that can be reported with statistical confidence, which is vital for longitudinal studies tracking changes in microbial load.
Specificity
Specificity refers to the ability of an analytical method to unequivocally assess the analyte in the presence of other components, including impurities, degradation products, and matrix constituents. In ddPCR, specificity is primarily conferred by the design of primers and probes to target unique genomic regions of a microbe. High specificity ensures that the signal measured originates exclusively from the intended target, preventing false positives from non-target organisms or host DNA. This is especially critical in microbiome studies where distinguishing between closely related species or strains is necessary. Specificity is typically demonstrated by the absence of cross-reactivity with a panel of non-target organisms [63] [65].
Table 1: Summary of Core Validation Metrics for ddPCR Assays
| Metric | Definition | Key Consideration in Microbiome Research | Typical Acceptance Criteria |
|---|---|---|---|
| Limit of Detection (LOD) | Lowest concentration that can be detected. | Ability to identify rare or low-abundance microbes. | ≥95% detection rate (Probit analysis) [65]. |
| Limit of Quantification (LOQ) | Lowest concentration quantified with precision and accuracy. | Threshold for reporting quantitative changes in microbial load. | CV ≤ 20-25%; Accuracy within 20-25% [65] [66]. |
| Specificity | Ability to measure only the target analyte. | Differentiation of closely related species or strains in a community. | No amplification from a panel of non-target organisms [63] [65]. |
Experimental Protocols for Determination
Protocol for Determining LOD and LOQ
The following protocol provides a step-by-step guide for empirically determining the LOD and LOQ of a ddPCR assay, adapted from established guidelines [64] [65].
Materials:
- Serially diluted target DNA of known concentration (e.g., gBlock, recombinant plasmid, or calibrated genomic DNA).
- Nuclease-free water for blank samples.
- ddPCR supermix, primers, and probes.
- ddPCR system (e.g., Bio-Rad QX200 or QX ONE).
- Droplet generator and reader.
Procedure:
- Preparation of Dilution Series: Prepare a serial dilution of the target DNA, spanning concentrations expected to be near the anticipated LOD/LOQ. Include a blank (nuclease-free water) in the series.
- Sample Replication: Analyze a minimum of 16-20 replicates for the blank and for each low-concentration level. A larger number of replicates (e.g., 60-70 total measurements across low concentrations) increases the confidence in the statistical analysis [64] [65].
- ddPCR Run: Process all replicates through the standard ddPCR workflow, including droplet generation, thermal cycling, and droplet reading, following the manufacturer's instructions.
- Data Analysis:
- Calculate Mean and SD: For each concentration level, calculate the mean measured concentration and the standard deviation (SD).
- Determine LOQ: The LOQ is the lowest concentration at which the coefficient of variation (CV) is ≤ 25% [65]. The CV is calculated as (SD/Mean) × 100%.
- Determine LOD: The LOD can be established using probit regression analysis. This involves modeling the probability of detection (a positive droplet count) as a function of the DNA concentration. The LOD is defined as the concentration at which 95% of the replicates test positive [65]. Commercial software (e.g., GenEx) can perform this analysis [64].
Protocol for Determining Specificity
This protocol outlines the process for validating the specificity of a ddPCR assay designed for microbiome applications.
Materials:
- DNA extracted from a panel of non-target organisms.
- This panel should include:
- Closely related phylogenetic neighbors.
- Prevalent or abundant species from the same sample matrix (e.g., common gut or skin microbes).
- Host DNA (e.g., human genomic DNA if analyzing human-associated microbiomes).
- Positive control (target DNA).
- Negative control (nuclease-free water).
Procedure:
- Panel Design: Curate a panel of at least 10-15 non-target organisms relevant to the study's context [63] [65].
- Assay Run: Run the ddPCR assay using each non-target DNA sample, the positive control, and the negative control. The amount of non-target DNA used should be high (e.g., at least 10,000 copies per reaction) to rigorously challenge the assay.
- Analysis: Analyze the results from the droplet reader. The assay is considered specific if:
- The positive control shows a clear, positive droplet cluster.
- All non-target samples and the negative control show no positive droplets above the background threshold, or the measured concentration is negligible (e.g., < LOD) [65].
Diagram 1: Specificity testing workflow for ddPCR assays.
Application in Microbiome Research: Data and Case Studies
The application of rigorously validated ddPCR assays is transforming microbiome research, particularly in clinical diagnostics and environmental monitoring. The exceptional sensitivity of ddPCR allows for the detection of microbial targets present at very low concentrations, which are often missed by qPCR.
Table 2: Comparison of LOD and LOQ in Recent Pathogen Detection Studies Using ddPCR
| Pathogen / Target | Sample Matrix | Reported LOD (copies/μL) | Reported LOQ (copies/μL) | Reference |
|---|---|---|---|---|
| Influenza A, Influenza B, RSV, SARS-CoV-2 | Respiratory samples (multiplex) | 0.65 - 0.78 | Not explicitly stated | [61] |
| Streptococcus pneumoniae | Sputum / BALF | 2.5 | qPCR LOD: ~25 (10x higher) | [63] |
| Mycoplasma pneumoniae | Sputum / BALF | 2.8 | qPCR LOD: ~28 (10x higher) | [63] |
| Haemophilus influenzae | Sputum / BALF | 2.0 | qPCR LOD: ~20 (10x higher) | [63] |
| Phytophthora nicotianae | Soil / Plant tissue | Determined statistically | CV < 25% | [65] |
A pivotal application is the prediction of absolute prokaryotic abundance in stool samples, a crucial metric often lost in standard relative-abundance sequencing. A recent study leveraged a machine learning model that used DNA concentration as a key input feature, a parameter strongly correlated with absolute 16S ribosomal RNA copies measured by ddPCR (Spearman's rho = 0.92) [21]. This model, validated on an external cohort, demonstrated that ddPCR-derived absolute abundance data can provide a more comprehensive understanding of the microbial ecosystem than compositional sequencing data alone.
Furthermore, ddPCR's superior tolerance to PCR inhibitors present in complex samples like soil and sputum makes it exceptionally suited for analyzing challenging microbiome matrices. For instance, in detecting plant pathogens in soil, ddPCR showed a significantly higher positive detection rate (96.4%) compared to qPCR (83.9%) [65]. Similarly, a multiplex ddPCR assay for respiratory bacteria demonstrated less inhibition by inhibitors in respiratory specimens than qPCR, leading to higher clinical sensitivity [63].
The Scientist's Toolkit: Essential Research Reagents and Materials
The following table details key reagents and materials essential for establishing and validating ddPCR assays in microbiome research.
Table 3: Essential Research Reagent Solutions for ddPCR Assay Validation
| Reagent / Material | Function / Purpose | Application Example |
|---|---|---|
| Digital PCR Supermix for Probes | Provides optimized buffer, enzymes, and dNTPs for probe-based amplification in a partitioned reaction. | Core component of all ddPCR reaction mixes for absolute quantification of target genes [61] [65]. |
| Target-Specific Primers & Probes (FAM/HEX/VIC/Cy5) | Confers specificity to the assay. Fluorophore-labeled probes enable multiplexing in systems with multiple optical channels. | Detection of multiple respiratory viruses (IFA, IFB, RSV, SARS-CoV-2) in a single reaction [61]. |
| DNA Standard (gBlocks, Plasmids) | Calibrated material of known concentration used to create standard curves for initial assay optimization and determination of LOD/LOQ. | Generating serial dilutions for analytical validation [61] [65]. |
| One-Step RT-ddPCR Kit | Integrates reverse transcription and ddPCR in a single reaction, essential for detecting RNA viruses from microbiome or clinical samples. | Direct detection of RNA viruses like Influenza and SARS-CoV-2 without a separate cDNA step [61]. |
| Automated Droplet Generator | Ensures consistent and high-throughput generation of monodisperse droplets, reducing technical variability and operator error. | Automated systems like the QX ONE support standardized, high-throughput testing [61]. |
| Nuclease-Free Water | Serves as a critical negative control and solvent for reagent preparation, verifying the absence of contaminating nucleic acids. | Used in blank samples for LOD determination and as a no-template control [65]. |
Diagram 2: LOD and LOQ determination workflow in ddPCR.
The rigorous establishment of LOD, LOQ, and specificity is non-negotiable for generating robust and reliable data with ddPCR in microbiome research. The protocols and metrics outlined here provide a framework for validating assays capable of detecting and quantifying low-abundance microbial targets in complex sample matrices. As the field moves towards more standardized and clinically applicable microbiome analyses, adherence to these rigorous validation principles will be paramount. The demonstrated superiority of ddPCR in sensitivity, precision, and inhibitor tolerance over qPCR positions it as an indispensable tool for exploring the vast and critical world of low-biomass and low-abundance microbes, ultimately driving discoveries in human health, disease, and beyond.
Optimizing Thermal Cycling Conditions and Droplet Analysis Thresholds
Droplet Digital PCR (ddPCR) enables the absolute quantification of nucleic acid targets by partitioning samples into thousands of nanoliter-sized droplets, performing end-point amplification, and applying Poisson statistics to count positive and negative partitions [18]. This technique offers exceptional sensitivity and precision for analyzing low-concentration DNA samples, such as those frequently encountered in microbiome research, including 16S rRNA gene quantification from low-biomass environments [15] [67]. However, the accuracy of this quantification is profoundly dependent on two critical technical factors: the optimization of thermal cycling conditions to ensure efficient target amplification and the precise setting of droplet analysis thresholds to correctly distinguish positive from negative droplets [68]. This application note provides detailed, evidence-based protocols to optimize these parameters, framed within a broader research thesis on applying ddPCR to challenging microbiome samples.
The Scientist's Toolkit: Essential Reagents and Materials
Successful implementation of ddPCR, particularly for low-abundance targets, requires carefully selected reagents and equipment. The following table details key solutions and their specific functions in the experimental workflow.
Table 1: Key Research Reagent Solutions for ddPCR in Microbiome Research
| Reagent/Material | Function/Application in ddPCR |
|---|---|
| ddPCR Supermix for Probes (no dUTP) | Provides the core components for PCR, including DNA polymerase, dNTPs, and buffer. The "no dUTP" formulation is often preferred for probe-based assays to prevent carryover contamination [68]. |
| Strain-Specific Primer-Probe Assays | Enable the specific detection and absolute quantification of target bacterial strains. These are often designed against unique genomic markers, such as the rpoB gene, to avoid cross-reactivity with non-target species in a community [6] [12]. |
| Locked Nucleic Acid (LNA) Probes | Incorporate modified nucleotides that increase the melting temperature (Tm) and enhance the specificity of hybridization. This is crucial for discriminating single-nucleotide variants and achieving low false-positive rates in mutation detection [68]. |
| gBlock Gene Fragments | Synthetic double-stranded DNA fragments used as external controls or positive controls. They are sequence-verified and can be spiked into samples to accurately calculate extraction efficiency and correct for sample loss during preparation [68]. |
| Nuclease-Free Water | Serves as the diluent for reaction mixes and template DNA. Its purity is critical to prevent enzymatic degradation of nucleic acids and reagents, which is especially important for low-concentration targets [65]. |
| DNA LoBind Tubes | Specialized microcentrifuge tubes that minimize DNA adsorption to the plastic surface, thereby reducing sample loss. This is essential when working with the low DNA amounts typical of microbiome and circulating tumor DNA studies [68]. |
Optimizing Thermal Cycling Conditions
The thermal cycling protocol is a fundamental determinant of amplification efficiency and assay sensitivity. Inadequate cycling can lead to incomplete amplification of target molecules within droplets, resulting in underestimation of concentration.
Standard Protocol and Critical Parameters
A robust ddPCR protocol for 16S rRNA gene amplification from low-biomass samples has been established and validated. The reaction mixture typically includes 10 µL of 2× ddPCR Supermix for Probes, forward and reverse primers (each at a final concentration of 500 nM), a fluorescent probe (250 nM), and 2 µL of template DNA, brought to a final volume of 20 µL with nuclease-free water [65]. Following droplet generation, the thermal cycling conditions on a Veriti thermal cycler are as follows:
- Initial Denaturation: 95°C for 10 minutes to activate the hot-start polymerase and fully denature the template.
- Amplification (45 cycles):
- Denaturation: 94°C for 30 seconds.
- Annealing/Extension: 58°C for 1 minute. The annealing temperature is a key variable that may require optimization based on primer Tm.
- Enzyme Deactivation: 98°C for 10 minutes to ensure the polymerase is inactivated.
- Hold: 4°C [65].
This protocol has been demonstrated to faithfully amplify 16S rRNA genes even from DNA inputs as low as 0.01-0.05 ng, which are undetectable by standard fluorometric methods, making it suitable for low-biomass microbiome samples [15].
Optimization Strategies and Troubleshooting
- Cycle Number: While 40-45 cycles are standard, increasing the number to 50 or more can enhance the signal from very low-copy-number targets, pushing droplets containing a single target molecule above the fluorescence threshold [68].
- Annealing Temperature Optimization: The optimal annealing temperature is primer-specific. A temperature gradient experiment (e.g., testing from 55°C to 60°C) should be performed. The optimal temperature maximizes the separation between positive and negative droplet clusters while minimizing rain (droplets of intermediate fluorescence).
- Addressing PCR Inhibitors: ddPCR is generally more tolerant to inhibitors present in complex samples like soil or stool than qPCR [65]. However, if inhibition is suspected, diluting the template DNA or using inhibitor-resistant polymerases can improve data quality.
Defining Droplet Analysis Thresholds
Accurate threshold setting is paramount for correct quantification. Improper thresholds can systematically bias counts, leading to either false positives or false negatives.
Systematic Approach to Threshold Setting
A rigorous method for setting thresholds involves running multiple control samples to define the assay's baseline performance [68]:
- Negative Template Controls (NTCs): These reactions, containing water or elution buffer instead of template DNA, are essential for establishing the background fluorescence level and quantifying false-positive droplets. The fluorescence amplitude of the NTC cluster defines the upper limit for the negative population.
- Positive Template Controls (PTCs): These reactions, using gBlocks or genomic DNA with a known mutation, define the fluorescence amplitude of a true positive signal.
- Noise and Signal Separation: The threshold should be set equidistant between the negative and positive clusters to maximize separation. For the QX200 system, the software allows manual setting of this threshold based on the 1D or 2D amplitude plots.
Ensuring Low False Positives in Low-Concentration Samples
When detecting rare targets, the rate of false-positive droplets must be meticulously characterized. A systematic validation approach involves:
- Running Replicate NTCs: Perform at least 16 replicate NTCs to establish a robust baseline and determine the mean and variance of the false-positive rate [68].
- Calculating the Limit of Blank (LoB): The LoB is the highest apparent concentration expected in a blank sample. It is determined statistically from the NTC replicates and defines the detection limit of the assay. One established method is to run 60 measurements on blank samples [65].
- Thresholding and "Rain": Droplets with intermediate fluorescence ("rain") can originate from non-specific amplification, partial amplification, or stochastic effects in low-template droplets. Adjusting probe concentration, annealing temperature, or threshold position can help minimize rain. The acceptability of rain should be balanced against the need for clear cluster separation.
Integrated Experimental Protocol for Microbiome Samples
This section provides a step-by-step protocol for the absolute quantification of 16S rRNA gene copies in a metagenomic DNA sample, incorporating optimization strategies for thermal cycling and threshold analysis.
Title: Absolute Quantification of 16S rRNA Gene Copies in Metagenomic DNA using ddPCR
Key Findings: ddPCR provides absolute quantification of 16S rRNA genes, but the result is strongly influenced by the integrity of the input DNA. A correction based on the DNA Integrity Number (DIN) is necessary for accurate quantification in degraded samples [67].
Experimental Workflow: The following diagram outlines the complete ddPCR workflow for microbiome analysis, from sample preparation to data analysis.
Step-by-Step Procedure:
DNA Extraction and Quality Control:
- Extract total DNA from your microbiome sample (e.g., soil, stool) using a kit-based method suitable for the matrix [12] [67].
- Assess DNA concentration using a fluorometric method (e.g., PicoGreen) for accuracy [67].
- Critical Step: Evaluate DNA integrity using an automated electrophoresis system (e.g., Agilent TapeStation) to obtain a DNA Integrity Number (DIN). A DIN > 7 indicates high-quality, high-molecular-weight DNA. For DIN < 7, a mass correction factor must be applied later to avoid underestimation [67].
ddPCR Reaction Setup:
- Prepare a 20 µL reaction mix on ice [65]:
- 10 µL of 2× ddPCR Supermix for Probes (no dUTP)
- 1 µL of 16S rRNA-targeting forward primer (10 µM final concentration ~500 nM)
- 1 µL of 16S rRNA-targeting reverse primer (10 µM final concentration ~500 nM)
- 0.5 µL of 16S rRNA-targeting probe (10 µM final concentration ~250 nM)
- 2 µL of template DNA (mass should be adjusted if degradation is suspected)
- 5.5 µL Nuclease-free water
- Include mandatory NTCs (using water) and PTCs (using a control DNA) with at least 4 replicates each.
- Prepare a 20 µL reaction mix on ice [65]:
Droplet Generation and Thermal Cycling:
- Generate droplets using the QX200 Droplet Generator according to the manufacturer's instructions.
- Seal the 96-well plate with a pierceable foil heat seal.
- Place the plate in a thermal cycler and run the following protocol [15] [65]:
- 95°C for 10 min (initial denaturation)
- 45 cycles of:
- 94°C for 30 sec (denaturation)
- 58°C for 1 min (annealing/extension)
- 98°C for 10 min (enzyme deactivation)
- 4°C hold (forever)
- Note: After cycling, the plate should be incubated at 12°C for a minimum of 4 hours before reading to stabilize the droplets [68].
Droplet Reading and Data Analysis:
- Read the plate on the QX200 Droplet Reader.
- In the analysis software, manually set the threshold for positive/negative droplet discrimination based on the NTC and PTC wells.
- The software will provide a concentration in copies/µL.
- Application of Correction Factor: If the DNA was degraded (DIN < 7), use the following formula to obtain the corrected concentration, where
fis an experimentally determined correction factor based on the DIN value [67]:- Corrected copies/µL = (Measured copies/µL) / f
Data Presentation and Analysis
The quantitative performance of an optimized ddPCR assay can be summarized for easy comparison. The following table displays typical performance metrics for ddPCR in microbiological applications, derived from the cited literature.
Table 2: Quantitative Performance Metrics of ddPCR in Microbiological Applications
| Application / Target | Reported Sensitivity / LoD | Linear Range | Key Performance Findings |
|---|---|---|---|
| 16S rRNA Gene Quantification [67] | N/A (Absolute quantification) | Wide dynamic range | Quantification is highly dependent on DNA integrity (DIN). Requires correction for degraded DNA. |
| Pathogen Detection (P. nicotianae) [65] | Determined with 95% confidence via probit regression | Quantifiable with CV < 25% | ddPCR showed a higher positive detection rate (96.4%) than qPCR (83.9%) in field samples. |
| Bacterial Strain Quantification (L. reuteri) [12] | ~10³ cells/gram feces | R² > 0.98 | qPCR performed comparably to ddPCR for this application, with a wider dynamic range and lower cost. |
| Viral Respiratory Detection [69] | 0.65–0.78 copies/μL | Wide linear range for each target | A quadruplex assay demonstrated high sensitivity and specificity, outperforming RT-PCR for weakly positive samples. |
Identifying and Resolving False Positives and Molecular Dropout
Droplet Digital PCR (ddPCR) is a powerful tool for the absolute quantification of nucleic acids, offering high sensitivity and precision without the need for standard curves [70] [71]. This makes it particularly valuable for microbiome research, which often involves analyzing low-concentration DNA samples from complex environmental or host-associated communities [72]. However, the accuracy of ddPCR can be compromised by two significant technical challenges: false-positive signals and molecular dropout. False positives occur when partitions generate a fluorescent signal without the actual target sequence being present, leading to overestimation of target concentration [73]. Molecular dropout (also referred to as "missing" or "non-detected" targets) happens when present target molecules fail to amplify, resulting in underestimation [71]. These issues become particularly problematic when working with low-biomass samples common in microbiome studies, such as those from the lower respiratory tract, preterm infant microbiomes, or stool samples from antibiotic-treated patients [72]. This application note provides a detailed framework for identifying, troubleshooting, and resolving these challenges to ensure data integrity in sensitive ddPCR applications.
Origins and Impact of False Positives
False-positive droplets in ddPCR manifest as fluorescent partitions in no-template controls (NTCs) or at frequency levels inconsistent with expected target concentrations. Several factors contribute to this phenomenon:
- Nonspecific Amplification: Formation of non-specific products or primer-dimers can generate fluorescent signals, especially when using DNA-binding dyes like EvaGreen [74]. This is particularly problematic in assays with suboptimal annealing specificity.
- Probe Degradation: Self-hydrolysis of hydrolysis probes (e.g., TaqMan probes) can occur, separating fluorophores from quenchers before amplification and creating background fluorescence [73]. This issue may be batch-dependent with certain probe syntheses.
- Contamination: Cross-contamination from materials, reagents, or the environment introduces template DNA into partitions that should not contain target sequences [73].
- Fluorescence Background: Certain quencher and fluorophore combinations with overlapping emission spectra can create background noise that impedes clear cluster separation [74].
Empirical evidence from HIV quantification studies demonstrates that false positives occur stochastically, with reported rates ranging from 0.1 to 0.4 events per well, significantly impacting detection limits at ultra-low target concentrations [73].
Mechanisms and Consequences of Molecular Dropout
Molecular dropout represents the failure to detect truly present target molecules, resulting in underestimation of concentration:
- Inhibitors: Although ddPCR is more tolerant to inhibitors than qPCR, residual sample contaminants such as humic acids, urea, phenol, or acidic polysaccharides can still prevent amplification in affected partitions [74].
- Template Integrity: Strongly degraded DNA, particularly from formalin-fixed, paraffin-embedded (FFPE) samples or cell-free DNA, may contain lesions, crosslinks, or abasic sites that prevent primer binding or polymerase extension [74].
- Partitioning Artifacts: Uneven distribution of complex templates, such as high-molecular-weight DNA or linked gene copies, can lead to inaccurate quantification [74].
- Amplification Efficiency: Suboptimal PCR conditions, including inadequate primer design or thermal cycling parameters, can reduce amplification efficiency for certain partitions [74].
Table 1: Comparative Characteristics of ddPCR Artifacts
| Characteristic | False Positives | Molecular Dropout |
|---|---|---|
| Effect on Quantification | Overestimation | Underestimation |
| Primary Causes | Probe degradation, contamination, nonspecific amplification | Inhibitors, template damage, suboptimal amplification |
| Detection Method | No-template controls (NTCs) | Reference standard comparison, dilution series |
| Typical Frequency | 0.1-0.4 events/well [73] | Variable (assay-dependent) |
| Impact on LOD | Increases apparent detection limit | Decreases effective sensitivity |
Diagnostic Approaches and Experimental Design
Systematic Quality Control Measures
Implementing rigorous quality control procedures is essential for identifying and quantifying both false positives and molecular dropout:
Comprehensive Control Reactions:
- No-Template Controls (NTCs): Essential for detecting false positives arising from reagent contamination or probe degradation [74]. Include multiple NTCs to account for stochastic occurrence [73].
- Positive Controls: Verify that amplification occurs under optimal conditions and detect potential molecular dropout [74].
- Reference Standards: Use samples with known copy numbers to assess accuracy and identify systematic under- or over-estimation [10].
Dilution Series Experiments:
- Perform serial dilutions of target DNA to assess linearity of response. Deviation from linearity at low concentrations may indicate molecular dropout or false-positive interference [72].
- The optimal dynamic range for ddPCR is 0.5-3 copies/partition, with reduced precision at extreme concentrations [74].
Limit of Detection (LOD) and Limit of Quantification (LOQ) Determination:
Data Analysis and Interpretation
Advanced data analysis techniques help distinguish true signals from artifacts:
- Threshold Optimization: Adjust fluorescence thresholds carefully based on NTC profiles rather than relying solely on automated settings [74].
- Cluster Identification: Examine 2D scatter plots for unusual cluster patterns that may indicate nonspecific amplification or probe issues [74].
- Poisson Confidence Intervals: Assess whether measured concentrations fall within expected statistical variance. Wide confidence intervals may indicate partitioning problems or stochastic effects [70].
- Restriction Enzyme Impact: Evaluate precision differences between enzyme treatments, as some enzymes (e.g., HaeIII) may provide better precision than others (e.g., EcoRI) depending on the platform [75].
Diagram 1: Diagnostic workflow for identifying false positives and molecular dropout in ddPCR experiments. This systematic approach helps pinpoint the specific issue affecting data quality.
Experimental Protocols for Problem Resolution
Protocol 1: False-Positive Reduction and Validation
This protocol systematically addresses false-positive signals in ddPCR assays:
Assay Re-design and Optimization:
- Primer/Probe Re-design: For assays showing consistent false positives, re-design primers and probes following optimal parameters:
- Amplicon length: 60-120 bp for degraded samples [74]
- Primer Tm: 55-65°C with <2°C difference between forward and reverse
- Avoid self-complementarity and secondary structures
- Use BLAST analysis to ensure target specificity
- Probe Selection:
- Primer/Probe Re-design: For assays showing consistent false positives, re-design primers and probes following optimal parameters:
Reaction Condition Optimization:
- Prepare master mix in a UV-treated workstation to prevent contamination [74]
- Test different annealing temperatures (55-68°C range) to maximize specificity
- Optimize primer concentration (0.5-0.9 µM final) and probe concentration (0.25 µM final) [74]
- Include uracil-N-glycosylase (UNG) treatment to prevent carryover contamination
Validation Experiments:
Data Analysis and Threshold Setting:
- Set fluorescence thresholds based on NTC profiles rather than test samples
- Apply Poisson correction to account for remaining false positives: λ_corrected = -ln(1 - (k-FP)/n) where FP is mean false positives from NTCs [70]
- Establish limit of detection (LOD) based on false-positive rate: LOD = (meanFP + 3×SDFP) / partition volume
Protocol 2: Molecular Dropout Mitigation
This protocol addresses factors causing molecular dropout in low-concentration samples:
Template Quality Assessment and Improvement:
- Quality Control: Assess DNA integrity using fragment analyzers or agarose gel electrophoresis
- Inhibitor Removal:
- Use column-based purification kits designed for inhibitor removal
- Implement dilute-and-shoot approach (1:10 dilution) to reduce inhibitor concentration [74]
- For difficult samples, consider silica membrane-based purification or alternative extraction methods
- Restriction Digestion:
- For high-molecular-weight DNA (>30 kb), perform restriction digestion to ensure even partitioning [74]
- For linked gene copies, use restriction enzymes that physically separate copies
- For supercoiled plasmids, linearize with single-cut restriction enzymes
PCR Enhancement Strategies:
- Reaction Optimization:
- Increase cycle number to 45-50 for low-copy targets
- Incorporate PCR enhancers such as betaine (1M final) or DMSO (2-5%) for difficult templates
- Use high-fidelity polymerases with improved processivity for complex templates
- Partitioning Optimization:
- Ensure proper droplet generation with uniform size distribution [25]
- Verify partition integrity throughout thermal cycling to prevent coalescence
- For microplate-based systems, check filling efficiency of nanowell chambers
- Reaction Optimization:
Validation Using Reference Materials:
Table 2: Troubleshooting Guide for Common ddPCR Issues
| Problem | Possible Causes | Solution Approaches | Expected Outcome |
|---|---|---|---|
| High False Positives in NTCs | Probe degradation, contamination, nonspecific amplification | Re-design probes, decontaminate workspace, optimize annealing temperature | Reduction to <0.5 copies/μL in NTCs |
| Low Signal Amplitude | Suboptimal primer/probe concentration, inhibitor presence | Increase primer (0.5-0.9μM) and probe (0.25μM) concentrations, purify template | Improved cluster separation |
| High CV Between Replicates | Uneven partitioning, pipetting errors, inhibitor hotspots | Restriction digest high-MW DNA, improve mixing, use replicates | CV <10% for samples above LOQ |
| Non-Linear Dilution Series | Molecular dropout at low concentrations, carrier effect | Use restriction digestion, optimize template input amount | R² >0.98 in dilution series |
| Reduced Precision at High Copy Number | Saturation effect, partition volume variance | Dilute sample to optimal range (0.5-3 copies/partition) | Improved precision at λ=1.6 [70] |
Research Reagent Solutions
Table 3: Essential Reagents for Optimized ddPCR in Microbiome Research
| Reagent Category | Specific Examples | Function | Optimization Tips |
|---|---|---|---|
| Nucleic Acid Purification Kits | Column-based kits, inhibitor removal kits | Obtain high-purity template free of PCR inhibitors | Select kits validated for your sample type (soil, stool, FFPE) |
| Restriction Enzymes | HaeIII, EcoRI, other frequent cutters | Fragment large DNA for even partitioning; separate linked copies | Choose enzymes that don't cut within amplicon; HaeIII may offer better precision than EcoRI [75] |
| PCR Master Mixes | ddPCR supermixes, inhibitor-resistant formulations | Provide optimized buffer conditions for partitioning | Select master mix compatible with your detection chemistry |
| Hydrolysis Probes | TaqMan probes, dual-labeled probes | Sequence-specific detection with minimal background | Store in TE buffer, pH 7.0 for Cy5/Cy5.5; avoid >6 freeze-thaw cycles |
| DNA Binding Dyes | EvaGreen, SYBR Green | Intercalating dyes for target-agnostic detection | Use only with highly specific primers to avoid nonspecific signal |
| Partitioning Reagents | Droplet generation oil, surfactants | Create stable water-in-oil emulsion | Ensure proper storage; verify droplet uniformity |
Application in Microbiome Research Context
The optimization approaches described above are particularly crucial in microbiome research, where sample limitations and complex backgrounds are common:
- Low-Biomass Samples: For samples with very low bacterial biomass (e.g., respiratory tract, milk, or antibiotic-treated stool samples), the improved protocol incorporating ddPCR enables faithful amplification of very low DNA amounts, making different sample types comparable despite varying bacterial loads [72].
- 16S rRNA Gene Sequencing: Combining ddPCR with 16S rRNA gene sequencing allows for reliable analysis even with DNA concentrations below detection limits of fluorometric methods [72].
- Inhibitor-Rich Samples: Environmental samples often contain PCR inhibitors that affect quantification. ddPCR's greater tolerance to inhibitors compared to qPCR makes it particularly suitable for such applications [72] [75].
- Absolute Quantification: Unlike relative measures in qPCR, ddPCR provides absolute quantification of target sequences, enabling direct comparison between different microbiome samples without reference genes [71].
Recent studies have successfully applied these optimized ddPCR protocols to quantify gene copy numbers in various protists, demonstrating high precision across different platforms when proper optimization procedures are followed [75]. The accuracy of copy number enumeration by ddPCR has been validated against gold standard methods like pulsed field gel electrophoresis, showing 95% concordance compared to only 60% for qPCR [10].
False positives and molecular dropout represent significant challenges in ddPCR applications for low-concentration DNA samples in microbiome research. Through systematic assay optimization, rigorous quality control measures, and appropriate data analysis methods, these issues can be effectively identified and mitigated. The protocols presented here provide a comprehensive framework for improving ddPCR reliability, enabling researchers to obtain accurate absolute quantification even from challenging low-biomass microbiome samples. As ddPCR technology continues to evolve, with recent advances including automated image analysis and artificial intelligence-assisted interpretation [76], the fundamental principles of careful assay design and validation remain essential for generating robust, reproducible scientific data.
Best Practices for Data Normalization and Absolute Quantification Reporting
The analysis of low-biomass samples presents a significant challenge in microbiome research, where insufficient DNA often limits or prohibits reliable analysis using standard protocols [15]. Digital Droplet PCR (ddPCR) has emerged as a powerful third-generation PCR technology that enables absolute quantification of target nucleic acids without requiring standard curves, providing superior sensitivity for low-concentration DNA samples [77] [18]. This technology partitions PCR reactions into thousands of nanodroplets, allowing precise absolute quantification based on Poisson statistics of the endpoint fluorescence measurements [51]. For microbiome research, this capability is particularly valuable when working with samples containing low bacterial biomass, such as those from the lower respiratory tract, stool samples from antibiotic-treated patients, or other challenging sample types where DNA concentrations may be below detection limits of conventional quantification methods [15] [16]. The application of ddPCR to 16S rRNA gene sequencing has demonstrated successful amplification even when using very low concentrated DNA unable to be detected by standard fluorometric methods like Qubit [15] [16].
The critical importance of absolute quantification in microbiome studies has become increasingly evident, as relative abundance data alone can lead to misinterpretations of microbial community dynamics [54]. Absolute quantification provides crucial context for understanding whether changes in relative abundance represent actual increases in specific taxa or merely relative shifts due to decreases in other community members [54]. This protocol details comprehensive methodologies for implementing ddPCR in microbiome research, with particular emphasis on best practices for data normalization and absolute quantification reporting to ensure reproducible, publication-quality results that accurately reflect the true composition of low-biomass microbial communities.
Theoretical Foundation and Principle of ddPCR
Digital PCR represents a fundamental advancement in nucleic acid quantification technology, following conventional PCR and quantitative real-time PCR (qPCR) in the evolution of amplification-based detection methods [77] [18]. The core principle of ddPCR involves partitioning a PCR reaction mixture into thousands to millions of nanoliter-sized droplets, effectively creating individual microreaction chambers where amplification occurs independently [51] [18]. This partitioning process randomly distributes target nucleic acid molecules across the droplets according to Poisson statistics, resulting in each droplet containing zero, one, or a few target molecules [77]. Following endpoint PCR amplification, each droplet is analyzed for fluorescence, and the fraction of positive droplets is used to calculate the absolute concentration of the target sequence based on Poisson distribution algorithms [77] [18].
This partitioning-based approach provides two significant advantages for low-concentration targets: enhanced sensitivity due to the concentration of target molecules within individual droplets, and reduced effects of PCR inhibitors through substantial dilution across the partitions [51] [36]. The absolute quantification capability of ddPCR eliminates the requirement for standard curves, making it inherently more reproducible than qPCR approaches that rely on external calibration [36] [54]. For microbiome applications, this translates to more reliable quantification of 16S rRNA genes and other microbial markers, particularly in samples with low bacterial load where precise quantification is most challenging yet critically important [15] [54].
Advantages for Low-Biomass Microbiome Samples
The application of ddPCR to low-biomass microbiome samples addresses several limitations inherent to standard qPCR approaches. Studies have demonstrated that ddPCR shows lower intra-assay variability (median CV%: 4.5%) compared to qPCR, with superior sensitivity for detecting low bacterial loads [3]. This enhanced precision is particularly valuable when analyzing samples with low target concentrations (Cq ≥ 29), where ddPCR technology produces more precise, reproducible, and statistically significant results required for publication-quality data [51].
For low-biomass samples, the reduced sensitivity to inhibitors represents another critical advantage. The partitioning process in ddPCR effectively dilutes PCR inhibitors that may be present in complex sample matrices, making it particularly suitable for analyzing challenging sample types such as stool, soil, or clinical specimens that often contain substances that interfere with PCR amplification [65] [36]. This characteristic enables more reliable quantification without the need for extensive sample purification that might further reduce already low DNA yields [15]. Additionally, ddPCR has demonstrated superior performance in direct comparative studies, showing higher positive detection rates (96.4% vs. 83.9%) compared to qPCR when analyzing pathogens in complex environmental samples [65].
Table 1: Comparison of qPCR and ddPCR Characteristics for Microbiome Applications
| Parameter | qPCR | ddPCR |
|---|---|---|
| Quantification Method | Relative (requires standard curve) | Absolute (Poisson statistics) |
| Sensitivity for Low Abundance Targets | Moderate | High [3] [51] |
| Effect of PCR Inhibitors | High sensitivity | Reduced sensitivity due to partitioning [65] [36] |
| Precision (CV%) | Variable, typically higher | Lower intra-assay variability (median CV%: 4.5%) [3] |
| Data Normalization Requirements | Extensive (reference genes, standard curves) | Minimal (internal Poisson calculation) |
| Dynamic Range | Limited by standard curve quality | 5 orders of magnitude [54] |
| Sample Throughput | High | Moderate to high |
| Implementation in Low-Biomass Studies | Limited by detection sensitivity | Ideal for low-concentration DNA [15] [16] |
Experimental Design and Workflow
Sample Preparation and DNA Extraction
Proper sample collection and DNA extraction are critical foundational steps for obtaining reliable absolute quantification data in microbiome studies. For stool samples, which are commonly used in human microbiome research, consistent collection and preservation methods are essential to maintain DNA integrity and prevent changes in microbial composition [54]. The protocol should include measurement of stool sample moisture content to enable normalization per wet or dry gram of stool, which is particularly important for comparing samples with different water content [54]. For low-biomass samples, the use of negative controls during DNA extraction is imperative to detect and account for potential contamination that could significantly impact taxonomical profiles when working with limited template [15] [16].
DNA extraction methods should be selected based on their efficiency for specific sample types, as different protocols vary in their ability to lyse various bacterial cell walls [15]. For comprehensive microbiome analysis, methods that effectively lyse both Gram-positive and Gram-negative bacteria are recommended to avoid bias toward easy-to-lyse microorganisms [15]. The extracted DNA should be quantified using fluorometric methods, though researchers should be aware that for very low-biomass samples, DNA concentrations may be below detection limits of standard quantification methods yet still amplifiable via ddPCR [15] [16].
ddPCR Workflow for 16S rRNA Gene Quantification
The ddPCR workflow for absolute quantification of prokaryotes in microbiome samples involves several standardized steps that must be carefully optimized and consistently applied to ensure reproducible results. The following diagram illustrates the complete workflow from sample preparation through data analysis:
Diagram 1: Complete ddPCR Workflow for Microbiome Absolute Quantification
The reaction mixture for 16S rRNA gene quantification typically includes 10 μL of 2× ddPCR Supermix, 1 μL of each primer (final concentration 500 nM), 0.5 μL of probe (final concentration 250 nM), 2 μL of template DNA, and nuclease-free water to achieve a final volume of 20 μL [65]. Universal 16S rRNA gene primers targeting conserved regions should be selected, with careful consideration of the variable regions being amplified as different primer pairs can significantly influence resulting taxonomical profiles [15]. For absolute quantification of total prokaryotic load, the reaction conditions include an initial denaturation at 95°C for 10 minutes, followed by 45 cycles of denaturation at 94°C for 30 seconds and annealing/extension at the primer-specific temperature (typically 55-60°C) for 1 minute, with a final enzyme deactivation step at 98°C for 10 minutes [65] [54].
Following amplification, droplets are read using a droplet reader that detects fluorescence in each individual droplet, classifying them as positive or negative based on fluorescence thresholds [51] [54]. The absolute concentration of target genes in the original sample is then calculated using Poisson statistics based on the ratio of positive to negative droplets, providing a direct measurement of 16S rRNA gene copies per volume of reaction mixture [54]. This raw concentration is subsequently normalized to the original sample mass or volume (e.g., copies per gram of stool) using the moisture content measurements and dilution factors incorporated during sample processing [54].
Data Normalization Strategies
Absolute Quantification and Normalization to Sample Input
Proper data normalization is essential for generating meaningful, comparable absolute quantification data in microbiome studies. The fundamental normalization approach involves converting the raw ddPCR concentration (copies/μL of reaction mixture) to absolute abundance in the original sample using the formula:
Absolute Abundance (copies/g) = (C × Vd × D) / (Ws × V_t)
Where:
- C = Concentration from ddPCR (copies/μL)
- V_d = Total DNA elution volume (μL)
- D = Dilution factor of DNA template
- W_s = Sample input weight (g)
- V_t = Volume of DNA template in ddPCR reaction (μL)
This calculation provides the absolute abundance of the target gene (e.g., 16S rRNA genes) per unit of original sample, typically reported as copies per gram of wet or dry stool [54]. Normalization to dry weight is particularly recommended for stool samples as it eliminates variability introduced by differences in water content, providing a more consistent basis for comparison across samples [54].
For low-biomass samples where DNA concentrations may be near detection limits, additional normalization strategies may be required. In such cases, implementing a minimum threshold for detected copies per reaction (e.g., requiring at least 3 positive partitions for a positive call) helps ensure data reliability [3]. When target concentrations fall below this threshold, results should be reported as below the limit of detection (BLOD) rather than as numerical values to avoid reporting potentially unreliable quantification [36].
Integration with Sequencing Data
A powerful application of ddPCR absolute quantification is its integration with relative abundance data from 16S rRNA gene amplicon sequencing or metagenomic sequencing. By combining these approaches, researchers can calculate taxon-specific absolute abundances using the formula:
Taxon Absolute Abundance = Total 16S rRNA copies/g × Relative Abundance of Taxon
This integration corrects the misinterpretations that can arise from relative abundance data alone, where an apparent increase in one taxon's relative abundance might actually result from decreases in other community members rather than a true increase in the taxon of interest [54]. The combined approach provides a comprehensive understanding of microbial community dynamics, revealing changes that would be obscured in relative abundance data alone [54].
When reporting integrated absolute quantification data, it is essential to clearly state all normalization parameters, including the specific variable region targeted by 16S rRNA primers, DNA extraction method, sample dilution factors, and the reference database used for taxonomic assignment [15]. This transparency enables proper interpretation and comparison across studies, which is particularly important given the significant effects these parameters can have on the final quantitative results [15] [16].
Table 2: Data Normalization Parameters and Reporting Standards
| Normalization Parameter | Measurement Method | Reporting Standard | Impact on Data Interpretation |
|---|---|---|---|
| Sample Moisture Content | Gravimetric measurement before/after drying | Report as % moisture or normalize to dry weight | Eliminates variability from water content differences [54] |
| DNA Extraction Efficiency | Spike-in controls or reference standards | State extraction kit/method and any modifications | Affects absolute values but not necessarily relative patterns |
| 16S rRNA Gene Copy Number | Reference database consultation (rrnDB) | Report copy number correction if applied | Enables conversion from gene copies to bacterial cells [54] |
| PCR Inhibition Assessment | Internal controls or dilution series | Report inhibition tests and any corrections made | Affects quantification accuracy, particularly in complex matrices [65] |
| Limit of Detection (LoD) | Probit analysis of dilution series | State LoD in copies/reaction and copies/sample | Determines reliable detection threshold for low-abundance targets [65] |
| Limit of Quantification (LoQ) | CV < 25% across replicates | State LoQ in copies/reaction and copies/sample | Determines reliable quantification threshold [65] |
Quality Control and Troubleshooting
Implementing Robust Quality Control Measures
Comprehensive quality control is essential for generating reliable absolute quantification data, particularly when working with low-concentration DNA samples where variability has greater impact. The digital MIQE (Minimum Information for Publication of Quantitative Digital PCR Experiments) guidelines provide a framework for reporting critical experimental parameters that should be followed to ensure reproducibility and data quality [51]. Key quality control measures include:
Negative Controls: Multiple negative controls must be incorporated throughout the workflow, including no-template controls during DNA extraction and ddPCR setup to detect contamination [15] [16]. For low-biomass samples, contamination can significantly impact results, making rigorous negative controls especially critical [15].
Inhibition Assessment: PCR inhibition should be evaluated through dilution series or internal controls [65]. While ddPCR is less susceptible to inhibition than qPCR due to the partitioning effect, inhibition can still manifest as reduced numbers of positive droplets or shifts in fluorescence amplitude [51] [65]. If inhibition is detected, sample dilution or additional purification steps should be implemented.
Droplet Quality Assessment: Each ddPCR run should include evaluation of droplet quality, with acceptable thresholds for total droplet count and the proportion of rejected droplets [51]. Most commercial systems provide quality metrics, with typically >10,000 droplets per reaction considered acceptable for reliable quantification [54].
Reference Materials: When available, certified reference materials or standardized DNA controls should be included to validate assay performance and enable cross-laboratory comparability [54]. For microbiome studies, characterized mock communities with known compositions are particularly valuable for validating overall workflow accuracy.
Troubleshooting Common Issues
Several common challenges may arise when implementing ddPCR for low-biomass microbiome samples, each requiring specific troubleshooting approaches:
Low DNA Template: When working with very low DNA concentrations (<0.1 ng/μL), the standard protocol may need modification. Studies have successfully implemented an "emergency plan" involving re-amplification of isolated ddPCR amplicons in a standard PCR using universal primers P5 and P7 to rescue samples that would otherwise fail sequencing [15]. However, this additional amplification step should be used judiciously as it may introduce bias.
High Background in Negative Controls: Contamination detection in negative controls necessitates identifying and eliminating contamination sources. This may require dedicated workspace, UV treatment of work surfaces and equipment, and use of filtered pipette tips [15]. All reagents should be aliquoted to minimize repeated freeze-thaw cycles and potential contamination.
Poor Separation Between Positive and Negative Droplets: Inadequate discrimination between positive and negative droplet populations can result from suboptimal primer/probe design, insufficient PCR efficiency, or inappropriate fluorescence threshold settings [51]. This issue should be addressed through primer/probe re-design, optimization of annealing temperature, and validation of assay efficiency using control templates.
High Technical Variability: Excessive coefficient of variation (>25%) between technical replicates indicates issues with reaction consistency or partitioning efficiency [65]. This can be addressed by ensuring thorough mixing of reaction components, verifying pipette calibration, and maintaining consistent droplet generation conditions.
Research Reagent Solutions
Table 3: Essential Reagents and Materials for ddPCR Microbiome Quantification
| Reagent/Material | Function | Example Products | Key Considerations |
|---|---|---|---|
| DNA Extraction Kits | Isolation of microbial DNA from complex samples | DNeasy PowerSoil Kit, QIAamp DNA Mini Kit | Select based on sample type and lysis efficiency for diverse taxa [65] [54] |
| ddPCR Supermix | PCR reaction mixture optimized for droplet generation | ddPCR Supermix for Probes (Bio-Rad), QIAcuity Probe PCR Kit | Formulated for droplet stability and compatible with probe chemistry [65] [36] |
| 16S rRNA Primers/Probes | Target-specific amplification | Universal 16S rRNA primers (V1-V2, V3-V4, V7-V9 regions) | Primer choice significantly affects taxonomic profiles [15] |
| Droplet Generation Oil | Immiscible oil phase for droplet formation | Droplet Generation Oil for Probes (Bio-Rad) | Ensures stable droplet formation during thermal cycling |
| Restriction Enzymes | Digestion of complex DNA to improve accessibility | Anza restriction enzymes | May enhance detection efficiency in complex samples [3] |
| Quantitative Standards | Absolute quantification reference | Synthetic DNA standards, mock microbial communities | Enables method validation and cross-study comparisons [54] |
| Nuclease-free Water | Reaction preparation and dilutions | Molecular biology grade water | Must be certified nuclease-free to prevent degradation |
| Microplates and Seals | Reaction containment during amplification | ddPCR-specific plates and seals | Ensure compatibility with droplet generation and reading systems |
The implementation of ddPCR for absolute quantification in microbiome research, particularly for low-biomass samples, represents a significant advancement in our ability to generate accurate, reproducible microbial abundance data. The partitioning technology underlying ddPCR provides enhanced sensitivity, reduced susceptibility to inhibition, and absolute quantification without requirement for standard curves, addressing several limitations of traditional qPCR approaches [15] [51]. When combined with proper data normalization practices that account for sample input and integrate with relative abundance data from sequencing approaches, ddPCR enables researchers to overcome the misinterpretations that can arise from relative abundance data alone [54].
As microbiome research continues to evolve toward more quantitative applications, including clinical diagnostics, therapeutic monitoring, and environmental assessment, the rigorous absolute quantification methods detailed in this protocol will become increasingly essential [3] [36]. By adhering to the best practices for experimental design, quality control, and data reporting outlined here, researchers can ensure that their absolute quantification data meets the highest standards of reliability and reproducibility, ultimately advancing our understanding of microbial communities in health, disease, and environmental contexts.
Proof of Performance: Benchmarking ddPCR Against qPCR and NGS
Droplet Digital PCR (ddPCR) has emerged as a powerful technology for the absolute quantification of nucleic acids, offering significant advantages for detecting low-concentration targets in complex samples like those encountered in microbiome research. This application note provides a detailed comparison between ddPCR and quantitative real-time PCR (qPCR), focusing on sensitivity and limit of detection (LOD) for analyzing low-abundance DNA targets. Within microbiome studies, accurately quantifying bacterial strains at low concentrations is essential for investigating probiotic colonization, dysbiosis in disease states, and the impacts of therapeutic interventions [78] [79]. While qPCR has been the gold standard for microbial quantification, its susceptibility to PCR inhibitors and dependence on external standard curves can limit its accuracy for low-biomass targets [51] [79]. ddPCR addresses these challenges through sample partitioning and absolute quantification without standard curves, making it particularly suitable for the demanding requirements of modern microbiome research and drug development [80] [81].
Comparative Performance Data: ddPCR vs. qPCR
Extensive research across various applications demonstrates that ddPCR consistently provides enhanced sensitivity and a lower limit of detection compared to qPCR, particularly when quantifying low-abundance targets.
Table 1: Comparative LOD and Sensitivity of ddPCR and qPCR Across Applications
| Application Area | Target | qPCR LOD | ddPCR LOD | Sensitivity Advantage | Citation |
|---|---|---|---|---|---|
| Probiotic Detection | Lactiplantibacillus plantarum | 103 CFU/mL | 102 CFU/mL | 10-fold | [81] |
| Viral Detection | Carassius auratus herpesvirus (CaHV) | 50.12 copies/µL | 0.52 copies/µL | ~100-fold | [82] |
| Starter Culture Detection | Lacticaseibacillus casei in milk | Higher than ddPCR | 100 CFU/mL | Significantly better | [83] |
| SARS-CoV-2 Detection | Viral RNA in patient samples | Less sensitive | More sensitive | Higher true positive rate | [84] |
| Porcine DNA Detection | Porcine ATCB gene plasmid | Comparable at high copy numbers | More reliable at <5 copies | Better for very low copies | [85] |
Quantitative Analysis of Sensitivity
The superior sensitivity of ddPCR is quantitively demonstrated in direct comparisons. In the detection of Lactiplantibacillus plantarum, ddPCR showed a 10-fold lower LOD than qPCR (100 CFU/mL vs. 1,000 CFU/mL) [81]. An even more dramatic difference was observed in viral detection, where the LOD for Carassius auratus herpesvirus was 0.52 copies/µL for ddPCR compared to 50.12 copies/µL for qPCR, representing an approximately 100-fold increase in sensitivity [82]. This enhanced sensitivity is crucial in microbiome research for detecting low-abundance taxa or strains that may be present in low quantities but have significant functional impacts.
Furthermore, a 2024 systematic comparison for quantifying Limosilactobacillus reuteri in human fecal samples confirmed that ddPCR exhibited slightly better reproducibility, though both methods showed comparable sensitivity with a LOD around 104 cells/g feces when kit-based DNA isolation methods were used [79]. This suggests that for some routine microbiome applications, both methods can be effective, but ddPCR maintains an advantage in reproducibility.
Dynamic Range and Precision
While ddPCR excels at low target concentrations, studies have noted its limitations in the absolute quantitation of high bacterial concentrations (>106 CFU/mL) [81]. In contrast, qPCR generally has a wider dynamic range [79]. However, in terms of precision, ddPCR demonstrates superior performance, particularly for low-abundance targets. A 2025 study comparing digital PCR platforms found that ddPCR achieved high precision across most analyses, with coefficient of variation (CV) values below 5% under optimized conditions [75].
The precision of ddPCR is attributed to its partitioning technology, which reduces the effects of PCR inhibitors and reaction efficiency variations that often plague qPCR assays [51]. This partitioning effect also allows for more precise quantification without the need for standard curves, eliminating a significant source of variability in qPCR experiments [80].
Experimental Protocols for Microbiome Applications
Protocol 1: Absolute Quantification of Bacterial Strains in Fecal Samples
This protocol, adapted from a 2024 systematic comparison, details the steps for absolute quantification of specific bacterial strains using ddPCR and qPCR [79].
Table 2: Key Research Reagent Solutions for Bacterial Quantification
| Reagent/Equipment | Function/Role in Experiment |
|---|---|
| Strain-specific primers | Designed from unique genomic regions to target specific bacterial strains. |
| DNA extraction kits (e.g., QIAamp Fast DNA Stool Mini Kit) | Isolate high-purity DNA from complex fecal samples while removing inhibitors. |
| ddPCR system (e.g., Bio-Rad QX200) | Partitions samples into droplets for absolute digital quantification. |
| qPCR system | Performs real-time amplification with fluorescence monitoring for relative quantification. |
| One-step RT-ddPCR/ddPCR master mix | Contains enzymes and reagents optimized for digital PCR reactions. |
| Droplet generation oil | Creates nanoliter-sized water-in-oil droplets for partitioning in ddPCR. |
| Probe-based detection chemistry | Provides specific target detection with fluorescent probes (e.g., FAM, HEX). |
Step-by-Step Procedure:
DNA Extraction:
- Use approximately 200 mg of fecal sample stored at -80°C.
- Extract DNA using a validated kit-based method such as the QIAamp Fast DNA Stool Mini Kit or the MagMax Total Nucleic Acid Isolation kit.
- Include a bead-beating step (e.g., using Precellys homogenizer) for thorough cell lysis.
- Quantify DNA concentration using a fluorometer (e.g., Qubit) [78] [79].
Assay Design and Validation:
ddPCR Setup and Run:
- Prepare a 20-22µL reaction mixture containing ddPCR supermix, primers/probes, and DNA template.
- Generate droplets using a droplet generator (approximately 20,000 droplets per sample).
- Transfer droplets to a 96-well plate and seal.
- Run PCR with optimized thermal cycling conditions (e.g., 95°C for 5-10 min, 40 cycles of 94°C for 30 sec and 55-60°C for 60 sec, followed by signal stabilization at 4°C and 90°C) [78] [81] [84].
- Read plates on a droplet reader and analyze using manufacturer's software (e.g., QuantaSoft).
qPCR Setup and Run:
- Prepare reaction mixtures with qPCR mastermix (e.g., TaqMan Fast Advanced), primers/probes, and DNA template.
- Use the same primer/probe concentrations and DNA templates as ddPCR for direct comparison.
- Run on a real-time PCR system with appropriate cycling parameters (e.g., 50°C for 2 min, 95°C for 2-10 min, 40 cycles of 95°C for 15 sec and 60°C for 60 sec) [78] [79].
- Include a standard curve of known concentrations for absolute quantification.
Data Analysis:
Diagram 1: Experimental workflow for ddPCR and qPCR comparison
Protocol 2: Detection of Probiotic Strains in Food Matrices
This protocol summarizes methods adapted from studies detecting probiotic strains in fermented foods and supplements [81] [83].
Step-by-Step Procedure:
Sample Preparation:
- Homogenize food samples (e.g., fermented milk, kimchi) in sterile buffered peptone water.
- Centrifuge to collect bacterial cells.
- Extract genomic DNA using commercial kits (e.g., DNeasy Blood & Tissue Kit) [81].
Specific Detection:
- Use subspecies-specific primers targeting unique genes identified through pangenome analysis.
- For Lacticaseibacillus casei, target the haloacid dehalogenase-like hydrolase gene [83].
- Validate specificity against non-target strains, including closely related subspecies.
ddPCR Quantification:
- Set up 20µL reactions with ddPCR supermix, primers, and template DNA.
- Generate droplets and perform PCR amplification.
- Follow thermal cycling conditions optimized for the target: 95°C for 10 min, 40 cycles of 94°C for 30 sec and 60°C for 60 sec, then 98°C for 10 min [83].
- Analyze using droplet reader and software.
qPCR Comparison:
- Run parallel qPCR reactions with SYBR Green or TaqMan chemistry.
- Use identical DNA templates and primer concentrations.
- Include standard curves from serial dilutions of purified target DNA [81].
Discussion and Technical Considerations
Key Factors Influencing Method Selection
Diagram 2: Method selection guide for low-concentration DNA analysis
The choice between ddPCR and qPCR for microbiome research depends on several technical considerations. ddPCR is particularly advantageous for detecting low-abundance targets (Cq ≥ 29), with studies demonstrating 10-100 fold lower LOD compared to qPCR [78] [82] [51]. This sensitivity is crucial for quantifying minority bacterial populations in complex microbiota. Additionally, ddPCR shows greater resilience to PCR inhibitors present in complex samples like feces, as partitioning dilutes inhibitors across thousands of droplets [51] [79]. The technology also provides absolute quantification without standard curves, eliminating variability associated with standard curve preparation and improving reproducibility between laboratories [80] [83].
Conversely, qPCR maintains advantages in workflow efficiency, cost-effectiveness, and wider dynamic range for high-concentration targets [79]. A 2024 study concluded that qPCR may be preferable for routine quantification of bacterial strains in fecal samples when using optimized, kit-based DNA extraction methods, as it provided comparable sensitivity to ddPCR with faster turnaround time and lower cost [79]. However, for novel assays or those with unknown performance in complex matrices, ddPCR's robustness provides more reliable results.
Applications in Microbiome Research and Drug Development
The enhanced sensitivity of ddPCR offers particular value for specific applications in microbiome research and pharmaceutical development. In probiotic studies, detecting and quantifying specific strains following administration is essential for verifying colonization and metabolic activity [78]. ddPCR's ability to detect low levels of probiotic strains against a background of commensal bacteria makes it ideal for post-intervention monitoring in clinical trials. For infectious disease diagnostics, ddPCR has demonstrated superior sensitivity for detecting low viral loads, as evidenced in SARS-CoV-2 studies where it identified positive cases missed by qPCR [84].
In pharmaceutical development, ddPCR provides precise quantification of microbial contaminants in products requiring strict quality control [85] [83]. The technology's ability to detect low-level contaminants or verify strain identity in probiotic formulations ensures product safety and efficacy. Furthermore, ddPCR enables accurate monitoring of microbial dynamics in response to therapeutic interventions, providing robust data for clinical decision-making and drug development [78] [79].
This head-to-head comparison demonstrates that ddPCR offers significant advantages in sensitivity, precision, and reliability for detecting low-concentration DNA targets in microbiome research. The technology's 10-100 fold lower LOD, resistance to PCR inhibitors, and absolute quantification capability make it particularly valuable for challenging applications including probiotic monitoring, pathogen detection, and therapeutic development. While qPCR remains a robust and cost-effective solution for higher abundance targets, ddPCR represents a superior choice for researchers requiring the utmost sensitivity and accuracy for low-biomass samples. As microbiome research continues to focus on low-abundance but functionally significant community members, ddPCR is poised to play an increasingly important role in advancing our understanding of microbial communities and developing microbial-based therapeutics.
In microbiome research, the accurate detection and quantification of microbial DNA from complex sample matrices is often hampered by the presence of potent PCR inhibitors. These substances, which co-extract with nucleic acids from samples such as stool, blood, and food, can severely compromise the performance of conventional quantitative PCR (qPCR), leading to false-negative results and substantial quantification errors [86] [87]. This technical note examines the superior tolerance of Droplet Digital PCR (ddPCR) to PCR inhibitors compared to qPCR, highlighting the mechanistic advantages of its partitioning technology. We present experimental data and detailed protocols to support researchers in leveraging this capability for obtaining reliable absolute quantification in challenging sample types, with a specific focus on applications in microbiome and clinical diagnostics.
Mechanism of Enhanced Inhibitor Tolerance
The fundamental difference between the two technologies lies in their approach to quantification. qPCR relies on the efficiency of the amplification reaction to determine the initial template concentration from the cycle threshold (Cq), a process highly susceptible to any factor that impairs polymerase activity [51] [87]. In contrast, ddPCR partitions a single PCR reaction into thousands of nanoliter-sized droplets, effectively creating a multitude of independent PCR reactions. Following end-point amplification, droplets are simply scored as positive or negative based on fluorescence, and the absolute concentration of the target DNA is calculated using Poisson statistics [87] [88].
This partitioning confers a significant advantage in the presence of inhibitors. In a qPCR reaction, inhibitors homogeneously affect the entire reaction volume, reducing the effective polymerase activity and delaying the Cq value. This leads to an underestimation of the true template concentration [51]. In ddPCR, inhibitors are also distributed among the droplets. While they may completely inhibit amplification in a subset of droplets, other droplets containing template DNA but no inhibitor molecules will amplify successfully and be counted as positive. As long as the inhibitor does not affect a majority of droplets, the count of positive droplets—and thus the calculated concentration—remains largely accurate [87]. This makes ddPCR quantification more robust and less dependent on reaction efficiency.
Quantitative Data Comparison
The following tables summarize key experimental findings from the literature that directly compare the performance of ddPCR and qPCR in the presence of common inhibitors.
Table 1: Comparative Performance of ddPCR vs. qPCR in Inhibitor Tolerance
| Sample Type/Inhibitor | qPCR Performance | ddPCR Performance | Reference / Application |
|---|---|---|---|
| Blood | Significant inhibition observed; requires extensive DNA purification [86] | High tolerance; enabled direct detection of bloodstream infections from plasma [88] | Clinical diagnostics for febrile patients |
| Plant & Food Matrices (e.g., chocolate, black pepper, corn leaf) | Inhibition leads to false negatives without optimized polymerases [86] | Reliable detection without false negatives; higher sensitivity and precision [87] | Plant pathogen detection [87] & polymerase screening [86] |
| Stool Samples | Susceptible to inhibitors; affects reaction efficiency and quantification [12] | Improved reproducibility and precision due to reduced susceptibility [6] [12] | Gut microbiome quantification |
| Humic Acid (Environmental inhibitor) | High susceptibility, causing quantification errors [86] [87] | Considerably reduced influence; more accurate quantification [87] | Environmental microbiology |
Table 2: Analytical Performance Metrics from Direct Comparisons
| Performance Metric | qPCR | ddPCR | Study Context |
|---|---|---|---|
| Sensitivity (LOD) | Higher limit of detection [81] [87] | 10-100x more sensitive [81] [87] | Detection of Xanthomonas citri & Lactiplantibacillus plantarum |
| Precision (CV) | Higher CV, especially at low concentrations [87] | Lower CV, providing high reproducibility [75] [87] | Copy number quantification in protists [75] and plant pathogens [87] |
| Tolerance to RT Contamination | Cq shift and artifactual data with inconsistent contamination [51] | Minimal impact on absolute concentration; highly reproducible data [51] | Gene expression analysis with low abundant targets |
Experimental Protocols
Protocol 1: Evaluating PCR Inhibitors Using ddPCR and qPCR
This protocol is adapted from studies comparing the detection of pathogens in inhibitory plant and food matrices [86] [87].
1. Reagent Preparation:
- Inhibitor Stocks: Prepare 10% (w/v) extracts of inhibitors (e.g., chocolate, black pepper) in sterile water. Heat at 75°C for 20 min with vigorous mixing, then clarify by centrifugation.
- Target DNA: Use genomic DNA from the target organism (e.g., Xanthomonas citri subsp. citri or Lactiplantibacillus plantarum) at a known concentration.
- PCR Master Mix: Prepare a master mix suitable for both ddPCR and qPCR, containing buffer, dNTPs, and the same primer/probe set for both platforms.
2. Reaction Setup:
- Prepare a dilution series of the target DNA.
- For each dilution, create reaction mixes containing a constant, sub-saturating amount of target DNA and a serial dilution of the inhibitor stock.
- Split each reaction mix into two equal aliquots for parallel ddPCR and qPCR analysis.
3. Instrument Run:
- ddPCR: Generate droplets according to manufacturer instructions (e.g., QX200 Droplet Generator, Bio-Rad). Perform end-point PCR, then read droplets on a droplet reader (e.g., QX200 Droplet Reader).
- qPCR: Run the reactions on a real-time PCR instrument (e.g., CFX Connect, Bio-Rad) using standard cycling conditions.
4. Data Analysis:
- ddPCR: Analyze raw data using the instrument's software (e.g., QuantaSoft). The concentration (copies/μL) is determined directly from the fraction of positive droplets.
- qPCR: Generate a standard curve from the no-inhibitor control reactions. Use this curve to determine the estimated concentration in the inhibitor-containing reactions.
- Comparison: Plot the measured concentration against the inhibitor concentration for both platforms. ddPCR will maintain a near-constant measured concentration across a wider range of inhibitor concentrations, while qPCR will show a significant drop.
Protocol 2: Screening for Inhibitor-Resistant DNA Polymerase Variants
This protocol outlines the live culture PCR (LC-PCR) workflow used to discover novel Taq polymerase variants with enhanced inhibitor resistance [86] [89].
1. Library Creation:
- Create a randomly mutagenized library of the Taq or Klentaq1 gene via error-prone PCR.
- Clone the mutated genes into an expression vector and transform into a bacterial host (e.g., E. coli).
2. Live Culture PCR Screening:
- Plate the transformed library to obtain single colonies. Pick colonies into 96-well plates containing growth medium with inducer (e.g., 1 mM IPTG). Incubate for 12-16 hours for growth and polymerase expression.
- Without any purification step, transfer a small aliquot (e.g., 5 μL) of the live bacterial culture directly into a PCR plate containing a master mix with SYBR Green, a specific primer set (e.g., for 16S rDNA), and a challenging concentration of PCR inhibitor (e.g., 2-3 μL of 10% chocolate extract).
- Run a real-time PCR protocol with an extended initial denaturation (10 min at 94°C) to lyse the cells and release the polymerase.
- Identify positive clones based on early Cq values, which indicate active polymerase in the presence of the inhibitor.
3. Validation and Characterization:
- Purify the selected mutant enzymes from the positive hits.
- Test the purified enzymes side-by-side with wild-type Taq in standard qPCR/ddPCR reactions spiked with various inhibitors (blood, humic acid, plant extracts) to confirm and quantify the enhanced resistance phenotype.
The following workflow diagram illustrates the key steps in this screening protocol:
The Scientist's Toolkit: Research Reagent Solutions
Table 3: Essential Reagents and Kits for ddPCR in Complex Samples
| Item | Function/Description | Example Use Case |
|---|---|---|
| Inhibitor-Resistant Polymerase Variants (e.g., Taq C-66, Klentaq1 H101) | Engineered polymerases with superior resistance to inhibitors from blood, plant, and food samples. | Detection in highly inhibitory samples without extensive DNA cleanup [86]. |
| ddPCR Systems (e.g., Bio-Rad QX200, QIAGEN QIAcuity One) | Platforms for partitioning samples into nanoliter-scale reactions for absolute quantification. | Core instrumentation for all ddPCR applications; choice may depend on throughput needs [75]. |
| Universal 16S rRNA Primers/Probes | Target conserved bacterial gene for absolute quantification of total prokaryotic load. | Quantifying total bacterial abundance in stool samples for microbiome studies [21] [12]. |
| Strain-Specific Primers/Probes | Designed from unique genomic regions to target and quantify specific bacterial strains. | Tracking and quantifying probiotic strains (e.g., L. reuteri) within a complex community [12]. |
| Digital PCR Supermixes | Optimized reaction buffers for ddPCR, often including additives to enhance droplet stability and assay performance. | Standardized reaction setup for robust and reproducible results across applications. |
Application in Microbiome Research
The superior inhibitor tolerance of ddPCR makes it particularly valuable in gut microbiome research. While next-generation sequencing (NGS) provides relative abundance data, its compositional nature can be misleading [21] [12]. ddPCR can be used to measure the absolute abundance of specific bacterial taxa or the total prokaryotic load, providing context for NGS data and revealing true shifts in microbial populations [21].
For instance, a strong correlation has been observed between the total DNA concentration of stool extracts and the absolute number of 16S rRNA gene copies measured by ddPCR [21]. This relationship can even be leveraged to build machine learning models that predict absolute prokaryotic load from readily available sample metrics, offering a cost-effective alternative to running ddPCR on every sample in large-scale studies [21]. Furthermore, for probiotic studies, strain-specific ddPCR (or qPCR) assays offer a much lower limit of detection and a broader dynamic range for tracking specific bacterial strains in fecal samples compared to NGS approaches [12].
The partitioned nature of the ddPCR reaction confers a fundamental advantage over qPCR in resisting the effects of common PCR inhibitors found in complex biological samples. The experimental data and protocols provided herein demonstrate that ddPCR delivers more accurate and reliable absolute quantification in applications ranging from clinical diagnostics to environmental and microbiome analysis. For researchers working with low-concentration DNA targets in difficult matrices, ddPCR represents a robust tool that mitigates a major source of pre-analytical and analytical variation, thereby strengthening the validity of experimental conclusions.
Inflammatory Bowel Disease (IBD), encompassing Crohn's disease (CD) and ulcerative colitis (UC), is a chronic and relapsing inflammatory disorder of the gastrointestinal tract. Globally, over 7 million people are estimated to be living with IBD, with incidence rising rapidly in newly industrialized countries [90]. Current diagnostic standards, including colonoscopy and cross-sectional imaging, are invasive, inconvenient, and lack the specificity to differentiate IBD from other conditions like Irritable Bowel Syndrome (IBS) [91]. There is a pressing clinical need for non-invasive, accurate, and cost-effective diagnostic tools.
This application note details the clinical validation of a novel, microbiome-based diagnostic test for IBD. The test utilizes droplet digital PCR (ddPCR) to quantify specific bacterial biomarkers from fecal samples, demonstrating superior performance for distinguishing CD and UC from controls. The protocol is specifically designed for the robust analysis of low-concentration DNA typical in microbiome samples, making it highly relevant for research and drug development.
Biomarker Discovery and Diagnostic Model Performance
Identification of IBD-Associated Bacterial Species
Comprehensive metagenomic sequencing of 5,979 fecal samples from diverse geographies and ethnicities identified unique microbial signatures associated with IBD [90] [92]. The analysis revealed consistent alterations in the gut microbiome of IBD patients, characterized by an enrichment of pro-inflammatory bacteria and a depletion of species with anti-inflammatory functions.
The table below summarizes the specific bacterial species selected as biomarkers for constructing the diagnostic models.
Table 1: Bacterial Species Biomarkers for IBD Diagnosis
| Disease | Number of Biomarkers | Enriched Species (in IBD) | Depleted Species (in IBD) |
|---|---|---|---|
| Ulcerative Colitis (UC) | 10 | Gemella morbillorum, Blautia hansenii, Actinomyces sp. oral taxon 181, Clostridium spiroforme [90] | Clostridium leptum, Fusicatenibacter saccharivorans, Gemmiger formicilis, Ruminococcus torques, Odoribacter splanchnicus, Bilophila wadsworthia [90] |
| Crohn's Disease (CD) | 9 | Bacteroides fragilis, Escherichia coli, Actinomyces sp. oral taxon 181 [90] | Roseburia inulinivorans, Blautia obeum, Lawsonibacter asaccharolyticus, Roseburia intestinalis, Dorea formicigenerans, Eubacterium sp. CAG: 274 [90] |
Diagnostic Model Performance
Machine learning diagnostic models were constructed using the identified bacterial markers. The models were validated across independent cohorts from eight populations.
Table 2: Performance of Metagenomic and ddPCR-Based Diagnostic Models
| Model Type | Cohort | Area Under the Curve (AUC) | Sensitivity | Specificity |
|---|---|---|---|---|
| Metagenomic Model (UC) | Discovery | 0.95 (95% CI: 0.92–0.98) [90] | - | - |
| Metagenomic Model (UC) | Test Set | 0.90 (95% CI: 0.84–0.96) [90] | 88.06% [90] | 80.95% [90] |
| Metagenomic Model (CD) | Discovery | 0.95 (95% CI: 0.92–0.98) [90] | - | - |
| Metagenomic Model (CD) | Test Set | 0.94 (95% CI: 0.89–0.98) [90] | 88.33% [90] | 89.47% [90] |
| ddPCR-Based Test (IBD) | Validation Cohorts | - | 88% [92] | 89% [92] |
The ddPCR-based test demonstrated numerically higher performance than the commonly used fecal calprotectin test in discriminating UC and CD from controls [90]. This performance is maintained even during the inactive disease phase, offering potential for early diagnosis and subclinical detection [91].
Experimental Protocol: Multiplex ddPCR for IBD Biomarker Quantification
The following protocol describes the steps to develop and run a multiplex ddPCR assay for the quantification of IBD-associated bacterial species from fecal samples. This protocol is optimized for low-concentration, complex microbial DNA [16].
Sample Collection and DNA Extraction
- Sample Collection: Collect fresh fecal samples and store immediately at -80°C. Use consistent collection tubes to minimize pre-analytical variation.
- DNA Extraction: Extract genomic DNA from approximately 100-200 mg of fecal material using a dedicated stool DNA isolation kit on an automated nucleic acid extraction system (e.g., Promega Maxwell RSC) [90] [93]. Elute DNA in 50-60 µL of nuclease-free water.
- DNA Quantification and Quality Control: Assess DNA concentration using a fluorescence-based method (e.g., Qubit). Note that for low-biomass samples, DNA may be insufficient for detection by spectrophotometry, but can still be amplified by ddPCR [16].
Assay Design and Optimization
- Primer and Probe Design: Design hydrolysis probes targeting the specific bacterial species listed in Table 1. Probes should be labeled with different fluorophores (e.g., FAM, HEX/VIC) compatible with the ddPCR system to enable multiplexing.
- Optimization of ddPCR Assay:
- Oligonucleotide Concentration: Test primer concentrations ranging from 500 nM to 950 nM and probe concentrations from 250 nM to 750 nM to maximize signal amplitude and separation [94] [93].
- Annealing Temperature Gradient: Perform a thermal gradient test (e.g., from 52°C to 60°C) to determine the optimal annealing/extension temperature for each multiplex assay [94] [93].
- Objective Performance Evaluation: Use a droplet separation value based on fluorescence signal distance and variation between positive and negative droplet populations to select the best assay parameters [93]. The goal is to minimize "rain" (droplets with intermediate fluorescence).
Droplet Digital PCR Workflow
Figure 1: ddPCR Workflow for IBD Biomarkers. The diagram outlines the key steps in the droplet digital PCR process, from assay setup to absolute quantification of target bacterial DNA.
Assay Setup:
- Prepare a 20-22 µL reaction mix containing:
- 1x ddPCR Supermix for Probes (Bio-Rad)
- Optimized concentrations of primers and hydrolysis probes for the target bacterial species.
- 5 µL of extracted fecal DNA.
- Include negative controls (nuclease-free water) and positive controls (synthetic DNA fragments or DNA from known bacterial cultures) in each run.
- Prepare a 20-22 µL reaction mix containing:
Droplet Generation:
- Load the reaction mixture into a droplet generator cartridge along with droplet generation oil.
- Generate thousands of nanodroplets using a commercial droplet generator (e.g., Bio-Rad QX200 Droplet Generator). Each droplet acts as an individual PCR reactor.
PCR Amplification:
- Transfer the emulsified samples to a 96-well PCR plate.
- Seal the plate and perform PCR amplification in a thermal cycler using the optimized cycling conditions, including the determined optimal annealing temperature.
Droplet Reading and Analysis:
- After amplification, load the plate into a droplet reader (e.g., Bio-Rad QX200 Droplet Reader) which counts the droplets and detects the fluorescence in each channel.
- Analyze the data using associated software (e.g., QuantaSoft). Set thresholds to distinguish positive and negative droplets for each target.
- The software provides an absolute count of target DNA copies per microliter of the original reaction mix, based on the fraction of positive droplets and applying Poisson statistics.
The Scientist's Toolkit: Research Reagent Solutions
Table 3: Essential Materials for ddPCR-based IBD Biomarker Analysis
| Item | Function / Application in the Protocol | Example |
|---|---|---|
| Automated Nucleic Acid Extractor | Standardized extraction of microbial DNA from complex fecal samples. | Promega Maxwell RSC system [93] |
| Stool DNA Extraction Kit | Lysis and purification of DNA from fecal material, removing PCR inhibitors. | Kit specific for stool samples |
| ddPCR System | Partitioning of reactions, amplification, and fluorescent reading of droplets. | Bio-Rad QX200 (Droplet Generator, Thermal Cycler, Droplet Reader) [93] |
| ddPCR Supermix | Optimized master mix for probe-based digital PCR in droplets. | Bio-Rad ddPCR Supermix for Probes [93] |
| Hydrolysis Probes & Primers | Specific detection and amplification of target bacterial species DNA. | Custom synthesized oligonucleotides [93] |
| Droplet Generation Oil & Cartridges | Creation of stable water-in-oil emulsion droplets for partitioning. | DG8 Cartridges and Gaskets (Bio-Rad) [93] |
Correlative Metabolic Pathways in IBD
The dysbiosis in IBD extends beyond taxonomy to functional metabolic pathways. The bacterial biomarkers identified are correlated with significant alterations in gut microbial metabolism.
Figure 2: Functional Metabolic Consequences of IBD Dysbiosis. The diagram illustrates how the shift in microbial community structure in IBD leads to functional metabolic disruptions that contribute to disease pathology.
Pathway analysis reveals:
- Pathways involved in amine and polyamine degradation, and fatty acid and lipid biosynthesis, were significantly enriched in patients with UC or CD [90].
- Pathways for amino acid biosynthesis (e.g., L-arginine, L-ornithine) were significantly decreased in UC, primarily contributed by depleted species like C. leptum and F. saccharivorans [90].
- In CD, there is a notable shift in the contribution to metabolic pathways, characterized by a predominance of E. coli rather than a diversified bacterial profile [90].
The validated ddPCR-based test targeting specific gut bacterial biomarkers represents a robust, non-invasive diagnostic tool for Inflammatory Bowel Disease. Its high sensitivity and specificity, maintained across diverse ethnicities and in patients with inactive disease, underscore its potential for early detection, screening, and differential diagnosis of Crohn's disease and ulcerative colitis. The protocol outlined here provides researchers and drug developers with a detailed framework for implementing this technology, particularly advantageous for the precise quantification of low-abundance microbial DNA in complex samples. Future work will focus on broader prospective validation and exploring the utility of these biomarkers in disease monitoring and predicting treatment response.
Accurate quantification of microbial abundance is a cornerstone of microbiome research, particularly when studying low-biomass environments or tracking specific bacterial strains. While traditional culture-based methods have long been considered the gold standard, they are often time-consuming and limited to culturable organisms [95]. Droplet Digital PCR (ddPCR) has emerged as a powerful tool for absolute nucleic acid quantification, offering high sensitivity and precision without requiring external standards [12] [6]. This application note evaluates the quantitative accuracy of ddPCR by correlating its performance with established culture-based methods and flow cytometry, focusing on applications within microbiome research involving low-concentration DNA samples.
Comparative Performance of Quantitative Methods
The table below summarizes key performance characteristics of ddPCR, culture-based methods, and flow cytometry as identified from recent studies:
Table 1: Comparison of Microbial Quantification Method Performance Characteristics
| Method | Quantification Principle | Sensitivity/LOD | Turnaround Time | Key Advantages | Key Limitations |
|---|---|---|---|---|---|
| Droplet Digital PCR (ddPCR) | Absolute nucleic acid quantification via endpoint PCR and Poisson statistics [12] | ~10(^3) cells/g feces for specific strains [12]; Can detect 10 CFU/mL in blood [95] | ~4 hours for results [95] | High sensitivity and reproducibility; resistant to inhibitors; no standard curve needed [12] [36] | Requires prior knowledge of target; does not distinguish between live/dead cells |
| Culture-Based Methods | Growth of viable microorganisms on/in nutrient media [95] | Varies by organism; limited by viable but non-culturable states | 15-29 hours for positive signal [96] [95] | Gold standard for viability; allows for antibiotic susceptibility testing [95] | Time-consuming; limited to culturable organisms; affected by prior antibiotic use [96] [95] |
| Flow Cytometry (FC) | Single-cell analysis based on optical properties and staining [97] [98] | Single-cell level [99] | Rapid (<1 hour post-sample prep) [99] | Provides cell count and physiological state; high throughput [97] [99] | Difficult taxonomic identification; requires specialized equipment [98] [99] |
| Metagenomic NGS (mNGS) | High-throughput sequencing of all genetic material in a sample [96] [95] | Varies with sequencing depth and biomass | ~16.8 hours [96] | Broad, unbiased pathogen detection [96] [95] | Semi-quantitative (compositional); complex data analysis; higher cost [12] [95] |
Detailed Experimental Protocols
Protocol for Absolute Quantification of Bacterial Strains in Fecal Samples Using ddPCR
This protocol, adapted from a 2024 study, details the steps for sensitive and accurate quantification of specific bacterial strains in complex matrices like fecal samples [12].
- Strain-Specific Primer/Probe Design: Identify unique genomic regions (e.g., single-copy genes) of the target strain using comparative genomics. Design and validate primers and probes for specificity [12].
- Sample Preparation and DNA Extraction: a. Spike fecal samples with known concentrations of the target bacterium (e.g., Limosilactobacillus reuteri) from a culture in the late exponential phase to create a standard curve [12]. b. Isolate DNA using a kit-based method (e.g., QIAamp Fast DNA Stool Mini Kit or Protocol Q). The use of kit-based methods has been shown to provide good sensitivity (Limit of Detection, LOD ~10⁴ cells/g feces) and linearity (R² > 0.98) [12].
- Droplet Digital PCR Setup: a. Prepare the PCR reaction mix containing the DNA template, primer/probe set, and ddPCR supermix. b. Generate droplets using a droplet generator. c. Perform PCR amplification with the following cycling conditions: 95°C for 10 minutes (enzyme activation), followed by 40 cycles of 94°C for 30 seconds (denaturation) and 55-60°C for 60 seconds (annealing/extension), and a final signal stabilization step at 98°C for 10 minutes. A no-template control (NTC) must be included.
- Droplet Reading and Data Analysis: a. Read the plate using a droplet reader. b. Analyze the data using the manufacturer's software. The software automatically applies a threshold to distinguish positive and negative droplets. c. Calculate the absolute concentration of the target gene (copies/μL) using Poisson statistics. This concentration can then be converted to cell equivalents per gram of sample [12].
Protocol for Microbial Community Analysis Using Flow Cytometry
This protocol, synthesized from multiple sources, describes how to generate quantitative community profiles from fecal samples using flow cytometry [98] [100] [99].
- Sample Fixation and Staining: a. Homogenize fecal sample in phosphate-buffered saline (PBS) [100]. b. Fix cells (optional) using formaldehyde stabilization followed by ethanol fixation for long-term storage, or use a simple freezing protocol [99]. c. Stain nucleic acids with a fluorescent dye. Common choices include: - SYBR Green I: Used for quantifying total bacterial load [97] [100]. - DAPI: Provides high-resolution community fingerprints and can resolve differing chromosomal levels [99].
- Flow Cytometric Analysis: a. Run samples on a flow cytometer (e.g., BD Accuri C6, CytoFLEX S) calibrated with validation beads [97]. b. Set acquisition threshold on a fluorescence channel (e.g., FL1 for SYBR Green I) to ignore debris and noise [97]. c. Record multiparametric data (FSC, SSC, and fluorescence parameters) for tens of thousands of events per sample [97] [99].
- Data Processing and Quantitative Profiling: a. Gate for microbial cells based on light scatter and fluorescence properties to distinguish them from background [97]. b. Determine total bacterial cell count per unit volume or mass using a volumetric counting method [97] [100]. c. For community fingerprinting, use computational tools (e.g., Phenoflow) to calculate alpha and beta diversity metrics from the cytometric data [98].
The Scientist's Toolkit: Research Reagent Solutions
Table 2: Essential Reagents and Kits for ddPCR and Flow Cytometry-Based Microbial Quantification
| Item | Function/Application | Specific Examples / Targets |
|---|---|---|
| Strain-Specific Primers/Probes | Enables specific detection and absolute quantification of target bacterial strains in ddPCR. | rpoB gene assays for mock communities [6]; L. reuteri strain-specific assays [12] |
| ddPCR Supermix | Forms the core reaction environment for digital PCR, optimized for droplet generation and stability. | Commercial ddPCR supermix (exact vendor not specified) [12] |
| DNA Extraction Kits | Isolates high-quality metagenomic DNA from complex samples like feces for downstream molecular analysis. | QIAamp Fast DNA Stool Mini Kit (Qiagen); Protocol Q [12] |
| Fluorescent Nucleic Acid Stains | Staining of microbial cells for detection and analysis by flow cytometry. | SYBR Green I [97] [100]; DAPI [99] |
| Viability Dyes (e.g., PMAxx) | Differentiates between intact/live and dead/membrane-compromised cells by inhibiting PCR from free DNA and dead cells. | Propidium Monoazide (PMA) [100] |
| Validation Beads | Daily calibration and quality control of flow cytometer performance, ensuring data consistency. | Spherotech 8-peak beads; CytoFLEX Daily QC Fluorospheres [97] |
Workflow Integration and Data Correlation
The following diagram illustrates the integrated workflow for assessing quantitative accuracy across ddPCR, flow cytometry, and culture-based methods.
Integrated Workflow for Method Correlation
This integrated approach allows for direct comparison and validation. For instance, studies have shown strong correlations between ddPCR and flow cytometry data. In one study, ddPCR demonstrated slightly better reproducibility compared to qPCR for quantifying Limosilactobacillus reuteri in fecal samples [12]. Furthermore, flow cytometry has been shown to reliably capture microbial diversity trends that correlate with 16S rRNA gene sequencing data [98]. When applied to clinical samples, ddPCR has proven to be a rapid and highly sensitive tool, showing a higher positive detection rate (78.7%) compared to traditional culture (59.1%) in patients with neurosurgical central nervous system infections [96], and a significantly higher positive rate (83.3%) compared to blood culture (16.7%) in critically ill patients with suspected bloodstream infections [95].
The integration of ddPCR with established methods like flow cytometry and culture provides a powerful multi-faceted approach for microbial quantification. ddPCR excels in sensitivity and absolute quantification of specific targets, even in low-biomass scenarios, while flow cytometry offers rapid, high-throughput community profiling and total cell counts. Culture remains essential for determining viability and obtaining isolates. The correlation of data from these complementary techniques ensures robust and accurate results, advancing the rigor of microbiome research and its applications in drug development and clinical diagnostics.
Droplet Digital PCR (ddPCR) represents a significant technological advancement in nucleic acid quantification, offering absolute quantification without the need for standard curves. Within microbiome research, particularly for studies involving low concentration DNA samples, this capability is paramount. Accurate absolute quantification is crucial because data based solely on relative abundance from next-generation sequencing (NGS) can be misleading; an apparent increase in a bacterium's relative proportion can result from the actual decline of other community members rather than its true proliferation [101]. While quantitative PCR (qPCR) has been the traditional tool for quantification, ddPCR emerges as a potentially superior method for specific, challenging applications within large-scale studies, thanks to its enhanced precision, sensitivity, and robustness to inhibitors [102] [12] [103]. This application note provides a structured cost-benefit analysis, detailed protocols, and practical guidance to inform method selection for ddPCR in large-scale microbiome research.
Quantitative Comparison of ddPCR and qPCR
The decision to implement ddPCR hinges on a clear understanding of its performance and economic trade-offs compared to qPCR. The following tables summarize key comparative data.
Table 1: Performance Comparison between ddPCR and qPCR for Microbial Detection
| Performance Metric | ddPCR | qPCR | Context and Implications |
|---|---|---|---|
| Quantification Principle | Absolute quantification via Poisson statistics [103] | Relative quantification requiring a standard curve [103] | ddPCR eliminates need for standards, reducing preparation time and potential variability. |
| Sensitivity at Low Targets | Higher sensitivity, especially at low DNA concentrations [104] | Lower sensitivity compared to ddPCR at low target levels [104] | ddPCR is superior for detecting rare targets or in low-biomass samples [15]. |
| Precision and Reproducibility | Slightly better reproducibility [12] | Almost as reproducible as ddPCR [12] | Both techniques offer high reproducibility for reliable data. |
| Dynamic Range | Lower dynamic range [12] | Wider dynamic range [12] | qPCR is more suitable for samples with extremely variable target concentrations. |
| Robustness to PCR Inhibitors | Less sensitive to inhibitors present in complex samples [102] [15] | Susceptible to inhibitors, which can affect quantification [12] | ddPCR performs more reliably with complex samples like feces and wastewater. |
| Diagnostic Accuracy (AUC for Tuberculosis) | 0.97 [103] | 0.94 [103] | ddPCR shows statistically superior discriminant capacity, particularly for extrapulmonary TB. |
Table 2: Cost and Throughput Analysis of ddPCR and Related Methods
| Method | Cost per 96 Samples (USD) | Hands-on Time | Key Cost and Workflow Drivers |
|---|---|---|---|
| DNeasy PowerSoil Kit (Standard) | $552.70 [105] | 3.5 hours [105] | Commercial kit costs and multi-step protocol. |
| Direct PCR (IGEPAL only) | ~$0.004 [105] | Negligible [105] | Eliminates DNA purification, extremely cheap and fast. |
| qPCR | Cheaper and faster than ddPCR [12] | Faster than ddPCR [12] | Lower reagent costs and established, streamlined workflows. |
| ddPCR | Higher consumable cost than qPCR | More time-consuming than qPCR [12] | Cost of specialized consumables (droplet generation cartridges, oils). |
Detailed Experimental Protocols
Protocol 1: ddPCR for 16S rRNA Gene Sequencing from Low-Biomass Samples
This protocol is adapted from a published study that successfully used ddPCR to enable 16S rRNA gene amplicon sequencing from samples with DNA amounts too low for standard protocols [15].
1. First-Step PCR (Amplification)
- Template: Use DNA extracted from your low-biomass sample (e.g., human stool, water, tissue).
- Reaction Setup: Set up a standard 25-50 µL first-step PCR reaction using primers targeting the desired hypervariable region of the 16S rRNA gene (e.g., V1-V2, V3-V4, V7-V9).
- Cycling Conditions: Standard cycling conditions for the selected primers.
- Purification: Clean the resulting amplicons using a magnetic bead-based clean-up system.
2. Second-Step PCR (Barcoding)
- Template: Use the purified product from the first-step PCR.
- Reaction Setup: Set up a second PCR reaction using primers that add Illumina sequencing adapters and sample-specific barcodes.
- Purification: Clean the final barcoded amplicons. Note: For samples with very low initial DNA input (< 5 ng), the product may not be visible on a gel at this stage [15].
3. Droplet Digital PCR (Re-amplification)
- Dilution: Dilute the purified barcoded amplicons. The study used a formula to dilute samples to a theoretical concentration of about one amplicon molecule per droplet [15].
- ddPCR Mix: Prepare a ddPCR reaction mix using plain Illumina P5 and P7 primers.
- Droplet Generation: Generate droplets using a commercial ddPCR system (e.g., Bio-Rad QX200).
- PCR Amplification: Run the PCR in a thermal cycler with standard conditions.
- Droplet Reading: Transfer the PCR plate to a droplet reader to count positive and negative droplets.
4. Library Preparation and Sequencing
- Recovery: Break the droplets and recover the aqueous phase containing the re-amplified DNA.
- Quantification: Measure the DNA concentration using a fluorescence-based method (e.g., Qubit). If the concentration is still too low for sequencing, an optional "emergency" re-amplification step can be performed using a high-fidelity polymerase and P5/P7 primers [15].
- Sequencing: Pool libraries at equimolar concentrations and sequence on an Illumina MiSeq or similar platform.
Protocol 2: Strain-Specific Absolute Quantification in Fecal Samples
This protocol outlines a workflow for designing and applying a strain-specific qPCR or ddPCR assay for the absolute quantification of bacterial strains in human fecal samples, based on a systematic comparison study [12].
1. Strain-Specific Primer Design
- Input: Obtain the complete genome sequence of the target bacterial strain.
- In Silico Analysis: Compare the target genome against a database of related strains to identify unique genomic regions.
- Selection: Choose a unique sequence region that is highly specific to the target strain.
- Design: Design PCR primers (and probes, for hydrolysis probe-based assays) targeting this unique region.
2. DNA Extraction from Fecal Samples
- Sample Preparation: Homogenize fecal samples in phosphate-buffered saline (PBS).
- Cell Lysis: Use a kit-based DNA extraction method that includes a mechanical lysis step (e.g., bead beating) to ensure efficient disruption of both Gram-positive and Gram-negative bacteria. The modified QIAamp Fast DNA Stool Mini Kit protocol was found to be effective [12].
- Purification: Purify DNA according to the kit's manufacturer protocol. Assess DNA purity and concentration spectrophotometrically.
3. Absolute Quantification by qPCR/ddPCR
- qPCR Setup: For qPCR, prepare reactions with the strain-specific primers/probe. Include a standard curve of known copy number (e.g., from a gBlock gene fragment or plasmid containing the target sequence) for absolute quantification.
- ddPCR Setup: For ddPCR, prepare reactions with the same primers/probe. Partition the reaction mix into thousands of droplets. No standard curve is needed.
- Amplification: Run the qPCR/ddPCR following optimized cycling conditions.
- Analysis: For qPCR, calculate the target concentration in the sample by interpolating the Cq values against the standard curve. For ddPCR, use the droplet reader's software to calculate the absolute concentration in copies/μL based on the fraction of positive droplets and Poisson statistics.
Visualization of Workflows and Logical Relationships
This diagram outlines three primary pathways for analyzing microbial communities, highlighting the role of ddPCR in enabling reliable sequencing from low-input samples and providing absolute quantification.
The Scientist's Toolkit: Essential Research Reagent Solutions
Successful implementation of the aforementioned protocols relies on key reagents and materials. The following table details these essential components.
Table 3: Key Research Reagent Solutions for ddPCR in Microbiome Studies
| Reagent/Material | Function | Application Notes |
|---|---|---|
| ChemagicTM Prime Viral DNA/RNA 300 Kit H96 | Nucleic acid extraction and purification from complex samples [106]. | Compatible with bead beating for robust cell lysis. Automated on H96 platform for high-throughput. |
| Nanotrap Microbiome A and B Particles | Magnetic bead-based concentration of diverse pathogens from liquid samples [106]. | Used for automated wastewater concentration; can be adapted for other low-concentration liquid samples. |
| IGEPAL CA-630 | PCR-compatible non-ionic surfactant for cell membrane disruption [105]. | Core component of ultra-low-cost, high-throughput direct PCR methods, bypassing DNA purification. |
| Strain-Specific Primers & Probes | Enable precise detection and quantification of a target bacterial strain amidst a complex community [12]. | Must be designed from unique genomic regions identified through in silico comparative genomics. |
| P5 and P7 Primers | Universal primers for re-amplification of Illumina barcoded libraries [15]. | Critical for the ddPCR-based re-amplification step in low-DNA-input 16S rRNA sequencing workflows. |
| Digital Droplet PCR Oil & Cartridges | Consumables for partitioning PCR reactions into thousands of nanoliter-sized droplets [104]. | Platform-specific consumables that represent a significant recurring cost in ddPCR workflows. |
ddPCR presents a powerful tool for microbiome researchers, particularly when project goals involve the absolute quantification of low-abundance targets in complex samples or the sequencing of low-biomass specimens. Its principal advantages over qPCR—absolute quantification without standard curves, superior sensitivity for rare targets, and resilience to PCR inhibitors—must be weighed against its higher per-sample cost and more limited dynamic range. For large-scale studies, the decision to adopt ddPCR should be project-specific. It is highly recommended for targeting rare microbial members, validating NGS findings with absolute counts, and working with inhibitor-rich samples. A hybrid approach, using qPCR for high-abundance targets and ddPCR for critical low-abundance ones, can be a cost-effective strategy. As reagent costs decrease and automation improves, the integration of ddPCR into large-scale microbiome research is poised to expand, providing deeper and more quantitatively accurate insights into microbial communities.
Conclusion
Droplet Digital PCR represents a paradigm shift in microbiome research, moving beyond relative abundance to enable absolute quantification of low-abundance and critically important microbial targets. By offering unparalleled sensitivity, resistance to inhibitors, and absolute quantification without standard curves, ddPCR fills a critical methodological gap between traditional qPCR and next-generation sequencing. As evidenced by its successful application in clinical trials, environmental surveillance, and diagnostic model development, this technology is poised to accelerate discovery in microbial ecology, personalized medicine, and therapeutic development. Future directions will likely see increased automation, advanced multiplexing capabilities, and deeper integration with machine learning models, further solidifying ddPCR's role as an indispensable tool for unraveling the complex roles of microbes in health and disease.
References
- 1. PCR/qPCR Data Analysis [https://www.sigmaaldrich.com/US/en/technical-documents/technical-article/genomics/qpcr/data-analysis?srsltid=AfmBOooUo-J-LhxvmT7ZCGjnC-KM_XenweRGZtiDUJGaC_cq5erh7cQG]
- 2. Statistical analysis of real-time PCR data - PMC [https://pmc.ncbi.nlm.nih.gov/articles/PMC1395339/]
- 3. Digital PCR outperforms quantitative real-time PCR for the ... [https://pmc.ncbi.nlm.nih.gov/articles/PMC12288185/]
- 4. Three-color crystal digital PCR - PMC [https://pmc.ncbi.nlm.nih.gov/articles/PMC5154636/]
- 5. Crystal Digital PCR™ Enables Precise Quantification of ... [https://www.mdpi.com/2076-2607/13/11/2592]
- 6. Development of reference-based model for improved ... [https://www.sciencedirect.com/science/article/pii/S0963996925007185]
- 7. Developing multiplex ddPCR assays for SARS-CoV-2 ... [https://pmc.ncbi.nlm.nih.gov/articles/PMC7784781/]
- 8. - Digital Throughput PCR Core Facility of the ENS High qPCR [https://qpcr.cnrs.fr/en/digital-pcr/]
- 9. Data analysis method for multiplex digital pcr using color- ... [https://patents.google.com/patent/EP4372100A1/en]
- 10. Digital droplet PCR is an accurate and precise method to ... [https://www.nature.com/articles/s41598-025-20944-4]
- 11. Absolute quantification of prokaryotes in the... | Nature Protocols [https://www.nature.com/articles/s41596-025-01165-5?error=cookies_not_supported&code=b99561c0-aedf-419b-835a-32160fc656cb]
- 12. Highly accurate and sensitive absolute quantification of ... [https://microbiomejournal.biomedcentral.com/articles/10.1186/s40168-024-01881-2]
- 13. Droplet digital PCR versus real-time PCR for quantitative ... [https://www.frontiersin.org/journals/veterinary-science/articles/10.3389/fvets.2025.1704297/full]
- 14. Comparison of next generation sequencing, droplet , and... digital PCR [https://pmc.ncbi.nlm.nih.gov/articles/PMC9058207/]
- 15. allows 16S rRNA gene amplicon sequencing of very small ddPCR ... DNA [https://bmcmicrobiol.biomedcentral.com/articles/10.1186/s12866-021-02391-z]
- 16. allows 16S rRNA gene amplicon sequencing of very small ddPCR ... DNA [https://pubmed.ncbi.nlm.nih.gov/34922460/]
- 17. Comparative Study Between Droplet Digital PCR and Real ... [https://www.mdpi.com/2076-2607/13/11/2426]
- 18. Digital PCR: from early developments to its future application ... [https://pubs.rsc.org/en/content/articlehtml/2025/lc/d5lc00055f]
- 19. A novel Droplet Digital PCR method for assessing ... [https://www.sciencedirect.com/science/article/abs/pii/S0379073825003627]
- 20. Comparing the precision of two digital PCR applications for ... [https://pmc.ncbi.nlm.nih.gov/articles/PMC12297429/]
- 21. Accurate prediction of absolute prokaryotic abundance ... [https://pmc.ncbi.nlm.nih.gov/articles/PMC12146642/]
- 22. Clinical diagnostic performance of droplet digital PCR for ... [https://pmc.ncbi.nlm.nih.gov/articles/PMC11702014/]
- 23. Development and application of a highly sensitive ... [https://www.frontiersin.org/journals/microbiology/articles/10.3389/fmicb.2025.1612740/full]
- 24. A quantitative sequencing framework for absolute ... [https://www.nature.com/articles/s41467-020-16224-6]
- 25. How does ddPCR work? [https://mogene.com/how-does-ddpcr-work/]
- 26. ddpcr: an R package and web application for analysis ... [https://pmc.ncbi.nlm.nih.gov/articles/PMC5031129/]
- 27. Microbial Source Tracking Using Quantitative and Digital ... [https://pmc.ncbi.nlm.nih.gov/articles/PMC6182909/]
- 28. Frontiers | Comparison of microbial culture, metagenomic... [https://www.frontiersin.org/journals/cellular-and-infection-microbiology/articles/10.3389/fcimb.2025.1606283/full]
- 29. Comparative analysis of culture- and ddPCR -based wastewater... [https://pubs.rsc.org/en/content/articlehtml/2025/ew/d4ew00525b]
- 30. Developing PCR-based novel molecular assays to quantitatively detect ... [https://maxapress.com/article/id/64f69911fa6c583128b2517e]
- 31. Leveraging ddPCR for Accurate Quantification of Amplifiable DNA | IDT [https://www.idtdna.com/page/support-and-education/decoded-plus/leveraging-digital-droplet-pcr-ddpcr-for-accurate-quantification-of-amplifiable-dna/]
- 32. Development of a Strain - Specific Real-Time PCR Assay... | PLOS One [https://journals.plos.org/plosone/article?id=10.1371/journal.pone.0090208]
- 33. Development of Strain - Specific PCR Primers for Quantitative... [https://www.jstage.jst.go.jp/article/bpb/37/1/37_b13-00641/_html]
- 34. dPCR Microbial DNA Assays | QIAGEN Detection [https://www.qiagen.com/us/products/discovery-and-translational-research/pcr-qpcr-dpcr/dpcr-assays-kits-and-instruments/dpcr-assays/dpcr-microbial-dna-detection-assays]
- 35. Droplet Digital PCR (ddPCR) for Halal Detection of ... [https://pmc.ncbi.nlm.nih.gov/articles/PMC12543012/]
- 36. A suite of ddPCR assays targeting microbial pathogens for ... [https://pmc.ncbi.nlm.nih.gov/articles/PMC12016556/]
- 37. Optimised human stool sample collection for multi-omic ... [https://www.nature.com/articles/s41598-024-67499-4]
- 38. Overcoming soil matrix interference for reliable ... [https://www.sciencedirect.com/science/article/pii/S2352186425003694]
- 39. Statistical design approach enables optimised mechanical ... [https://www.nature.com/articles/s41598-024-80584-y]
- 40. Comparative evaluation of various DNA extraction methods ... [https://bmcbiotechnol.biomedcentral.com/articles/10.1186/s12896-024-00933-7]
- 41. DNA extraction from complex matrices using magnetic ... [https://www.sciencedirect.com/science/article/abs/pii/S0003267025010256]
- 42. Optimization of DNA extraction methods from pig farm ... [https://pmc.ncbi.nlm.nih.gov/articles/PMC12551764/]
- 43. High-potency multi-strain probiotic formulations for safety ... [https://www.frontiersin.org/journals/nutrition/articles/10.3389/fnut.2025.1696243/full]
- 44. Waterborne pathogens detection technologies - PubMed Central [https://pmc.ncbi.nlm.nih.gov/articles/PMC10708915/]
- 45. Advances in point-of-care and molecular techniques to ... [https://www.nature.com/articles/s41545-024-00368-9]
- 46. Recent developments in waterborne pathogen detection ... [https://link.springer.com/article/10.1007/s10661-025-13644-z]
- 47. 高宿主DNA 残留?ddPCR 轻松定量微生物 [http://www.tinygene.com/qpcr-ddpcr/dna-ddpcr]
- 48. 四种主要黄萎病致病菌微滴数字PCR检测方法的建立及应用 [https://biotech.aiijournal.com/CN/10.13560/j.cnki.biotech.bull.1985.2025-0421]
- 49. Comparison of Quantitative PCR and Droplet Digital PCR ... [https://pmc.ncbi.nlm.nih.gov/articles/PMC4495218/]
- 50. Comparison of Droplet Digital PCR and Quantitative PCR ... [https://journals.plos.org/plosone/article?id=10.1371/journal.pone.0159004]
- 51. Droplet Digital PCR versus qPCR for gene expression ... [https://www.nature.com/articles/s41598-017-02217-x]
- 52. qPCR vs. ddPCR: Which Is Best for You? [https://www.bioradiations.com/qpcr-vs-ddpcr-assays-select-the-best-gene-expression-analysis-method-for-your-application1125/]
- 53. Advancing quantitative PCR with color cycle multiplex ... [https://pmc.ncbi.nlm.nih.gov/articles/PMC11417387/]
- 54. Absolute quantification of prokaryotes in the microbiome by 16S rRNA qPCR or ddPCR | Nature Protocols [https://www.nature.com/articles/s41596-025-01165-5]
- 55. Inhibit inhibition: PCR inhibition and how to prevent it [https://www.bioecho.com/blog/inhibit-inhibition-pcr-inhibition-and-how-to-prevent-it]
- 56. PCR inhibition in qPCR, dPCR and MPS—mechanisms and ... [https://pmc.ncbi.nlm.nih.gov/articles/PMC7072044/]
- 57. Tips for coping with PCR inhibitors [https://www.npdn.org/newsletter/2020/12/article/3]
- 58. Microbiome Sample Preparation - Tips and Tricks [https://www.qiagen.com/us/knowledge-and-support/knowledge-hub/science-matters/microbiome/microbiome-sample-preparation-tips-and-tricks]
- 59. OneStep PCR Inhibitor Removal Kit [https://www.zymoresearch.com/products/onestep-pcr-inhibitor-removal-new-kit?srsltid=AfmBOopNAnsJOFbWMhKNkQgiK7SkIXO3D90sLgVsSRhg-O4C5xpFaSaG]
- 60. Magnetic Immuno-PCR Assay with Inhibitor Removal for ... [https://pmc.ncbi.nlm.nih.gov/articles/PMC88433/]
- 61. Development and validation of an automated and high ... [https://www.frontiersin.org/journals/cellular-and-infection-microbiology/articles/10.3389/fcimb.2025.1529336/full]
- 62. Assessing reliability and accuracy of qPCR, dPCR ... [https://pubmed.ncbi.nlm.nih.gov/40231068/]
- 63. Multiplex droplet digital PCR for the detection and ... [https://www.frontiersin.org/journals/cellular-and-infection-microbiology/articles/10.3389/fcimb.2025.1548492/full]
- 64. Methods to determine limit of detection and ... [https://pmc.ncbi.nlm.nih.gov/articles/PMC5496743/]
- 65. Development and validation of a droplet digital PCR assay ... [https://www.frontiersin.org/journals/plant-science/articles/10.3389/fpls.2025.1573949/full]
- 66. Limit of Quantitation - an overview [https://www.sciencedirect.com/topics/nursing-and-health-professions/limit-of-quantitation]
- 67. Accurate quantification of bacterial abundance in ... [https://pmc.ncbi.nlm.nih.gov/articles/PMC7660251/]
- 68. Optimisation of robust singleplex and multiplex droplet ... [https://www.nature.com/articles/s41598-019-49043-x]
- 69. Development and validation of an automated and high ... [https://pmc.ncbi.nlm.nih.gov/articles/PMC11985766/]
- 70. dPCR: A Technology Review - PMC - PubMed Central [https://pmc.ncbi.nlm.nih.gov/articles/PMC5948698/]
- 71. Fundamentals of digital PCR [https://www.qiagen.com/us/knowledge-and-support/knowledge-hub/bench-guide/pcr/digital-pcr/what-is-digital-pcr]
- 72. ddPCR allows 16S rRNA gene amplicon sequencing of ... [https://pmc.ncbi.nlm.nih.gov/articles/PMC8684222/]
- 73. At Threshold of Detection, False-Positive Droplets a Nuisance in ddPCR | GenomeWeb [https://www.genomeweb.com/pcr/threshold-detection-false-positive-droplets-nuisance-ddpcr]
- 74. dPCR assay development | Digital PCR troubleshooting - Qiagen [https://www.qiagen.com/us/applications/digital-pcr/beginners/dpcr-guide/setup-and-troubleshooting]
- 75. Comparing the precision of two digital PCR applications for ... [https://www.nature.com/articles/s41598-025-13143-8]
- 76. [2501.09218] Interpretable Droplet Digital PCR Assay for ... [https://arxiv.org/abs/2501.09218]
- 77. Digital PCR: from early developments to its future application ... [https://pmc.ncbi.nlm.nih.gov/articles/PMC12278255/]
- 78. Comparison of qRT-PCR and ddPCR for multi-strain ... [https://pmc.ncbi.nlm.nih.gov/articles/PMC12066471/]
- 79. Highly accurate and sensitive absolute quantification of ... [https://pmc.ncbi.nlm.nih.gov/articles/PMC11380787/]
- 80. A Comparison between Droplet Digital and Quantitative PCR ... [https://journals.plos.org/plosone/article?id=10.1371/journal.pone.0110351]
- 81. Comparison of Real-Time PCR and Droplet Digital PCR for ... [https://pmc.ncbi.nlm.nih.gov/articles/PMC9105557/]
- 82. A droplet digital PCR method (ddPCR) for sensitive ... [http://www.sciencedirect.com/science/article/pii/S2772735124000088]
- 83. Droplet digital PCR method for the absolute quantitative ... [https://www.sciencedirect.com/science/article/abs/pii/S0740002023000527]
- 84. Comparison of reverse-transcription qPCR and droplet digital ... [https://pmc.ncbi.nlm.nih.gov/articles/PMC8933867/]
- 85. Droplet digital PCR versus real-time PCR for in-house ... [https://pubmed.ncbi.nlm.nih.gov/37450440/]
- 86. Live culture-based qPCR screening of Taq DNA ... [https://www.frontiersin.org/journals/bioengineering-and-biotechnology/articles/10.3389/fbioe.2025.1624735/full]
- 87. Comparison of Droplet Digital PCR and Quantitative PCR ... [https://pmc.ncbi.nlm.nih.gov/articles/PMC4948846/]
- 88. Plasma cell-free DNA Droplet Digital PCR provides rapid ... [https://www.frontiersin.org/journals/cellular-and-infection-microbiology/articles/10.3389/fcimb.2025.1522426/full]
- 89. Live culture-based qPCR screening of Taq DNA ... [https://pubmed.ncbi.nlm.nih.gov/40948961/]
- 90. Noninvasive, microbiome-based diagnosis of inflammatory ... [https://www.nature.com/articles/s41591-024-03280-4]
- 91. Noninvasive Microbiome Test May Specifically Identify ... [https://mdedge.com/gihepnews/article/272017/ibd-intestinal-disorders/noninvasive-microbiome-test-may-specifically-identify-crohns-and-ulcerative-colitis]
- 92. CU Medicine invents a non-invasive technology for people ... [https://www.med.cuhk.edu.hk/press-releases/cu-medicine-invents-a-non-invasive-technology-for-people-with-uninvestigated-bowel-symptoms]
- 93. Optimization of digital droplet polymerase chain reaction for ... [https://pmc.ncbi.nlm.nih.gov/articles/PMC4827695/]
- 94. Designing and Validation of a Droplet Digital PCR ... [https://pmc.ncbi.nlm.nih.gov/articles/PMC10536565/]
- 95. A Comparison of Blood Pathogen Detection Among ... [https://www.frontiersin.org/journals/microbiology/articles/10.3389/fmicb.2021.641202/full]
- 96. Comparison of microbial culture, metagenomic next ... [https://pmc.ncbi.nlm.nih.gov/articles/PMC12343261/]
- 97. Fast quantification of gut bacterial species in cocultures ... [https://www.nature.com/articles/s43705-022-00123-6]
- 98. Flow cytometry can reliably capture gut microbial ... [https://pmc.ncbi.nlm.nih.gov/articles/PMC9154785/]
- 99. Characterizing Microbiome Dynamics – Flow Cytometry ... [https://pmc.ncbi.nlm.nih.gov/articles/PMC6126456/]
- 100. How to Count Our Microbes? The Effect of Different ... [https://www.frontiersin.org/journals/cellular-and-infection-microbiology/articles/10.3389/fcimb.2020.00403/full]
- 101. Current Applications of Absolute Bacterial Quantification in ... [https://pmc.ncbi.nlm.nih.gov/articles/PMC8467167/]
- 102. Digital PCR as an Emerging Tool for Monitoring of Microbial ... [https://pmc.ncbi.nlm.nih.gov/articles/PMC7037809/]
- 103. Droplet digital PCR vs. quantitative real time ... [https://pmc.ncbi.nlm.nih.gov/articles/PMC10440704/]
- 104. Droplet digital PCR versus real-time PCR for in-house ... [https://journals.plos.org/plosone/article?id=10.1371/journal.pone.0287712]
- 105. A Simple, Cost-Effective, and Automation-Friendly Direct ... [https://pmc.ncbi.nlm.nih.gov/articles/PMC8547444/]
- 106. Sensitivity, throughput, and cost analysis of concentration ... [https://www.medrxiv.org/content/10.1101/2025.05.12.25327458v1.full-text]